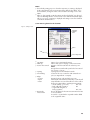
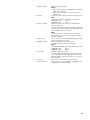
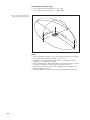
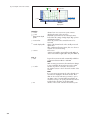
1
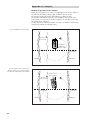
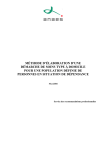
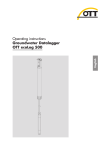
English
Operating instructions
Mobile River Discharge
Measurement System
OTT Qliner 2
We reserve the right to make technical changes and improvements without notice.
Table of contents
1 Scope of supply
6
2 Introduction
2.1 Measurement principle
2.2 Components of the Qliner 2 measurement system
7
8
8
3 Safety information
11
4 Starting up
4.1 Charging the Qliner 2 battery
4.2 Charging the PDA battery
4.3 Making/checking the basic settings for the Qliner PDA software
4.3.1 General basic settings
4.3.2 Basic settings for the Bluetooth connection
4.3.3 Further software options and tools
12
12
14
15
16
18
19
5 Measurement preparations on location
5.1 Preparing Qliner 2 for location
5.1.1 For measurement from the edge
5.1.2 For measurement from a bridge/cableway
5.2 Measurement settings in the Qliner PDA software
5.2.1 Creating new location (Site Name), editing, saving
5.2.2 Entering data for location
5.2.3 Entering data for measurement
5.2.4 Entering notes for measurement situation
5.3 Establishing Bluetooth connection
20
20
20
21
22
22
23
24
26
27
6 Carrying out the measurement
6.1 Testing the measurement
6.2 Starting the measurement
6.3 Following the measurement
6.4 Ending the measurement
6.5 Checking the measurement
6.6 After the measurement
31
35
35
38
42
43
44
7 Measurement quick start
45
8 Processing measurement data
8.1 Saving the data on the PDA
8.2 Saving the data as a text file on the PDA
8.2.1 Content of the text file
8.3 Transferring the data from PDA to PC
8.4 Deleting the data from the PDA
8.5 Processing with OTT Qreview PC software
46
46
46
46
49
49
49
9 Error messages/error correction
9.1 Error correction with the Bluetooth connection
9.2 Error correction during measurement
50
50
51
10 Maintenance
52
11 Repair
52
12 Note about the disposal of old units
53
13 Technical Data
54
14 Order numbers
55
3
4
Appendix A – Compass
56
Appendix B – Installing the Qliner software on the PDA
58
Appendix C – Measurement principle
59
Appendix D – Discharge measurement
61
Appendix E – Declaration of conformity
63
Note
These operating instructions (version 03-1114) describe the:
Qliner operating software for Windows Mobile 6 Classic version 3.40
current profiler firmware 4.31
The software version for the Qliner operating software can be determined via the yellow
question mark in the menu bar in the main window of the PDA (see Chapter 4.3.3).
The software version for the current profiler can be determined via Tools >
Profiler Info in the menu bar in the main window of the PDA (see Chapter 4.3.3).
A description of an update can be found in
“Appendix B – Installing the Qliner software on the PDA” for the Qliner operating software.
5
1 Scope of supply
OTT Qliner 2
6
1 mobile discharge measurement system, consisting of
– Catamaran in glass-fiber reinforced plastic
– Integrated Doppler current profiler with 4 ultrasonic transducers
– PDA with German or English operating system and accessories
– Integrated Bluetooth wireless data unit
– 2 cables on plastic drums (30 m each) and attachment elements (2 V shaped
wires with 2 quickpins each, 2 carabiners)
– 30 m measuring tape
– CD-ROM with Qliner PDA operating software, Qreview processing software,
ActiveSync and operating instructions for Qreview in pdf format
– Lead acid battery, 12 V, 4 Ah, with charging unit
– Operating instructions for PDA, Qliner 2 and Qreview software
– Transport case with accessories
2 Introduction
The OTT Qliner 2 system uses ultrasound to measure the water speed and depth of
rivers and open waterways and in this way measures the discharge. The Qliner 2
does not contain any mechanical moving parts that could be jammed or damaged
during the measurement and can be operated from the edge or from a bridge.
The OTT Qliner 2 system consists of the following components:
OTT Qliner 2 catamaran in glass-fiber reinforced plastic
Integrated Doppler current profiler with 4 ultrasonic transducers
(1 MHz or 2 MHz)
Integrated Bluetooth wireless data unit
PDA (Personal Digital Assistant) with Qliner PDA software
Qreview processing software
Fig. 1: The OTT Qliner 2 system:
Catamaran with integrated Doppler current
profiler and PDA for wireless control of the
measurement and for receiving the
measurement results.
OTT Qliner 2 system
Catamaran
PDA
Integrated
Doppler
current profiler
Underside of the
Qliner 2 catamaran
7
2.1 Measurement principle
The discharge measurement is carried out with the OTT Qliner 2 using the classic
verticals process. With this method, the cross-section of the flow is divided into
numerous verticals having regard for the geometry of the waterway. At each of
these, the OTT Qliner 2 measures the water depth and the vertical velocity distribution. The data obtained are then used in a mathematical process to calculate the
average flow velocity of a vertical and the partial discharge of a discharge segment defined in accordance with EN ISO 748 (mid section method). The complete
discharge is calculated as the sum of all partial discharges after completing the
measurement of all verticals. The position and number of the verticals, size of the
cells to be measured, measurement duration and further parameters are entered
into the operating software of the PDA by the user. The OTT Qliner 2 is positioned
at the vertical to be measured with the help of the cable guides and the measurement started on the PDA. The communication between the PDA and the electronics
of the OTT Qliner 2 is via a wireless Bluetooth radio connection. All measured
data are transmitted in real time via this route, processed on the PDA and stored.
After the end of the measurement, the data can be transferred to a desktop PC
and processed further there using the OTT Qreview software.
Fig. 2: Measurement principle:
Division of a measurement cross-section
into vertical levels with measuring cells.
Vertical
Discharge segment
0
Cells
Flow cross-section
1
2
3
4
2.2 Components of the Qliner 2 measurement system
OTT Qliner 2 catamaran
Catamaran in glass-fiber reinforced plastic:
Dimensions
Weight
957 x 482 x 255 mm (L x W x H)
approx. 11.5 kg (incl. battery)
Inside the Qliner 2 are the following:
Battery
Measurement electronics
8
Fig. 3: Upper side of the Qliner 2 with
battery under the screw closure.
Screw closure
Control panel
Pressure compensation
element
4 Ah lead
acid battery
Foam insert
Hook and loop fastener
Doppler current profiler with 4 ultrasonic transducers
The Doppler current profiler 1 MHz or 2 MHz is integrated on the underside of
the OTT Qliner 2.
Fig. 4: Integrated Doppler current profiler
on the underside of the catamaran.
Integrated Doppler
current profiler
The integrated Doppler current profiler in the Qliner 2 system can be supplied in
two versions:
Version 1:
Version 2:
Transducer frequencies:
1 MHz
2 MHz
Water depth measuring range
20 m
10 m
Minimum cell size
30 cm
10 cm
Minimum blanking range
10 cm
5 cm
Necessary min. water depth
120 cm
35 cm
Note
Take account of the maximum and minimum measuring ranges of your selected
sensor when entering the values in the PDA software!
9
PDA with integrated Bluetooth transceiver
The PDA has an integrated Bluetooth 2.0 module and an antenna for receiving
the data from the Qliner 2.
The German or English operating system and the language version ordered by
you for the Qliner PDA software are pre-installed on delivery.
Notes
Please read the operating instructions supplied before using the PDA.
The display of the Trimble® Nomad® PDA has a protective film that can be
easily changed as required (e.g. with signs of heavy use).
The Bluetooth antenna is retrofitted by OTT and is not standard equipment of
the Trimble® Nomad® PDA.
Fig. 5: Trimble® Nomad® with
Bluetooth antenna.
Bluetooth antenna
PDA
10
3 Safety information
Read these operating instructions before using the Qliner 2 for the first time!
Familiarize yourself completely with the installation and operation of the Qliner 2.
Retain these operating instructions for later reference.
Note all the information on dangers given within the individual work steps.
Only use the Qliner 2 in the way described in these operating instructions.
Ensure the electrical, mechanical and climatic specifications listed in the
technical data are adhered to.
For further information ➝ see Chapter 13, Technical data.
Do not make any changes or modifications to the Qliner 2.
Any changes or modifications will lead to the loss of all rights to warranty
claims.
Make absolutely sure the quickpins have been attached correctly and the cara-
biners closed properly before placing the Qliner 2 into the water!
Make absolutely sure that the opening on the upper side of the Qliner 2 has
been properly closed in order to prevent the entry of water into the unit!
Have a faulty OTT Qliner 2 inspected and repaired by our repair center. On
no account carry out repairs yourself!
For further information ➝ see Chapter 11, Repair.
Dispose of the OTT Qliner 2 properly after taking out of service.
For further information ➝ see Chapter 12, Note on the disposal of old units.
11
4 Starting up
Carry out the following steps before starting the measurement:
Charging batteries:
– Catamaran
– PDA
Making/checking the basic settings for the
Qliner PDA software
– General basic settings:
Configuration > General settings
– Basic settings for the Bluetooth connection:
Configuration > Communication
– Further software options and tools
– Tools
– Exit software
(see Chapter 4.1)
(see Chapter 4.2)
(see Chapter 4.3)
(see Chapter 4.3.1)
(see Chapter 4.3.2)
(see Chapter 4.3.3)
4.1 Charging the catamaran battery
How to charge the batteries
Ensure that the device is switched off before removing the battery.
Open the screw closure on the upper side of the Qliner 2 by rotating counter
clockwise.
Disconnect the cylindrical connector.
Open the hook and loop fastener on the top of the battery.
Remove the battery from the foam insert.
Connect the battery to the charging unit (cylindrical connector).
Plug the charging unit into a socket. (Country specific plug adapters are supplied with the charging unit.) An LED on the charging unit lights yellow during
charging and turns green when the battery is completely charged.
Notes
The sensor and transceiver of the Qliner 2 are provided with power by the battery.
The charging time is dependent on the charging state of the battery.
Approx. 6 hours are sufficient to charge a fully discharged battery.
Make absolutely sure that the batteries are fully charged before beginning the
measurement.
For long measurements, take a charged replacement battery to the station
(replacement battery available as an accessory).
Separate operating instructions are provided for the charging unit.
Fig. 6: Charging the Qliner 2 battery.
Charging unit
4 Ah lead acid battery
Plug adapter
interchangeable
Cylindrical connector
12
Fig. 7: Position of the battery in the
Qliner 2 catamaran.
Screw closure
4 Ah lead
acid battery
Foam insert
Hook and loop fastener
How to replace the battery
Ensure that the device is switched off before removing the battery.
Open the screw closure on the upper side of the Qliner 2. Note the rubber
O-ring inside the screw closure.
Disconnect the battery from the cylindrical connector.
Open the hook and loop fastener on the top of the battery.
Remove the battery from the foam insert.
Insert a new battery and connect the cylindrical connector.
Close the hook and loop fastener on the top of the battery.
Carefully screw on the screw closure on the upper side of the Qliner 2.
Fig. 8: Inserting and removing the
Qliner 2 battery.
Screw closure
Cylindrical
connector
Battery
Hook and loop fastener
13
Suitable battery type
Please only use the original OTT replacement part: lead acid battery, 4 Ah (this
contains a resettable fuse). See Chapter 14.
Battery life
For continuous measurement at maximum performance, the Qliner 2 can be
operated for at least 12 hours.
Check the battery voltage as follows
Establish a Bluetooth connection between Qliner 2 and PDA
(see Chapter 5.3).
Tap on View > Overview in the main window.
Battery: battery voltage of the Qliner 2 (Bluetooth transceiver and sensor).
Notes
The battery can be charged several hundred times. Where a noticeably lower
capacity is noted after charging, it is recommended that the battery is changed
for a new one.
4.2 Charging the PDA battery
How to charge the battery
see PDA operating instructions.
14
4.3 Making/checking the basic settings for the
Qliner PDA software
After starting the software and establishing the Bluetooth connection
(see Chapter 5.3), the main window is displayed on your PDA.
Fig. 9: Main window.
Windows logo
Drop-down menu
Button
Tab
Sub-menu
Message line
Menu point
Menu bar
Screen keyboard
The following settings have to be made in the software before
beginning the measurement
Input general basic settings:
Configuration > General settings
Input basic connection settings:
Configuration > Communication
Further software options and tools
– Tools
– Exit software
(see Chapter 4.3.1)
(see Chapter 4.3.2)
(see Chapter 4.3.3)
15
4.3.1 General basic settings
Tap in the main window on menu point Configuration > General settings.
Note
These parameters are saved even after switching the PDA off and on, and
therefore do not have to be reset for each measurement.
Fig. 10: Configuration >
General Settings.
Save raw data
Save data to
16
Saves profiles every 3 seconds
Notes
Every 3 seconds the Qliner 2 automatically measures a velocity profile. For discharge measurement,
an average from these profiles is used.
The amount of data resulting can require a large
amount of memory with lots of measurements.
Select the location for saving your data
Note
Data saved in the PDA are not lost. An external storage medium can only be attached via USB.
Powerlaw
Units
Frequency (kHz)
Use beam 3
Use compass
describes the mathematical relationship between depth
and the flow velocity at this depth
The Powerlaw curve is used for calculating the average
flow velocity. The value you use for the Powerlaw calculation is dependent on the nature of the bottom:
Powerlaw value:
– rough, large stones and vegetation
4
– some stones and vegetation
5
– gravel, sand, loose earth river bed,
rough rubble work, paved slopes
6
– irregular sand
7
– regular sand, concrete
8
choose between metric (meter and cubic meter) or
USGS (foot and cubic foot) system
Note
After changing the unit of measurement, it is
recommeded that the program is restarted to ensure
that the changes take effect in all calculations and all
display options.
set automatically after the connection is made with the
catamaran
takes beam 3 into account for calculation
Note
The values themselves are constantly displayed.
takes account of the measured deviation of the Qliner 2
to the correct alignment of the verticals to the measurement cross-section in the calculation
If deactivated, the direction of flow is taken as being at
right angles to the cross-section (see Appendix A –
Compass).
Save your entries with OK or discard them with Cancel.
You return automatically to the main window.
17
4.3.2 Basic settings for the Bluetooth connection
Tap in the main window on menu point Configuration > Communication.
Note
These parameters are saved even after switching the PDA off and on, and therefore do not have to be reset for each measurement.
Fig. 11: Configuration > Communication.
Serial port
Baudrate
Timeout
The port to be used by the integrated Bluetooth module
in the Trimble® Nomad® PDA is selected here:
– COM3
Do not change this setting.
describes the modulation rate of a data transmission
Do not change this setting, as the Qliner 2 is set to a
fixed 9600 baud
period of time that the data transmission between
Qliner 2 and PDA may take up before it is aborted
It is recommended that the timeout is set to Long.
Save your entries with OK or discard them with Cancel. You return automatically to the main window.
18
4.3.3 Further software options and tools
Tools
In the menu bar at the lower screen edge there is the menu point Tools
(see Fig. 28). With this you have access to information about the software and
hardware and to additional functions of the Qliner PDA software.
End this
measurement
About QLiner
ActiveX Version
Profiler Info
ends the measurement (see Chapter 6.4)
shows information and the version of your software
shows information and the version of the communication software
shows information and the version of the current profiler
After a measurement, you can also check the charge
state of the battery under this point.
Fig. 12: Tools > Error model.
Error model
overview of the standard deviation
This page gives you the possibility to estimate the
effect that a change in a measurement parameter will
have on the standard deviation by using a simulated
calculation. On opening the page, the values of the
Site Name are entered. The fields with a white background can be changed (see Fig. 12).
Convert file
to text
View last Testreport
Converts the data saved for your Site Name to a text
file (.txt format) for further processing on the PC (see
Chapter 8.2)
calls the data for the test measurement for your current
Site Name (location)
By tapping on the yellow question mark in the menu bar, you can see information
and the version number of your Qliner PDA software.
Close software
The Qliner PDA software remains active in the background even when you call or
use other programs. At any time, you can return to the current measurement via
Windows logo > Start menu > Qliner_V3.
How to close the Qliner PDA software
Tap on File > End in the menu bar.
Confirm the question Exit Qliner program? with OK to close the software.
19
5 Measurement preparations on location
5.1 Preparing the Qliner 2 for measurement
Define the number and position of the verticals on the basis of the geometry of
the flow cross-section.
Use the measuring tape supplied to measure the distance of the verticals from
the reference point on the edge and mark the vertical positions in a suitable
way (e.g. color marking on bridge railings or on the guide cable).
5.1.1 Measuring from the edge
In small waterways, you can position the Qliner 2 in the channel from the edge
with the help of the cables.
Note that access to both edges is necessary.
Required accessories: 2 x V shaped wires with quickpins, 2 x carabiners,
2 x cables (30 m), measuring tape 30 m, possibly pulley (not supplied) for
measurement by one person.
How to set up the station
Attach the two V shaped wires to both long sides of the Qliner 2 with quickpins.
Attach each end of the 30 m cables to both thimbles of the V shaped wires
using the carabiners.
Caution:
Ensure correct closure of the carabiners.
The exact layout can be seen in Fig. 13.
With a small channel and measurement by one person, position the pulley on
the opposite edge and feed one of the cables through it.
With a wide channel, a second person holds the cable on the opposite edge.
Fig. 13: Example of a discharge
measurement from the edge.
Pulley
30 m cable
Carabiner
V shaped wires
low
of f
n
o
i
ect
Dir
20
30 m cable
5.1.2 Measuring from a bridge/cableway
Required accessories: 2 V shaped wires with quickpins, 1 carabiner, 1 cable
(30 m), possibly a weight (not supplied).
How to set up the station
Attach one V shaped wire with quickpins to the two front eyes on the left and
right of the Qliner 2.
Attach the end of the 30 m cable to the thimble of the V shaped wire using a
carabiner.
Caution:
Ensure correct closure of the carabiners.
Depending on the flow or height of the bridge, it may be necessary to attach a
weight to the cable so that the boat remains horizontal (see Fig. 15).
Fig. 14: Example of a discharge
measurement from a bridge.
30 m cable
Direc
tio
V shaped wire
n of f
low
Carabiner
Fig. 15: An additional weight (accessory)
holds the Qliner 2 in the measuring position
Alternatively, an OTT middle piece with
adapter hook (accessory) can be used.
Carabiner
Qliner 2
Weight
V shaped wire
21
5.2 Measurement settings in the Qliner PDA software
First establish a connection between the Qliner 2 and the PDA (see Chapter
5.3) so that the system can compare the values entered with the threshold values of the sensor.
Select one of the three ways for defining a new Site Name (location) and complete the data on the tab pages:
– Creating new Site Name, editing, saving
(see Chapter 5.2.1)
– Enter data on Site Name: Settings > Site
(see Chapter 5.2.2)
– Entering data for measurement: Settings > Profiler
(see Chapter 5.2.3)
– Entering notes for measurement situation:
Settings > Notes
(see Chapter 5.2.4)
5.2.1 Creating new location (Site Name), editing, saving
Create new Site Name
Select Site Name > default in the drop-down menu in the main window.
Tap on tab point Settings, after which the tab page Site appears.
At Site Name enter a name.
Enter the data for your measurement.
Once you have made all the settings on the tab pages Site, Profiler, Notes, tap
at upper right in the display on OK to return to the main window.
Edit existing Site Name
Select the required existing Site Name in the drop-down menu Site Name in
the main window.
Tap on tab point Settings, after which the tab page Site appears.
At Site Name enter a new name and adapt the remaining data to your current
measurement.
Once you have made all the settings on the tab pages Site, Profiler, Notes, tap
at upper right in the display on OK to return to the main window.
Save existing Site Name
Select the required Site Name in the drop-down menu Site Name in the main
window.
Tap on tab point Settings, after which the tab page Site appears.
Tap on the Repeat this measurement button. The system asks whether you want
to accept all data for the set Site Name. A new file is created and a number is
added to the original file name.
22
Notes
If an already existing project is selected at Site name, a warning is displayed
by the system that the new measurements will be added to the old file. If you
do not want this, change the name of the Site Name at Settings > Site > Site
Name.
After you have tapped on OK, the settings are then checked. If your selected
values for Blanking distance or Cell size do not lie within the thresholds applicable to your sensor, a warning is displayed and settings reset to the maximum
or minimum standard values.
5.2.2 Entering data for the location
Fig. 16: Settings > Site.
Manually
editable
field
Button
Tab
Screen keyboard
Site Name
Made by
Position first vertical
Spacing
Line heading
Name of your Site Name (location)
Name of the person carrying out the measurement
Distance of the first vertical to the reference point
Note
Design factors mean that the point for the first vertical
lies at a min. of 23 cm.
Spacing between the individual verticals
Position of the cross-section line with activated compass (see Appendix A – Compass)
Edges
– Position
– Depth
– Factor
Repeat this
measurement
Distance between edge and reference point
Water depth if the channel is limited by a vertical wall
Factor that takes account of the influence of the wall on
the flow (see Appendix D – Discharge measurement):
– smooth walls (e.g. concrete)
0.8 – 0.9
– brick walls with vegetation
0.7
– rough walls with grass or
heavy vegetation
0.6 – 0.5
Reuses all settings for the next measurement and creates
a new Site Name
A new file is created and a sequential number added
to the original file name.
23
Reference
point
0
Position
first vertical
1
2
3
4
5
Bridge
e
Fig. 17: Reference point, position of
first vertical, edges, spacing.
a
b
b
b
b
c
d
a = Position first vertical
b = Spacing
c = First edge
d = Last edge
e = Depth
5.2.3 Entering data for measurement
Fig. 18: Settings > Profiler.
Note
Take account of the maximum and minimum measuring ranges of your selected
sensor when entering the values in the Qliner PDA software!
24
Maximum depth
Cell size
Immersion depth
Measure time
Blanking distance
Nr. of Cells
Tx Power
Sensor frequency
Maximum depth of channel
Notes
Select a larger maximum depth than the maximum
depth of the waterway.
If this value is not known, use the test mode (see
Chapter 6.1).
Choose the cell size based on the necessary accuracy
Note
The minimum cell size is dependent on the sensor:
1,000 kHz sensor
30 cm
2,000 kHz sensor
10 cm
Distance between water surface and middle of the
sensor (see Fig. 45)
This value lies between 0.04 m and 0.06 m depending
on the flow (this is the value when the catamaran is in
a horizontal position in the water).
Note
The sensors must be under the water for the entire
measurement, otherwise the measurements could provide false readings.
Choose 30 to 45 seconds with high discharges and up
to 60 seconds for lower speeds
Choose according to required accuracy
(see Appendix C – Measurement principle)
Note
The minimum blanking range is dependent on the sensor
1,000 kHz sensor
0.2 m
2,000 kHz sensor
0.05 m
Number of cells in a vertical
Is automatically calculated after a change in the cell
size or the maximum depth. This value should not be
higher than 40, as otherwise it gives rise to excessive
processing times.
Transmission power of the ultrasound sensors
Frequency of your sensor (1,000 or 2,000 kHz) set at
Configuration > General Settings
25
5.2.4 Entering notes for measurement situation
Here you can enter comments on the current measurement situation.
Fig. 19: Settings > Notes.
Notes
Enter your own comments via the screen keyboard of
the PDA
Water level.
Upstream:
Downstream:
Control text
Water level at the beginning of measurement
Water level at the end of measurement
Select from the following preset comments in the dropdown menu:
1. “UNSP” undefined (standard)
2. “CLER” no obstructions in the area of the current
profiler
3. “NFLW” no flow at current profiler
4. “SUBM” current profiler submerged
5. “AICE” current profiler fixed by ice
6. “SICE”
edge icy
7. “CICE” current profiler covered with ice
8. “FILL”
water in current profiler
9. “SCUR” current profiler touches bottom
10. “HVDB” current profiler was very dirty
11. “MDDB” current profiler was fairly dirty
12. “LGDB” current profiler was a little dirty
13. “MAHV” current profiler was covered with a
lot of moss/algae
14. “MAMD” current profiler was covered with some
moss/algae
15. “MALT” current profiler was covered with a
little moss/algae
Once you have made all the settings, tap at upper right in the display on OK
to return to the main window.
26
5.3 Establishing Bluetooth connection
Carry out the following steps to establish the Bluetooth connection:
Switch on the Qliner 2 catamaran.
Start the PDA.
Place the Qliner 2 into the water.
Start the Qliner PDA software.
How to switch on the Qliner 2
Press “ON/OFF” on the operating display of the Qliner 2 for 2 seconds.
The green LED Power lights and shows the voltage supply.
The blue Connect LED blinks until the Bluetooth connection between the
Qliner 2 and the PDA has been established. As soon as the connection has
been established, it lights continuously.
Fig. 20: Operating display of the Qliner 2.
ON
OFF
www.ott.com
Power
Connect
Made in Germany
27
How to start the PDA
Press the on button of your PDA.
Fig. 21: Starting PDA.
On button
The Bluetooth connection between the PDA and the Qliner 2 catamaran is
automatically established.
Place Qliner 2 in water
Using the cable, place the Qliner 2 slowly into the water. The front points
towards the flow. See Fig. 13 and 14
28
How to start the Qliner PDA software and establish a connection
Tap on the Windows logo at top left to call Start menu > Programs.
Tap on Qliner_V3 to start the Qliner PDA software.
You are now in the main window.
Tap on Connect.
Notes
With a successful connection, the Connect button has a green background.
If a connection could not be established, the Connect button has a red back-
ground.
On establishing a connection between the PDA and Qliner 2, both systems
compare their time and date settings, and if these differ, you are asked whether
the data on the Qliner 2 should be synchronized with that on the PDA.
It is not possible to connect a different Bluetooth device to the Qliner 2 and no
PDA from other Qliner 2 systems can establish a connection with this system.
Fig. 22: Main window with Connect
button with green background.
29
Transmission/reception range
In the longitudinal axis of the Qliner 2: 50 – 70 m
In the transverse axis of the Qliner 2:
100 – 200 m
Fig. 23: Transmission and reception
range of the Bluetooth radio unit.
m
70
is
50- nal ax
i
d
u
t
gi
Lon
Tra 100
ns -2
v e 00
rse m
ax
is
Notes
When working from a bridge, you must be within the range for receiving and
transmitting wireless data for the Qliner 2 (see Fig. 23).
Interference can result if other Bluetooth devices (e.g. cell phones, wireless
headphones or other PDAs) are nearby.
With a distance between PDA and the Qliner 2 of more than 30 m, an uninter-
rupted line of sight between both components should be ensured.
The connection can also be affected if the charging state of the battery in the
PDA or the Qliner 2 is too low.
Heavy precipitation or fog can reduce the range of the Bluetooth radio unit.
30
6 Carrying out the measurement
Tap on the Windows logo at top left to call Start menu > Programs.
Tap on Qliner_V3 to start the Qliner PDA software.
You are now in the main window.
From here you can start and stop the measurement, follow the measurement
progress and select the various viewing possibilities.
Fig. 24: Main window.
Graphic
Line 1
Line 2
Line 3
Line 4
Line 5
Menu bar
Site Name
Choose an existing or a new Site Name (location) from
the drop-down window (see Chapter 5.2.1)
31
Fig. 25: Graphic of the main window.
Vectors
Position line
Approximate
depth profile
y axis
x axis
Graphic:
x axis:
y axis:
Approximate depth
profile
Position line
Actual depth profile
Vectors
Line 1:
Start
< and >
At:
32
Actual
depth profile
distance from cross-section zero point in meters
depth under water surface in meters
Simplified representation of the waterway bottom,
formed from the settings of Edge depth, Edge position
and Maximum depth
Shows the position of the verticals that are to be
measured
Shape of the bottom based on the actually measured
depth values
After completing all measurements, this curve shows a
complete cross-section bearing.
Flow vectors
– Green: measured flow positive (flow towards Qliner 2)
– Blue: measured flow negative (flow away from Qliner 2)
begins the measurement and automatically establishes
a connection between Qliner 2 and PDA
Note
With a running measurement, the Start button changes
to Stop, with which the measurement can be ended.
Selection of position of vertical to be measured
The number between < and > shows the number of the
vertical.
Note
If you repeat a measurement, the values already measured are not displayed in the main window. These
data can be viewed under menu point File > open >
Site Name > Nr. of verticals. All measured data are
stored here and you can specify which measurement is
included in the calculation by checking Valid.
distance of the current vertical to the reference point
Line 2:
The following lines have different content at different times:
Time
1. Program
starting
2. Connection
established
Field 1
–
Field 2
–
Field 3
OTT
Serial number of
the Profiler
Transducer
frequency in kHz
Qliner
3. During the
measurement
Number of measured values
received
Time of last
received measured value
Qliner
Line 3:
Speed
Heading
Depth
Line 4:
Good cells
average velocity of the water between surface and
bottom
course of the Qliner 2 in degrees related to north
measured water depth
Note
The color of the depth value shows the status of the
depth measurement as follows:
– Blue:
the depth has been successfully measured
by beam 4
– Green: the depth could not be measured by
beam 4, but could be measured by
beams 1 and 2
– Red:
the depth could not be measured. The
last value measured is displayed
number of cells used in the calculation
Line 5:
View
Settings
Test
Connect
Calls the View tab pages
Here you can see the measured data in detail in real
time during a measurement, or the values determined
after a measurement.
Settings for the measurement (Profiler) and the Site
Name (location) and the possibility of comments
begins the test mode and automatically establishes a
connection between Qliner 2 and PDA
PDA establishes a connection with the Qliner 2
Notes
– Connect green background
connection established successfully
– Connect red background
no connection
33
Menu bar
Fig. 26: Menu bar – File.
File
– Open
– Exit
open existing measurements
ends the Qliner PDA software
Fig. 27: Menu bar – Configuration.
Configuration
– General Settings
– Communication
General basic settings
basic settings for communication
Fig. 28: Menu bar – Tools.
Tools
– End this
measurement
– About QLiner
– ActiveX Version
– Profiler Info
– Error model
– Convert file to Text
– View last Testreport
34
ends the measurement
version number of the software
version number of the communication software
information on the current profiler
overview of the standard deviation
export of the data as text file (.txt format)
overview file with the data from the test measurement
6.1 Testing measurement
Basic data about the Site Name (location) can be found with a test
measurement. This makes sense, for example, if you do not know the maximum
depth of the channel. Carry out this test before the actual measurement.
Prepare the measurement as described in Chapters 4 and 5.
Tap on Test and the Qliner 2 starts the test measurement.
Move the Qliner 2 slowly along the measurement cross-section over the channel.
Tap on the Stop button.
An overview file with the most important data from the test measurement is
displayed.
Fig. 29: Overview file of the
test measurement.
Notes
These data can be viewed during the actual measurement via Tools > View last
Testreport.
If the function Save raw data in Configuration > General settings is selected,
these data are saved in RawVerticals.dat (see Chapter 8.1).
6.2 Starting measurement
Prepare the measurement as described in Chapters 4 and 5.
Position the Qliner 2 at the first vertical to be measured.
Ensure that the red position line in the main window of the PDA corresponds
with the position of the Qliner 2 on the measurement cross-section.
Tap on Start. The measurement begins and a blue bar and the message
Measuring in the main window indicates the measurement progress. During
the measurement an acoustic signal indicates the beginning of the measurement, 10 seconds remaining for measurement and the end of the measurement.
The software automatically checks whether the depth has been correctly
measured after completion of the measurement.
35
Notes
In order that beam 4 can determine a value for the depth, ensure that the Qlin-
er 2 sits calmly in the water during the measurement and the sensors are under
the water surface for the whole measurement.
Ensure that the current profiler is not dirty, e.g. by plants.
Ensure that the maximum depth has been set correctly. (Site Name > Settings >
Profiler (see Chapter 5.2.3)). If the actual depth is deeper than the set maximum depth, the measurement fails.
If a value exists for the depth, the tab page Overview of point View is dis-
played with the Accept button shown with a green background and the Discard
button with a red background.
Check the results of the measurement on the various View tab pages. The values of the fields with a white background can be edited manually using the
screen keyboard of the PDA.
Accept the measured values with Accept or reject them with Discard.
Fig. 30: Check of the measurement
data on the View tab pages.
After accepting the data, the program returns to the main window and is ready
to start the next measurement.
The position line moves automatically to the next vertical.
Bring the Qliner 2 to this position and start the next measurement.
Note
If you want to measure a vertical at a different spacing to that preset, you can
enter the position manually at At: in the main window using the screen keyboard
of the PDA.
36
If the sensor is unable to determine a depth, the following window appears:
Fig. 31: Depth could not be determined.
Enter manual depth
Use previous
Use maximum depth
enter the depth manually if known using the screen
keyboard of the PDA
Note
Note that decimal values must be entered separated
by a point – e.g. 1.7
uses the value of the previous depth measurement if
this gave a result
uses the value that you entered at Site Name >
Settings > Profiler in Maximum depth
Note
Ensure that this value is greater than the actual maximum depth. However, you can change the measured
depths while processing with Qreview.
37
6.3 Following measurement
On the View tab pages, you can follow the measured data at any time.
During a measurement, the data are displayed in real time.
After completing a measurement, the data determined over the whole measur-
ing period are displayed.
Fig. 32: View > Overview.
On the Overview tab page the parameters of the current verticals are displayed.
Roll
Angle of the Qliner 2 around its longitudinal axis
Pitch
Angle of the Qliner 2 around its transverse axis
Battery
shows the battery voltage for the sensor and transceiver of the
Qliner 2
Valid
decides whether this measurement is included in the calculation
Fig. 33: View > Discharge.
Discharge
shows the result and the connected values of the discharge calculation from the
verticals already measured.
38
Fig. 34: View > Amplitude.
Amplitude
Due to the damping of ultrasound in water, the amplitude of the received signal
decreases with increasing depth. However, if the signals are reflected by the bottom or other hard material, this is shown as a sudden increase in amplitude. The
position of the bottom is the position of the sudden peak in the amplitude.
Displays the depth measured and the amplitude of the received signal for
beams 1 and 2
Red amplitude:
beam 1
Green amplitude:
beam 2
Blue line:
depth measured by beam 3
Red broken line:
the depth calculated from beams 1 and 2
Fig. 35: View > Velocity.
Velocity
Shows the measured velocities of the water over the whole depth
– Red line:
– Blue line:
– Green line:
velocity of water measured by beams 1 and 2
velocity of water measured by beam 3
Powerlaw curve
39
Note
You can change the scaling of the horizontal axis Velocity on the graphic.
By tapping on the screen, the scaling window is displayed. Tap on X2 or /2 to
double or halve the x axis scaling each time. To reset this scaling, tap on R.
Fig. 36: View > Vx depth.
Vx-Depth
Two graphics are shown on this page:
Speed
– Blue vectors
show the average velocity and the direction of the
measured flow for each vertical. With the compass
deactivated, the vectors point vertically upwards.
Depth
shows the measured depth profile
40
Fig. 37: View > List Vx.
List Vx
shows the number of individual cells for the current vertical with the
respective depths and the velocity measured there
– Nr. 1
number of the vertical
– Nr.
number of cells
– Depth
depth of cells in m
– Vx
flow velocity in m/s
Fig. 38: View > List.
List
shows the measurement
– Nr. 3
– Nr.
– V1, V2 and V3
– A1, A2 and A3
in the form of numerical data
number of the vertical
number of cells
velocities in m/s measured by each individual
beam and per cell
amplitudes of the reflected signals
41
6.4 Ending measurement
Once all verticals have been measured and the measured values accepted with
Accept in each case, the software can now automatically calculate the discharge on the basis of the data present.
To end the measurement, select the sub menu End this measurement from menu
point Tools. The page View > Discharge, with a yellow background, shows the
result for the discharge.
Fig. 39: View > Discharge after
completing the measurement.
Check the entries.
If the values are correct and you wish to complete the measurement, tap on the
End button.
➝ The measurement is complete and all connected data saved.
➝ The program shows the main window, the Site Name: default and is ready
for a new measurement.
If you wish to continue the measurement, tap on Continue.
➝ The program returns to the main window and to the current measurement.
➝ The position line moves to the next vertical or is at the end of the measurement cross-section.
42
6.5 Checking the measurement
All measurements saved on the PDA can be checked with the Qliner PDA software, the individual verticals checked and if necessary the measurement results
edited.
Note
All pages have a green background in the checking windows.
How to check your measurement
Tap on File > Open in the menu bar.
Select the storage location.
Select Site Name.
Confirm with OK.
– A message box shows you the number of measured and saved verticals.
Confirm with OK and the display switches to the View > Overview page.
Tap the window on List Vx or List on the screen and a window opens with
< > arrows. Change between the individual measured verticals using these.
Close this window with x to check the other tab pages for the selected vertical.
The fields with a white background can be edited.
Changes in the data are effective as soon as you tap on Apply changes.
Fig. 40: Checking the measurement.
Notes
The verticals are displayed in the order in which they were measured.
If multiple measurements exist for a vertical, these are displayed with the
same Vertical nr.
Each individual vertical measurement can be excluded from the discharge
calculation by deactivating the Valid box.
The program numbers the verticals starting with 0.
43
6.6 After the measurement
Take the Qliner 2 out of the water.
Switch off the Qliner 2:
– Press “ON/OFF” on the operating display on the upper side of the Qliner 2
for 5 seconds.
– The LEDs Power and Connect go out.
Notes:
Clean the Qliner 2 catamaran and the integrated current profiler with clean
water.
Ensure that the Qliner 2 is never packed in a wet or damp state.
44
7 Measurement quick start
Preparation
Charge batteries:
– Qliner 2 (take battery out of Qliner 2, connect battery to the charging unit).
– Charge the PDA.
Fix cables to Qliner 2:
– Measuring from the edge: 2 V shaped wires with quickpins on the side and a 30 m cable on each side.
– Measuring from bridge/cable way: V shaped wire with quickpins on both front eyes and one 30 m cable.
Specify verticals and mark on cables or bridge.
Switch on the Qliner 2: press “ON/OFF” for 2 seconds.
Switch on the PDA.
Start Qliner software (Windows logo >Start menu > Qliner_V3).
Measurement
Place the Qliner 2 into the water.
Establish connection: tap on Connect.
Check the basic settings (Configuration).
Generate a new Site Name (location) as follows
(Site Name > default or select existing Site Name)
and make basic settings for Site Name and measurement (Settings).
– new Site Name: Site Name: default > Settings > Site Name:
Enter new name > Make settings > OK (upper right) >
confirm again with OK.
– accept Site Name: Site Name: select existing Site Name > Settings >
– Site Name: enter new name > make settings > OK (upper right) >
confirm again with OK.
– Site Name: keep name > make settings > Repeat this measurement >
confirm again with OK
(system adds a sequential number to the existing name).
Position the Qliner 2 at the first vertical to be measured.
(Ensure that the red position line in the main window of the software
corresponds to the position of the Qliner 2.
Center axis of Qliner 2 = position line in main window).
Tap on Start: The measurement begins.
Accept the measurement data with Accept
(or tap on Discard: in this case, repeat the measurement with Start).
Move the Qliner 2 to the next vertical.
Repeat the last 3 steps until the last vertical has been measured.
(start measurement, accept measurement data, move Qliner 2).
In the menu bar select Tools > End this measurement.
The page View > Discharge is displayed with a yellow background.
Check values.
If the values are correct, end the measurement with End.
Further processing
Save the data as a text file (.txt format) via Tools > Convert file to Text.
Copy to PC with ActiveSync.
Continue processing text file with a text editor or spreadsheet program.
Processing with Qreview
See Qreview instructions.
45
8 Processing measurement data
8.1 Saving the data on the PDA
All data for your measurements on your PDA are saved in folder QlinerData.
The location of this folder is entered in Configuration > General settings (see
Chapter 4.3.1). This folder can be called as follows
Tap at upper left on the Windows logo, and then on File Explorer.
In the QlinerData folder, 2 files are generated per Site Name: (Site Name stands
for the name entered by you in Site Name)
Site Name.CFG
Folder Site Name
– Verticals.DAT
– RawVerticals.DAT
– Site Name.txt
settings of your Site Name
measurement data
processed, averaged data
individual measurement results, if selected at Configuration > General settings (see Chapter 4.3.1)
text file (.txt format) of the measurement data, if selected
at Tools > Convert file to Text (see Chapter 4.3.3)
8.2 Saving the data as a text file on the PDA
You can convert the data saved for your Site Name to a text file (.txt format) for
further processing on the PC. This file can be displayed with a standard text editor
or imported into a spreadsheet.
How to create a text file
Tap on Tools > Convert file to Text in the menu bar.
Select the location.
Select the Site Name.
Confirm twice with OK.
The text file (.txt format) is now saved in folder Site Name on the PDA.
Copy the file to your PC as described in Chapter 8.3.
8.2.1 Content of the text file
Fig. 41: First part of the text file with the
general settings for the measurement.
The first part of the file contains the general settings for the measurement.
46
Fig. 42: The second part of the text
file with the overview Summary
about the complete measurement.
The second part contains an overview (summary) about the complete measurement sorted by vertical.
Position
Vertical
distance of the verticals from the reference point
number of the verticals sorted by their position on
the measurement cross-section
mean velocity in this vertical
depth at this position
discharge calculated for this section
discharge calculated for the section between the
waterway edges and the adjacent verticals
complete discharge and its standard deviation
Mean Vel.
Depth
Q
Edge Q
Total Q
Fig. 43: Text file section Details.
The Details section contains all data recorded for each individual vertical.
Time(s)
[s]
NrCells
GoodCells
Battery
Heading
[V]
[º]
STDHeading
Depth
[m]
STDDepth
SoundSpd.
Temp.
Roll, Pitch
[m/s]
[ºC]
[º]
STDRoll, STDPitch
CellSize
STDMeanV
time in seconds from the beginning of the
measurement
number of cells measured in this vertical
number of cells used in the calculation
battery voltage in Qliner 2
heading of the Qliner 2
If this value is 0, the compass has not been activated.
standard deviation of heading
actual water depth (measured depth + immersion
depth)
standard deviation of the depth measurement
velocity of the sound waves in the water
temperature of the water
roll and pitch of the Qliner 2, averaged over the
complete measurement duration
standard deviation of roll and pitch
actual size of the measuring cells
standard deviation of the average velocity
47
Fig. 44: Text file with the velocities
of the individual verticals.
The last part of the file contains velocities and signal strengths actually measured
in each vertical.
Vx-_1..
Vx velocity of the water calculated from beams 1 and 2
– Vx positive
flow towards Qliner 2
– Vx negative
flow away from Qliner 2
– 01...
cell where measurement was
made
SS1-_1..
S
signal strength
– S1
beam 1
– S2
beam 2
– S3
beam 3
– 01...
cell where measurement was
made
Vx3-_1..
Vx3 velocity measured by beam 3
– 01...
cell where measurement was
made
right column
– Depth
distance from center point of the cell to the water surface
– MeanV
average velocity
– STD
standard deviation
Fig. 45: Beams from the Qliner 2.
Waterline
Immersion depth
20 o
Sound pulse 3
25 o
Sound pulse 2
25 o
Sound pulse 1
Sound pulse 4
Beams 1 and 2 calculate the velocity and are used as an alternative to the depth
measurement.
Beam 3 measures the velocity in the area near the surface (one-dimensional).
Beam 4 measures the depth.
48
8.3 Transferring the data from PDA to PC
Hardware requirements: current standard PC with USB interface
Software requirements: PC operating system: Microsoft Windows XP or Microsoft
Windows Vista, ActiveSync (on the CD-ROM supplied)
PDA operating system: Windows Mobile 6 Classic.
Make sure that ActiveSync is installed on your PC.
Open ActiveSync on your PC.
Connect PDA and PC with a USB cable.
Switch on the PDA.
ActiveSync now displays an active connection between PDA and PC.
Click in ActiveSync on Browse.
Select the location of the QlinerData folder, as specified in Configuration >
General settings.
Now copy the measurement data to your PC using ActiveSync. Either select the
whole folder QlinerData or only a certain measurement, i.e. the file Site
Name.CFG and the connected folder Site Name (Site Name stands for the
name entered in Site Name).
Note
Please note that the files Verticals.DAT and RawVerticals.DAT for the various measurements have the same name in each location in the appropriate folder Site Name.
8.4 Deleting the data from the PDA
As described above, establish a connection between your PDA and PC with
ActiveSync.
Click in ActiveSync on Browse.
Select the location of the QlinerData folder, as specified in Configuration >
General settings.
Now delete the copied and not required data in the ActiveSync window.
8.5 Processing with OTT Qreview
Extensive further and post-processing of all data collected by the Qliner 2 is possible with the OTT Qreview Software, which is supplied with the product.
Please read the operating instructions for the Qreview software.
49
9 Error messages/error correction
Signal tones
– start of a measurement
– 10 seconds remaining for a measurement
– end of a measurement
Warnings
Connection failed
Failed measurement
First depth measurement failed
No data reception > 4 seconds
Connect button with red background
warning tone, yellow background
red background
warning tone, red background
9.1 Error correction with the Bluetooth connection
Bluetooth connection not established
The Bluetooth transceiver only establishes the connection with a previously
defined Qliner 2. Therefore, you cannot exchange the transceivers of different
systems.
Problems can result if other Bluetooth devices (e.g. cell phones, wireless headphones or other PDAs) are nearby.
With a distance between PDA and the Qliner 2 of more than 30 m, a direct
line of sight between both components should be ensured.
The connection can also be affected if the charging state of the battery in the
PDA or the Qliner 2 is too low.
An attempt to establish a connection fails immediately
The serial port does not react, because:
it is in use by another program:
close this program.
it has not been activated since a system crash:
carry out a reset of the PDA.
(hold Power / ON button pressed for 10 sec.)
The Bluetooth connection is broken
check the settings for the timeout at Configuration > Communication and
increase this setting from Short to Medium or Long.
It is recommended that the timeout is set to Long.
You can specify the number of minutes after which the PDA activates the Sleep
mode in order to save battery power.
If this value is too low (e.g. 1 to 2 minutes), it is possible that while moving the
Qliner 2 the PDA goes into sleep mode and as a result the connection to the
Qliner 2 is broken.
Set the time for activating the sleep mode of the PDA higher. For instructions
on this, read the operating instructions of the PDA.
50
9.2 Error correction during measurement
No data for water depth
Ensure that the Qliner 2 is lying as calmly as possible in the water.
Ensure that the maximum depth has been set correctly. If the actual depth is
deeper than the set maximum depth, the measurement fails.
Irregular velocity data
The values for the velocity suddenly drop ➝ integrated sensor is affected by
water plants or similar:
Clean the Current profiler.
Note
The sensors must be under the water for the entire measurement, otherwise the
measurements could provide false readings.
51
10 Maintenance
The OTT Qliner 2 is generally maintenance free. No setting or calibration work is
necessary. There are likewise no parts that need replacing regularly.
After the measurement, switch off the Qliner 2 by pressing (5 seconds)
“ON/OFF” on the operating display.
Clean the Qliner 2 catamaran and the integrated current profiler with clean
water after every measurement.
Ensure that the Qliner 2 is never packed in a wet or damp state.
11 Repair
With a problem with the device, use Chapter 9, Error messages/error correction to see if you can resolve the problem yourself.
In the case of device defects, please contact the repair center of OTT:
OTT Hydromet GmbH
Repaircenter
Ludwigstrasse 16
87437 Kempten · Germany
Telephone +49 831 5617-433
Fax
+49 831 5617-439
[email protected]
Warning: Only have a defective OTT Qliner 2 checked and repaired by the OTT
repair center. Never make any repairs yourself under any circumstances. Any repairs or attempted repairs carried out by the customer
will result in the loss of any guarantee rights.
52
12 Note about the disposal of old units
Within the member countries of the European Union
In accordance with the European Union guideline 2002/96/EC, OTT takes back
old devices within the member countries of the European Union and disposes of
them in an appropriate way. The devices concerned by this are marked with the
symbol shown aside.
For further information on the return procedure, please contact your local sales
contact. You will find the addresses of all sales partners in the internet on
"www.ott.com". Please take into consideration also the national implementation
of the EU guideline 2002/96/EC of your country.
For all other countries
Dispose of the OTT Qliner 2 properly after taking out of service.
Observe the regulations valid in your country for the disposal of electronic
devices.
Never put the OTT Qliner 2 into the normal household waste.
Materials used
See Chapter 13, Technical data
53
13 Technical data
Measuring the flow velocity
Transducer frequency
Maximum range (water depth) 1)
Size of the measuring cell
Blanking (minimum)
Required water depth (minimum)
Number of measuring cells (maximum)
Measuring range
Standard
Maximum
Accuracy
Maximum measuring frequency
Temperature sensor
Measuring range
Accuracy/resolution
Qliner PDA software
Mobile device
Functions
Qreview software for PC
Radio connection
Frequency
Type
Range
2)
Pocket PC
Type
Protection class
Battery
Type
Voltage/capacity
Operating time
Catamaran hull
Material
Dimensions (L x W x H)
Weight
Environmental conditions for use
Water temperature
Operating temperature Qliner 2 system
Storage temperature Qliner 2 system
Shock and vibration resistance:
Protection class
Catamaran
Screw closure
54
1)
Dependent on waterway characteristics
2)
Operating system Microsoft Windows
1.0 MHz
20 m
0.3 – 4 m
0.2 m
1.20 m
40
2.0 MHz
10 m
0.1 – 2 m
0.05 m
0.35 m
±5 m/s
±10 m/s
±1 % of the measured value ±0.5 cm/s
1 Hz
–4 … +40 °C
0.1 °C/0.01 °C
Windows Mobile
Planning measurement, data transmission, data conversion in ASCII format,
online measurement operation and
data visualization
data processing, saving, export
2.4 GHz
Bluetooth Class 1
in the longitudinal axis of the Qliner 2:
50 – 70 m
in the transverse axis of the Qliner 2:
100 – 200 m
Trimble® Nomad® with retrofitted
Bluetooth antenna
IP 65
lead acid battery, 4 Ah
12 VDC
typically 1 day use in the field
glass fiber
957 mm x 482 mm x 255 mm
approx. 11.5 kg (including battery)
0 °C … +40 °C
–10 °C … +60 °C
–20 °C … +70 °C
DIN ISO 2206/DIN ISO 2248
IP 68 (submersion depth max. 25 cm,
submersion duration continuous)
IP 67
14 Order numbers
OTT Qliner2 – mobile discharge measurement system
22.405.001.2.0
– with Trimble® Nomad® PDA
– Version R-1 with integrated Doppler current profiler
transducer frequency 1 MHz
– Version R-2 with integrated Doppler current profiler
transducer frequency 2 MHz
Accessories
Spare parts
Battery Powerfit with cable
for Qliner 2 with integrated 3 A fuse
22.405.011.9.2
Replacement battery 5200 mAh 3.8 V
for Trimble® Nomad® PDA
97.820.018.9.5
Deluxe carrying bag with belt
for Trimble® Nomad® PDA
99.960.005.9.5
Hand loop
for Trimble® Nomad® PDA
99.960.006.9.5
Stylus
for Trimble® Nomad® PDA
99.960.007.9.5
USB cable
type A to Mini B 1.8 m
97.120.388.9.5
Braided cord Ø 4 mm length 30 m
99.000.056.9.5
Spring hook 55 x 30 x 6 mm
99.000.103.9.5
Plastic drum
99.320.001.9.5
Glass fiber measuring tape
99.960.004.9.5
Weight
2 x 600 g
22.405.013.4.2
Hook for OTT middle piece
22.405.010.9.2
Charging unit
for Qliner 2 battery
97.850.031.9.5
Screw closure
for Qliner 2 catamaran
22.405.416.9.5
PDA Trimble® Nomad®
incl. Bluetooth module and antenna
22.405.012.9.2
AC adapter 100 - 240 V European
for Trimble® Nomad® PDA
97.850.032.9.5
2.4 GHz 78 mm antenna
for Trimble® Nomad® PDA
upon request
Transport case
with insert
22.405.411.9.5
55
Appendix A – Compass
Method of operation of the compass
Ideally, the measurement cross-section is at right angles to the direction of flow of
the waterway. The Qliner 2 always aligns itself in the direction of flow.
The compass provides the position of the Qliner 2 in relation to north.
The deviation of the Qliner 2 from the correct alignment of the verticals to the
measurement cross-section due to the flow conditions can be taken account of by
the software in the calculation.
For this, the position of the measurement cross-section in relation to north must be
entered in the software (see Chapter 5.2.2).
Fig. 46: Idealized measuring situation.
Direction of
flow of water
N
Alignment
of Qliner 2 in
direction of flow
Measurement
cross-section
Line heading
Left edge
Right edge
Fig. 47: Deviations due to the flow conditions are taken account of in the calculation when the compass has been activated.
Deviation due to
flow conditions
Direction of
flow of water
Line heading
Left edge
56
N
Measurement
cross-section
Right edge
How to specify the position of the measurement cross-section
Start the Qliner 2 as described in Chapters 4 and 5.
Position the Qliner 2 at a point in the waterway where the flow is calm and
appears to run at right angles to the measurement cross-section.
Start the test mode (see Chapter 6.1).
In the main window, read the number Heading.
The value for the position of the measurement cross-section (Line heading) is
calculated as follows:
CC = heading of the Qliner 2
CC < 270º ➝
line heading = CC + 90°
CC > 270º ➝
line heading = CC – 270°
Activate the compass (Configuration > General settings > Use compass).
Enter the value calculated: Settings > Site name > Line heading.
57
Appendix B – Installing the Qliner software on the PDA
Hardware requirements: current standard PC with USB interface
Software requirements: PC operating system: Microsoft Windows XP or Microsoft
Windows Vista, ActiveSync (on the CD-ROM supplied), Qliner CD-ROM
PDA operating system: Windows Mobile 6 Classic
Please note the Read me file for the software.
Put the Qliner CD-ROM in your PC.
Make sure that ActiveSync is installed on your PC.
Open ActiveSync on your PC.
Connect the PDA and PC with the USB cable.
Switch on the PDA.
PC:
ActiveSync now displays an active connection between PDA and PC.
Click in ActiveSync on Browse.
Create a folder in ActiveSync for your Qliner PDA software,
e.g. in My Device > Program Files.
Copy the file xx_Qliner.CAB from your PC to this directory
(xx indicates the language: NL – Dutch (Flemish), ES - Spanish, EN - English,
FR - French, DE - German)
PDA:
Click on the Windows logo at upper left and then in the Start menu on File
Explorer.
Go to your newly created folder, e.g. in My Device > Program Files.
The program now installs automatically after tapping on the xx_Qliner.CAB file.
After installation, the Qliner PDA software is ready for use in the Start menu
under Programs.
Note
Available updates can be found at www.ott.com in the myOTT area.
Fig. 48: ActiveSync on the PC.
58
Appendix C – Measurement principle
The Doppler effect
Acoustic Doppler current meters use a simple physical measuring principle – the
Doppler effect. This describes the change in wavelength of a sound or electromagnetic wave in the case where the source and receiver of the waves are moving
relative to each other. Everybody can observe this phenomenon themselves with a
passing emergency vehicle using its siren. While the vehicle is approaching, the
sound perceived is higher. While it is moving away, it becomes deeper. The
change in frequency is proportional to the speed of the vehicle.
Fig. 49: Doppler effect – change in the
wavelength when source and receiver
are moving relative to each other.
Sound source
Sound wave
Velocity measurement using the Doppler principle with the
OTT Qliner 2
The OTT Qliner 2 uses the Doppler effect to measure the vertical velocity profile
(flow velocity of individual measuring cells lying under each other) of the verticals.
The sound pulses transmitted by the ultrasonic transducers of the sensor are
reflected by moving particles in the water (e.g. plankton, air bubbles, etc.). On the
assumption that the particles are moving with the same velocity as the flow in
which they are found, the flow velocity can be calculated using the measured
frequency shift.
Due to the irregular shape of the particles, generally only a small part of the ultrasound energy is reflected back to the transmitter. The remaining energy is scattered or absorbed. Reflection, absorption and scattering are a continuous process
prevailing in the whole water column. This means that the signal becomes weaker
and weaker while spreading through the water. At a particular point, the reflected
energy is no longer sufficient to return to the transducer. The range of use of the
Doppler sensor is thus subject to natural limits. These are defined above all by the
transducer frequency and the amount of suspended matter.
59
Fig. 50: Transmission and reception
of beams by the sensor.
1 Sensor transmits
sound pulse
3
Scattered
sound pulse
Sensor receives
sound pulse
2 Particles
1. The sensor transmits a sound pulse
2. The particles reflect the sound pulse
3. The sensor receives the reflection and measures the frequency of the reflected pulse
The sensor of the OTT Qliner 2 works with 1 MHz or 2 MHz transducers, depending on
configuration. After transmitting the ultrasound pulse, the sensor switches to receive and
begins the evaluation of the returning echo signals. While the sound spreads through the
water, each level creates its own echos. In the end, the signal reflections from all depths
return together as a signal mixture to the transducer. In order to be able to allocate the
individual reflections spatially, the sensor works with so-called time slots. Assuming a
constant speed of spread of the sound in the water, the time required for an echo from a
given distance to be reflected from particle to transducer can be calculated in advance.
With this method it is possible to allocate incoming signal echos to fixed areas (measuring cells).
The time necessary for transducer vibrations to die away between transmission and
reception processes means that there is a minimum range within which the signals cannot be evaluated. This is known as blanking (distance of transducer to start of the first
measuring cell). Its size is dependent on the transducer frequency.
60
Appendix D – Discharge measurement
General
Discharge is defined here as the water volume from a drainage area that flows
through the discharge cross-section in the time unit. It is normally given in m3/s
or l/s and is the product of the average cross-section velocity and the discharge
cross-section flowed through.
OTT Qliner 2 discharge measurement
The discharge measurement is carried out with the OTT Qliner 2 using the classic
verticals process. With this method, the cross-section of the discharge is divided
into numerous verticals having regard for the geometry of the waterway. The
number and position of the verticals are specified by the user before beginning
the measurement taking account of the cross-sectional geometry.
At each vertical, the OTT Qliner 2 automatically records the water depth and,
dependent on this, the flow velocity in one or more measuring cells lying under
each other (profiling). All data obtained are then used in a mathematical process
to calculate the average flow velocity of the vertical and the partial discharge of a
discharge segment defined in accordance with EN ISO 748 (mid section method).
The discharge is calculated as the sum of all partial discharges after completing
the measurement of all verticals.
Fig. 51: Division of the measurement
cross-section into vertical (verticals)
and horizontal levels (cells).
Vertical
Discharge segment
0
Cells
Flow cross-section
1
2
3
4
Discharge calculation
The OTT Qliner 2 calculates the discharge according to the mid section method
(mid cross-section method) in accordance with EN ISO 748.
With the mid cross-section method, the measurement cross-section is divided into
individual segments. The width of the individual segments is determined as half
the distance to the neighboring vertical in each case. For this reason, the first and
last verticals should be as near to the edges as possible when using this method.
61
Cross-section zero point
Fig. 52: Discharge calculation
for an individual segment.
bn
bn-1
b4
b3
b2
b1
1
vm1 h1
2
vm2 h2
3
vm3 h3
n-1
4
vm4 h4
vm(n-1) hn-1
n
vmnhn
Segment
3
q 3 = vm3 .
(
( b 3 - b 2) + ( b 4 - b 3 )
2
)
.h
3
The equation given describes the discharge calculation for an individual segment.
The total discharge is thus the sum of the partial discharges of all segments.
Taking account of vertical edges
The amount of discharge in the edge areas with vertical edge walls is taken
account of as illustrated in Figure 53.
Cross-section zero point
Fig. 53: Discharge calculation
with vertical edge walls.
b3
b2
b1
1
2
qR
h2
vm2
h1
qR =
(
h1 .
( b 2 - b 1)
2
)
.K . v
m2
R
KR: edge factor for allowing for the roughness of the edge wall
The edge factor entered is dependent on the characteristics of the edge.
As a guide:
Edge characteristic
Smooth edge with no vegetation (e.g. concrete, steel, cement)
Brick sides with vegetation
Rough walls with heavy vegetation
62
KR
0.8 – 0.9
0.7
0.6 – 0.5
Appendix E – Declaration of conformity
OTT Hydromet GmbH
Postfach 21 40 · 87411 Kempten
Ludwigstraße 16 · 87437 Kempten
Tel.: +49 831 5617-0
Fax: +49 831 56 17-209
[email protected]
www.ott.com
Geschäftsführer: Dr.-Ing. Anton Felder, Jörg Mayer, Ronald Marcel Peters
Sitz der Ges.: Kempten · Registergericht Kempten HRB 7687 · USt.-ID.-Nr. DE 258 217 067 · Steuer-Nr. 127/134/80337
WEEE-Registrierungs-Nummer: 49590817
Deutsche Bank AG München · BLZ 700 700 10 · Kto. Nr. 409 0304 00 · BIC: DEUTDEMMXXX · IBAN: DE96 7007 0010 0409 0304 00
Es gelten unsere Allgemeinen Geschäftsbedingungen (siehe „www.ott.com/AGB“)
All business transactions shall be subject to our General Terms and Conditions (see ”www.ott.com/GTC”)
63
OTT Hydromet GmbH
Document number
22.405.001.B.E 03-1114
Ludwigstrasse 16
87437 Kempten · Germany
Tel. +49 831 56 17- 0
Fax +49 831 56 17- 2 09
[email protected] · www.ott.com