1
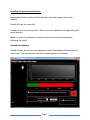
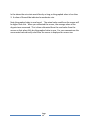
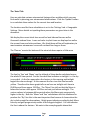
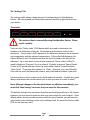
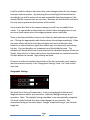
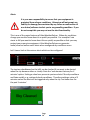
HitecWeatherDeluxe User Manual http://www.hitecastro.co.uk [email protected] Congratulations on your purchase of the ‘Hitecastro’ HitecWeatherDeluxe. We hope your device will provide for many years of service. HitecWeatherDeluxe is a high quality digital cloud, temperature and rain/moisture sensor. VERY IMPORTANT NOTE/TERMS: This device may not be used in any safety critical application or where its use/malfunction or otherwise might endanger personal safety. Hitecastro will not accept any liability for loss/damage caused by the failure of any part of the unit or associated software. If you do not accept these terms you must return the unit unused to your retailer for a full refund. There are no user serviceable parts inside this device and any attempt to open the product case will invalidate the following warranty. Warranty Hitecastro warrants that this product will be free from defects for a period of 12 months following purchase. This warranty is in addition to any statutory rights which may exist in your jurisdiction. This warranty only applies to use as described in this document and also for use as a cloud/temperature sensor. No other use is recommended or supported by Hitecastro. Any user repair attempt other than described in the troubleshooting section of this document or directed by Hitecastro will invalidate your warranty. Hitecastro and its affiliates disclaim any responsibility for any consequential damage or injury which may result from use of this device except as described in this document. Should your product fail within the first year of ownership we will repair/replace the unit at no cost to you. Page 2 Table of Contents Cloud Sensing Overview Before You Begin Siting the Unit Powering the Unit Connecting to a computer Installing and Running the application software Summary Tab Monitor Tab ‘Rain’ Tab ‘Astro’ Tab ‘Settings’ Tab -> Thresholds -> Geographic Settings -> Alerts -> E-mail Setup -> Temperature Scale -> Data Logging Minimising and Closing the Software Maintaining HitecWeatherDeluxe Troubleshooting Declaration of Conformity for CE Marking Links Page 3 Page Number 4 5 5 6 6 7 9 12 13 15 18 18 19 20 21 22 22 23 23 24 25 26 Cloud Sensing VERY IMPORTANT – Please read the following before using the device so that by understanding how HitecWeatherDeluxe works, you may use it to best effect and get the most accurate detection of cloud possible. HitecWeather is designed to be installed at a location outdoors with a clear unobstructed view of the sky area which you wish to evaluate. The sensor provides a field of view of 100 °. For the purposes of cloud measurement, HitecWeather incorporates two sensors, a high precision Infra-Red (IR) measuring device and a digital temperature sensor. By combining the input received from these two sensors it is possible to compute the condition of the sky in front of the IR sensor. At all times the ground radiates IR radiation (heat) upwards. Under a cloudy sky much of this radiation is reflected from the clouds back towards the ground. If the sky is clear, this radiation mostly escapes out into space. By measuring the temperature of the sky we can see how much radiation is being reflected back and by combining this with the ambient temperature, we can detect whether the sky is cloudy or not. In reality the calculation is a little more complicated than this. Moreover, given that thicker cloud reflects more radiation than thinner cloud, we can even make an estimation as to how cloudy the sky is. HitecWeather produces a key figure. We call this value ‘Delta’ know in the software as ‘Clarity Index CLR’. This is the difference between the measured temperature of the sky and the ambient temperature. A high value of ‘Delta’ indicates a clear sky. A lower value indicates a progressively cloudier picture. In order to determine the density of cloud we need to establish a set of bands which we can use to categorise the cloud level. The software included with the product contains a default set of values, ‘Thresholds’ which we have found to work well with the type of climate typically found around the United Kingdom. However your local climate may vary significantly. If you find that the default values do not provide accurate readings you will need to determine your own values and input these settings. We will describe a process later in this document which allows you to empirically determine these values if the defaults do not suit. Page 4 Before you Begin. Before setting up your HitecWeather unit, you should take a few moments to familarise yourself with the unit. The unit comprises of the sensor enclosure. On the top of the enclosure are the rain and IR sensor. It is important that these be kept clean and clear for optimum accuracy. You will note a short cable and a long cable coming from the side of the unit. The short cable is the ambient temperature sensor and the long cable is the main data and power cable. At the end of the main cable is a 9pin serial port connector and two wires. The two wires are the output from an onboard 12v relay which can be triggered from the unit. This can be used as a power source for any 12v device. Alerts generated by the software trigger this relay and thus it may be used to connect a device which will alert the user when certain conditions prevail. All of the above functions will be described in more detail later in this document. Siting the Unit Choosing a location for the unit is very much a user specific issue. However there are a couple of things to keep in mind. It will be necessary to clean the sensors on the unit periodically, so site the unit at a location that is easily and safely accessible. Therefore a rooftop is a bad location. Site the unit at a location where it can see the sky without obstruction. Trees and other obstructions emit radiation which will interfere with the accuracy of the unit. The unit is housed in an IP66 weatherproof enclosure. However, take care that an excessive amount of water or dirt cannot get on the unit. Normal or even heavy rainfall will not affect the unit. Ensure that rainfall can drain away from the unit and that the unit does not end up sitting in a pool of water. Page 5 It is recommended to install the unit so the ambient temperature sensor is not in direct sunlight. Direct sunlight warms the sensor and reduces its accuracy. Tuck the sensor underneath the unit and fix it with some electrical tape. Ensure that the main cable can easily reach the host PC without being stretched too much. Also ensure that it cannot be damaged by animals e.g. pets or vermin. Spiders will readily set up near the slight warmth of the unit. They may need to be removed periodically. Powering the Unit At the end of the main cable is a 2.5mm DC jack plug. Connect a 12-14v center positive power supply (minimum 1Amp) to this connector. Take care to ensure polarity is correct. Connecting the device to a computer. HitecWeather is a serial port based device. Find a free serial port on your computer and connect the 9pin DB9 connector. Many PC’s nowadays do not have serial ports as standard. In this case you will need to use a USB -> Serial adaptor (not supplied). We recommend one with a ‘Prolific’ based chip as we have tested these and shown them to be reliable. You may wish to note the virtual serial port which is generated by a USB -> Serial adaptor and have this information to hand when using the application software. To view this information in Windows, go to Device Manager -> Ports (COM & LPT) Page 6 Installing the Application Software. Download the latest release of HitecWeather from the support area of our website. Double click on the setup file. Follow the on screen instructions. There are no user definable settings during the install process. Note: In some circumstances it may be necessary to reboot the computer following the install. Running the software Double click on the icon on your desktop or select HitecWeatherDeluxe from the start menu. The initial screen may look something like the following; Page 7 With the unit powered and connected to a free serial port you may now connect the software to the device. Choose the correct serial port from the dropdown list on the front screen. Click the ‘Connect’ button. If all is well you will notice the serial port status indicator on the top right of the screen turn green. indicates normal communication with the unit. This Almost immediately data will start to flow from the unit. And the front screen will update similar to the following; Page 8 Let’s look at this ‘Summary’ screen in a little more detail. This plots the clarity index calculated by HitecWeatherDeluxe over time. The time period covered is a user definable setting. Drag the slider to choose the timeframe you wish to view (in hours) The connection area is for choosing the serial port to which the device is connected and tus connecting to the device with the ‘Connect’ button. Note when the device is successfully connected the text will change from ‘Connect’ to ‘Connected’ Serial port status. When green the device is connected and receiving data normally. This will turn red when the device is not powered/connected. Also if for any reason the unit cannot receive data normally this icon will turn red. Page 9 Heater Power. This is a very important setting which the user must choose. Built into the rain sensor is a low power heating element. The purpose of this is to quickly evaporate rain from the sensor once rainfall ceases. It also served another very useful purpose. The heat generated inside the unit also keeps the IR sensor slightly above the ambient temperature and thus keeps dew/condensation from forming on the IR sensor. Your aim will be to choose the lowest possible setting which achieves the stated aims without generating excessive heat. You may find that in the summer a setting of 1 is perfectly adequate. However in winter a setting of 4 or even 5 may be necessary. Choose a setting which keeps the rain sensor slightly warm to the touch. We recommend you begin with a setting of 2 and increase/reduce as required. A setting of 4 or 5 in warm (above 10C) will result in the sensor being VERY warm or even hot to the touch. If this occurs lower the heater setting until the sensor is just slightly warm. Also too high a setting may result in raindrops being evaporated from the sensor before they can be detected. The above metrics are as follows. AMB – The current ambient temperature. SKY – The current sky temperature as measured by the inbuilt IR sensor. CLR – The clarity index. This is an internally computed metric which indicates the clarity of the sky. A higher value represents a clearer sky. A fully cloudy sky will have a value of close to zero. Page 10 A pictorial representation of the sky is displayed which shows the current Moonphase, the cloud conditions and if rain/snow/frost is detected. Although the rain sensor itself does not differentiate between rain and snow, the graphical interface will show snow if moisture is detected whilst the current ambient temperature is below 2degC. Frost is also indicated if the temperature falls below 0degC. The above is the summary display of the output of the rain sensor Which indicates the current rainfall situation. The internal relay is primarily designed to respond to prevailing conditions and activate a connected 12V device. However it may be toggled on and off manually if desired via the relay toggle button. It is also required to manually toggle off the relay if it has been activated by an alert. Page 11 Monitor Tab There are two main graphs shown, the ambient temperature and the sky temperature. These graphs allow you to see these metrics in a little more detail. Simulate function You will note the ‘Simulate’ checkbox on the monitor tab. This is a very useful function which allows you to simulate rapidly changing prevailing conditions. This is useful for configuring and testing the alert system which is one of the strong points of HitecWeatherDeluxe. When the box is checked another window will pop up Page 12 By checking the appropriate box, the real values from that sensor are ignored and fabricated data is displayed by the software. For example if you choose the ‘Simulate Sky’ box with a change interval set at 30 seconds the sky temperate graph will change from just above 0degC to over -20degC every 30 seconds. You can of course decide the interval in seconds which must elapse before the sensor in questions flips between extreme values. You can use this for indoor testing and configuring the alert system. Remember to uncheck the simulate checkbox to return the system to reading real values from the sensors. The ‘Rain’ Tab. Here we get more detailed information of what the rain/moisture sensor is reading. Before accurate rain sensing can be carried out you must complete a one-time calibration of the rain sensor. Before doing this ensure that the rain sensor is clean and dry and that the temperature of the sensor is not vastly different to normal use. Press the ‘calibrate sensor’ button. Page 13 Press ‘Next’ Hitecweather automatically measure the dry point of the sensor. This may take 30 seconds or more to complete. When complete the dry point is set and stored on the host PC. Click Finish. Now accurate moisture sensing can begin. You can test the moisture sensor by spraying a few drops of water from a spray bottle or even just touching the sensor with your finger (we are mostly water remember!) You can configure thresholds for rain sensing on this tab if the default values are not to your liking. The values here represent bands. When the rain value on the moisture graph falls within these bands the appropriate rain state occurs. Page 14 In the above the rain state would be dry as long as the graphed value is less than 3. A value of 8 would be indicated as moderate rain. Note the graphed value is zero based. The actual value read from the sensor will be higher than this. When you calibrated the sensor, the average value of the drypoint was measured. This is then subtracted from the read value from the sensor so that when fully dry the graphed value is zero. For your convenience the uncorrected value directly read from the sensor is displayed on screen too. Page 15 The ‘Astro’ Tab Here we calculate various astronomical timings other variables which you may find useful in planning your astronomical observations. Click the ‘Update’ button to re-calculate these values for the current time and location. The location used for these calculations is set in the ‘Settings’ tab -> Geographic Settings. More details on inputting these parameters are given later in this document. We display the current clock time as well as local sidereal time as well as Greenwich sidereal time. Lunar and solar rise/set times are displayed as well as the current lunar and solar positions. We think these will be self explanatory to most amateur astronomers so we will not dwell too long on these. The ‘Planner’ area to the bottom of the astro tab does require a little more explanation. The line for ‘Sun’ and ‘Moon’ use the altitude of these bodies calculated across the whole 24 hour period. For the Sun dark blue indicates no twilight. i.e. the sky is very dark. As the Sun approaches the horizon in the morning and twilight begins the colours change. At the moment the Sun rises that line becomes yellow. Therefore the above graph tells us we have no twilight until close to 05:00hrs and from approx 19:30hrs. The ‘Moon’ line tells us that the Moon is below the horizon until approx 14:20hrs and sets just before midnight. The various colours in between define periods when the Moon gets progressively higher in the sky. Both the ‘Moon’ and ‘Sun’ calculations are then combined to produce the ‘Sky’ line this is the most important line because it shows when the sky is dark enough for observations. Bright green indicates a perfectly dark Moon free sky and gets progressively redder as the sky gets brighter. Full red indicates the Sun is above the horizon. We note in the example graphic above that Page 16 although twilight ends at approx 19:30hrs the sky is still not fully dark until the Moon sets just before midnight. You will note the icons to the right of the astro planner graph. These allow you to toggle the graph between ‘tomorrow’ and ‘today’. The disk icon allows you save the planner graph to disk in jpeg format The astro settings calculated here are provided for information only. They do not interact with the readings from the sensor or get modified by them in anyway. They effectively replace the need for a light sensor on the unit Page 17 The ‘Settings’ Tab The settings table allows a huge amount of configuration for HitecWeather Deluxe. We recommend you study these options carefully to get the best from your device. Thresholds This section is key to successfully using HitecWeather Deluxe. Please read it carefully. These are the ‘Clarity Index’ (CLR) bands which are used to determine the cloudiness or otherwise of the sky. Remember our discussion earlier in this document. ‘Clarity Index’ (CLR) represents the difference between the measured sky temperature and the ambient temperature. If this value falls between the values defined in the Threshold area then the level of cloud to the left will be indicated. E.g. in the above screen shot a measured ‘Clarity Index’ (CLR) of 4 would indicate an ‘Overcast’ sky or a value of 15 would represent ‘Some Clouds’. A value of 23 would indicate a clear sky and a delta value of 0 would indicate ‘Thick Cloud’. The actual descriptions (i.e. ‘Clear’, ‘Overcast’ etc.) are definable. Click into the text field above the numeric entry field and edit these if you wish. You may edit any of the numeric entry fields under thresholds. It might be a good idea to note down the current values just in case you need to revert to them. Note: Although changes to the threshold values are effective immediately, you must click ‘Save Settings’ to ensure they are saved for later sessions. The default settings here have been found to work well generally for a UK climate. However you may need to come up with your own values for your location. If the default values do not provide accurate results for your location, you will need to spend some time matching various sky conditions with the measured clarity index (CLR on the Summary tab). Page 18 It will be useful to observe how the clarity index changes when the sky changes from one state to another. By observing this and setting the threshold values accordingly you will be certain of accurate repeatable cloud measurement. We accept that this requires work on your part. However we feel that this method is the only way to guarantee the accuracy of the results. You may also find that as the seasons change you will have to modify these values. It is a good idea to note down the values before changing them so you can reuse these values when the outgoing season returns next year. There is also the possibility to have a set of data for both daytime and nighttime use. Clicking the appropriate radio button shows the settings accordingly. Often the same values will do for both day and night and can be made the same. However on some occasions night time values may not necessarily work during the day. You can therefore set a separate set of thresholds for each. The software will decide which one to use based on the calculated position of the Sun. Simply, when the Sun is above the horizon, day thresholds are used and once the Sun dips below the horizon, night settings are used. Of course in order to calculate the position of the Sun accurately, your location must be entered correctly in the ‘Geographic Settings’ Area. Let’s look at that area now. Geographic Settings We think this is fairly self explanatory. Enter your geographic latitude and longitude here as well as your timezone. Indicate if daylight savings are in operation. Note: The daylight Savings checkbox is not automatically computed. You must check/uncheck here when that changes at your location. We recommend using an accurate map or ‘Google’ maps/earth to get your latitude longitude. Page 19 Alerts It is your own responsibility to ensure that your equipment is protected from adverse conditions. Hitecastro will not accept any liability for damage/loss sustained by any failure or malfunction of our device/software to alert you to any prevailing condition. If you do not accept this you may not use the alert functionality. This is one of the major features of HitecWeatherDeluxe. When sky conditions change you need to know about it as quickly as possible. For example if rain starts to fall you want to know about this as quickly as possible so that you may protect your expensive equipment. HitecWeatherDeluxe can generate audio/visual as well as email alerts when configured sky conditions occur. Let’s have a look at the various alerts which can be configured. The top two checkboxes (on the left) can be checked if you want to be alerted when the sky becomes clear or cloudy. Note the ‘and remains that way for X minutes’ option. Setting a value here prevents spurious alerts if the sky conditions oscillates rapidly, e.g. scattered cloudy conditions. Therefore setting a value of 5 minutes means the alert will be triggered only when the sky ‘has been clear for the past 5 minutes’. Page 20 This is an example of the alert shown on screen when a clear sky alert occurs. It is accompanied via a loud audio sound. A similar visual cue occurs for all types of weather alerts with differing sounds. The best way to familarise yourself with these is to use the simulate feature described earlier. The ‘Alert for Rain/Snow’ is triggered when the moisture sensor detects rain/snow. The rain sensor MUST detect at least two successive readings above the dry point to trigger this alert. This is to avoid false alerts caused by ‘spikes’ in the rain sensor readings. These spikes are caused by static electricity in the air and are unavoidable. ‘Alert when temp falls/rises’. Configure this as desired to alert you when the configured temperature threshold has been breached. The other options are ‘Alert via e-mail’. This will cause an email to be send with the particular alert to the address configures in the ‘E-Mail Setup area’ ‘Activate Relay on Alert’. This causes the inbuilt relay to trigger on thus powering whatever 12v device you have connected to it. Some suggestions here would be a buzzer or LED light. We also plan to enable this to be integrated with another device to cause an observatory shutdown to occur. However this feature is still at the planning stage. The relay will remain on even if the alert conditions no longer persist until toggle off by the user from the summary tab. E-Mail Setup. Here you enter the parameters to enable HitecWeather deluxe to send you emails when alerts occur. You must configure at least the following; To address (your e-mail address) SMTP Server. Your outgoing mail server and SMTP port (generally provided by your internet service provider). If your SMTP server requires authentication, you Page 21 can enter the username and password here. Some SMTP servers use SSL (Secure Socket Layer) check this box if your SMTP server requires it. In the Alerts area there is a ‘Test E-Mail’ button. You can use this to check if your e-mail settings are working correctly. If all is well you will receive an email after pressing this button. You can get most of the information here from your existing e-mail client. Hitecastro cannot help you obtain any of these settings. Temperature Scale Cause HitecWeatherDeluxe to display temperature in degrees Celcius (C) or Fahrenheit (F) Remember that whichever temperature scale you choose, your threshold values must also be represented in the same scale. Data Logging The software is capable of logging the measured data to a text file for later analysis. To enable this check the ‘Log Data To File’ checkbox. By default the file is saved in the users ‘My Documents’ folder. You can override this and choose a file location yourself by clicking the browse button folder. and choosing another You must have permission to write to the folder you choose otherwise an error will be generated. Note also the input field ‘Only log every Nth item’. This is fairly self explanatory. A value of 5 here would ensure that only every 5th item is written to the log file. This might come in handy to prevent really large text files being generated. Page 22 Minimising and Closing the Software We recognise that screen real estate is a valuable commodity. Press the as if you were closing the application. The application does not in fact close, but minimises to the notification area in windows. Hovering the mouse over the Hitecastro icon, displays the current sky status and temperature in a text area above the icon itself To completely exit the application. Right click on the icon in the notification area and click ‘exit’. Maintaining your HitecWeatherDeluxe unit. There is a little maintenance involved in owning a HitecWeatherDeluxe device. You must take care of just as you would with any precision digital device. The sensors must be kept clear of dirt. To clean the sensors we recommend using a moist q-tip (cotton bud). Mix a small amount (a few drops) of household detergent (wash-up liquid) in a cup of luke warm water. Immerse the bud and squeeze away excess water leaving the bud damp. Clean the dark area of the IR sensor to remove any contaminant. Also clean off the rain sensor of any grime. The ambient sensor should not accumulate much dirt. If it does, clean it in a similar way to the other sensors. Never immerse the ambient sensor fully in water. Page 23 Troubleshooting Q: I cannot install the software application. A: Ensure that you have dot net framework v4 and the latest ASCOM platform installed. Q: My HitecWeatherDeluxe unit does not connect to my computer A: Check you are connecting to the correct COM port and that no other application is using that same port. Ensure that your version of windows has all the latest updates and service packs. Please note any error message you are given and contact support ([email protected]) Q: My HitecWeatherDeluxe unit shows it is cloudy and it is in fact clear (or viceversa). A: Ensure you have read and understood the section of this manual on ‘Thresholds’ and implemented these correctly. Q: I get rain detection alerts even though no rain is falling. A: Ensure the unit is installed away from strong electrical fields such as those generated by some televisions or other home applicances. These can generate strong magnetic fields which can fool the rain sensor to believe that moisture has been detected. If the above does not solve your problem first check our support area on our website http://www.hitecastro.co.uk We will add knowledge base articles as they arise. Failing that please contact us by e-mailing [email protected] or by contacting your retailer. Page 24 Declaration of Conformity for CE Marking. EU Declaration of Conformity This product carries the CE Mark in accordance with relevant European Union Directives. CE Marking is the responsibility of; David A. Jackson and David M. Grennan, Hitecastro, 30 Waverley Place, Worksop, Nottinghamshire, S802SX, United Kingdom. This product is designed for recreational use only and must not be used in any application where safety or personal injury may result from its failure. This product is not a toy. This product may cause unwanted interference in a domestic environment. The user may be required to take remedial measures. Disposal This product may not be disposed of along with domestic waste. To dispose of this item, take it to a local facility authorised to dispose of electrical waste covered under Electrical and Electronic Equipment (WEEE) regulations. Page 25 Links Requirements for using our software Dot Net Platform Version 4 http://www.microsoft.com/downloads/ ASCOM Platform http://www.ascom-standards.org/ Page 26