1
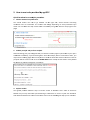
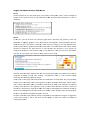
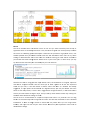
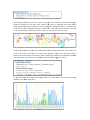
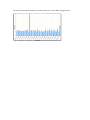
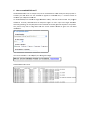
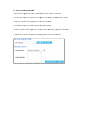
User Manual Zhou Du ([email protected]) Version 1.0 1. What is agriGO? The agriGO is designed to automate the job for experimental biologists to identify enriched Gene Ontology (GO) terms in a list of microarray probe sets or gene identifiers (with or without expression information) and it is also a GO‐related database. The agriGO specially focus on agricultural species. 2. Why use agriGO? The agriGO provides heavy support to agricultural species. Not only limited to SEA analysis, GSEA which is achieved using PAGE method is also available. Furthermore we have BLAST4ID tool for ID transfer or annotation. And search as well as download function is accessible. The agriGO can give out rich outputs like graphical result, bar chart result and hierical tree which composing a comprehensive understanding of biological meaning of user's input data. 3. What data argiGO contains? We currently support on 35 species including 280 datatypes. Please check the data statistics page for detail information. We will continue adding more species and datatypes. 4. How agriGO prepare its data? Raw GO annotation data is generated using BLAST, Pfam, InterproScan by agriGO or obtained from B2G‐FAR center or from Gene Ontology. Arabidopsis genome data is from TAIR. Rice TIGR genome data is from Rice Genome Annotation Project. Rice KOME data is from KOME database. Rice Gramene data is from Gramene center. Populus genome data is collected from JGI. Soybean and Sorghum genome data is compiled from phytozome. Grape genome data is compiled from Genoscope. Medicago genome data is from Medicago truncatula sequencing resources. Maize genome data is from MaizeSequence.org. Castor bean genome data is from Castor Bean Genome Database. Brachypodium distachyon genome data is from Ensembl. Bovien genome data is from Bovine Genome Database. Silkworm genome data is from SilkDB. M. grisea genome data is from Magnaporthe grisea Database. affymetrixmetrix CSV files and array sequences are from NetAffx. 5. How to use tools p
provided b
by agriGO? edure Quick introducction to anaalysis proce
1. Choose tooll and set parrameters You should cho
oose one too
ol to go forrward. At th
he right sidee, several frrames containing anno
otation text are interactiive. The conttent will chaange depending on exactt parameterss you chosse. You can m
make the help frames sho
ow or hidden
n by using HEELP buttons aat top‐right o
of the pagee. 2. Submit yourr job and perform analyssis Afteer submitting your job, thee agriGO will pre‐check the validity of yyour upload d
data. If your jjob is subm
mitted successsfully, a job ID will be givven. Since th
he analysis prrocess could take a while, you mayy close the waaiting page an
nd use the jo
ob ID to checkk the work latter. Please no
ote that results of yourr jobs will be stored on ou
ur server for TTHREE DAYS.. After 3 dayss all informattion of the job
b will be d
deleted. If you
u want elongation contactt me. 3. Explore resu
ults The agriGO provvides different ways to browse results of differeent tools. So
ome of them
m are flexible but you may need so
ome specific ssetting to maake them to castor to you
ur own demaands. And detailed intrroduction to tthese tools in
n the manual in the follow
wing will help you to achievve it. A. How to use
e Singular EEnrichment Analysis (SSEA) analysiis? SEA is a tradition
nal and widely used meth
hod. It is simp
ple to use an
nd simple to understand. User onlyy needs to prrepare a list o
of gene/prob
be names, an
nd enrichmen
nt GO terms will be found
d out after statistical teest from pre‐‐calculated baackground orr customized one. STEP
P 1: To u
use SEA analyysis, you should firstly select the type
e of your queery list, either single names or nam
mes with GO accession. Iff you choose using suppo
orted speciess in agriGO, yyou only nee
ed to provvide a list of ssequence identifiers. It should be note
ed that you w
would better sselect speciess and checck all allowed
d ID types of corresponding species, then submit yyour IDs. Only allowed IDs are suitaable to be an
nalysis in thiss type modee. And you caan mix your IDs from diffferent types.. Just ensu
ure they are aallowed IDs. If yo
ou choose cusstomized mode, you are n
no long limite
ed by agriGO‐‐owned speciies any more. You can use any IDs yyou have, butt only be noticed IDs should attach with GO accession! mit” to perforrm analysis n
now and simply skip follo
owing OK, theoreticallyy you can just click “Subm
ps. Neverthelless, if you want w
set mo
ore advanced
d parameterss, then keep
p on readingg this step
man
nual. STEP
P 2: Now
w you can seet the backgground or reeference. The
ere three tyypes: suggestted backgrou
unds, customized referrence and cusstomized ann
notated reference. The default paraameter is using suggested backgroun
nds. For each
h species, aggriGO will givve all posssible the baackground tyypes. To tho
ose species without a relatively co
ompleted profile, backkgrounds from
m neighbored
d organisms aare suggested. Users can select based on their pracctical need
d, otherwise use customizzed referencee. ted backgrou
In th
he case that you do not want any off suggested pre‐computa
p
und, you can
n use customized referrence instead
d. NOTE: IDs iin reference list should from the samee species thatt one seleccted above fo
or query list. Also
o you can usee any IDs if you choose customized annotated reeference mode, howeverr, the pricee is to attach with GO accession to obttain such free
edom. ☺ You can paste dirrect or upload
d your file, fo
or latter, pleaase make suree the file no b
bigger than 4MB. STEP
P 3: The advanced op
ptions are op
ptional but quite important. These op
ptions are default hidden,, and need
d to one clickk to make them visible. In
n SEA analysis, there are tthree statistical test meth
hods: hypeergeometric, chi‐square and fisher testt. Wheen the input//query list is ccompared wiith the previo
ously computted backgrou
und, or is a su
ubset of reeference list,, choose hyp
pergeometricc or fisher. When W
both off your queryy list numberr and reference list number are quite small, you
u may betterr choose fisheer test. When
n the input/q
query list h
has few or no
o intersection
ns with the reeference list, the Chi‐square tests are m
more approprriate. Nextt you can choose method
d to do the multi‐test ad
djustment. Seeven adjustm
ment methods are available here, including: Yekutieli (FDR under depen
ndency), Bon
nferroni, Hocchberg, Hoch
hberg (FDR
R), Hommel, Holm, False Discovery Raate. Though I would sugggest perform adjustment test, you truly can tu
urn off it and
d use no adjust. While you y choose no adjust, th
hen you mayy set significant level b
below higherr. Terms undeer the cutoff of the signifficant level w
will be highligh
hted, and emphasized in analysis reesults, and it w
will affect your test outpu
ut. Minimum numbeer of mapping entries meeans that GO annotations that do not appear in at least the selected num
mber of entrries will not be b shown. In
n other word
d, higher you set the num
mber, more entries neeeded to makee one GO term
m appear in tthe analysis reesult. Gene ontology type: t
Plant GO G slim is a cut‐down ve
ersion of thee GO ontologies containiing a subsset of the terms in the whole GO for plant. Last,, if you provvide a mail ad
ddress, a nottification will be send wh
hen the analysis is completed with
h the link to the results. Providing P
a email e
address is optional to SEA analyysis, because
e it is veryy fast. Greeeting! You caan now click ssubmit to perform the an
nalysis. You can always geet interactive help from
m the right heelp frames, aand a detailed tutorial in this manual, if you still h
have any question then
n contact me directly. In th
he following w
we will discusss the outputts of the SEA analysis. Singgular Enrich
hment Analysis (SEA) Results R
Partt 1: A brrief summaryy of your job will be given. The job ID iis useful with
hin 3 days. A file containin
ng all entitties in the query list that can be ann
notated by GO G associated
d with descrriptions is ab
ble to dow
wnload. Partt 2: In th
his part, you
u can browse the hieratical graph re
esult. Note that t
the graphical result was geneerated as sep
parate graph
hs for each of o the three GO categoriees, namely b
biological pro
ocess, moleecular function and cellular componeent. After select the category, uses caan specified their favo
orite output fo
ormat, graph
h rank directio
on and font ssize. The resu
ult format meeans which ou
utput form
mat you prefferred. The rank r
direction is used to
o define the direction in your outputt, for instaance the direection in the example imaage is ‘top to
o bottom’. An
nd the font size is self‐eviident that user can set smaller size if there are m
many nodes in their resultt. Clickk the ‘generaate image’ bo
ottom after yyou set all parameters weell. The graph
hical result w
will be pressented accorrding to you
ur own settings. The grraphical resu
ult is a GO hieratical im
mage conttaining all staatistically sign
nificant termss. Thesse nodes in tthe image aree classified in
nto ten levelss which are aassociated wiith correspon
nding speccific colors. Th
he smaller off the term’s q
q‐value, the m
more significaant statistically, and the no
ode’s color is darker an
nd redder (No
ote: q‐value h
here means tthat the valuee of the multtiple‐test adju
usted p‐vaalue). Inside tthe box of the significant terms, the in
nformation in
ncludes: GO tterm, q‐value
e, GO desccription, item
m number mapping the GO
O in the queryy list and bacckground, and
d total numb
ber of querry list and baackground. But when thosse term who
ose q‐value iss higher than the cutoff se
et by the u
user, only GO
O information
n will be given
n in the box. To b
better undersstand the graaphical resultt, investigatio
on of the ann
notation diagram is suggested. If usser chooses PNG or JPG or GIF result format, lin
nkage to thee term’s detaail is available by clickking those blo
ocks. Partt 3: The terms selectted here aree children terms of root one (or called secondarry level term
ms) or significant terms of secondaryy level terms. Thus, the baar chart givess user a brief f portray since
e the GO terms are reelatively geneeral descriptiion. Similar to t the procedure of grap
phical result, user shou
uld specified their param
meters beforee create the GO abundan
nce chart. Usser can try these t
settiing to obtain
n favorite vieew of the chaart bar. Note
e the setting you used will be recorde
ed in yourr cookie and these settinggs will be default ones in your future jobs. In otheer word, you may try sseveral times and make yo
our last attem
mpt as your own features.
Heree the bar chaart is using gllass bar stylee, default colors, GO anno
otation as X llegend, 14pxx font and 300 for X leegend rotatio
on. Here are some tips: 1. 1 Have a glaance of all fo
our bar styless and selecct one you like, 2. Use HEX format to define colors and th
here is a weebsite we alrready sugggested, 3. If you y prefer GO annotation
n as X legend
d content, yo
ou may use ssmaller font once therre are too maany words, 4.. 270 to 315 is suggested for X legend rotation, in which 270 m
means vertical, and 315
5 means 45 degree slope, and you can
n try other nu
umber which
h may satisfy your tastee but seems ssomehow strrange to me ☺
☺. The bar chart is created based on scriptss from Open Flash Chart. It is powerful. You can drag bord
ders to resizee and adjust tthe image sizze and ratio. And bars aree accessible tto term’s dettailed inforrmation. A ‘SSave as Imagge’ bottom is existed butt only useful when you are using FirreFox brow
wser, and if yyou can also use your ‘Print Screen’ b
bottom on yo
our keyboard or other too
ols to dow
wnload this im
mage. Partt 4: In th
his part, detailed informattion is given. All GO signifficant terms w
will presented in the follo
owing tablee. And you caan browse th
he GO terms using tree trraversing mode (we will d
discussed it laater), or caan browse alll GO terms in
n the similar ttype table, orr just the dataa. Userr can select terms to draw d
graphiccal result or create bar chart. Pleasse note thatt the paraameters used
d in graph or chart generaating is fetch
hed from your cookie, and
d your cookie
e will be set s or changeed when you
u generate grraphical results or GO ab
bundant chartt which has been men
ntioned in parrt 2 and 3. W
While it will maake you a bit trouble if you would like adjust the im
mages creaated here to rredo the part 2 or 3 work o
once more to
o change the settings. Clickk the checkbo
ox left to ‘GO term’ can seelect all GO te
erms at one ttime. You can click thee GO name to
o collapse/exttend ontologgy terms in tree traversingg mode. A bo
ottom that can make all significant sselected or not is available and those selected term
ms can be used in draw
wing graphicaal results or to create baar chart. Pleaase note thatt at least onee significant term shou
uld be included in graph generation, o
otherwise the graphical rresult will be some kind b
blank and meaningless. Click on thee number will lead you to tterm’s detail information.. The term’s detaiil page is as following. f
Th
he agriGO will give all enttries can be annotated to
o the term
m besides a brief summaryy. And for eacch entry the aannotation in
ncludes: GO tterms, GO source, desccription. B. How to use
e Parametriic Analysis o
of Gene Sett Enrichmen
nt (PAGE)? PAGE method is argued by Kim
m [BMC Bioin
nformatics 20
005, 6:144]. U
Using Central Limit Theore
em in statiistics, this method m
is sim
mple and effiicient. Differe
ent to SEA, it takes exprression level into acco
ount, and can
n deal with a llong list of geenes/probese
ets. STEP
P 1: Firsttly, you should choose the species forr your query data. Pleasee make sure tthat identifie
ers in yourr input should be one of datatypes in
nside the righ
ht information table. If yo
our identifiers are not stored in agrriGO, there iss another tw
wo ways: one is provided your own GO
O annotation
n file, the o
other is to usse our BLAST4
4ID service.
P 2: STEP
In PA
AGE analysis,, user should pay more atttention to inp
put data. As p
presented in the followingg imagge, as least tw
wo rows must be provided
d. The first ro
ow is sequencce identifiers,, and followin
ngs are n
numerical value. The num
merical value iis fold change
e (FC) or log2
2‐transformed
d FC value (laatter prefferred) of thee identifiers' eexpression un
nder differentt condition. Iff you do not have expresssion dataa, then SEA m
may be the altternative choice. In aggriGO’s exam
mple, there are 3 rows in th
his example. First row is A
ATH1 probeseet name, the seco
ond row is expression fold change (FC) value of cold
d treatment to CK(cold/CK
K) after half hour. Third
d row is exprression FC of cold/CK afterr 24 hour cold
d treatment. Only 600 pro
obesets are in
n the quicck example fo
or the fast loaad of the HTM
ML page. To o
obtain a full view of PAGE method, you
u can dow
wnload the fulll example filee and exploree the followin
ng analysis prrocedure. STEP
P 3: Nextt you can choose method
d to do the multi‐test ad
djustment. Seeven adjustm
ment methods are available here, including: Yekutieli (FDR under depen
ndency), Bon
nferroni, Hocchberg, Hoch
hberg (FDR
R), Hommel, Holm, False Discovery Raate. Though I would sugggest perform adjustment test, you truly can tu
urn off it and
d use no adjust. While you y choose no adjust, th
hen you mayy set significant level b
below higherr. Terms undeer the cutoff of the signifficant level w
will be highligh
hted, and emphasized in analysis reesults, and it w
will affect your test outpu
ut. Minimum numbeer of mapping entries meeans that GO annotations that do not appear in at least the selected num
mber of entrries will not be b shown. In
n other word
d, higher you set the num
mber, more entries neeeded to makee one GO term
m appear in tthe analysis reesult. Gene ontology type: t
Plant GO G slim is a cut‐down ve
ersion of thee GO ontologies containiing a subsset of the terms in the whole GO for plant. If yo
ou can also upload u
your own custom
mized GO ann
notation file once your id
dentifiers are
e not acceepted directlyy by agriGO. TThe file’s sizee is limited to 4MB. OK, now you can
n click submitt to start analysis now. Yo
ou may explorre output of analysis results in the ffollowing parrt of manual. Paraametric Analysis of Ge
ene Set Enriichment (PA
AGE) Resultt Resu
ults generated by PAGE an
nalysis have m
many similar points to SEA
A analysis, th
hus it is sugge
ested to browse SEA reesult introdu
uction part firrstly. And only unique feaatures to PAG
GE results will be explained. Since PAGE tool caan analysis seeveral rows aat one time, and terms in
n each row w
will be calcu
ulated, each row has its significant GO
O terms. Num
mber of significant GO term
ms for each ro
ow is listed in the brieff summary paart. The number of tterms is deteermined by th
he row you sselected whicch is colored by red. A simple colorful model n
named CM fo
or short is available. The color used in
n the CM is ssame to the color used
d in graphicaal result in which w
red color system means m
up regulated and b
blue means down d
regu
ulated. And each e
block present the term’s Z‐score for the row
w. You can sselect row(s)) and term
m(s) to generaate further im
mages. The term’s detaiiled informattion is generrated if you click c
the num
mber. This paage may be a bit simp
ple because itt is quite possible that theere are too m
many entries m
mapping to th
he GO. In graphical resu
ult part, user can choose one or two rows to draw
w the imagee. If two rows are seleccted, a third color system
m (purple co
olors) will be used in dem
monstrating tthose terms have diffeerent regulatiion direction in two rows. The following exxample presents two rowss in one grap
ph. You can ccheck the annotation diaggram belo
ow the resultt. There are three color systems: red
d means up regulated teerms, blue means m
dow
wn regulated aand purple presents the term is regulaated in differeent direction in tow rows.. And if th
he term has same s
regulatted direction in both row
ws, it will havve double bo
orders. In the
e box ‘r1=1e‐10’ meanss the q‐value of the term in row1 is 1e‐10, and ‘zs’ presents Z‐sccore. In baar chart geneeration part, ZZ‐score is thee statistical vaalue in PAGE calculation, mean value is the meaan of the value of all enttries in the row. r
Mean change c
is meean minus sttandard deviation whicch presents tthe change of expression when compaaring to the w
whole row background. W
While userr can set two color values for up‐regulaation terms and down‐reggulation term
ms. As mentioned m
beefore, Z‐scoree which is biigger than 0 or smaller th
han 0 will bee presented using u
diffeerent colors w
which set by u
user. But if you choosee mean valuee, they are in tthe same color since all m
mean is biggerr than 0. C. How to use
e BLAST4ID tool? The BLAST4ID too
ol is not an analysis tool, but an associiated one useed mainly forr two purpose
es: 1. Tran
nsfer your ID
Ds which are not availablle to agriGO to availablee ones, 2. use blast searcch to anno
otate your seequences with
h GO. To u
use BLAST4ID
D, user should
d set target d
database at ffirst, and then E‐value cuttoff. The proggram shou
uld be correctly selected
d based on sequence s
typ
pes of user’ss input and target datab
base. Generally speaking, all array ssequences arre nucleotide and other geenome sequeences are pro
otein. The process may take a lon
ng while thu
us the E‐mail address sh
hould be given for the Email E
notiffication. The result interfaace is a bit sim
mple☺, but eenough for ussage. Dow
wnloadable teext result: D. How to use
e search too
ol? Searrch tools in aggriGO are eassy to understtand and use.. Here are som
me tips: 1. Unless you con
ntact me and ask for elonggation, the jo
ob ID is availaable within 3 days. here is a shorrt‐cut at top‐rright corner ffor job search
hing. 2. Th
3. In
n advance seaarch, you havve to define th
he species firrstly. 4. Yo
ou can eitherr search singlee one or a listt (no more th
han 100) of seequence iden
ntifiers. 5. In
nput IDs are ccase insensitivve, but will bee agriGO's format in the o
output. 6. FAQ What is agriGO? The agriGO is designed to automate the job for experimental biologists to identify enriched Gene Ontology (GO) terms in a list of microarray probe sets or gene identifiers (with or without expression information) and it is also a GO‐related database. The agriGO specially focus on agricultural species. What is GO? "The Gene Ontology (GO) project provides a controlled vocabulary to describe gene and gene product attributes in any organism. The GO project is a collaborative effort to address the need for consistent descriptions of gene products in different databases. The GO collaborators are developing three structured, controlled vocabularies (ontologies) that describe gene products in terms of their associated biological processes, cellular components and molecular functions in a species‐independent manner. There are three separate aspects to this effort: first, we write and maintain the ontologies themselves; second, we make cross‐links between the ontologies and the genes and gene products in the collaborating databases, and third, we develop tools that facilitate the creation, maintainence and use of ontologies." Definition from http://www.geneontology.org/ What is updated in agriGO compare with EasyGO? The agriGO is a successor of EasyGO, and it go further. 1. We create new website interface. The database structure and scripts of agriGO are redesigned. Both page loading speed and analysis speed of agriGO now are improved because of the change. 2. The agriGO service is especially focus on agricultural species. It supports species is extended to 35 including as much as 280 datatypes. 3. We added new analysis tools for new agriGO, such as PAGE analysis and BLAST4ID tool. 4. The result output and information are richer compare with EasyGO. 5. The agriGO could also work as a GO database with search and download service. What are the unique features of agriGO compare with other GO webserver/database? The agriGO provides heavy support to agricultural species. Not only limited to SEA analysis, GSEA which is achieved using PAGE method is also available. Furthermore we have BLAST4ID tool for ID transfer or annotation. And search as well as download function is accessible. The agriGO can give out rich outputs like graphical result, bar chart result and hierical tree which composing a comprehensive understanding of biological meaning of user's input data. What is SEA analysis? SEA analysis means Singular enrichment analysis which is tranditional but widely used. SEA analysis is designed to identify enriched Gene Ontology (GO) terms in a list of microarray probe sets or gene identifiers. Finding enriched GO terms corresponds to finding enriched biological facts, and term enrichment level is judged by comparing query list to a background population from which the query list is derived. Which statistics method should I choose in SEA tool? When the input list is compared with the previously computed background, or is a subset of reference list, choose hypergeometric or fisher, for latter only when your query number is quite small. When the input list has few or no intersections with the reference list, the Chi‐square tests are more appropriate. What is PAGE analysis? PAGE is Parametric Analysis of Gene Set Enrichment [Kim et. 2005 BMC Bioinfomatics]. PAGE method is using Central Limit Theorem in statistics, this method is simple and efficient. Different to SEA, it takes expression level into account, and can deal with a long list of genes/probesets. PAGE use a two‐tailed test to count Z score, and the caculation of p‐value will be: if Z score >= 0: p‐value is 2 * (1 ‐ x) if Z score < 0: p‐value is 2 * x What is BLAST4ID? The BLAST4ID tool is not an analysis tool, but an associated one used mainly for two purposes: 1. Transfer your IDs which are not available to agriGO to available ones, 2. use blast search to annotate your sequences with GO. Which tool should I choose? It will depend on what data you have. If you only have a list of identifiers or only interested about them, SEA will be your choice. And if you like take expression data into count and would like compare several dateset then you may try PAGE. The BLAST4ID is only an associated tool, use it if you really need it. Why graphical/chart image does not display on my PC? The bar chart result need flash player to browse correctly. And you may need different tool to display different format graphical result, for example: Adobe reader, SVG brower. Contact me if you install related tool but still can not see the results. How many datatypes are supported by agriGO? We currently support on 35 species including 280 datatypes. Please check the data statistics page for detail information. We will continue adding more species and datatypes. How agriGO obtains its data source? Raw GO annotation data is generated using BLAST, Pfam, InterproScan by agriGO or obtained from B2G‐FAR center or from Gene Ontology. Arabidopsis genome data is from TAIR. Rice TIGR genome data is from Rice Genome Annotation Project. Rice KOME data is from KOME database. Rice Gramene data is from Gramene center. Populus genome data is collected from JGI. Soybean and Sorghum genome data is compiled from phytozome. Grape genome data is compiled from Genoscope. Medicago genome data is from Medicago truncatula sequencing resources. Maize genome data is from MaizeSequence.org. Castor bean genome data is from Castor Bean Genome Database. Brachypodium distachyon genome data is from Ensembl. Bovien genome data is from Bovine Genome Database. Silkworm genome data is from SilkDB. M. grisea genome data is from Magnaporthe grisea Database. affymetrixmetrix CSV files and array sequences are from NetAffx. How often does agriGO update? Normally we will update our database every 3 months, but if we will update agriGO if some important data source is newly available. Improvement and updating to agriGO tools are irregulated. Can I check result from old version by new agriGO ? Sorry, but no. Because we reconstructed the database and redesigned the website organization, analysis result from EasyGO is not supported in agriGO. How to make agriGO add new customized datatype? User can contact the agriGO administrator by email ([email protected]) to discuss more details.