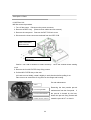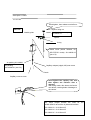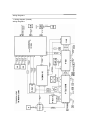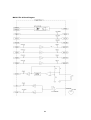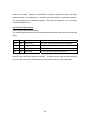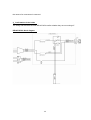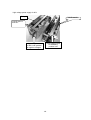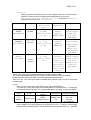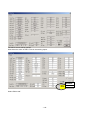
1
225-00612A
Gas Chromatograph Mass Spectrometer
GCMS-QP2010
Service Manual
1
Introduction
This Service Manual is intended for service personnel authorized by Shimadzu Corporation.
It describes maintenance of the GCMS-QP2010 instrument.
Untrained personnel must not attempt maintenance work on the instrument.
No
responsibility is accepted for work conducted by untrained personnel.
Safety Precautions
Before starting work, read and fully understand the Danger, Warning, Caution, and Notes
safety items in the yellow page at the beginning of the GCMS-QP2010 System User Guide
(225-00822).
The GCMS-QP2010 contains hot parts, such as the GC2010 heater unit, interface heater
unit, and ion-source heater unit, a high-voltage power supply for the detector unit, and
high-voltage circuits such as the vacuum-measurement circuit. Take sufficient care when
handling high-temperature and high-voltage units.
Disclaimers
(1) The copyright of this document belongs to Shimadzu Corporation, Ltd. The copying or
reproduction of part or all of this manual is prohibited without the permission of Shimadzu
Corporation.
(2) Some parts in this Service Manual may differ from the actual instrument.
Due to
product modifications, we reserve the right to change this manual without notice.
(3) This Service Manual is considered complete at the time of production.
omissions discovered may not be remedied immediately.
Copyright (C) 2001 SHIMADZU CORPORATION
2
Any errors or
Contents
CONTENTS................................................................................................................................... 3
1. INSTALLATION......................................................................................................................... 5
1. Checking Installation Conditions ................................................................................... 6
2. Unpacking, Assembly, Installation ................................................................................. 8
3. Environment Settings, Start-up.................................................................................... 11
4. Leak Check, Auto-tuning ............................................................................................. 13
5. Auto-tuning .................................................................................................................. 15
6. Qualitative Analysis (SCAN Mode) .............................................................................. 16
7. Quantitative Analysis (SIM Mode) ............................................................................... 18
8. S/N Measurements...................................................................................................... 19
9. Batch Processing, Report Printing, QA/QC ................................................................. 20
10. Maintenance.............................................................................................................. 21
11. S/N Measurements CI
12.S/N Measurements
NCI
MODE(OPTION).......................................................... 22
MODE(OPTION)........................................................ 23
13.Mass patern check Measurements
DI
MODE(OPTION) .................................. 24
2. MAINTENANCE...................................................................................................................... 25
1. MS Navigator .............................................................................................................. 26
2. Instrument Configuration ............................................................................................. 28
3. Lens Unit ..................................................................................................................... 29
4. Interface Unit............................................................................................................... 31
5. Valves.......................................................................................................................... 32
6. MS Filter Unit ..............................................................................................................33
7. Detector Unit ...............................................................................................................35
8. Turbo Molecular Pump ................................................................................................ 36
9. Main Power Unit.......................................................................................................... 37
10. GC Unit ..................................................................................................................... 38
11. Updating the Flash ROM ........................................................................................... 39
12. Backing Up and Restoring the E2PROM................................................................... 42
13. Adjusting the RF PS Assy.......................................................................................... 47
3. TROUBLESHOOTING............................................................................................................ 53
1. MS does not turn on .................................................................................................... 54
2. Abnormal Status LEDs ................................................................................................ 55
3. Cannot connect to MS................................................................................................. 56
3
4. Cannot connect to GC................................................................................................. 57
5. No ready status after automatic start........................................................................... 58
6. Pirani gauge, IC value too high, IG does not light ....................................................... 62
7. Loud noise................................................................................................................... 63
8. No peaks obtained (peaks extremely small)................................................................ 64
9. Ion-source temperature does not rise or rises too high ............................................... 67
10. Error displayed after filament turns on....................................................................... 69
4. DETAILS OF ELECTRICAL CIRCUITS ................................................................................. 70
1. Wiring diagram (Overall) ............................................................................................. 71
2. Wiring diagram (MAIN POWER ASSY) ....................................................................... 72
3.Wiring diagram (Details)............................................................................................... 73
4. MAIN POWER ASSY .................................................................................................. 74
5. DC POWER-A............................................................................................................. 77
6. PCB ASSY, MAIN CTRL-A .......................................................................................... 80
7. IS CTRL-A ASSY......................................................................................................... 86
8. HV PCB ASSY ............................................................................................................ 91
9. PCB ASSY, IG CTRL-A ............................................................................................... 95
10. PCB ASSY, CPU-A.................................................................................................... 99
11. RF PS ASSY ........................................................................................................... 102
12. PCB ASSY,DI CTRL-A ............................................................................................ 107
13. RELAY BOX-A......................................................................................................... 110
5. APPENDICES ....................................................................................................................... 112
1. Precautions during maintenance work ...................................................................... 113
2. Adjustment in the high mass-number range .............................................................. 114
3. Detailed explanation of CI and NCI ........................................................................... 107
4.Shimadzu Gas Chromatograph Mass Spectrometer .................................................. 111
5.Installation Completion Checksheet ........................................................................... 114
6. How to change Turbopump ....................................................................................... 118
4
1. Installation
Day 1
1. Checking Installation Conditions
2. Unpacking, Assembly, Installation
3. Environment Settings, Start-up
4. Leak Check, Auto-tuning
Day 2
5. Auto-tuning
6. Qualitative Analysis (SCAN Mode)
Day 3
7. Quantitative Analysis (SIM Mode)
8. S/N Measurements(EI mode)
Day 4
9. Batch Processing, Report Printing, QA/QC
10. Maintenance
Day 5
11. S/N Measurements(CI MODE)
OPTION
Day 6
12. S/N Measurements(NCI MODE)
OPTION
Day 7
13.DI check (OPTION)
The schedule above is a basic guide only.
Follow it flexibly, according to the customer's
situation and the progress of the installation work.
The schedule above is for a standard
installation; it does not include inspection with customer's samples or instruction on analysis.
(Inspection with customer's samples and instruction on analysis require extra days for
installation.)
This section describes the entire installation process.
Refer to the Installation Manual
(225-00816) supplied for details about assembling the instrument during installation.
5
Day 1
1. Checking Installation Conditions
Confirm the installation conditions, according to the Installation Completion
Checksheet (ZEAV-0416).
Check the power supply.
1)power requirements
Frequency requirements
MS power supply: 115V±5%, 1000VA
230v±5%,1000VA
GC power supply: 115V±5%, 1800VA
230V±5%,2600VA
230V±5%, 2600VA for high-power oven specification.
Not including GC options.
In addition,power for the pc,monitor,and printer must be provided.
CAUTION: USE the PC,monitor,and printer that conform to the law and regulation in
respective
NOTE: Be sure sure that power is supplied from a apower sourse with a ground fault
breaker in
*There may be instance in which the current capacity will increase as options are
attached.
2) Ground : 100Ω
or less
3)Voltage Fluctuation Range
Specified power supply voltage range:±5%
Operating power supply voltage range:±10%
NOTE: Voltage fluctuations are established so that the instrument can operate at full
capacity within the range of ±10%,including any transient noise in the AC line.
Note,however,that the voltage fluctuation range that guarantees the performance
specifications should be used within ±5%.・The degree of frequency stability of
power source should be within ±0.5%.
6
4) Power cable connection
The end of power cables for GC and MS constructed as shown below.
Power cables for GC
Black: Connected to the HOT side of AC line.
White: Connected to the NEUTRAL side of AC line.
GREEN: For grounding
Power
cable
for MS
115V Type
230V Type
CAUTION: Be sure to ground the instruments to avoid shock hazards.
Check the installation position.
□ Can a space of at least 300mm at the rear and 400mm at the left of the instrument be
maintained?
□ Is the desk strong enough to easily support about 110kg?
□ Is the temperature in the range 18 to 28MC ?
□ Humidity: 40% to 70%(with no condensation)
Check the gas.
□ Is the He gas of at least 99.995% purity?
Check the exhaust system.
□ Is an exhaust duct system available?
If not, attach an EMF3 (042-00124-31) oil-mist filter.
CAUTION: Do not place flammable materials near the air exhaust hole of the columm oven in the
Back of the GC.Failure to avoid them may be csuse a fire.
The checkbox marks (□) indicate check items in the Installation Completion Checksheet
(ZEAV-0416).
7
Day 1
2. Unpacking, Assembly, Installation
Unpacking
The entire unit comes in six corrugated-fiberboard boxes: GC, MS, RP, PC, CRT, and printer.
The GC unit weighs 30kg and the MS unit weighs 45kg.
unpacking these heavy boxes.
Take care to avoid accidents when
After opening the boxes, check that all accessories have
been supplied correctly.
Assembly
Check that the desk is strong enough to easily support the GC, MS, and PC (totaling
approximately 110kg) and does not distort or become unstable.
Position the instrument with a space of at least 300mm at the rear and 400mm at the left of
the MS unit.
Connect the wiring and tubes as shown in the diagram below.
GC/MS Rear View
Carrier gas connector port
RS-232C cable (GC)
IEEE1394 (PC)
Rotary pump power outlet
MS power supply switch
(Circuit protector: 10A)
1: ON
0: OFF
~: AC voltage
GC power cable
Vinyl tube for vacuum
MS power inlet
Check the following points before turning on the power.
AC line insulation checks (with a tester)
GC: Turn on the main switch and confirm that the resistance across the power line and earth
exceeds the limit of measurement.
MS: Confirm that the resistance of the I/F heater (connector e or h to earth) exceeds the
8
limit of measurement.
Turn on the main switch and confirm that the resistance across the power line and earth
exceeds the limit of measurement.
Other visual insulation checks
Open the front door of the analysis tube and check that the filament heater and
thermocouple are in the correct positions.
Check that the wiring does not contact the
surrounding components.
9
Check the following points about the carrier gas connections.
Carrier gas pressure
The operational gas supply pressure to the GC is in the range 300 to 980kPa.
But some
supply pressures have a limiting effect on the pressures that can be set at the GC. The
normal supply pressure is 700 to 800kPa.
Carrier gas purity
Leaks from the pipes and organic matter can hinder high-accuracy measurements
(particularly for integrated piping).
Residual air in pipes and air in the analyzer also have an adverse influence on analysis.
Be sure to conduct the following checks when connecting the pipes:
c Purge the pipes.
(Place a piece of paper over the end of pipes and check that no color is
visible.)
d Sniff the gas to check it has no bad smell.
e Purge the GC connector for several minutes.
f Set the GC total flowrate to maximum and leave for 10 to 20 minutes.
Mounting the column
Mount the column, as described in section 3.2 Preparation for Analysis of the Operation
Guide.
Caution
Minute traces of interfering components appear easily in the analysis results due to the high
sensitivity of the instrument.
Never touch the septum or glass insert at the inlet with bare hands.
When mounting the column, wipe all parts with acetone before inserting them.
Installation
All required software is preinstalled in the PC set but, unless the latest software versions are
installed, the software must be upgraded to the latest version.
Refer to applicable Technical Information for details about how to obtain the latest software
and the method of installation.
10
Day 1
3. Environment Settings, Start-up
Turn on the instrument power supplies in the following sequence:
c pretreatment unit
d GC
e MS
f printer and monitor
g PC
When the power is turned on for the first time after connecting the MS and PC, the MS driver
is installed automatically.
Install the driver in accordance with section 8.8.3 Installing the
MS driver of the System User Guide.
Outline Procedure
(See the System User Guide for more details.)
Press [Next (N)].
Display the list of the known drivers of the device.
Select “Another Device”.
Press [Next (N)].
Press [Use Disk].
Insert the CD-ROM
Enter "E:¥Driver" and press [Enter].
Select “Shimadzu GCMS-QP2010”.
Press [Next (N)].
Press [Next (N)].
Environment settings
Set up the software environment, as described in section 3.3 System Configuration of the
Operation Guide.
Start-up
Start evacuation, as described in section 4.1 Starting and Stopping the Vacuum System of
the Operation Guide.
Hint
11
Press [Manual] on the Start/Stop window to monitor the vacuum status and degree of
vacuum.
Go to Section 3 if problems occur!
12
Day 1
4. Leak Check, Auto-tuning
Leak check
Check for air leaks with the instrument unheated, as described in section 4.2 Leak Check of
the Operation Guide.
□ Is m/z28 within twice m/z18?
Set the temperature of the ion source, INJ, COL, and interface and repeat the check to
ensure stability.
□ Is the temperature stable (Has the READY lamp gone out?)
□ Is m/z28 within twice m/z18?
Auto-tuning
Check that auto-tuning can be conducted normally.
Conduct auto-tuning, as described in section 5.1 Auto-tuning of the Operation Guide.
□ Is the detector voltage in the tuning report 1.8kV or less?
□ 0.10 maximum discrepancy between FWHM for m/z69, 219, and 502?
□ Is m/z69, 131, 219, 264, 414, 502, and 614 mass-number displacement C0.10 max.?
Checks on the Peak Monitor window
□ Does the peak intensity change when each lens voltage is changed?
□ Does the m/z69, 219, and 502 peak amplitude drop below 0.50 when the RF offset is
increased?
The checkbox marks (□) indicate check items in the Installation Completion Checksheet
(ZEAV-0416).
Settings at the end of the initial day
Set a high GC total flowrate (100 to 200 mL/minute) to lower the residual air in the carrier
gas.
13
Do not increase the ion source or interface temperature above the level required for
analysis.
14
Day 2
5. Auto-tuning
Leak re-check
Conduct a leak check to confirm that the air has reduced since the initial day.
Confirm that m/z32 / m/z31 does not exceed 3 when SI(PFTBA) is inserted.
Check for external abnormalities
Look at the external appearance of the instrument and listen for noises to confirm no
abnormalities are present.
Operation Description
Auto-tuning is described in section 5.1 Auto-tuning of the Operation Guide.
Points to Explain to the Customer
Auto-tuning must be conducted before starting a series of analyses.
Do not conduct auto-tuning between measurement and quantitation.
Conduct auto-tuning while the temperature is stable.
If the instrument was stopped, wait at least two hours for the temperature to stabilize before
conducting auto-tuning.
Vacuum leak check in the tuning report.
Confirm that the detector voltage does not exceed 2kV.
15
Day 2
6. Qualitative Analysis (SCAN Mode)
Describe the method of qualitative analysis using a standard sample, such as OFN
100pg/µL.
Operation Description
Explain the file types described in Section 2.9 Common Operations of the System User
Guide and how to use Data Explorer, and create a new project folder.
Explain the analysis method and data analysis method in accordance with section 6
Qualitative Analysis (SCAN Mode) of the Operation Guide.
Points to Explain to the Customer
How to use Explorer
How to use the Method Wizard and how to check the methods created
Carrier-gas pressure setting range (column flow to 15mL/minute)
Meaning of "solvent elution time"
Standard values of each parameter
How to save method files
How to register samples
How to run the data-processing program
How to expand TIC
How to eliminate background noise
How to display mass-chromatographs
How to search libraries
How to register spectral processing tables
Conduct an S/N check, if time is available.
See section 8. S/N Measurements for details about the measurement conditions.
16
Conduct three measurements.
Do not continue the measurements if the S/N is lower than
the criteria.
(After several dozen injections, waste from the septum can contaminate the insert, making
S/N hard to measure.)
17
Day 3
7. Quantitative Analysis (SIM Mode)
Describe the method of quantitative analysis using a standard sample, such as OFN
100pg/µL.
Explain the analysis method and quantitation method in accordance with section 7.
Quantitative analysis (SIM Mode) of the Operation Guide.
Points to Explain to the Customer
Principle of SIM, explanation of channels and groups
How to create methods
Settings in Analyzer Monitor
Hot to register target components
Setting quantitation parameters
Creating the Compound Table (using Wizard)
Measuring unknown samples
18
Day 3
8. S/N Measurements
Measure S/N.(EI MODE)
SAMPLE OFN 1pg/ul (isookutane solvent) 1ul
Measurement Conditions
INJ
250MC
SPLITLESS mode (sampling time 1.0 minute)
COL:
50MC (1min) - 40MC / min - 200MC (0min) - 15MC / min - 280MC
I/F:
250MC
IS:
200MC
He:
during injection
250kPa, 1 minute
(HIGH-PRESSUREINJECTION mode)
during analysis
120Kpa
Total flow:
50mL/minute
MS:
SCAN mode (mass range: m/z200 to 300)
interval
0.5s
detector voltage
relative value: +0.4 (absolute value: 1.4 to 1.6kV)
measurement time:
3.0 to 10.0 minute (solvent elution time: 3 minutes)
19
Day 4
9. Batch Processing, Report Printing, QA/QC
Describe continuous analysis using section 8. Batch Processing (Continuous Operation) of
the Operation Guide.
(Go through this description, even if the customer has no pretreatment unit or autosampler.)
Points to Explain to the Customer
How to create batch files (using Wizard)
Describe the method of printing reports using section 9.Report Printing of the Operation
Guide.
Points to Explain to the Customer
The differences between the two report formats (graph image and report)
Method of printing graph images
Method of generating reports
How to use templates
Explain the QA/QC functions using section 10. Quality Assurance and Quality Control
Functions of the Operation Guide.
Points to Explain to the Customer
Explain an outline of the QA/QC functions.
20
Day 4
10. Maintenance
Describe the maintenance of the instrument using section 8.Maintenance of the Operation
Guide.
Points to Explain to the Customer
Precautions to take during maintenance work
Filament replacement procedure
How to mount and dismount the ion source (Emphasize that the screws at the left must be
tightened first when mounting the ion source.)
How to conduct leak checks
Maintenance of the INJ unit
Maintenance Schedule Guidelines
The period of maintenance for contamination varies significantly with the analyzed samples,
sample concentrations, and analysis frequency.
The schedule below is presented as a
rough guide only.
Ion-source box
3 to 6 months
Lens assembly
1 to 2 years
Pre-rod
2 to 3 years
Main rod
3 to 5 years
Detector
2 to 3 years
RP
15,000 hours (overhaul recommended)
(Replace oil every 3,000 hours)
TMP
This is a guide only.
25,000 hours (overhaul recommended)
Use it to plan scheduled maintenance.
21
Day 5
11. S/N Measurements CI
MODE(OPTION)
Measure S/N.(CI MODE)
Benzophenone 100pg/ul (acetone solvent) 1ul
INJ:
250℃
SPLITLESS MODE (Sampling Time
COL:
80℃(2min)−30℃/min−260℃(5min)
I/F:
250℃
He:
during injection and analysis
Total flow
MS:
2.0 min)
IS:200℃
100Kpa
20ml/min
SCAN MODE (mass range
interval
M/Z
100∼250)
0.5sec
detector voltage
relative value +0.4
measurement time
6.0∼11.0 min
(absolute 1.4∼1.6 kV)
(solvent elution time 5.5min)
Attention
Please confirm that the sensitivity of EI is sufficient, in the case that the sensitivity of CI and
NCI is confirmed.
22
Day6
12.S/N Measurements
NCI
MODE(OPTION)
Measure S/N.(NCI MODE)
SAMPLE OFN 100fg/ul (isookutane solvent) 1ul
Measurement Conditions
INJ
250MC
SPLITLESS mode (sampling time 1.0 minute)
COL:
50MC (1min) - 40MC / min - 200MC (0min) - 15MC / min - 280MC
I/F:
250MC
IS:
200MC
He:
during injection
250kPa, 1 minute
(HIGH-PRESSURE
INJECTION mode)
during analysis
120Kpa
Total flow:
50mL/minute
MS:
SCAN mode (mass range: m/z200 to 300)
interval
0.5s
detector voltage
relative value: +0.4 (absolute value: 1.4 to 1.6kV)
measurement time:
3.0 to 10.0 minutes(solvent elution time: 3 minutes)
Attention
Please confirm that the sensitivity of EI is sufficient, in the case that the sensitivity of CI and
NCI is confirmed.
23
Day 7
13.Mass patern check Measurements
DI
MODE(OPTION)
cholestane 100ng/ul (acetone solvent) 1ul
MS I/F
100℃
IS
250℃
DI temperature
GC
room temperature to 300℃ (40MC / min)
temperature
constant
Colum flow
moderate flow
24
2. Maintenance
Daily Maintenance
1. MS Navigator
Description of Parts
2. Instrument Configuration
3. Lens Unit
4. Interface Unit
5. Valves
6. MS Filter Unit
7. Detector Unit
8. Turbo Molecular Pump
9. Main Power Unit
10. GC unit
Adjustment Software
11. Updating the Flash ROM
12. Backing Up and Restoring the E2PROM
13. Adjusting the RF PS Assy.
25
Daily Maintenance
1. MS Navigator
GCMSsolution incorporates the MS Navigator as a guide to normal daily maintenance.
Follow the procedure below to use MS Navigator.
1. Run GCMSsolution (Analysis, Post-run, or Edit analysis)
2. In the Help (H) menu, select [Help Contents (C)].
3. The Help window is displayed.
Select "Operation hints" and "Maintenance" from the
contents list.
4. Select the required item, such as "Replace the filament" or "Ion-source maintenance,"
to display the associated guidance information.
26
27
Description of Parts
2. Instrument Configuration
COVERCPU
225-11016
225-11000-91
PCB ASSY CPU
PCB ASSY MAIN CTRL-A 225-11130-91
Screw、SUS
screw
washer M3×6
Screw, SUS
screw-washer,
M3X6
020−46534
Screw、SUS
Screw washer
M3×6
Screw, SUS screw-washer,
M3X6
Screw,SUS screw washer
Screw, SUS screw-washer, M3X6
M3×6 ,
020−46534
020-46534
225-11000-91
PCB ASSY CPU
PCB ASSY MAIN CTRL-A225-11130-91
225-11000-91
TMP ASSY 225-10130-91
PCB ASSY CPU-A
PCB ASSY IG CTRL-A 225-11280-91
MSFILTER ASSY
MAIN POWER ASSY
225-10410-91
225-11269-91
DET(H)ASSY
225-10465-91
RF PS ASSY
225-11075-91
FLOW PATH ASSY
225-10307-91
225-11250-91
PCB ASSY DC POWER A
28
Description of Parts
3. Lens Unit
Lens fixing screws
(2 positions)
Ion-source lens unit removal procedure
1. Please remove, take a/ column.
2. Remove the ion-source box.
3. Slide the pipe at the tip of the interface to the left.
The spring is held by the magnet;
remove it carefully.
4. Remove the ion-source heater and platinum sensor pin contactors (4 positions).
5. Remove the lens fixing screws (2 positions)
6. Remove the lens unit, taking care not to apply force to the lens potential contact plate.
Mounting the lens unit
When mounting the lens unit, the force of the lens contact plate slightly lifts the lens unit,
making its original position difficult to determine.
Therefore, confirm that the
positioning pin at the right of the lens unit base plate is in the correct position.
Then, mount the lens unit by reversing the removal procedure described above.
29
Details of the lens unit
22
12
29
29
15
28
29
16
18
29
29
17
29
⑪ IS MAG Base Assy
225-10440-91
⑫ Heater Block
225-10439-91
⑮ LENS 2 Assy
225-10263-91
⑯ LENS 3 Assy
225-10264-91
⑰ LENS 4 Assy
225-10265-91
⑱ Spring Assy
225-10266-91
21 Insulator pin (glass)
225-10230-01
22 Plate
225-10257
28 Insulator bushing
225-01068
28
21
2 poit
11
2place
Screw, SUS screw-washer,
HEATER BLOCK ASSY
020-46137
225-10439-91
Ceramic insulator A24 - 251 - 1
200-44394
LENS2 ASSY
225-10263-91
Ceramic insulator A24 - 251 - 1
200-44394
LENS3 ASSY
225-10264-91
Ceramic bushing
SPRING ASSY
225-01068
Ceramic insulator A24 - 251 - 1
200-44394
225-10266-91
LENS4 ASSY
Ceramic insulator A24 - 251 - 1
200-44394
225-10265-91
IS MAG BASE ASSY
225-10440-91
30
Ceramic bushing
225-01068
Description of Parts
4. Interface Unit
O-ring 4DP105
036−11271
IF ASSY
Screw, SUS screw-washer, M4 x 8
225-10525-91 -92
020-46547
BLIND PANEL 225-10281
Screw, SUS screw-washer, M4
x 12
020-46549
If it attach
ci or nci
020-46534
mode,225-10586-91
、SUS
Screw washer M3×6
225-10537 PLATE HEATER BLOCK
LINE PIPE ASSY CI
225−10538
HOLDER1,HEATER BLOCK
225-10544 COVER IF
036−11251
020-46534
O ring 4D P50
SUS Screw washer M3×6
225-10526-91 LINE PIPE ASSY EI
PLATE2 HEATER BLOCK 225-10545
225−10540
HEATER BLOCK
020-46540screw SUS Screw washer
225-10546-91
P×3*M3×20
HEATER PT ASSY
225-10539 HOLDER2,HEATER BLOCK
225-10549-91
HEATERBLOCKASSY
100-115V
225-10549-92
HEATER BLOCK ASSY
220-240V
Including heater and PT sensor
31
Description of Parts
5. Valves
Standard Sample Inlet Unit
VALVE Assy
225-10179-91
Capillary Assy
225-015559-91
Glass sample pin
SI Assy
225-04257-91
225-10180-91
O-ring
036-11202
Leak Valve
Leak valve Assy
BRACKET,LEAK VALVE
225-10118
Bolt SUS with hole M3X6
LEAK VALVE ASSY
225-10116-91
BOLT
SUS
M3X6
022-27602
32
WITH
HOLE
Description of Parts
6. MS Filter Unit
MS filter removal procedure
1. Turn off the power.
Disconnect the power connector.
2. Remove the DET Assy.
(Remove three cables and four screws.)
3. Remove the rear panel. Remove the DIFF PCB unit cover.
4. Disconnect the three connector-terminals from the DIFF PCB.
MSFILTER ASSY
225-10410-91
Bolt, SUS with hole M 6X25 X4
022-27108
Caution: The PCB is sensitive to static electricity.
Touch the chassis before starting
work.
5. Remove the four MS FILTER Assy fixing screws.
6. Pull the MS FILTER Assy to the rear.
It is hard to move initially; rotate it slightly in each direction before pulling it out.
Take care not to scratch the O-ring faces on the flange and housing.
Pre-rod maintenance
Sleeve
Pre-rod fixing screw
Pre-rod contact terminal
Removing the lens permits pre-rod
maintenance from the front panel.
If
the pre-rod is burned by the ions,
loosen the pre-rod fixing screws and
Contact terminal removal
33
rotate the pre-rod 90M to clean it.
Short spring
Note : The short springs are inside the position shown in the diagram above.
The distance of the springs from the insulators are as follows:
Pre-rod end
17.5mm
Detector end
21.5mm
Removing the ROD Assy
1. Remove the three rod fixing screws.
2. Remove the sleeve.
3. Carefully pull the rods out of the MS FILTER Assy.
Caution
The ROD Assy is specially assembled to micron (1/1000mm) accuracy. Applying
shocks or forces to the ROD Assy may cause displacement that has a major effect on
the MS performance.
Be especially careful when handling the ROD Assy.
34
Description of Parts
7. Detector Unit
Detector (complete)
Detector
225-10463-91
only) 225-09340-11
DET(H)ASSY
225-10465-91
(electron
multiplier
CDD electrode
DET LENS
Ion signal
connector
APERTUR
PCB PRE AMP-A
225-11030-91
CDD/detector high-voltage power
supply
HV PCB ASSY
225-11195-91
OR HV PCB ASSY NCI
225-11195-92
During installation (or replacement), confirm
that the signal connector pin, high-voltage
connector pin, and detector fixing hooks are
connected correctly.
Signal pin to detector
signal position
1Ω max.less
High-voltage pin to
detector high-voltage position1Ω max.less
Earth to detector
fixed position
1Ω max less
―――――――――――――――――――
Defective connections can prevent peak
detection or cause signal baseline
disturbance.
CCAUTION: The purge is necessary.
35
Description of Parts
8. Turbo Molecular Pump
TMP fixing screws
(4 positions)
TMP2
(TW70)
TMP1
(TW300)
RP connection (TMP exhaust unit)
Two turbo molecular pumps (TMP), one for the ion-source unit exhaust (TW-300) and one
for the analyzer exhaust (TW-70), are connected to a single rotary pump (E2M1.5).
Removing the Turbo Molecular Pumps
1. Remove IS Cont PCB.
Remove the IG tube.
2. Disconnect the TMP exhaust unit from the rotary pump.
clamp from the KF flange.
Loosen and remove the
The TMP1 flange is integral with the TMP body and can be
difficult to remove.
3. Disconnect the connector (power) from the power supply.
4. Remove the TMP fixing screws and remove the TMP.
5. Lower TMP1 to the top of the TMP power supply, slide it to the left (as seen from the
front), and remove it from the instrument.
6. Reverse this procedure to install the TMP.
Caution
Ensure that no dust or dirt sticks to the O-ring at the top of the TMP.
(Purge with dry gas (He, N2) during installation.)
36
Description of Parts
9. Main Power Unit
Caution
To prevent electric shocks, disconnect the power cable from the instrument before starting
maintenance work on the main power unit.
Power supply LEA150F-24
074-80424-01
Power supply LEA50F-5
074-80422-01
Power supply LEA50F-24
074-80422-51
37
Description of Parts
10. GC Unit
Hand tighten, then release one half-turn.
INJ Unit
Septum fixing nut
Supelco
221-35507-01
Needle guide
septum
Spacer
O-ring
Glass insert (silane finished, for
SPLITLESS mode) 221-48876-03
(set of 5)
Au packing 221-48990
Au packing
Capillary adapter (nipple, MS) 225-04156
221-49065-91 (set of 5)
Ferrule
Capillary nut 670-11009
Hand tighten the capillary nut, and
then tighten one half-turn with a
spanner.
After being used a few times, the ferrule
can deform, causing leaks or damage to
the column.
The
same
Vespel
ferrules
are
used
for
GCMS-QP2010 at both the inj side and interface.
670-15003-03
for 0.25mm ID
670-15003-04
38
670-15003-05
for 0.32mm ID
for 0.53mm ID
the
Adjustment Software
11. Updating the Flash ROM
A Flash ROM is mounted on the CPU-A PCB in the GCMS-QP2010.
below if a Flash ROM update is required.
Follow the procedure
(The ROM version is displayed in the
GCMSsolution System Configuration.)
*Before updating the Flash ROM, stop the instrument (vacuum system) and exit
GCMSsolution.
1. Copy the ROM file to hard disk.
(Normally copy to C:¥GCMS-QP2010¥MOT.)
2. Run MS2010.EXE.
(It is normally contained in the directory C:¥GCMSsolution¥Program.)
3. Select "Update FLASH ROM" from the Tools menu.
(This cannot be selected in CONNECT mode.)
Fig. 1 The FLASH ROM Update window opens.
39
4. The FLASH ROM Update window opens.
EU164 value
Close window button
Current ROM version
File select button
Instrument serial number
File path of file to write to Flash ROM
Status display area
Start update button
Fig. 2 FLASH ROM Update Window
5. Press the file select button and select the ROM file to update.
A BIN file is normally selected.
An MOT file can also be selected, if available.
If an
MOT file is selected, when the UPDATE button is clicked, a BIN file is automatically
created from the MOT file in the directory where the MOT file exists.
6. Press the UPDATE button.
update are displayed.
The version information and a message box to confirm the
The ROM size and checksum (CHKSUM) values are displayed in
the status display area.
Update ROM version to(v1.00)
Are you sure?
Cancel
Fig. 3 Message Box to Confirm Update
7. Click the OK button if the ROM size and checksum values are correct.
Alternatively,
click the Cancel button to halt the update.
8. When the OK button is pressed, the ROM file is transferred to the GCMS-QP2010 and the
update process starts.
The progress status is displayed in the status display area.
* Do not turn off the instrument power during the update!
9. After the ROM update starts, the READY and FAILURE LED indicators flash alternately.
40
10. After writing to the Flash ROM is complete, the READY and FAILURE LED indicators
flash 20 times simultaneously, the CPU is reset, and the instrument is rebooted.
11. If the instrument reboots normally after the reset is applied, a message indicating that
the update is complete is displayed, as shown in Fig. 4.
I read better thoroughly GCMS2010.BIN.
I read BIN FILE. SIZE:168128---CHKSUM:DFB76B
It is while is forwarded BIN FILE to the device.
Please wait for a while until the updating of ROM ends.
The updating of FLASH ROM completed.
Fig. 4 Status Display when Update is Complete
12. Click the Close button to close the FLASH ROM Update window.
41
Adjustment Software
12. Backing Up and Restoring the E2PROM
* MS2010.EXE Version 1.20, or above
An E2PROM mounted on the CPU-A PCB in the GCMS-QP2010 stores various parameters
and times of consumable use.
After CPU-A replacement, follow the procedure below to
copy the E2PROM contents to the new PCB.
Backing up E2PROM Contents
* After GCMSsolution2 is used, the E2PROM contents are automatically backed up in a file
named
"instrument
S/N.bin"
in
the
GCMSsolution2
system
directory
(C:¥GCMSsolution¥System).
1. Run MS2010.EXE. Select "Edit E2PROM" from the Tools menu.
window opens.
Fig. 1-1 Opening the E2PROM Tool Window
42
The E2PROM Tool
Fig. 1-2 E2PROM Tool Window
2. Select "Backup" from the Process menu.
Fig. 1-3 Backup Menu
2. The Save As dialog box opens.
then click the Save button.
Select the directory and file name to be saved, and
The default file name is "instrument S/N.bin".
43
Fig. 1-4 Save As Dialog Box
4. The following message is displayed when the E2PROM backup is complete.
Fig. 1-5 Backup Complete Dialog Box
Changing E2PROM Contents
Use the Edit mode to change the contents of the E2PROM.
Restoring the E2PROM Contents
1. Run MS2010.EXE. Select "Edit E2PROM" from the Tools menu.
window opens.
44
The EEPROM Tool
2.Please do about the following contents before the work of the next 3 items.
① Select extend of the Process menu in E2PROM.
② Enter pass word. (MSALPHA)
③ Selsct Edit Mode.
④ Enter Serial No.
(This work in, proper number, for example 12345 even good)
⑤ Select Change(update) Mode.
⑥ Click the ok button.
⑦ Select Display Mode.
3. Select "Restore" from the Process menu.
Fig. 2-1 Restore Menu
4. The Open dialog box opens.
Select the E2PROM file name to restore, and then click the
Open button.
Please select.
“Body number “.bin file.
For example”12345”
Open
Cancel
Fig. 2-2 Open Dialog Box
5. A message box to confirm the restore is displayed.
displayed in the E2PROM Tool window.
The E2PROM contents are
If they are correct, click OK.
45
Cansel
Fig. 2-3 Message Box to Confirm Restore
6. If the E2PROM is restored normally, close the window and reboot the instrument.
Fig. 2-4 Restore Complete Dialog Box
46
Adjustment Software
13. Adjusting the RF PS Assy
Preadjustment
1. Run MS2010.EXE.
Select the Profile Measurement tab.
2. Click the CONNECT button on the tool bar.
3. Check RF power supply tuning
Select "RF Tuning" from the Tools menu.
The RF Tuning window opens.
mass number and click on the RF ON button.
Set the
RF tuning is conducted to minimize the
Value.
4. Set the following measurement parameters and press the start measurement button on
the tool bar.
pts/amu
10
repeat
acc 1
M/Z
69
width
10
Scale
5. Press the tool bar SI button.
200
200000
Wait a few seconds, and then press the emission button.
6. On the instrument control bar, set RF Gain to 5000, RF Offset to 4900, and CDD to
–10000 V.
Select Filament 1, Polarity A.
End measurement button
Emission button
SI button
Start measurement button
Profile Measurement tab
Measurement parameters
Instrument control bar
47
7. Make coarse adjustment of the lens voltages (Lenses 1 to 4) to maximize the m/z=69
peak intensity.
Adjust the detector voltage (EM) into the range 100000 to 200000.
8. Press the end measurement button when the adjustment is complete.
Adjustment of RF power-supply trimmers VR1 (RF) and VR2 (M/Z)
* Remove the rear cover before adjusting the RF power-supply trimmers.
1. Select "Adjust RF trimmers" from "Adjust Resolution" in the Tools menu.
2. The RF Power Supply Adjustment 1 window opens. (Fig. 2)
3. Press the Adjust button to display the m/z69, 100 peaks, peak full widths at half
maximum (FWHM), and the peak m/z offsets in the RF Power Supply Adjustment 1
window.
4. Adjust VR1 (RF) and VR2 (M/Z) to set FWHM=0.6 and identical M/Z OFFSET values for
each peak, as follows:
4.1 Adjust VR1 until both FWHM values are identical.
4.2 Use the RES set value to adjust the FWHM values to 0.6.
4.3 Adjust VR2 until both M/Z OFFSET values are identical.
5. When the adjustments are complete, press the Adjust button to end measurements and
close the window.
ADJUST
Adjust button
RES set value
AC value
RES value
Peak full width at half
maximum (FWHM)
Peak m/z offset
Adjustment range
FWHM
0.6±0.02 AMU
OFFSET Difference 2 within
Fig. 2 RF Power Supply Adjustment 1 Window
48
AC (52.5kHz) Adjustment
1. Select "Adjust 52.5kHz" from "Adjust Resolution" in the Tools menu.
2. The RF Power Supply AC Adjustment window opens.
(Fig. 3)
Signal strength
Status display
AC VALUE
AC parameters
RES VALUE
Check Start button
Check
Adjust
Check
cancel
Peak full width at half maximum(FWHM)
button
Start button
Peak-valley ratio
Fig 3 RF power source AC adjust window
3. Set the following initial values.
Adjust range
RF Gain2 = 60
: Correction gain
AC Gain = 2800
: AC gain
AC1 = 320
: AC correction range
MZ AC0 = 130
: Initial mass number when AC applied
AC Coeff = 400
: AC correction coefficient
RES Coeff = 200
: RES correction coefficient
FWHM
0.6±0.05 AMU
VALLEY
0.5 Or less
3.1 RF Gain2
RF Gain2 is a parameter that corrects the AC application when the peak full width
at half maximum (FWHM) is changed.
Reducing RF Gain2 causes more
frequent AC application when the peak resolution is increased.
Normally, the
initial value of 60 is left unchanged.
3.2 MZ AC0, AC Gain
AC must be applied linearly according to the mass number.
The MZ AC0
parameter sets the mass number at which AC application starts at FWHM = 0.6.
AC Gain is the gain parameter for AC.
49
3.3 RES Gain
The peaks normally become fatter when AC is applied.
corrects for this effect.
The RES Gain parameter
It is set during auto-tuning and does not need to be
adjusted.
3.4 AC1, AC Coeff, RES Coeff
Linear AC application is inadequate in the medium mass-number range when AC
is first applied.
These parameters correct for this effect.
This correction is conducted from the mass number indicated for MZ AC0 up to the
value of AC1.
The mass number at which AC becomes AC1 is displayed as MZ
AC1.
AC Coeff and RES Coeff represent 100 times the order of the AC correction curve.
A value of 100 represents a straight line.
50
4. Press the CHECK button to confirm the full width at half maximum (FWHM) for each
peak and how AC is applied (peak separation and signal strength).
check, "CHECKING…" flashes green in the status display.
At the start of this
The display reverts to
"WAIT…" when the check is complete.
4.1 Checking the high mass-number range (414, 502, 614)
The high mass-number range is adjusted using MZ AC0 and AC Gain parameters.
With insufficient AC, peak separation deteriorates and the Valley value increases,
as shown in Fig. 4-1.
Increase AC Gain to increase the amount of AC applied.
With excess AC, as shown in Fig. 4-2, the peak separation is good but the signal
strength (sensitivity) deteriorates.
In this case, decrease AC Gain as much as
possible without decreasing the peak separation.
Fig. 4-1 Insufficient AC
Poor
peak
separation
Fig. 4-2 Excess AC
Low signal strength
51
4.2 Checking the medium mass-number range (169, 219)
The medium mass-number range is adjusted using AC1, AC Coeff, and RES Coeff
parameters.
Fig. 4-3 Insufficient AC
Fig. 4-4 Appropriate AC
Fig. 4-5
Excess AC
At m/z 219 and 169, the peak separation of isotopes deteriorates with insufficient AC,
as shown in Fig. 4-3.
With excess AC, a ridge appears before the peak, as shown
in Fig. 4-5, and signal strength (sensitivity) deteriorates.
If the m/z169 peak width
(FWHM) becomes too small, adjust it by decreasing RES Coeff.
The peaks appear as shown in Fig. 4-4 when the AC1, AC Coeff, and RES Gain
parameters are adjusted correctly.
5. When the checks are complete, confirm that FWHM lies in the range 0.6 ±0.05AMU.
6. Close the window after the adjustments are complete.
7. The set values are automatically stored in the instrument EEPROM.
8. When the adjustments are complete, run GCMSsolution and conduct auto-tunig.
52
3. Troubleshooting
Problems when turning the power on
1. MS does not turn on
2. Abnormal Status LEDs
Problems when running software
3. Cannot connect to MS
4. Cannot connect to GC
Problems when starting evacuation
5. No ready status after automatic start
6. Pirani gauge, IC value too high, IG does not light
7. Loud noise
Problems during tuning
8. No peaks obtained
9. Ion-source temperature does not rise or rises too high
10. Error displayed after filament turns on
53
Problems when turning the power on
1. MS does not turn on
Check the power supply.
□ Is the power supply voltage within the required range for the MS?
MS required voltage: 100V C 10%
□ Is the power cable connected correctly?
□ Is the wiring correct?
Check the power switch.
□ The power switch is on the instrument rear panel.
Is it in the ON (1) position?
Hint
The power supply switch incorporates a no-fuse breaker (NFB) function.
The breaker is operating if the switch returns after being turned on (but it does not
return fully).
This indicates a problem in the power line of the MS main power unit.
−−>See section 4.4 Main Power Assy.
Check the Status LEDs.
□ Is the POWER LED lit yellow?
−−> If not, see section 4.4 Main Power Assy.
Check the operation noise.
□ Can the fan be heard?
−−> If not, see section 4.4 Main Power Assy.
54
Problems when turning the power on
2. Abnormal Status LEDs
Check the status of the LEDs when the power is turned on.
□ Do the POWER (yellow) and FAILURE (red) LEDs remain lit?
−−> CPU is not operational.
Check the CPU-A power supply.
Hint
This symptom appears in the following circumstances:
No 24V supply to the DC POWER PCB.
(Check cables, connectors, MAIN POWER
PCB.)
No C15V supply to the CPU PCB.
(Check CPU PCB voltage, cables, DC POWER
PCB.)
No C5V supply to the CPU PCB. (Check CPU PCB voltage, cables, DC POWER
PCB.)
□ Do the POWER (yellow), READY (green), and FAILURE (red) LEDs remain lit?
−−> Defective DRAM operation on CPU-A.
Replace CPU-A.
□ Yellow, green, and red change to yellow and red, but red remains lit?
−−> Defective FPGA operation on CPU-A.
Replace CPU-A.
Hint
The CPU-A runs a self-test when the power is turned on.
The normal MS startup process
is shown below.
c Power on
d Yellow, green, and red light
(Green does not light if CPU is inoperative.)
e Yellow and red light (DRAM check OK.)
f Yellow lights (FPGA check OK.)
55
Problems when running software
3. Cannot connect to MS
Check the MS power supply.
□ Is the power switch turned ON (1)?
Hint
Connection with the PC is not established for about 15 seconds after the MS power is
turned on.
Wait for a while after turning on the MS for it to connect to the PC.
Check the connector cable.
□ Are the MS and PC connected correctly?
The MS and PC are connected together with an IEEE-1394 cable.
Check the device driver.
□ Is the device driver registered in the Device Manager?
See section 4.10 PCB Assy, CPU-A for details about how to check this.
56
Problems when running software
4. Cannot connect to GC
Check the GC power supply.
□ Is the GC power switch turned ON (1) ?
Check the connector cable.
□ Are the MS and GC connected correctly?
The MS and GC are connected together with a 232C cable.
Check the GC communications parameters.
□ Are the communications parameters set correctly?
The correct settings are LEVEL 3 and 57600.
Check the contents of the MS E2PROM.
□ Are the E2PROM contents set correctly?
The correct settings are LEVEL 3 and 57600.
The E2PROM contents can be checked by running MS2010.EXE.
57
Problems when starting evacuation
5. No ready status after automatic start
Check the GC settings.
□ Is an appropriate carrier gas pressure set at the GC?
An inappropriate carrier gas supply can result in no pressure increase at the column
inlet, so that the automatic startup sequence does not begin (and the rotary pump
does not operate).
Check that the set carrier gas conditions are suitable for the
column.
Check the rotary pump.
□ Is the rotary pump rotating?
If not, check the wiring.
If the wiring is correct, see section 4.4 Main Power Assy.
Check for leaks.
□ Is the unit front door completely closed?
Occasionally, dust can cause minute leaks.
Check that no dust is sticking to the
O-ring contact faces before closing the front door.
□ Is there any leakage from the interface column connector?
Leakage can occur from the interface unit after repeated analysis with heating.
Tighten the connector slightly (about 1/6 turn).
Caution: Fully tightening the connector with the wrench supplied could damage the
screw threads.
If slight re-tightening does not stop the leakage, replace the ferrule.
□ Is the column broken?
It is impossible to maintain a vacuum if the column breaks near the interface unit. If
the column is scratched during maintenance, it tends to break at the scratch.
□ If the analysis tube was opened during maintenance, is there any leakage from it?
If a normal vacuum could be maintained before maintenance but not after it, initially
check the positions where maintenance work were conducted and the interface
column connector (the temperature has been dropped).
58
Hint
It is sometimes possible to identify very large leaks by turning off the GC and MS and
listening for them.
59
Problems when starting evacuation
5. No ready status after automatic start (cont.)
Check PG.
□ Does the PG value fluctuate?
The turbo molecular pump (TMP) does start above 300kPa.
If no leaks exist, the PG could be defective.
See section 4.6 PCB Assy, Main
CTRL-A.
A discontinuity in the PG wiring causes an error message to be display and prevents
startup.
Check the TMP.
□ Is the TMP running?
A problem could exist in the MAIN POWER PCB or cable if the TMP does not run
although PG is less than 300Pa.
−−> See section 4.4 Main Power Assy.
□ Has a TMP power supply error occurred?
The status LEDs can be seen by removing the sheet metal between the GC and MS.
If an error is displayed for TMP power supply, this indicates a problem with the TMP
or TMP power supply.
Replace one of these and check the condition again.
Caution
The power supplies for the large TMP and small TMP are incompatible in early
GCMS-QP2010 models.
Never swap the wiring for testing purposes or normal
operation will not be subsequently possible.
Hint
Evacuation system protective operations
(1) Start
Does the flow become READY within 3 minutes? No −−> error
(2) RP ON
Does the Pirani gauge drop below 300Pa within 5 minutes of turning on the rotary
pump (RP)?
No −−> error
60
(3) TMP ON
Does the Pirani gauge drop below 100Pa within 5 minutes of turning on the turbo
molecular pump (TMP)? No −−> error
Does TMP become READY within 5 minutes?
No −> error
(4) Vacuum READY 30 seconds after both TMP become READY
The FAILURE status LED flashes red if evacuation stops automatically for
protection.
TMP and RP failures
Within warranty period: Contact the Quality Assurance Department or TS.
Outside warranty period: Repaired by service company (at a fee).
61
Problems when starting evacuation
6. Pirani gauge, IC value too high, IG does not light
Check the column flow rate.
□ Is the column flow rate within the recommended range?
At a column flow rate of approximately 2mL/minute, the Pirani gauge value is about
40Pa or lower at the start of evacuation and about 1 to 10Pa after one day.
The normal IG gauge value after one day is no more than 1 to 2E-3Pa.
(See Appendix E in the System User Guide.)
Check the N2 (m/z28) and O2 (m/z32) values.
□ If these values are larger than the m/z18 value
Check for looseness in the column connector and for damage to the input septum or
column.
Check the carrier gas piping.
Thoroughly purge the piping when GC/MS has been newly installed.
(After purging at the GC connector for several minutes, turn on the GC power, set the
purge flow and total flow to maximum, and leave for 10 or 20 minutes.)
Follow the vacuum-leak check procedures in the System User Guide to identify
vacuum leak positions.
Check IG.
□ Is the IG filament burned out?
An error is displayed if the IG filament is burned out.
□ Is the connector wired correctly?
Refer to sections 4.6 PCB Assy, MAIN CTRL-A and 4.9 PCB Assy, IC CTRL-A when
checking the IG control.
62
Problems when starting evacuation
7. Loud noise
Check the source of the noise.
□ Source is RP?
Oil deteriorated, worn rotor −> Replace oil, overhaul
□ Source is TMP1?
Defective bearing, wear, damaged blades −−> Replace TMP.
□ Source is TMP2?
Defective bearing, wear, damaged blades −−> Replace TMP.
Hint
To determine between a noise source in TMP1 and TMP2, turn on just one of them.
A tool program is needed to turn the turbo molecular pumps on and off individually.
63
Problems during tuning
8. No peaks obtained (peaks extremely small)
Check the tuning file.
□ Are the lens voltage values appropriate?
Revert the lens voltages to the default values if unclear whether the tuning values are
appropriate.
The default values are as follows:
L1 1.0V / L2 -20V / L3 -1.5V / L4 -40V / P-Rod -3.5V / M-Rod -3.5V / FIL-EV -70V /
FIL-EM 60V / CDD -10000V / EM -900 ~ -1200V
Check the introduction of PFTBA.
□ Is the PFTBA volume appropriate?
Approximately 5mm from the bottom is appropriate.
□ Is the sound of the PFTBA valve opening and closing audible?
If no sound of valve operation is audible −−> Check MAIN CTRL-A.
Check the lens voltage.
□ Is each lens voltage output correct?
If any trace of peaks is apparent, set each voltage individually to 0V and check for
changes to the peak height.
If absolutely no peaks are visible, measure the
voltages at the checkpoints on MAIN CTRL-A.
Check the degree of vacuum.
□ Is the IG value within the normal range?
A value not exceeding 1 to 2E-3Pa is normal.
□ Appropriate GC column flow rate?
□ Large air components (m/z28, m/z32)?
See 6. Pirani gauge, IC value too high, IG does not light.
64
Problems during tuning
8. No peaks obtained (peaks extremely small) (cont.)
Check the ion source.
□ Is the ion source correctly installed?
Check if the ion source was distorted during installation.
□ Is any foreign matter inside the ion source?
Check inside the ion source for foreign matter, such as fragments of broken column.
□ Is the column length appropriate?
Normal ionization is not possible if the column is inserted too far into the ion source.
Check the RF power supply.
□ Are the RF GAIN and RF OFFSET values appropriate?
If no peaks are obtained, reduce the RF OFFSET value to about 4000.
This reduces the resolution but makes peaks easier to detect.
□ Is the RF power supply operating normally?
See section 4.11 RF PS Assy for details about how to check the RF power supply
operation.
Check the signal detection.
□ Does a small amount of noise appear in the peak monitor window when the
preamplifier is
tapped?
View the peak monitor at 999x zoom.
If no noise appears, check the detector wiring and the connections between the
preamplifier and CPU-A.
□ Does the baseline fluctuate in the peak monitor window when the filament turns on?
View the peak monitor at 999x zoom. If no baseline fluctuation appears, check
65
MAIN CTRL-A.
A variety of causes could lead to lack of signal output or small signals.
If the
problem is not resolved by the checks above, check each electrical unit in the
sequence below.
Vacuum system
Low degree of vacuum can lead to poor peak strength and unfamiliar peaks may appear.
Filament
In principle, defective control causes an error display.
Ion source
Defective insulation, defective assembly, or defective installation can result in no peaks.
Lenses
Defective electrical system or incorrect connection can result in no peaks.
Rods, RF source
Incorrect wiring or a defective electrical system can result in no peaks.
CDD
Incorrect wiring or a defective electrical system can result in almost no peaks.
EM
Incorrect wiring or a defective electrical system can result in no peaks.
Signal system
Incorrect wiring or a defective electrical system results in no response to vibrations.
66
Check the voltage settings.
Problems during tuning
9. Ion-source temperature does not rise or rises too high
Check the heater switch.
□ Is the heater switch in the ON position?
The heater switch automatically turns on during automatic startup.
If the CPU
determines that the heater switch is ON but the temperature is not rising, an error
message is displayed and the switch automatically turns OFF.
Check the following
items if this occurs.
The heater switch automatically turns OFF also when the temperature rises too high.
Also check the following items in this case.
If the heater switch was not ON during manual startup, turn ON the heater switch.
Check the temperature parameter.
□ Is the temperature control parameter correct?
The temperature control parameter is preset at the factory.
normally be changed.
The value should not
A normal IS??? parameter value should not be zero or
greater than four digits. If you are concerned about this parameter setting, use the
E2PROM restore procedure to revert the parameters to the backed-up status.
See Writing the E2PROM for details.
Check the ion source.
□ Conductivity of the heater?
□ Is the heater firmly fixed to the block?
□ Conductivity of the platinum sensor?
□ Is the platinum sensor firmly fixed to the block?
□ Is the box firmly fixed to the block?
Caution
The screws at the left must be tightened first when mounting the ion source.
The ion source cannot be correctly attached to the box if the screws at the right are
tightened first.
67
□ Is the wiring in contact with other wiring or panels?
Check the electrical circuits.
□ Is the IS CTRL-A temperature control circuit functioning correctly?
See section 4.7 IS CTRL-A Assy.
68
Problems during tuning
10. Error displayed after filament turns on
Display shows (090D) Trap/Total Current Low or (0D9C) Trap/Total Current Low.
□ Are the filaments mounted correctly?
Both filaments must be mounted correctly.
□ Do the PC settings match the actual ion source installed?
□ Is the ionization voltage sufficient for the emission current?
Refer to the System User Guide for the normal set range.
□ Are the filaments free of defects?
□ Is the column installed at the correct length?
Display shows (090F) High-voltage Power Supply Error, (0D9E) High-voltage Power Supply
Error Occurred, or (0DB2) Conversion Dynode Power Supply Error.
□ Is the detector wiring correctly connected?
□ Is the high-voltage power supply functioning normally?
See section 4.6 PCB Assy, Main CTRL-A.
Display shows (090E) High-frequency Power Supply Error.
□ Is the rod wiring correctly connected?
□ Has tuning been conducted correctly?
□ Is the RF power supply functioning normally?
See section 4.11 RF PS Assy.
Display shows (0DA0) Too Many Ions Entered Detector.
□ Is the detector voltage set correctly?
Display shows (0DAD) Filament 1 Burned Out or (0DAE) Filament 2 Burned Out.
□ Conductivity of the filament?
□ Check the operation of IS CTRL-A.
Caution
Incorrect mounting of the filament can dramatically reduce the filament life.
Always mount both filaments 1 and 2
69
4. Details of Electrical Circuits
Wiring Diagrams
1. Wiring diagram (Overall)
2. Wiring diagram (MAIN POWER ASSY)
3. Wiring diagram (Details)
Unit Operation Checks
4. MAIN POWER ASSY
5. DC POWER-A
6. PCB ASSY, MAIN CTRL-A
7. IS CTRL-A ASSY
8. HV PCB ASSY
9. PCB ASSY, IG CTRL-A
10. PCB ASSY, CPU-A
11. RF PS ASSY
12.PCB ASSY DI CYRL-A
13.RELAY BOX-A
70
Wiring Diagrams
1. Wiring diagram (Overall)
Wiring Diagrams
71
Wiring Diagrams
2. Wiring diagram (MAIN POWER ASSY)
72
Unit Operation Checks
3.Wiring diagram (Details)
73
Unit Operation Checks
4. MAIN POWER ASSY
Outline
The MAIN POWER ASSY uses switching power supplies to convert the supply voltage (100
to 240VAC) into the various supply voltages: DC POWER-A (±24V), IG CTRL-A (+5V), and
IS CTRL-A (+5V).
It incorporates a PCB that provides ON/OFF control of the rotary pumps
and turbo molecular pumps.
Operation Check Method
If an abnormality occurs, follow the procedure below to check the operation of the MAIN
POWER ASSY to efficiently diagnose the problem.
Caution
A voltage of 100 to 240VAC is supplied to the MAIN POWER ASSY.
To avoid electric
shocks or damage to the assembly, touch only the points instructed.
1. Checking the supply voltage
First, check that the power switch is in the OFF position.
Disconnect the MAIN POWER
ASSY cable connectors (Connectors c to j in the diagram) from the boards supplied or
from MAIN POWER.
Turn ON the power switch and measure the voltage at each
connector on the power line, as follows:
TMP1: Measure the voltage at Pin 1 of Connector c in the block diagram, relative to Pin 2.
(normal range: +22.7 to +25.3VDC)
TMP2: Measure the voltage at Pin 1 of Connector d in the block diagram, relative to Pin 2.
(normal range: +22.7 to +25.3VDC)
IS CTRL-A: Measure the voltage at Pin 3 of Connector e in the block diagram, relative to
Pin 1.
(normal range: +4.8 to +5.3VDC)
IG CTRL-A: Measure the voltage at Pin 3 of Connector f in the block diagram, relative to
Pin 1.
(normal range: +4.8 to +5.3VDC)
DC POWER-A: Measure the voltage at Pin 1 of Connector g in the block diagram, relative
to Pin 3.
(normal range: +22.7 to +25.3VDC)
74
Measure the voltage at Pin 5 of Connector g in the block diagram, relative to Pin 3.
(normal range: -22.7 to -25.3VDC)
If any abnormality is discovered in these voltages, check the switching power supply and
check the conductivity of the cable connections.
2. Checking the rotary pump (RP) ON/OFF control
Check RP1 and RP2 control using GCMSsolution.
Stop RP1 and RP2 using GCMSsolution.
the rear of the GCMS-QP2010.
Disconnect the RP1 cable and RP2 cable from
Measure the AC voltage across L and N of the RP1 outlet
at the rear of the GCMS-QP2010 to confirm that the voltage is 0V. Then, turn on RP1 and
again measure the voltage across L and N of the RP1 outlet to confirm that it is equal to the
instrument supply voltage.
Next, check RP2.
Measure the resistance across Pins 1 and 2 of the RP2 outlet to confirm
that they are insulated. Then, turn on RP2 and measure the resistance again to confirm
that the resistance does not exceed 5Ω.
If any abnormality is discovered in these checks and the MAIN POWER ASSY wiring is
normal, replace PUMP CTRL-A (225-11350-91).
3. Checking turbo molecular pump (TMP) ON/OFF control and the READY signal
Check TMP1 and TMP2 control using GCMSsolution.
Stop the evacuation system, disconnect connectors h and i from TURBO DRIVE.S
(TW300) and TURBO DRIVE.S (TW70H), and conduct automatic startup.
GCMSsolution that TMP 1 and TMP2 are on.
Check with
Measure the resistance across Pins 1 and 2
of the Connectors h and i outlet to confirm that the resistance does not exceed 10Ω.
A
resistance greater than 10Ω suggests a problem in a cable or in the PUMP-CTRL PCB
(225-11350-91).
Turn off TMP 1 and TMP2 using GCMSsolution and re-connect the connectors to their
correct positions.
Now, turn on TMP 1 and TMP2 again using GCMSsolution and confirm
that the TURBO DRIVE.S green READY LED light continuously. (Flashing indicates not
ready.)
The TURBO DRIVE.S green READY LED lit continuously but the GCMSsolution
indicating TURBO PUMP is NOT-READY suggests a problem in a cable (h, i, j) or in the
PUMP-CTRL PCB (225-11350-91).
75
MAIN POWER ASSY Block Diagram
Parts inside the broken box are in
the MAIN POWER ASSY.
76
Unit Operation Checks
5. DC POWER-A
Outline
DC POWER-A generates DC voltages for supply to CPU-A, PRE AMP-A, MAIN CTRL-A, IS
CTRL-A, RF GENE-A and DI CTRL-A.
Operation Check Method
If an abnormality occurs, follow the procedures below to check the operation of the DC
POWER-A PCB to efficiently diagnose the problem.
Caution
A voltage of 500VAC is supplied to the PCB.
To avoid electric shocks or damage to
the assembly, touch only the points instructed.
1. Checking the voltage supplied by the MAIN POWER ASSY
Check the voltages supplied by the MAIN POWER ASSY. The voltages are as follows,
when the chassis is grounded:
CP12 +24V (normal range: +22.7 to +25.3VDC)
CP14 -24V (normal range: -22.7 to -25.3VDC)
Abnormal supply voltages are probably due to a defective MAIN POWER ASSY.
Check
the MAIN POWER ASSY.
2. Checking the voltages generated by DC POWER-A.
The voltages are as follows, when the chassis is grounded:
CP1 -500V (normal range: -510 to -580VDC)
CP3 +500V (normal range: +510 to +580VDC)
CP4 +15V (normal range: +14.25 to +15.75VDC)
CP6 -15V (normal range: -14.25 to -15.75VDC)
CP7 +5V (normal range: +4.8 to +5.3VDC)
CP9 +60V (normal range: +57 to +68VDC)
CP11 -60V (normal range: -57 to -68VDC)
If the voltages above are not output, disconnect the connectors from J2 to J5, and repeat the
77
voltage check. If the output voltages are still not normal, the DC POWER PCB is probably
defective. Replace the DC POWER PCB. Conversely, if the voltages become correct
after the connectors are disconnected, the problem is probably in the cable supplying the
voltage or in the PCB receiving the voltage supply.
supply.
78
Check the cable and PCB receiving the
DC POWER-A Block Diagram
79
Unit Operation Checks
6. PCB ASSY, MAIN CTRL-A
Outline
MAIN CTRL-A generates the lens voltages, controls the solenoid valves, controls the
high-voltage supply, measures the vacuum with the Pirani gauge, and provides voltage
amplification functions for vacuum measurement using IG. It also functions as a relay
board between CPU-A and IS CTRL-A and DI CTRL-A.
Operation Check Method
If an abnormality occurs, follow the procedures below to check the operation of the MAIN
CTRL-A PCB to efficiently diagnose the problem.
Peak abnormality: Checks 1, 2, 3
Vacuum abnormality: 1, 4, 5
Caution
A voltage of C60VDC is supplied to the PCB. To avoid electric shocks or damage to
the assembly, touch only the points instructed.
1. Checking the supply voltages
Check the supply voltages.
The supply voltages are as follows, when the chassis is
grounded:
CP10 +15V (normal range: +14.25 to +15.75VDC)
CP13 -15V (normal range: -14.25 to -15.75VDC)
CP14 +24V (normal range: +22.7 to +25.3VDC)
CP29 +60V (normal range: +57 to +68VDC)
CP32 -60V (normal range: -57 to -68VDC)
2. Checking the lens voltages
Set the lens voltages with the Peak Monitor and confirm the output voltages at the check pin.
The normal output voltage lies in the range: set voltage ±5%.
CP16 LENS1 output voltage
CP30 LENS 2 output voltage
CP18 LENS 3 output voltage
CP31 LENS 4 output voltage
80
If the output voltages differ from the set voltages, check if the D/A voltages supplied from the
CPU PCB are correct.
CP23 = set voltage/1.5
CP26 = set voltage/5
CP24 = set voltage/1.5
CP25 = set voltage/5
Abnormal D/A voltages suggest a defective CPU PCB.
If the D/A voltages are normal but the output voltages are incorrect, conduct the following
checks to determine if the problem is caused by an abnormality in the lens voltage
generation circuits or by an abnormality in the vacuum vessel.
Turn off the power and disconnect the MAIN CTRL-A connector J8 to break the connection
with IS CTRL-A. Turn the power back on and repeat the lens output voltage check.
If the lens output voltages differ from the set voltages, the lens voltage generation circuits
are defective and the MAIN CTRL-A PCB should be replaced.
If the lens output voltages are the same as the set voltages, the lens wiring is probably
touching the inside of the vacuum vessel.
Open the door and check.
3. Checking the high-voltage power supply control circuits
EM HV circuits (-0.5 to -3kV)
Set the detector voltage and check the voltages at both CP4[V-EM] and CP2[FB-EM].
VCP4 should be 3 x detector voltage setting (kV). Any abnormality in this voltage is probably
due to incorrect D/A voltage from the CPU PCB.
Check that when EM HV is ON, VCP2=VCP4; when EM HV is OFF, VCP2・≒ 0V.
If the VCP2 voltage is generated whether EM HV is ON or OFF, this suggests a defective
controller operational amplifier.
Replace the MAIN CTRL PCB.
If VCP2 = 0V when EM HV is ON, the problem is probably in the high-voltage power supply
assy, or in the connector cables.
CD HV circuits (-1kV to -10kV power supply)
Check the mode.
The D9 photodiode lights green in the EI mode.
If the D9 photodiode lights red or does not light, the MAIN CTRL-A PCB is probably
defective.
Check the voltages.
Set the conversion dynode voltage and check the voltages at both CP3[V-CD] and
CP1[FB-CD].
81
VCP3 should be 1 x conversion dynode setting (kV). Any abnormality in this voltage is
probably due to incorrect D/A voltage from the CPU PCB.
Check that when CD HV is ON, VCP3=VCP1; when CD HV is OFF, VCP1 ≒ 0V.
If the VCP1 voltage is generated whether CD HV is ON or OFF, this suggests a defective
controller operational amplifier.
Replace the MAIN CTRL PCB.
If VCP1 = 0V when CD HV is ON, the problem is probably in the high-voltage power supply
assy, or in the connector cables.
82
4. Checking the Pirani gauge measurement control circuits
Check the operational amplifier power supply voltage.
CP9 +5V
Confirm that circuit output voltage is in the correct range.
CP8 0.47 to 2.84V (1 to 300Pa)
CP8 0.07V max.
(Voltage decreases as the pressure increases.)
Discontinuity in Pirani gauge.
Check the Pirani gauge resistance.
Disconnect the Pirani gauge cable from the MAIN CTRL-A PCB connector J5 and measure
the resistance between Pins 1 and 2.
The normal resistance is 10 to 15Ω.
5. Checking the ion-gauge vacuum measurement circuit
If measurements seem incorrect, check the output from the ion-gauge collector current
amplifier circuit.
CP6 [IG1]
A degree of vacuum in the range 1.3x10⁻³ to1.3x10-1Pa is determined from the voltage VCP6.
Degree of vacuum (Pa) = 3.33x10⁻² x VCP6
When the degree of vacuum exceeds 1.3x10⁻¹Pa (VCP6≥4V), the filament is turned off for
protection.
CP7 [IG100]
A degree of vacuum below 1.3x10⁻³Pa is determined from the voltage VCP7.
Degree of vacuum (Pa) = 3.28x10⁻⁴ x VCP7
A discontinuity in the ion-gauge measurement bulb or connection cable is evaluated if VCP7
is 0.1V or less, and the ion-gauge filament is turned off.
Inspect the cable between the
measurement bulb and connector J4 on the MAIN CTRL-A PCB.
Check the ion-gauge control circuit (IG CTRL-A) if the ion-gauge measurement bulb filament
does not light.
83
MAIN CTRL-A Block Diagram
84
85
Unit Operation Checks
7. IS CTRL-A ASSY
Outline
IS CTRL-A provides functions for filament control and ion-source temperature control. It
also functions as a relay board to introduce the lens voltages sent from MAIN CTRL-A into
the vacuum vessel.
Filament control (EI mode)
If one filament is selected, the other filament can be used as a trap electrode.
The filament
potential (emission voltage) and the amount of thermoelectrons emitted from the filament
(emission current) are set using D/A. When the filament is turned on, current flows into the
filament, causing the emission of thermoelectrons.
A proportion of these reach the trap
electrode that is held at a potential of +10V, and are measured as the trap current.
An error
amplifier operates to control the filament current to maintain the trap current equal to the set
emission current value.
Ion-source temperature control adjustment
The voltage applied to the heater is proportional to the duty ratio of the PWM waveform
generated by the CPU. A platinum (Pt) sensor measures the temperature.
Operation Check Method
If an abnormality occurs, follow the procedures below to check the operation of the IS
CTRL-A PCB to efficiently diagnose the problem.
Signal peak abnormality: Checks 1, 2, 3, 4, 5
Ion-source temperature abnormality: Checks 1, 6, 7
Caution
A voltage of -200VDC is supplied to the PCB.
To avoid electric shocks or damage to
the assembly, touch only the points instructed.
1. Checking the supply voltages
CP3 +15V (normal range: +14.25 to +15.75VDC)
CP5 -15V (normal range: -14.25 to -15.75VDC)
CP9 +24V (normal range: +22.7 to +25.3VDC)
When CP6 is measured with respect CP7: +5V (normal range: +4.9 to +5.3V when filament
is off)
2. Checking the lens voltages
86
Set the lens voltages with the Peak Monitor and confirm the output voltages at the
feedthrough contacts on the IS CTRL-A PCB.
The normal output voltage lies in the range: set voltage ±5%.
LENS1, LENS2, LENS3, LENS4
If the output voltages do not lie within the set ranges, conduct the checks described in 2.
Checking the lens voltages for MAIN CTRL-A (page 60).
3. Checking the filament currents
When a filament is on, the filament current can be determined from the following voltage
measurements. The relationship between the filament current and the voltage measured
with the tester + probe on CP16[FIL] and the - probe on CP18[EV] is as follows:
Filament current (A) = 2 x (VCP16 – VCP18)
max about 3.5A
If (VCP16 – VCP18) = 1.4V, the filament current is 2.8A.
A filament discontinuity is detected and an error occurs if (VCP16 – VCP18)≤approx. 0.6V, that
is if the filament current ≤approx. 1.2A.
The discontinuity in the filament can be easily confirmed by the following method.
Turn off the filament and measure the resistance between F1+ and F1-.
If resistance value ≤1Ω, the filament is normal.
Be aware of the polarity when measuring the resistance; correct measurement is only
possible by applying a positive voltage to F1+ and a negative voltage to F1-.
If the polarity
is unknown, turn off the instrument power, remove IS CTRL-A to eliminate the influence of its
circuits and measure the resistance directly at the feedthrough terminals.
4. Checking the TRAP current control circuit
Set the emission current, turn the filament on, and measure the voltages at CP12[EMC],
CP13[TRP], and CP14[+10A].
If VCP14≠10V, the IS CTRL-A PCB is probably defective.
VCP12=set current(µA)/100
If emission current = 60µA, VCP12=0.6V.
Any abnormality suggests an incorrect D/A voltage from the CPU PCB.
VCP12=VCP13
Any abnormality could be due to a filament discontinuity or incorrect installation.
5. Checking the emission voltage control circuit
This circuit generates the emission voltage (-10V to -200V).
Set the emission voltage, turn the filament on, and measure the voltages at CP15[EMV],
CP18[EV], and CP19[INV].
VCP15= 0.05 x set voltage (V)
If emission voltage = -70V, VCP15=-3.5V.
87
Any abnormality suggests an incorrect D/A voltage from the CPU PCB.
VCP18= set voltage (V)
A voltage in the range set voltage ±10% is normal.
If abnormal, check the voltage VCP19.
If VCP19 is not in the range +1 to +15V, the IS CTRL PCB is probably defective.
If the VCP19 voltage is in the normal range but VCP18 ≠set voltage, the filament wiring is
probably touching another electrode inside the vacuum vessel.
6. Checking the heater circuit
The ion-source heater operates on 24VDC.
No temperature rise when the ion-source temperature is set and the heater should be
operating could be due to a heater discontinuity, short-circuit, disconnected wiring, or
incorrectly installed heater temperature sensor.
Follow the procedure below to diagnose
problems with the heater.
Check that the CP2 voltage = +19±1V.
If abnormal, replace IS CTRL-A.
Measure the voltage applied to the heater at the feedthrough contacts on the IS CTRL-A
PCB.
HT+
HT-
Heater + voltage (0 to +24V)
Approximately 24V during heating.
Heater - voltage (0V)
The IS CTRL-A PCB is normal if a voltage is applied to HT+.
If the voltage at HT is approximately 0V, a short-circuit has probably occurred in the vacuum
vessel.
Turn off the heater with the tool program. (The sound of the relay on IS CTRL-A operating
should be audible.)
Check that the voltage at HT+ is 0V, and then measure the resistance
across HT+ and HT- using the tester resistance mode.
A resistance of 15 to 25Ω is normal. Be aware of the polarity when measuring the
resistance; correct measurement is only possible by applying a positive voltage to HT+ and
a negative voltage to HT-.
If the polarity is unknown, turn off the instrument power, remove
IS CTRL-A to eliminate the influence of its circuits and measure the resistance directly at the
feedthrough terminals.
Observe the CP1[PWM] waveform with an oscilloscope.
This is normal if an ON/OFF PWM waveform between 19 and 24V is observed, and the HT+
output voltage is approximately proportional to the duty ratio of the PWM waveform (0 to
100%: 0 to 24V).
An abnormal PWM waveform suggests a defective CPU PCB or MAIN CTRL-A PCB.
7. Checking the ion-source temperature measurement circuit
88
The temperature sensor is a platinum (Pt) sensor.
Check the voltage at CP8[TEMP].
VCP8≥4V suggests a discontinuity in the platinum sensor or its wiring.
VCP8≒0V suggests a short-circuit in the platinum sensor or its wiring.
The resistance of the platinum sensor varies approximately linearly from 100 to 250Ω in the
temperature range from 0 to 400MC.
Approximate expressions : RPt(Ω) = 0.37 x T (MC) + 100
VCP8 = 15 x RPt /(1000+RPt)
Any large discrepancy from these relationships suggests an abnormality in the temperature
measurement circuit.
Replace IS CTRL-A.
89
IS-CTRL-A Block Diagram
90
Unit Operation Checks
8. HV PCB ASSY
Outline
HV PCB ASSY have the function that produces the high voltage of detection. MAIN CTRL-A
have the function that controls the voltage and on/off that occur.
HV PCB ASSY are being fixed inch a normal device, that is ,EI mode.
HV PCB ASSY, NCI(225-11195-92 ) are being fixed in a NCI option.
CD(Conversion dinode) HV Circuit is swictching power supply POS(1 to 10kv for NCI)and
NEG(-1 to -10kv for EI and CI).
Detector voltage(EM)=-0.5kV∼-3kV
Conversion di-node voltage ( CD)=-1kV∼-10kV or+1kV∼+10kV
Detection device lens voltage=0.084×conversion di-node voltage
Action confirmation method
If an abnormality occurs, follow the procedures below to check the operation of the HV
PCB ASSY to efficiently diagnose the problem.
Please refer to even the item of "the confirmation of
MAIN CTRL-A high pressure power
supply control circuit".
CAUTION!
The voltage on a foundation becomes biggest 10kV with DC. Please do not touch on
unpreparedness, Because of the damage prevention of electric shock prevention,
measurement devices.
Please turn off the power supply when I remove a foundation.
Next, please
discharge the remaining electric charge of a high voltage terminal in body with an
electric wire and driver etc.
And, please do so that it touches.
1.Confirmation of the electric discharge by insulation defectiveness
Please turn off EM and CD On a service program.
And, please confirm the presence of the sound by an electric discharge.
It is thought as the insulation defectiveness of HV PCB ASSY, when it is heard as the sound
that discharges is occurring outside a vacuum vessel.
91
In this case、You had better
exchange this part.
Please confirm the following, at the time of such that an electric discharge is occurring in a
vacuum vessel.
Please suspend a device.
You had better confirm whether dust is not adhering, whether or
not wiring is appropriate after takes out a detection device unit.
There is case that is not determined as an error in the electric discharge of a weak electric
discharge and period absence.
The attention is necessary.
2.Confirmation of the wiring within a vacuum vessel
Please confirm whether or not, the output of the high voltage power supply is out with the
next method.
You monitor the base line of the condition of filament off with a service program.
Please turn on only EM.
EM is normal if the base line is goes up a moment.
Please turn on only a CD.
If the base line goes up a moment in the case of an UNNCI
mode (-1kV∼-10kV) ,the CD is normal.
If the base line descends a moment conversely in a NCI mode (+1kV∼+10kV),
The CD
is normal.
When the base line does not fluctuate normally 、it stops the device and take out the
detection device unit and confirm please whether wiring is not coming off.
When you turned on EM and CD, in the case that an error occurs, next malfunction of a part
is thought about whether someday.
The short circuit of the wiring inside a vacuum vessel is conceivable as the cause of
defectiveness.
Or, it is conceivable as the cause of the defectiveness of HV PCB ASSY.
Besides, it is conceivable as the cause of the defectiveness of MAIN CTRL-A.
3.Confirmation of voltage
In the case that there is a high voltage measuring apparatus, The voltage of a high pressure
terminal is able to be confirmed directly.
Do not conduct it because the measurement by a general tester is dangerous.
Please set up each detection device voltage(EM), conversion voltage(CD).
Please confirm voltage, with each next terminal.
Detection device voltage
Measurement point: J11 [EM]
Inside resistance: 100 [k Ω]
92
Conversion dinode voltage
Measurement point: J12 [CD]
Inside resistance: 33M Ω
Detection device lens voltage
Measurement point:
Field through Electrode
Detection device lens voltage=0.084×conversion dinode voltage
Conversion dinode voltage, becomes big 220V each to every measure current 1uA.
When some extent is exceeded、 it becomes a high pressure power supply error.
Please pay attention to the input resistance of ameasuring apparatus.
93
HV PCB ASSY block diagram
(1)
UNNCI case of model (EI,CI)
(2)
NCI case of model (NCI)
94
Unit Operation Checks
9. PCB ASSY, IG CTRL-A
Outline
IG CTRL-A lights the ion-gauge measurement bulb (IG bulb) filament and generates the grid
voltages.
The MAIN CTRL-A PCB offers the functions to measure the collector current to
determine the degree of vacuum.
When the filament lights, thermoelectrons are
discharged toward a grid held at a potential of +150V, resulting in a current from the grid to
the filament (grid current).
As the filament is lit by a power supply with a floating potential,
the grid current flows toward earth potential in the IG CTRL-A circuit.
This circuit adjusts
the current flowing through the filament to maintain a 1mA grid current flow to earth potential.
The grid current flows through a Zener diode, which increases the filament potential above
earth potential by the amount (Zener voltage + voltage drop in the current detector
resistance), giving a potential of +25V at a 1mA grid current.
The degree of vacuum is
determined from the amount of positive ions captured at the earth-potential collector
electrode.
Operation Check Method
If an abnormality occurs, follow the procedures below to check the operation of the IG
CTRL-A PCB to efficiently diagnose the problem.
In case of abnormal degree of vacuum measured values, see the item Checking the
ion-gauge vacuum measurement circuit for the MAIN CTRL-A PCB (page 62).
Caution
A voltage over +150VDC is supplied to the PCB.
To avoid electric shocks or damage
to the assembly, touch only the points instructed.
1. Checking the installation
One of the four screws locating the IG CTRL-A PCB acts to earth the PCB to the chassis.
Current flows may be interrupted if this screw is loose.
Be sure to correctly tighten these
screws.
Check there is no looseness in the connector socket contacts where the IG bulb pins are
inserted.
95
2. Checking the voltages
Measure the voltage with the tester + probe on CP1[F+5VIG] and the - probe on
CP2[F0VIG].
The normal voltage range when IG is off is +4.9 to +5.3V.
drops slightly when IG turns on.
96
The voltage
3. Checking the grid and filament voltages
Turn IG on with the tool program and measure the grid and filament voltages (CP4[GRID],
CP5[FIL-], CP3[FIL+]). These voltages can also be measured at the IC bulb connector.
Check the grid.
Voltage across CP4[GRID] and IG bulb, Pin 4 = 15010±V
Pull out the IG connector if VCP4 is abnormal.
If VCP4 becomes normal, replace the IG bulb.
If the voltage remains abnormal after the connector is disconnected, replace the IG CTRL-A
PCB.
Check the filament.
If the filament does not light, turn IG off and measure the resistance between Pin 3 and Pin 5
of the IG bulb.
The resistance should not exceed 1Ω.
Replace the IG bulb if the
resistance is abnormal.
If the filament does light:
Voltage across CP5[FIL-] and IG bulb, Pin 5 = 251±V
An abnormal VCP5 value indicates an abnormal grid current. Replace the IG CTRL-A PCB.
If the filament is normal : Filament voltage (VCP3 – VCP5) = 3.0 to 4.0V
97
IG CTRL-A PCB Block Diagram
98
Unit Operation Checks
10. PCB ASSY, CPU-A
Outline
CPU-A provides overall control of the system.
Most PCB operations can be monitored at the PC.
1. Checking the supply voltages
Check the supply voltages.
The voltages should be as follows, when the chassis is
grounded.
J6(1) +15V (normal range: +14.25 to +15.75V)
J6(2) GND
J6(3) -15V (normal range: -14.25 to -15.75V)
J6(4) GND
J6(5) +5V (normal range: +4.8 to +5.3V)
2. Checking the operation
Turn on the PC, select Start, Settings, Control Panel to open the Control Panel.
System and then click the Hardware tab and the Device Manager button.
Confirm that GCMS-QP2010 is listed, as shown below.
If GCMS-QP2010 appears correctly, check that the tool software runs.
99
Select
Explanation
CPU-A incorporates the functions below.
Function
Description
Comments
CPU
DRAM
4MB
E2PROM
Temperature sensor
IEEE1394
1 port
For PC communications
EIA232
1 port
For GC communications
ADC
10Bit 8CH
Built into CPU
16Bit 1CH
For data acquisition
Integrator
FPGA
DAC
12Bit 12CH
16Bit 1CH
For RF settings
It is almost certain that CPU, DRAM, and IEEE1394 are operating correctly if the device
100
drivers are installed. Similarly, the E2PROM is probably operating correctly if the turbo
molecular pump accumulated time is correctly calculated. EIA232 is operating correctly if
GC communications are conducted normally.
ADC and DAC operation can be confirmed
on PCBs besides CPU-A.
Checking the DIP switches
CPU-A has two sets of DIP switches.
The relationship between the DIP switch settings and operating mode are shown in the table
below.
SW1
SW2
Operating mode
Application
OFF
OFF
MCU mode2
Not used (rewriting Flash ROM not possible)
ON
OFF
User program mode
Factory setting (rewriting Flash ROM possible)
OFF
ON
MCU mode0
Under development
ON
ON
Boot mode
To rewrite Flash ROM during boot up
Normally, leave the factory setting unchanged.
The Boot mode is used during manufacture
or when CPU-A cannot be rebooted due to unsuccessful rewriting of the Flash ROM.
101
Unit Operation Checks
11. RF PS ASSY
Outline
The RF PS ASSY generates the high frequencies applied to the main rod and pre-rod.
As shown in the block diagram, the main rod comprises a pair of opposing poles maintained
at the same potential, to which the following voltages are applied:
A pole = high-frequency (V) + DC voltage (U) + AC voltage (AC) + bias voltage
B pole = high-frequency (-V) + DC voltage (-U) + AC voltage (-AC) + bias voltage
(Where high-frequency = 1.05MHz, AC=52.5kHz.)
Only the high-frequency and bias voltage are applied to the pre-rod.
Operation Check Method
If an abnormality occurs, follow the procedure below to check the operation of the RF PS
ASSY to efficiently diagnose the problem.
Caution
A ±2500V high-frequency voltage and±500VDC are supplied to the RF PS ASSY.
To avoid electric shocks or damage to the assembly, touch only the points instructed.
Caution! Static Electricity
The RF PS ASSY contains parts that are sensitive to electrostatic discharge (ESD).
Static electricity at 4000V or more can easily accumulate on the human body and be
discharged.
D3 to D6 on the RF GENE-A PCB can withstand only 10V static electricity.
Take the appropriate ESD countermeasures when replacing RF GENE-A.
1. Checking the supply voltages
Check the supply voltages.
The voltages should be as follows, when the chassis is
grounded.
CP1 +15V (normal range: +14.25 to +15.75VDC)
CP2 -15V (normal range: -14.25 to -15.75VDC)
CP3 +500V (normal range: +510 to +580VDC)
CP5 -500V (normal range: -510 to -580VDC)
102
CP6 -24V (normal range: -22.7 to -25.3VDC)
CP7 +24V (normal range: +22.7 to +25.3VDC)
CP12 +5V (normal range: +4.8 to +5.3VDC)
103
2. Checking the tuning
Use the tool software to check if the tuning is correct.
If tuning is correct (if the screen value valley can be confirmed by turning the core trimmer) it
is safe to judge that the circuits related to the RF power-supply high frequency (V) are
normal.
Conversely, if the tuning is not correct, the high-frequency-related circuits are defective or
the load is abnormal.
Check the wiring around the QP rod.
Explanation
When the RF value is set with the tool software, the set voltage is output from CP8[V-RF]
(approximately 4.58V at m/z500).
1.05MHz is output when the RF output turns on, and a sine wave is output from CP13 to
create a proportional relationship between the set value and high-frequency wave detection
feedback value CP4[FB].
If the proportional relationship is not maintained, output CP16
goes out of range and an error signal is output.
CP13 is connected to the primary side of the coil and outputs an approximately 50 to 70VP-P
sine wave at a setting of m/z500. The value monitored by the tool software is the value
read from CP14.
3. Checking the U voltage
If the check of the tuning indicated that the V voltage is correct, next check the U voltage.
When the main rod bias is set to m/z500 at -3.5V, check that the CP10[U1] and CP9[U2]
values are approximately 204V at the positive side and approximately -210V at the negative
side. It is recommended to use the Tuning Check window to make the RF setting (because
RF scanning is conducted from other windows). The RF setting changes due to switching
the positive and negative polarity (A or B) and due to the ionization mode (positive or
negative).
Explanation
As the U voltage is generated from a feedback output, if the U voltage is correct, then the V
voltage must also be correct.
(This provides reconfirmation.)
error signal if the U voltage is not output.
RF GENE-A outputs no
Consequently, the U voltage output should be
suspected if no peaks are obtained but the RF power supply outputs no error.
4. Adjusting the trimmers
104
If the checks above are all satisfactory but still no peaks are obtained, possibly the settings
of trimmers VR1 and VR2 are seriously wrong.
In this case, turn VR1 while monitoring the
low mass numbers m/z18 and m/z28 to obtain equal peak amplitudes.
If this adjustment is
not possible even by fully turning VR1, switch JP1 and attempt the adjustment again.
Repeat the adjustment with 1) JP1 unshorted, 2) 1 to 2 shorted, and 3) 2 to 3 shorted. If
equal peak amplitudes are achieved, conduct fine adjustment of the trimmers using the tool
software.
105
5. Checking the AC voltage
The AC voltage is normal if 2 to 3VP-P is output from CP15[AC] when m/z500 is set. (It
fluctuates due to AC adjustment.)
6. Checking the pre-rod bias
The pre-rod bias is normal if JT1[PRE] is within pre-rod bias set value ±10%.
RF GENE-A Block Diagram
M4(2/2)
CP8[RF]
CP16[E AMP]
Limit Switch
R27
VR2[M/Z]
ERR-RF
R24,R25
V-RF
J4-1
Q13,14,15
CP14[MON]
R26
Q11,12
+
-
RF2
RF1
J4-2
OUT RF
RF2
1.05MHz
VR1[RF]
RF1
MAIN ROD
CP13[V]
M4(1/2)
Rectification
CP11[A CLK]
CP4[FB]
M6(1/2) CP15[AC]
M8
XON-RF
X 1
52.5KHz
V-AC
M7
X -1
M6(2/2)
M3(2/2)
M1(2/2),Q3,4
CP10[U1]
V-RESO
PRE ROD
J4-4
M2(1/2)
V-MROD
M3(1/2)
CP9[U2]
X -1
J4-6
M2(2/2)
M1(1/2),Q5,Q6
V-PROD
PRE
POL-RF
106
Unit Operation Checks
12. PCB ASSY,DI CTRL-A
Outline
DI CTRL-A has the next function.
There is a illumination of amplification and, LED of the heat electromotive force of heater
voltage occurrence and, TC of DI probe and it is the function such as the recognition of a DI
option furthermore.
DI option is recognized when the circle style connector of the tip of the cable that is out from
the DI introduction is connected to a DI CTRL-A foundation.
This recognition is conducted, when draw out a circle style connector and also shone.
The condition of DI probe is not related.
When DI probe is inserted and a temperature program be started,
Producing the voltage corresponding to the Duty ratio of the PWM signal that is sent from a
CPU it supplies it to a heater.
The heat electromotive force of TC that was built to probe is
amplified with an amplifier 200 times.
It is used to temperature measurement.
Action confirmation method
There be some abnormality and please do with the following procedure in the case that the
action of DI CTRL-A is confirmed.
Rationally malfunctioning normal judgment is possible.
1.Confirmation of power supply voltage
CP5 +15V (+14.25V∼+15.75V
CP6 -15V (-14.25V∼-15.75V
CP8 +24V(+22.7V∼+25.3V
is normal)
is normal)
is normal)
0V with CP7, CP9
2.Confirmation of heater voltage
CP3[+19VD]:+19V
If this voltage is constantly be not out ,it is not possible heater heating.
It is the abnormality of a DI CTRL-A foundation.
It is as follows during DI probe heating.
CP2[PWM-DI]:Frequency 50kHz
PWM wave-like between voltage level+19V/24V
CP4[V-HT]:
Heater voltage of probe
107
According to PWM of Duty in comparison to 0∼100%, 0 voltage,∼+24V comes out.
3.Confirmation of a TC temperature measurement circuit
It is the voltage amplifier of 200 times.
CP1[TMP-DI]:
Voltage ≒ 0.008×(measurement temperature ℃-23) it becomes.
( 0.8V at the time
of123℃ )
When DI probe comes off and TC is not connected and, when TC be snapping ,it becomes
4.8V over.
The voltage of CP1 TMP-DI can be measured even with checkpoint CP11 [TMP DI] on a
MAIN CTRL-A foundation.
In the case that the CP11 voltage on the CP1 voltage and MAIN CTRL-A on DI CTRL-A do
not agree,
The defectiveness of the buffer amplifier on defective or MAIN CTRL-A of
connection cable is conceivable.
4.Confirmation of LED illumination
The control of the illumination of LED is not DI CTRL-A. The control of the illumination of
LED is conducted with MAIN CTRL-A.
In the case that LED is not lighted connection defective etc. of the cable between defective,
DI-MAIN of defective, probe of introduction cable are conceivable.
5.Confirmation of automatic recognition
The automatic recognition of DI option conducts it with the presence of the installation of the
connection connector with the introduction.
In the case that it is not recognized automatic the connection defectiveness of the cable
between defective, or DI-MAIN of introduction cable is conceivable.
108
DI CTRL-A block diagram
109
Unit Operation Checks
13. RELAY BOX-A
Outline
On/off of rotary pump 2 (RP2) that uses it with DI option in RELAY BOX-A is conducted.
The relay point of contact signal is sent to the RP2 CTRL connector of the device back.
On/off of RP2 is controlled in accordance with the on/off.
Action confirmation method
There be some abnormality and malfunction rationally, when I do it with the following
procedure in the case that the action of RELAY BOX-A is confirmed and the normal
judgment is possible.
CAUTION!
The voltage of the inside becomes AC100∼240V.
Please pay attention sufficient when the inside is confirmed due to the damage
prevention of electric shock prevention, measurement devices.
1.Confirmation of power supply voltage
Whether the power supply voltage that is using it, with the power supply voltage that is
written to
RELAY BOX epitaph board be agreeing is confirmed.
2.Confirmation of RP2 CTRL
Please turn on RP2.
Please confirm that 2 pin of the RP2 CTRL connectors of the for device back are connected.
Please turn off RP2.
Please confirm that 2 pin of the RP2 CTRL connectors of the device
back for, are not connected.
Power supply voltage is out, to the cable of RP2 CTRL that is growing from RELAY BOX.
Please quit because it invites the accident such as an electric shock to draw a terminal and
confirm an action.
3.Confirmation of
no fuse breaker
No fuse breaker is attached for overcurrent protection.
In the case that the no fuse breaker is acting there are
the faulty or inside wiring of a rotary pump.
possibility such as the accident of
Please cause to return a no fuse breaker, after
110
the cause of an overcurrent is removed.
4.Confirmation of the inside
The wiring and tab terminal inside RELAY BOX confirm whether they are not coming off.
RELAY BOX-A block diagram
111
5. Appendices
1. Precautions during maintenance work
2. Adjustment in the high mass-number range
3. Detailed explanation of CI and NCI
4. Installation Guidelines (including List of Service Parts
and Consumables)
5. Installation Completion Checksheet
6. How to change Turbopump
112
1. Precautions during maintenance work
Replacing CPU-A
□ Restore the backed up E2PROM contents.
□ Upgrade the Flash ROM, if required.
Replacing RF PS Assy
□ Sensitive to static electricity. Take care.
□ Conduct tuning.
□ Adjust according to the RF power supply adjustment.
Replacing a turbo molecular pump (TMP)
□ Reset the TMP operating time.
Replacing a rotary pump (RP)
□ Reset the RP operating time.
Reference
Approximate Maintenance Plan (Units: months)
Item
3
6
9
12
15
18
21
24
27
30
33
36
RP oil
*
*
*
*
*
*
*
*
*
*
*
*
Clean ion-source
*
*
*
*
*
*
GC trap
*
*
*
*
*
*
GC molecular
sieve filter
*
*
*
RP overhaul
*
*
Clean lenses
*
*
Clean pre-rod
*
*
Detector
*
IG
*
PG
*
TMP overhaul
*
113
2. Adjustment in the high mass-number range
This instrument incorporates an auto-tuning function that conducts mass-number calibration
at m/z614.
Mass-number displacement is rare in the normal range of operation (up to
approximately m/z700.)
However, displacement from the calibration at m/z is possible in the high mass-number
range.
Ensuring accurate calibration in the range m/z700 to m/z1000 requires manual calibration
by injecting a triazine (Tris(perfluoroheptyi)-S-triazine) high-mass-number standard sample
into the column.
Procedure
Instrument conditions
Sample: triazine 1% solution in acetone, ultrasonically mixed
INJ: 250MC
COL: 50MC (1 min.)-5MC /min-100 MC (1min)-30MC /min-250MC (10min)
I/F: 250MC
Ion source: 200MC
Column head pressure: 100kPa
Total flow rate: 30mL/minute
Splitless injection (1 min. sampling)
Triazine flow time is approximately 3 minutes between minute 11 and minute 15
c Take 1µL triazine sample into a syringe and inject it into INJ.
Wipe any sample from
the syringe tip before injecting the sample.
d Monitor m/z771, 886, and 1016 on the Peak Monitor window.
Leave the filament off
for the first five minutes after sample injection, turn the filament on, and wait for the
peaks to appear.
e The triazine peak can be seen for the three minutes between minute 11 and minute 15.
Check the mass number (within C0.3 mass) and resolution (FWHM resolution 0.1M
max.).
Conduct manual compensation, if necessary.
f After making this check, increase the column temperature to 250MC to drive out the
triazine. Ten minutes at 250MC is insufficient, conduct this process for 1 hour at
250MC.
Caution) Traces of the injected triazine may remain in the sample lines and
hinder subsequent analysis.
Allow the column to age overnight at
250MC before conducting ultramicroanalysis.
114
Degree of residue
After driving the triazine out of the column for one hour at 250MC, SCAN data
measurements (approx. 1ppm) can be conducted without hindrance.
Aging for 2 to 3 hours at 250MC is recommended for microanalysis (SIM
measurement 100ppb or below) but aging overnight is recommended for
ultramicroanalysis (10ppb or below).
Reference)
High-mass-number standard sample TRIS 0.5g
Tris(perfluoroheptyl)-S-triazine-Maas-Spec
(P/N 225-09493-01)
Standard sample
PFTBA 5g
Perfluorotributylamine
(P/N 225-09493-03)
115
ZEBV-5020C
3. Detailed explanation of CI and NCI
Model
There are three types of QP2010 dependent on the types of ionization.
Ver. 2.1 of the GCMSsolution is required to use the CI, NCI, and DI option.
Description
Notes
Part Number
GCMS-QP2010,
The rotary pump RP1 must be 225-10040-xx
EI without RP
obtained separately. Order the -92: 115V
GCMSsolution Ver. 2.1 system -34: 230V*
package together.
GCMS-QP2010c,
The rotary pump RP1 must be 225-10041-xx
EI and CI without RP
obtained separately. Order the -92: 115V
GCMSsolution Ver. 2.1 system -34: 230V*
package together. Ver. 2.1 of the
GCMSsolution is required to use the
CI.
GCMS-QP2010nc,
The rotary pump RP1 must be 225-10042-xx
EI, CI, and NCI without RP obtained separately. Order the -92: 115V
GCMSsolution Ver. 2.1 system -34: 230V*
package together. Ver. 2.1 of the
GCMSsolution is required to use the
CI and NCI.
GCMSsolution Ver. 2.1 Order this system package together 225-06628-92
system package
with GCMS-QP2010 main frame.
Ver. 2.1 of the GCMSsolution is
required to use the CI, NCI, and DI
option.
Remarks
C7
*CE marked
C7
*CE marked
C7
*CE marked
C7
Major different points from 5050A
EI and CI (SEI, SCI) can be simulated using the NCI ion source (for the NCI equipped model
only)
Simulated CI (SCI) mode in NCI ion source is added.
Ionization mode can be selected from SEI, SCI and NCI by indication from PC in NCI ion
source.
Note : SEI in CI ion source is not available.
Selection of reagent gases
QP2010 has two inlet lines for reagent gas. Selection of reagent gas is available from two
types of gas by switching the inlet line from PC.
RP2 is unnecessary for CI and NCI
The rotary pump, which is a backing pump for TMPs, evacuates the reagent gas line at the
same time.
Specification
[1] CI
1. Sensitivity
100pg benzophenone
Quasi-molecular ion S/N>150 at M/Z183 (RMS)
Reagent gas: methane, Scan range: 100-250u, Interval: 0.6sec
2. Reagent gas
Methane, isobutane, ammonia
3. Ion source
Ion source box exchange type
4.
Reagent
gas 2 line system
introduction system
5. Auto-tuning
Capable
6. Max. column flow 5mL/min (restricted compared to EI to allow introduction of the
rate (He)
reagent gas)
[2] NCI
1. Sensitivity
100fg octafluoronaphthalene
Molecular ion S/N>100 at M/Z272 (RMS)
Reagent gas: methane, Scan range: 200-300u, Interval: 0.5sec
2. Reagent gas
Methane, isobutane, ammonia
3. Ion source
Ion source box exchange type. Simulated EI (SEI*) and
simulated CI (SCI*) spectra can be collected using the NCI ion
source box.
* SEI and SCI are modes which simulate EI and CI ionization
respectively using the NCI ion source. The ionization method
can be easily changed from the software. However, note that,
compared to a dedicated ion source, the signal intensity may be
reduced and the mass spectrum pattern may differ. A dedicated
ion source must be used in analyses requiring sensitivity and
precision.
4.
Reagent
gas 2 line system
introduction system
5. Auto-tuning
Capable
6. Max. column flow 5mL/min (restricted compared to EI to allow introduction of the
rate (He)
reagent gas)
108
Change from EI model
Interface
The interface for CI/NCI is different from that for EI, because reagent gas is introduced
through interface in QP2010.
Reagent gas controller
Resistance tube
IG
A1
1
Reagent gas
B
CI controller
TW300
TW70
A2
Reagent gas
PG
E2M1.5 RP
Evacuation line
of reagent gas
CI ion source / NCI ion source
Small hole
This part of the NCI ion
source is tapered
Φ4mm
For EI
Φ0.8mm
Φ1.2mm
For CI
For NCI
REPELLER2 is include REPELLER assy in front of ion sorce.
REPELLER2 is different from EI and PCI and NCI(SEI,SCI) and DI.
REPELLER2 EI
REPELLER2 CI, NCI
109
Include CI
accesory
REPELLER2 CI ,NCI(DI)
High voltage power supply for NCI
Relay
FOR EI and CI
FOR EI and CI
and NCI
High voltage board
for detecting
positive ions
High voltage board
for NCI; both positive
& negative voltages
110
4.Shimadzu Gas Chromatograph Mass Spectrometer
GCMS-QP2010
Installation Guidelines
(Installation Preparations and Checks)
Analytical Instruments Division
SHIMADZU CORPORATION
111
1. Introduction
These installation guidelines summarize the preparations that the customer should
make to smooth the installation of the delivered GCMS-QP2010.
Please follow these guidelines to ensure safety, reliable analysis, and long use of the
instrument.
2. Installation example
The diagram on the next page shows the example of a standard GCMS-QP2010
configuration installed on a table. (The oil rotary pump i is located on the floor.)
Leave a space of at least 300mm between the rear edge of the table and the wall for
the following reasons:
(1) to position the oil rotary pump;
(2) for the discharge of hot air during column-oven cooling;
(3) for maintenance.
Also, for inspection and maintenance purposes, leave a space of at least 400mm at
the left of the table.
3. Installation room conditions
Temperature
Guaranteed within specification 18 to 28MC (constant)
Guaranteed operation 15 to 35MC (*)
Choose a location not subject to direct sunlight or air-conditioner
output.
During normal analysis, the instrument generates approximately
1.5kW.
(*) The instrument will operate across the guaranteed operation
temperature range above. However, operation for long periods
outside the temperatures guaranteed within specification can
reduce the instrument life and have other adverse effects on the
instrument.
Humidity
40% to 70% (no condensation)
Installation location Sturdy table approx. 2000mm (W) x 700mm (D), able to easily
support 110kg. Leave at least 300mm space behind the table.
Others
The room where the instrument is installed should be as free as
possible of harmful elements, such as dust, vibrations,
electromagnetic fields, and corrosive gas.
Do not use the instrument in an explosive-gas environment.
ZEBV-5020C
Installation example (The dimensions of the PC and printer may vary according to the model.)
See below for the cable and pipe lengths.
MS to rotary pump
vacuum pipe
approx. 1.5m
power cable
approx. 1.5m
PC to MS
cable
approx. 2m (Note 1)
Reference
number
Description
Dimensions (mm)
Weight (kg)
W
D
H
1
GC
515
530
440
30
2
MS
345
494
390
44.5
3
Monitor
390
189
364
4.7
4
Keyboard
454
173
54
1
5
PC
171
326
323
6.5
6
Printer
387
283
274
7
7
Oil rotary pump
125
323
189
10
Note 1 A 4.5m cable is also available to install the PC and MS further apart.
Order it if required.
Cat. No.
Description
070-60311-03
Cable AXJ231132 (4.5m)
4. Power requirements
Caution
Provide the instrument with a separate power supply protected by an earth
leakage breaker. It must not share a power supply with any other equipment.
Caution
To prevent electric shocks, connect to earth with a grounding resistance not
exceeding 100Ω.
Note
Although the instrument is designed to operate normally with ±10% AC line
voltage fluctuations, including accumulated rapid noise, to ensure performance
specifications are met, the voltage fluctuations (including noise) should not
exceed ±5%. The power supply equipment must be improved if the voltage
fluctuations exceed ±10%. Frequency fluctuations must not exceed ±0.5Hz.
The power supply requirements for each unit are listed below.
* 115V instrument
Unit
Voltage
Capacity
Cable length
GC
115VAC,
1800VA
2.0m
Terminal type
Fig. 1
ZEBV-5020C
MS
single-phase
1000VA
2.5m
Separate power supplies are needed for the PC, monitor, and printer.
230V instrument
Unit
Voltage
Capacity
Cable length
230VAC,
GC
2600VA
2.0m
single-phase (*)
100VAC,
MS
1000VA
2.5m
single-phase
Separate power supplies are needed for the PC, monitor, and printer.
Attention
In the case that DI of a option is used the power supply of RP2 is necessary.
The RP2 of voltage is 115v or 230v.
The electric power of the consumption is about 200 VA.
Fig. 2
Terminal type
Fig. 1
Fig. 2
ZEBV-5020C
(*) Use a step-up transformer from a 100V or 200V amplifier. The maximum current
with a 100VAC power supply is approximately 26A (with no options). Ensure the
wiring has sufficient capacity.
Use of the following step-up transformers is
recommended.
Cat. No.
Description
Capacity
Cable
length
Terminal
type
225-10690-91
Step-up transformer for
200VAC
3kVA
3.0m
Fig. 1
Black
White
Green
Fig. 1
Fig. 2
ZEBV-5020C
Reagent gas
Please prepare the following thing as case, reagent gas with CI and also NCI.
Attaching, change 2 kinds of reagent gas simultaneously it can use it.
Please prepare it without fail because any gas of isobutene or methane are
necessary at the time of an installation.
Gas
CH4
metane
(017-33021-01)
i―C4H10
isobutane
(017-33031-03)
NH3
Ammonia
(017-33010)
Purity
Filling quantity
and container
capacity
99.95% Filling quantity
or more
15MPa
Container capacity
3.4L
99. 9%
or more
99.9%
or more
Filling quantity
1.5kg
Container capacity
4.8L
Container with a
manufacturer
regurator
Takachiho
chemical
industry
TYPE TV1024
Takachiho
chemical industry
TU1065(注)
Left screw
(040-72004)
Takachiho
chemical industry
Takachiho
chemical
industry
TYPE 4.8LP
TU-1066(caution)
(225-09552)
Adapter with
a/the container
(017-33030)
Takachiho
Sumitomo Seika
Filling quantity
chemical industry
Chemicals
3.5kg
Container capacity (Pay attention TUS1063(caution)
Left screw
container etc.
10L
Stainless steel
of note Nippon
production
Sanso because
(210-14191)
there is in the
case of a right
screw)
There is two piece pipe of reagent gas as for CImodel and NCI model.
This type of reagent gas pipe can not connect to other reguretor of the abovetable.
Please consult it with a merchant, in the case that other types are used.
"Exit form: the φ8.5 hose joint hand is installed with a M12X1 bag nut and an exchange
possible type"
5. Gas
Helium (He) is employed as the carrier gas in the GCMS-QP2010.
The gas type, purity, and pressure are designated in the table below. Provide gas
and a gas pressure regulator of the types designated in the table, or their equivalents.
Gas
Purity
Pressure and
capacity
Manufacturer
Pressure regulator
Koike Sanso Kogyo
Co., Ltd.
99.995% min.
PPR-He
221-35999-03
* 10-digit numbers are Shimadzu catalog numbers.
300 to 980kPa He supply pressure is required to the GC. However, some supply
pressures have a limiting effect on the pressures that can be set at the GC. Normally
He
(helium)
15MPa
(150kgf/cms) 47L
Iwatani & Co.
Ltd.
ZEBV-5020C
a supply pressure 700 to 800kPa is required.
Even higher purity helium (99.999% to 99.9999%) is recommended for some
applications, such as the analysis of pesticides.
The following gas purification filter is available to eliminate traces of oxygen and
organic matter from the pipes. Use this filter, if necessary.
See the List of Service Parts and Consumables for details.
He gas purification filter kit
GLC Center number: 544-102
Piping between cylinder and GC-QP2010
The following carrier gas pipes are available from Shimadzu.
required before installing the instrument.
Cat. No.
201-48067
201-48067- 05
201-48067- 10
201-48067- 15
201-48067- 20
Description
Gas pipe
2.5m
Gas pipe
5m
Gas pipe
10m
Gas pipe
15m
Gas extension pipe 2m
Order the pipe
ZEBV-5020C
Cautions on handling high-pressure gas cylinders
The gas cylinders used are covered by the High-pressure Gas Safety Law.
Strictly follow the provisions of the High-pressure Gas Safety Law when handling
these cylinders.
General Precautions
1. Locate the cylinders in a well-ventilated position outside that is not subjected
to direct sunlight. Transfer the gas through pipes.
2. Do not allow the cylinder temperature to exceed 40MC. Allow no naked
flame within two meters of the cylinders.
3. Ensure sufficient ventilation where high-pressure gas is used. Check for gas
leaks with soapy water during the start-up inspection. If flammable gas
(such as methane) is used, allow no smoking or naked flame within a 5m
range. Provide effective fire extinguishers.
4. Fasten cylinders with chains to ensure they cannot fall over.
5. Use an oilless gas pressure reducer. Do not use pipe with oil on the internal
gas-contact surface.
6. Immediately close the cylinder valve when the gas is no longer required.
7. Legal permission is required to store gas quantities of 300m3, or more. Refer
to the High-pressure Gas Safety Law, General High-pressure Gas Safety
Regulations, and Fire Protection Law.
6. Exhaust
Provide exhaust duct plant and connect it to the instrument to prevent the discharge of
oil mist or injected solvents and sample directly into the room. (See the Exhaust Duct
Example below.)
As a guide, the exhaust duct plant should provide a flow of 3 to 20m3/minute. A
normal draft chamber can also be used.
The following oil-mist filter is available for use in situations where provision of an
exhaust duct is not possible. If this filter is used, injected solvents and samples are
discharged directly into the room.
Cat. No.
042-00124-31
Description
Oil-mist filter EMF3
ZEBV-5020C
Provided by customer
Hose clamp 16mm
(standard accessory)
Customer to provide 11mm dia. connector for
direct connection of the exhaust hose.
Vinyl tube 10mm ID x 4m
Exhaust duct plant
(standard accessory)
Hose clamp 16mm
(standard accessory)
Exhaust outlet
Rotary pump 1
Exhaust Duct Example
7. Other parts to be prepared
A Shimadzu service technician will adjust the instrument and measure inspection data
immediately after the instrument is installed. Please have the following required
items available at this time.
1. Capillary column DB-5ms, manufactured by J&W
ID 0.25mm, length 30m, film thickness 0.25µm
GLC Center number: 122-5532
2. Microsyringes for sample injection (e.g., 10µL)
3. Standard sample for instrument evaluation
OFN 1pg (225-09558-02) for evaluation of EI, NCI(OPTION)
Benzophenone 100pg/ul (225-09558-02) for the evaluation of C I(OPTION)I
Cholestane 100ng/ul (225-09391-05) for the evaluation of DI I(OPTION)
4. Other service parts or consumables that the customer considers necessary.
See the List of Service Parts and Consumables for details.
ZEBV-5020C
8. Preparation checklist
The checklist on the following pages summarizes the installation conditions described
above. The customer is requested to complete this checklist and forward it to
Shimadzu.
Customer:
Address:
Telephone:
1.
Installation
room
2. Power
supply
Item
1-1 Temperature
Guaranteed within specification
Guaranteed operation
1-2 Humidity
1-3 Installation location
Space
Strength
GC/MS unit approx. 75kg
PC unit approx. 20kg *
Space at rear
Space at left
18 to 28MC (constant)
15 to 35MC
40% to 70%
2000mm (W) x 700mm (D)
Able to support weight
(approx. 110kg.)
300mm min.
400mm min.
* Weight may vary according to the
model of PC, monitor, and printer.
1-4 Others
Few harmful elements, such
as
dust,
vibrations,
electromagnetic fields, and
corrosive gas.
2-1 Voltage fluctuations
115V instrument
Guaranteed within specification
100V±5%
Guaranteed operation
100V±10%
230V instrument
Guaranteed within specification
Guaranteed operation
100V±5%
2-2 Frequency fluctuations
2-3 Terminals
* 115V instrument
GC unit (Fig. 1)
MS unit (Fig. 1)
* 230V instrument
GC unit (Fig. 1)
MS unit (Fig. 1)
Separate power supplies are required for
the PC, monitor, and printer.
3. Gas
Confirmed
Condition
2-4 Grounding resistance
3-1 Helium
Purity
Regulator
Pipe between regulator and GC
100V±10%
50/60 Hz ±0.5 Hz within
Cable
Capacity
length
2m
1800VA
2.5m
1000VA
2m
2600VA
2.5m
1000VA
100Ω max.
99.995% min
PPR-He, or equivalent
Carrier gas pipe
201-48067 2.5m
201-48067-05 5m
201-48067-10 10m
201-48067-15 15m
4. Exhaust
5. Others
4-1 Exhaust duct plant for rotary pump Exhaust
duct
plant
exhaust gases
required. (Approx. 3 to
20m3/min.)
4-2 Oil-mist filter EMF3 042-00124-31
Required in situations
(option)
where provision of an
exhaust duct is not
possible.
The following parts are required:
5-1 Capillary column
5-2 Microsyringes
DB-5ms (example J&W)
L 30m I.D 0.25 Film 0.25um
10µL 225-09542-01
For the evaluation of EI
5-3 Standard sample for instrument (standard), NCI(option)
OFN 1pg/µL
evaluation
(isooctane solvent)
225-09558-02
For the evaluation of CI
(option)
Benzophenone 100pg/ul
(acetone solvent)
225-09558-04
For the evaluation of DI
(option)
Cholestane 100ng/ul
(acetone solvent)
225-09391-05
isooctane solvent(for nci,
more better)
5-4 Other service parts or
consumables
List of Service Parts and Consumables (for replacement by customer)
P/N
Description
GC
221-35507-02
036-11203-84
221-41444-01
221-48335-01
221-48600
221-48876-03
221-49065-91
221-34121-93
221-42559-92
221-42559-92
201-35183
221-48974
670-15003-03
Direct
670-15003-04
interface
670-15003-07
670-11009
Ion source 225-10197-91
225-10446-91
225-10442-91
225-10617-91
225-10617-92
225-10605-91
225-10447-91
Comment
SUPELCO SEPTUM (set of 50)
FLUORORUBBER O-RING
GLASS INSERT (FOR SPLIT)
GLASS INSERT (FOR SPLITLESS MODE)
DEACTIVATED SILICA WOOL
GLASS INSERT (SILANE FINISHED, FOR SPLITLESS Set of 5
MODE)
AU PACKING (set of 5)
Set of 1 221-48990
MOLECULAR SIEVE FILTER
TRAP (SPLIT)
TRAP (PURGE)
Aluminum packing (set of 100)
Several required at trap replacement
Spacer 1.5
Spacer below septum
FERRULE GVF-004 (set of 10)
ID 0.25mm max.
FERRULE GVF-005 (set of 10)
ID 0.32mm
FERRULE GVF-008 (set of 10)
ID 0.53mm
NUT, SSNE16/012 (set of 5)
FILAMENT
EI/CI/NCI common
BOX(Heat Treatment)
FOR EI
REPELLER UNIT ASSEMBLY PARTS
FOR EI
BOX,ASSY,CI(Heat Treatment)
FOR CI
BOX,ASSY,NCI(Heat Treatment)
FOR NCI
REPELLER ASSY CI(HT)
CI/NCI common
REPELLER(Heat Treatment)
EI/CI/NCI
Only an electrode
Replacement
frequency (guideline)
Class
50 units/year (#1)
20 units/year (#2)
As required
As required
As required
As required
Consumable
Consumable
Consumable
Consumable
Consumable
Consumable
2 units/year
1part/year
2 units/year (#3)
2 units/year (#3)
As required (#4)
As required (#4)
As required (#4)
As required (#4)
2 units/year
Consumable
Consumable
Consumable
Consumable
Consumable
Service part
Consumable
Consumable
Consumable
Consumable
Consumable
Service part
Service part
Service part
Service part
Service part
Service part
As required
Service part
Consumable
Service part
common
CI/NCI
016-37575-03
225-01068
202-75101
PTFET,7040AMS3653#16
Teflon tube
CI/NCI common
Ceramic bushing
EI/CI/NCI common
PIPE ASSY
CI/NCI common(GAS PIPE)
DI
STANDAR
DSAMPLE
200-33168
Seal Teflon
As required
Consumable
036-15550-12
Oring,AS568A-012 4D
As required
Consumable
225-09344
Sample vacuum bottle
As required
Consumable
225-04209
cap
As required
Consumable
225-10627-91
DI PROBE ASSY
As required
Consumable
225-10618-91
REPELLER2,CI+(C)
As required
Consumable
225-09493-03
STANDARD SAMPLE (PFTBA) 5g
As required
Consumable
225-09493-01
STANDARD SAMPLE (TRIAZINE) 0.5g
As required
Consumable
1L/year (#5)
Consumable
VACUM 017-30163-11
SYSTEM
Tools and
jigs
ROTARY PUMP OIL ULTRAGRADE15 1L
IN DI mode ,CI analysis
0.28L per oil replacement
Consumable
085-35124-03
SCOTCHBRITE (for finishing electrodes) set of 20 sheets
225-10194-91
JIG, IS
225-01453-94
COLUMN MOUNTING JIG (I/F)
225-01453-95
COLUMN MOUNTING JIG (INJ)
20 sheets/year
#1 Replace after approximately 80 injections.
#2 If carrier gas leaks or when glass insert is replaced.
#3 Replace periodically, normally once every 6 months.
However, replace more frequently under
certain measurement conditions or after many analyses of samples with a high boiling-point or
samples that are solid at room temperature.
(See GC System User Guide for details.)
#4 Use when column is replaced.
#5 Ideally, replace oil once every three months (3000 hours operating time). Insufficient vacuum can cause various problems in the
mass spectrometer system. The oil must be replaced appropriately.
Service part
List of Service Parts and Consumables (for replacement by service technicians)
P/N
Description
Comment
GC
I/F
221-46260-91
078-12130-01
221-46470
221-46471
221-43695-91
221-43696-91
225-10547
018-23651
036-11251
225-10549-91
KEY OPERATION UNIT (PCB)
KEY OPERATION UNIT (LCD)
KEY OPERATION UNIT KEY RUBBER 1 (UPPER)
KEY OPERATION UNIT KEY RUBBER 2 (LOWER)
DET
200-44394
225-10439-91
225-10436-91
018-17301
225-10200-91
225-10554-91
034-01602-31
225-10434-91
225-10434-92
225-10434-93
225-10434-94
225-10434-95
225-10463-91
225-09340-11
225-10466-91
225-10466-92
225-10466-93
Service part
Service part
Service part
Service part
Service part
Service part
Service part
Service part
Service part
Service part
THERMAL SENSOR (for column)
THERMOCOUPLE (for column)
INSULATOR, I/F
TAPE #973
O-RING 4D P50
HEATER BLOCK ASSY
225-10549-92 HEATER BLOCK ASSY
IS
Replacement
Class
frequency (guideline)
100 to 115V, incorporates heater and
PT sensor
220 to 240V, incorporates heater and
PT sensor
CERAMIC INSULATOR, A24-251-1
HEATER BLOCK ASSY
PT ASSY, IS
ALUMINUM FOIL
IS ASSY
Service part
As required
As required
LENS, MAGNET, HEATER
CPU, I/F A ASSY
SPRING, SUS UR8-10
CABLE ASSY, F1(S)
CABLE ASSY, F2(S)
CABLE ASSY, F1(L)
CABLE ASSY, F2(L)
CABLE ASSY, L1
EM(H) ASSY
EM, AF620
SIG CABLE ASSY, DET
LENS CABLE ASSY, DET
HV CABLE ASSY, DET
Entire detector
Electron multiplier only
1 part/3 years
Consumable
Service part
Service part
Consumable
Service part
Service part
Service part
Service part
Service part
Service part
Service part
Service part
Service part
Consumable
Service part
Service part
Service part
MS FILTER
SI
Vacuum
system
225-10466-94
036-11271
225-10464-91
225-09148-92
036-11218
225-01132
225-10407-91
225-10408-91
225-10408-92
036-11266
225-09148-92
036-11218
225-01373
225-10390-01
225-10400
225-10401
225-10402
225-10403
225-10179-91
225-01559-91
035-62971-05
225-04257-91
036-11203
225-09490-01
200-47686-02
225-09508-02
CDD CABLE ASSY, DET
O-RING, 4D P105
FEEDTHROUGH ASSY, CDD
FEEDTHROUGH
O-RING, 4DP18
TERMINAL PINS
CABLE ASSY, MS FILTER
SHORT CABLE 1, PRE-ROD
SHORT CABLE 2, PRE-ROD
O-RING, 4DP90
FEEDTHROUGH
O-RING, 4DP18
SHORT SPRING
TERMINAL PLATE (PRE)
PRE-ROD
INSULATOR
SCREW (PRE)
COLLAR
VALVE ASSY, SI
CAPILLARY ASSY
SLEEVE SET, 1/16F-T
GLASS SAMPLE BOTTLE (set of 5)
As required
O-RING, 4DP5
IG GAUGE
PB1 PIRANI TUBE FILAMENT
TURBOVAC TW300
TMP unit
225-09508-03 TURBO DRIVE.S (TW300)
225-09509-02 TURBOVAC TW70H
TMP controller
TMP unit
225-09509-03 TURBO DRIVE.S (TW70H)
TMP controller
1 part/3 years
1 part/3 years
Overhaul
every
years (#2)
Overhaul
years (#2)
every
Service part
Service part
Service part
Service part
Service part
Service part
Service part
Service part
Service part
Service part
Service part
Service part
Service part
Service part
Service part
Service part
Service part
Service part
Service part
Service part
Consumable
Service part
Service part
Consumable
Consumable
3 Service part
Service part
3 Service part
Service part
Main power
HV PCB
225-09517-01 RP E2M1.5(100-200)
No cable
225-09517-02 RP E2M1.5(220-240)
No cable
225-11446-91
221-09895-09
221-09895-10
210-13532-71
204-30020
035-06004-51
035-02402-01
016-31697-03
037-61024
017-30290-11
225-03538-91
035-06004-22
035-02411-21
035-02411-22
036-11271
225-10125
036-11243
225-10116-91
036-11203
225-11260-91
074-80422-01
074-80422-51
074-80424-01
225-11360-91
225-11350-91
225-10333-91
225-11195-91
225-11195-92
RP cable
Label for cable
Label for cable
Label for cable
CABLE, MS-RP
LABEL, AC220 240V
LABEL, AC110 115V
LABEL, RP1
HOSE NIPPLE, 16KF-18 HOSE
CENTER RING, KF10/16SNRCR
CLAMP RING 10/16KF
HOSE, CHEMIFLEX 19MM
HOSE CLAMP, HB-1-28
LUBRICATING OIL, BARRIERTA IS/V75
ELBOW, KF16-#15
CENTER RING, KF16SVCR
CENTER RING, 32036-PAZV
CENTER RING, 32040-PAZV
O-RING, 4D P105
FEEDTHROUGH 12P
O-RING, 4D P40
LEAK VALVE ASSY
O-RING, 4D P5
MAIN POWER ASSY
POWER SUPPLY, LEA50F-5
POWER SUPPLY, LEA50F-24
POWER SUPPLY, LEA150F-24
PCB ASSY, LED-A
PCB ASSY, PUMP CTRL-A
FAN ASSY, POWER
HV PCB ASSY
HV PCB ASSY,NCI
Overhaul every 1.5
years (#3)
Overhaul every 1.5
years (#3)
As required
Service part
Service part
Service part
Service part
Service part
Service part
Service part
Service part
Service part
Service part
Service part
Consumable
Service part
Service part
Service part
Service part
Service part
Service part
Service part
Service part
Service part
Service part
Service part
Service part
Service part
Service part
Service part
Service part
Service part
RF PS
MAIN CTRL
CPU PCB
IS CTRL
DC POWER
IG CTRL
PRE AMP
DI
CI/NCI
CABLE
225-11075-91
225-11060-91
225-10296-91
225-11130-91
225-11000-91
225-11225-91
225-11250-91
225-11280-91
225-11030-91
225-11310-91
225-11300-91
225-11325-91
225-11325-38
225-10576-91
225-10603-91
071-60814-05
071-60815-04
070-60311-02
070-60311-03
088-50906-11
RF PS ASSY
PCB ASSY, RF DIFF-A
FAN ASSY
PCB ASSY, MAIN CTRL-A
PCB ASSY, CPU-A
IS CTRL-A ASSY
DC POWER-A
PCB ASSY, IG CTRL-A
PCB ASSY, PRE AMP-A
PCB ASSY, DI CTRL-A
PCB ASSY,DI SOCK-A
RELAY BOX 100V
RELAY BOX 230V
CI GAS CONTROLLER
ELBOW,KF16-#15,CI
CORD, KP-4819D+KS31A
CORD SET, KP300C+KS16*
CABLE, AXJ231122
CABLE, AXJ231132 (4.5m)
CABLE, KRS-403XF1K
DI IPTION
DI IPTION
DI IPTION(100/115V)
DI IPTION(220-240V)
CI/NCI OPTION
CI/NCI OPTION
(220 to 240V)
(100 to 115V)
(IEEE-1394)
(IEEE-1394)
(RS-232C)
#1 Once every 3 years is sufficient, unless some unforeseen accident occurs.
This is an expensive part and having one available can avoid sudden expenditure. However, storage over a long period
is not recommended, as the detector deteriorates if unused for long periods.
#2 Overhaul required every 25,000 hours (approx. 2.8 years).
#3 Overhaul required every 15,000 hours (approx. 1.7 years).
Service part
Service part
Service part
Service part
Service part
Service part
Service part
Service part
Service part
Service part
Service part
Service part
Service part
Service part
Service part
Service part
Service part
Service part
Service part
Service part
ZEAV-0416A
5.Installation Completion Checksheet
Shimadzu Gas Chromatograph Mass Spectrometer
GCMS-QP2010
Name:
Department:
User's name:
I have checked the items in the attached checklist and report that the installation is complete.
Installation completion date:
Installation supervisor:
Department:
Model name
GCMS-QP2010
Remarks
Serial number
C7026
ZEAV-0416A
Shimadzu Corporation
2010 Installation Completion Checklist
The items relate to acquiring installation completion data and conducting operation checks.
Installation is complete when all items in the installation completion checklist have been checked and
the operation instruction completed. (A standard installation requires four working days.)
Analysis of the customer's samples is separate from the installation process.
Checklist
No.
1
Check Item
Installation
conditions
Check Details and Conditions
Power supply:120/ 220/230/240V
Check supply capacity (see System User
Guide)
Grounding (100Ω max.)
Location:
Space designated in System User Guide
available?
Check strength of table (able to support
100kg?)
Temperature:
Check ambient conditions at installed
location.
Gas (Helium purity and pressure regulator)
He purity
Designated pressure and contamination
check
Criteria
within ±5%
Greater than indicated value.
Operation checks
a. Basic operation
□
Available
□
No flexing or vibrations
within 23±5MC
99.995% min.
No abnormality in analysis
data
* Do the RP/TMP start normally with the Normal
GCMSsolution startup program? (Automatic
start completes within 5 minutes?)
* Normal communication with GC using the Normal
GCMSsolution GC parameters?
READY lamp does not go
* Temperature control of INJ, OVEN, I/F units?
out
b. Explanation
3
Function checks
a. Tuning
* Explain MS, MC, and SIM measurement using
OFN 100pg/µL standard sample (tuning, Operation explained
creating methods, analysis, batch processing,
data re-analysis, outputting reports).
* Peak intensity fluctuates when each lens
voltage is changed in the tuning window.
* Detector voltage stabilizes at -1.8kV or below
after auto-tuning? (This checks the ion-source
operation, SI sample injected volume, and
detector performance.)
* Discrepancy in peak amplitudes within 0.1M
after auto-tuning?
* When pattern correction is selected
m/z502 intensity over 2% of m/z69 intensity?
Keep auto-tuning data.
□
□
Grounded
Exhaust:
Is RP exhaust outlet connected to exhaust Yes
outside the building or is an oil-mist filter
used?
2
Check
□
□
□
□
□
□
□
□
□
Fluctuates
□
-1.8kV or below
□
Within 0.1M
Over 2%
□
□
Comment
(
(
V)
A)
ZEAV-0416A
b. Mass spectra
measurement
s (MS, MC)
4
c. Selected ion
measurement
(SIM)
Performance
checks (EI)
a. Resolution
b. Sensitivity
(EI)
c. Mass marker
Performance
checks(PCI)
a.Autotuing
* Take and keep mass spectrometer (MS) and Normal operation
mass
chromatogram
(MC)
sensitivity
measurement data from practical operation.
Measurement conditions shown below. (This
checks the operation of the MS and MC
software.)
* Keep SIM data from practical operation. (This Normal operation
checks the operation of the SIM software.)
□
* After auto-tuning, change the RF offset value to 2M resolution min.
sharpen the peaks. Check m/z69, 219, 502
peak amplitudes do not exceed 0.5M.
(At least 2M resolution at FWHM 0.5 max.)
□
* Conduct MC measurement at m/z272 on OFN As described at left
1pg/µL (1ppb) standard sample. Confirm
S/N≥60 (RMS).
* Auto-tuning results give PFTBA peaks (m/z69,
131, 219, 264, 414, 502, 614) within C0.1 As described at left
mass.
Autotuning should be completed without
problems (detector gain <1.5kV)
Intensity ratio; I(29)/I(17) > 0.2
for
methane
I(57)/I(43) > 1 for iso-butane
PFTBA spectrum should be obtained
b. Sensitivity
□
□
□
□
□
Conduct MC measurement at m/z183 on
Benzophenone 100pg/µL (100ppb) standard
sample. Confirm S/N≥150 (RMS).
Performance
checks (NCI)
a.Autotuing
5
Autotuning should be completed without
problems
(detector gain <1.6kV for NCI, <2.2kV
for SEI, <1.5kV for SCI)
NCI : The m/z 633 peak for PFTBA should
be a base peak
The following peaks of PFTBA should be
observed for NCI :
m/z 264, 333, 414, 452,514,595,633
b. Sensitivity
Conduct MC measurement at m/z272 on OFN
100fg/µL (100ppt) standard sample. Confirm
S/N≥100 (RMS).
Performance
checks (DI)
Tem cont
Carry out temperature adjustment
on the set-up temperature
conditions.
Accessories
□
□
□
RommTemp-40℃/min-300℃
Sample Cholestane 100ng/ul(100ppm) 1ul
M/Z217 BeasePeak,M/Z372molequrePeak
□
Check correct standard accessories are supplied Correct accessories
(according to list in the System User Guide)
□
ZEAV-0416A
Measure S/N.(EI MODE and NCI MODE)
EI SAMPLE OFN 1pg/ul (isookutane solvent) 1ul
m/z272 S/N≧60
NCI SAMPLE OFN 0.1pg/ul(100fg/ul)( isookutane solvent) 1ul m/z272 S/N≧100
Measurement Conditions
INJ
250MC
SPLITLESS mode (sampling time 1.0 minute)
COL:
50MC (1min) - 40MC / min - 200MC (0min) - 15MC / min - 280MC
I/F:
250MC
IS:
200MC
He:
during injection 250kPa, 1 minute (HIGH-PRESSURE INJECTION mode)
during analysis 120Kpa
Total flow:
50mL/minute
MS:
SCAN mode (mass range: m/z200 to 300)
interval
0.5s
detector voltage
relative value: +0.4
(absolute value: 1.4 to 1.6kV)
measurement time: 3.0 to 10.0 minutes
(solvent elution time: 3 minutes)
Measure S/N.(CI MODE)
Benzophenone 100pg/ul (acetone solvent) 1ul
m/z183 S/N≧150
Measurement Conditions
INJ:
COL:
I/F:
He:
Total flow
MS:
250℃
SPLITLESS MODE (Sampling Time 2.0 min)
80℃(2min)−30℃/min−260℃(5min)
250℃
IS:200℃
during injection and analysis
100Kpa
20ml/min
SCAN MODE (mass range M/Z 100∼250)
interval
0.5sec
relative value +0.4
(absolute 1.4∼1.6 kV)
detector voltage
measurement time
6.0∼11.0 min
(solvent elution time 5.5min)
Reference pressure of the reagent gas in the installation at the time of corporate identity, NCI use
Methane gas
Isobutane gas
Ammonia gas
CI 100Kpa∼300Kpa
CI
20Kpa∼80Kpa
CI 100Kpa∼300Kpa
NCI 200Kpa∼300Kpa
NCI 40Kpa∼80Kpa
NCI 200Kpa∼300Kpa
mass patern check Measurements DI MODE
Carry out temperature adjustment on the set-up temperature
cholestane 100ng/ul (acetone solvent) 1ul
Measurement Conditions
MS I/F 100℃
IS 250℃
DI temperature room temperature to 300℃ 40MC / min
GC temperature constant
Colum flow moderate flow
6. How to change Turbopump
Replacement Procedure of Turbomolecular Pump TW300
~ QP2010 ~
1. Shut down QP2010 and turn off the power. Remove capillary column from interface and separate MS
part from GC part more than 20cm. Disconnect the control cable for interface temperature. If MS part
cannot be kept enough distance from GC part, move MS part to another work table after disconnecting
all the cable from MS part.
More than
20cm
Materials Needed:
Screwdriver (Philips), Wrench (Allen) *mm,
Wrench 13mm, *mm, Tweezers, A piece of
cardboard
2. Remove the top cover and lay down the power unit box.
- 118 -
3. Remove the front cover.
Remove
the screw.
Loosen the
screw
Remove
the screw.
Loosen the
screw
Loosen the screws at the both
sides of cover.
Remove
the screw.
Remove
the screw.
Remove the front door.
Remove the cover.
- 119 -
4. Remove the right side panel.
The above work can be easily done by previously removing the connector for interface heater. (The
connector can be easily removed by clipping its both side with your fingers)
- 120 -
5. Remove the IS CTRL-A Board Unit.
Disconnect the two connectors.
Remove the three screws and the spacer screw
- 121 -
Disconnect the feedthrough connection, indicated by arrow, by holding the IS CTRL-A board in
both hands. ( Be careful not to put insufficiently strong power into the feedthrough)
Put wires aside and remove the IS CTRL-A board unit.
- 122 -
6.
Disconnect the connector from the power supply for TW300, which is the rear one of the two power
supplies for turbomolecular pump.
(After removing the cable)
- 123 -
7.Remove the outlet flange of TW300.
Loosen three screws.
Slide the presser plate to the arrowhead to
remove it.
Remove the flange and the o-ring. (Be
careful to avoid dust)
- 124 -
8.
Remove TW300.
Put cardboard between the TW300 main body and the power unit. (This procedure will make the
later work easier.)
Loosen gradually the diagonal 4 fixing screws.
(Do not remove the screws at this step.)
The front-left side screw can be loosened by
putting the wrench into clearance, as shown
in the picture. Do not remove the SUS tube
from SI solenoid valve.
- 125 -
Do not remove the 2 screws on the right side.
Remove the 2 screws on the left side.
- 126 -
Remove cardboard.
Move the TW300 left by holding in both hands.
- 127 -
Take out the TW300 by supporting securely its bottom side and its inlet part. Be careful not to hit
and broke the IG gauge, indicated by arrow. (Work with clean hands. We recommend you to
wear clean gloves.)
Completion of removal
- 128 -
9.
Replacing the power unit.
Loosen the fixing screw, indicated by arrow. Disconnect the two connectors.
Loosen the fixing screw and slide the presser plate
to remove the power unit.
Install the new power unit, TURBO DRIVE 300. The
'REMOTE' terminal will be used. Do not use the
'SERVICE' terminal.
- 129 -
10.
Preparation of new TW300
New TW 300
Removed TW300
Check the name plate.
Old type
New type
- 130 -
Remove the cap of outlet. Loosen the 3 fixing screws and remove the plate
Remove the o-ring.
- 131 -
Remove the o-ring and the protective
net from the removed TW300 for
reuse. You can remove the protective
net by hooking it with tweezers. (We
recommend you to wear clean
gloves.)
If it is difficult for you to remove the
protective net, try to hook the fringe of
it. ( Put a sheet of paper or like that on
the contact surface with o-ring not to
scratch or injure.
Remove the protective net.
- 132 -
11.
Installing the new TW300
Place the protective net and the o-ring in the new TW300. Make sure that there is no dust on
sealing surface, o-ring and protective net. Make sure that there are no dust and no scratches on sealing
surface of vacuum manifold
Put cardboard on the power unit of turbomoecular pump.
Reinstall TW300 in a reverse way of removal. Pay attention not to hit against the IG gauge.
- 133 -
Hook the right side hooks on the neck of
inlet.
Attach the left side screws and hooks.
Fasten lightly the 4 screws.
- 134 -
Adjust the mounting angle to be rotated, as shown in figure. Make sure that the edge of the bottom side
does not protrude.
Tighten step by step opposite pair of 4 screws in turn.
- 135 -
Remove the cardboard.
Completion of TMP mounting
- 136 -
12. Fix the flange to outlet
Place the flange on the outlet. (Do not
forget to place o-ring)
- 137 -
13. Reinstallation of IS CTRL-A Board unit
Push the feedthrough into the connector on IS CTRL-A board. This work can be easily done if you put the
metal plate for fixing on the vacuum manifold and slide horizontally the board unit. (Be careful not to put
insufficiently strong power into the feedthrough.)
Make sure that all pins of feed-through are stuck into the connector holes of IS CTRL-A board.
- 138 -
Slide fast the IS CTRL-A board down and fix it. (4 screws)
Connect the two connectors.
- 139 -
14. Place the covers.
Place the front cover.
Place the front door.
- 140 -
Replace the power unit box and the top cover.
Connect the control cable for interface temperature. Make sure that there is no vacuum leak by
plugging interface and starting instrument before connecting GC and MS.
Reset the operating time of turbomolecular pump as the following procedure.
- 141 -
Resetting the operating time of turbomolecular pump
Execute the software “MS2010.exe”.
(This software is stored in C:¥GCMSSolution¥PROGRAM¥MS2010.)
Enter password. : ********
The following screen will be opened.
Select “Tools” from the toolbar menu.
Click “E2PROM”.
- 142 -
The above screen will be opened.
Write down the value of TMP1 Time in the working report.
UPDATE
EDIT
MODE
Select “Edit mode”.
- 143 -
CLOSE
UPDATE
SET”0” TMP1 Time if if TMP1 has been replaced with the new one. Click the button “Update”.
CANSEL
Click “OK” to close the window.
The operating time of TMP1 has been reset.
Write down the serial numbers of the troubled TMP and the new TMP in the working report.
Start up the instrument.
Make sure that there is no vacuum leak and the result of autotuning is normal.
Explanation to the customer.
Completion of replacement work
- 144 -
!