1
User Manual for MEGAN V6.1.20alpha
Daniel H. Huson
September 18, 2015
Contents
Contents
1
1 Introduction
3
2 Getting Started
6
3 Obtaining and Installing the Program
6
4 Program Overview
7
5 Importing, Reading and Writing Files
8
6 Taxonomic Binning
10
7 Functional Analysis
12
8 Comparison of samples
13
9 Main Window
13
10 Sample Viewer
25
11 Cluster Analysis Viewer
27
12 Import Dialog
31
13 Inspector Window
33
14 Rarefaction Window
34
15 Chart Window
37
1
16 SEED Window
37
17 COG Window
38
18 KEGG Window
38
19 PFAM Window
39
20 User-defined Classifiers
39
21 Alignment Viewer
39
22 Group Viewer
42
23 Find Toolbar
42
24 Format Dialog
43
25 Message Window
43
26 Parameters Dialog
43
27 Compare Dialog
44
28 Extractor Dialog
44
29 Export Image Dialog
45
30 About Window
45
31 Server Browser Window
45
32 File Formats
46
33 Command-Line Options
52
34 Command-Line Commands
54
35 Using More Memory
58
36 MEGAN Tools
59
37 Acknowledgments
59
References
59
2
Index
1
62
Introduction
License: Copyright (c) 2015, Daniel H. Huson
1.1
Community Edition
This Community Edition of this program is free software: you can redistribute it and/or modify it
under the terms of the GNU General Public License as published by the Free Software Foundation,
either version 3 of the License, or (at your option) any later version.
MEGAN6 Community Edition is distributed in the hope that it will be useful, but WITHOUT
ANY WARRANTY; without even the implied warranty of MERCHANTABILITY or FITNESS
FOR A PARTICULAR PURPOSE. See the GNU General Public License for more details.
You should have received a copy of the GNU General Public License along with this program. If
not, see http://www.gnu.org/licenses.
1.2
Ultimate Edition
The Ultimate Edition of this program is licensed by the University of T¨
ubingen for a fee. The
Ultimate Edition is based on the Community Edition and includes additional, proprietary code,
which is not open source.
MEGAN6 Ultimate Edition is distributed in the hope that it will be useful, but WITHOUT ANY
WARRANTY; without even the implied warranty of MERCHANTABILITY or FITNESS FOR A
PARTICULAR PURPOSE.
You should have received a copy of the MEGAN Ultimate Edition License along with this program.
Type-setting conventions: In this manual we use e.g. Edit→Find... to indicate the Find...
menu item in the Edit menu.
Information about functionality only available in the Ultimate Edition of MEGAN is set in a framed UE
box.
How to cite: If you publish results obtained in part by using MEGAN , then we require that you
acknowledge this by citing the program as follows:
• D.H. Huson et al, MEGAN6: efficient microbiome analysis involving hundreds of samples and
billions of reads, in preparation.
• D.H. Huson et al, Integrative analysis of environmental sequences using MEGAN 4, Genome
Res. 2011. 21:1552-1560.
The initial idea to develop MEGAN was born in 2005, when Daniel Huson and Stephan C. Schuster
(then at Penn State) discussed that a metagenomic analysis tool was required to analyze reads
3
produced using 454 sequencing for a mammoth sample, the goal being to try to identify the origin
of any non-mammoth reads. The resulting paper was the first publication to use next-generation
sequencing for metagenomics [16].
The first public version of MEGAN was written by Daniel Huson during a sabbatical at the University of Canterbury in 2006, hosted by Mike Steel at the Biomathematics Research Centre. The
result of this work is presented in [7]. A second sabbatical was invested in 2011 to significantly
extend the scope of the program and to rewrite major parts of the code. The result of this work
(version 4) is presented in [8]. The current version 6 of MEGAN was developed in a third sabbatical
in 2015.
MEGAN consists of ≈ 260, 000 lines of Java code, written over a period of ten years.
Stephan C. Schuster, Suparna Mitra, Daniel C. Richter, Paul Rupek, Hans Ruscheweyh and Nico
Weber contributed ideas and some supporting code.
The term metagenomics has been defined as “The study of DNA from uncultured organisms”
(Jo Handelsman), and an approximately 99% of all microbes are believed to be unculturable. A
genome is the entire genetic information of one organism, whereas ametagenome is the entire genetic
information of an ensemble of organisms. Metagenome projects can be as complex as large-scale
vertebrate projects in terms of sequencing, assembly and analysis.
The aim of MEGAN is to provide a tool for studying the taxonomic content of a set of DNA reads,
typically collected in a metagenomics project. In a preprocessing step, a sequence comparison of
all reads with a suitable database of reference DNA or protein sequences must be performed to
produce an input file for the program. MEGAN is suitable for DNA reads (metagenome data), RNA
reads (metatranscriptome data), peptide sequences (metaproteomics data) and, using a suitable
synonyms file that maps SILVA ids to taxon ids, for 16S rRNA data (amplicon sequencing).
At start-up, MEGAN first reads in the current NCBI taxonomy (consisting of over one million
taxa). A first application of the program is that it facilitates interactive exploration of the NCBI
taxonomy.
However, the main application of the program is to parse and analyze the result of a comparison
of a set of reads against one or more reference databases, typically using BLASTN, BLASTX or
BLASTP or similar tools including DIAMOND to compare against NCBI-NT, NCBI-NR or genome
specific databases. The result of a such an analysis is an estimation of the taxonomical content
(“species profile”) of the sample from which the reads were collected. The program uses a number
of different algorithms to “place” reads into the taxonomy by assigning each read to a taxon at some
level in the NCBI hierarchy, based on their hits to known sequences, as recorded in the alignment
file.
Alternatively, MEGAN can also parse files generated by the RDP website [4] or the Silva website
[18]. Moreover, MEGAN can parse files in SAM format [10]. Note that DIAMOND [?] and MALT
produces SAM format for BLASTX-like alignments and MEGAN is able to parse this, see also
sam2rma.
MEGAN provides functional analysis using both the SEED classification [15] and also using KEGG
pathways [9]. For version 6, the mapping files for these classifications have been updated and COG
[17] classification is included.
4
The Ultimate Edition of MEGAN6 additionally includes the PFAM classification and allows the UE
user to incorporate their own classifications is a straight-forward manner.
An early version of this software (called GenomeTaxonomyBrowser) was used to analyze metagenomic reads in the very first paper to use second-generation sequencing for metagenomics [16].
This document provides both an introduction and a reference manual for MEGAN . Further help is
provided by the MEGAN Community found at http://megan.informatik.uni-tuebingen.de.
5
2
Getting Started
This section describes how to get started.
First, download an installer for the program from
www-ab.informatik.uni-tuebingen.de/software/megan6, see Section 3 for details.
Upon startup, the program will automatically load its own version of the NCBI-taxonomy and will
then display the first three levels of the taxonomy. To explore the NCBI taxonomy further, leaves
of this overview tree can be uncollapsed. To do so, first click on a node to select it. Then, use
the Tree→Uncollapse item to show all nodes on the next level of the taxonomy, and use the
Tree→Uncollapse Subtree item to show all nodes in the complete subtree below the selected
node (or nodes).
To analyze a data set of reads, first BLAST the reads against a database of reference sequences,
such as NCBI-NR [2] using BLASTX [1] or BLASTP, NCBI-NT [2] using BLASTN [1]. In addition,
the output of a number of other programs can also be parsed, for example, RAPSearch2 [21].
Then import the BLAST file into MEGAN using the File→Import From BLAST... menu item.
The Files tab allows you to enter the name of the BLAST file, a reads file containing all the read
sequences in multi-FastA format (if available), and the name of the new output RMA file. As of
version 4, you can also specify more than one BLAST file and one more than one reads file.
Alternatively, instead of supplying a BLAST file, one can also specify a file obtained from the RDP
website or from the Silva website. In addition, MEGAN can also parse files in SAM format.
Some implementations or output formats of BLAST and similar tools suppress those reads for which
no alignments were found. In this case, use the Options→Set Number Of Reads... menu item
to set the total number of reads in the analysis.
Clicking on a node will cause the program to display the exact number of hits of any given node,
and the number of hits in the subtree rooted at the node. Right-clicking on a node will show a
popup-menu and selecting the first item there, Inspect , will open the Inspector window which
is used to explore the hits associated with any given taxon. A node is selected by clicking on it.
Double-clicking on a node will select the node and the whole subtree below it. Double-clicking on
the label of a node will open the node in the Inspector window.
Example files are provided on the public MeganServer. The use of MeganServer is explained in
Section 31 for details.
3
Obtaining and Installing the Program
MEGAN is written in Java and requires a Java runtime environment version 1.7 or later, freely
available from www.java.org. Note that the Windows and MacOS X installers both contain a
bundled JRE and so separate installation of Java should not be necessary for these two operating
systems.
MEGAN is installed using an installer program that is available from
www-ab.informatik.uni-tuebingen.de/software/megan.
6
3.1
Installers for the Community Edition
There are four different installers for the Community Edition, targeting different operating systems:
• MEGAN COMMUNITY windows 6.1.20alpha.exe provides an installer for a 32-bit version of
MEGAN for Windows.
• MEGAN COMMUNITY windows-64x 6.1.20alpha.exe provides an installer for a 64-bit version
of MEGAN for Windows.
• MEGAN COMMUNITY macos 6.1.20alpha.dmg provides an installer for MacOS X.
• MEGAN COMMUNITY unix 6.1.20alpha.sh provides an installer for Linux and Unix.
3.2
Installers for the Ultimate Edition
There are four different installers for the Community Edition, targeting different operating systems:
• MEGAN Ultimate windows 6.1.20alpha.exe provides an installer for a 32-bit version of
MEGAN for Windows.
• MEGAN Ultimate windows-64x 6.1.20alpha.exe provides an installer for a 64-bit version of
MEGAN for Windows.
• MEGAN Ultimate macos 6.1.20alpha.dmg provides an installer for MacOS X.
• MEGAN Ultimate unix 6.1.20alpha.sh provides an installer for Linux and Unix.
The 32-bit Windows version of MEGAN is configured to use 1.1 GB of memory. For all other
versions of the software, the installer will allow you to set the maximal amount of memory during
the installation process. By default, the program will suggest to use 2 GB. If your computer has
more memory available, then it is a good idea to set this limit higher. For example, if you have 4 GB
of main memory, then set the limit for MEGAN to 3 GB. This is because the program runs faster,
the more memory it is given. To change the maximum amount of memory used after installation
of the program, see Section 35.
To install MEGAN using a command-line dialog, launch the installer from the command line and
pass the command-line option -c. For example, under MacOS X, type the following:
/Volumes/MEGAN/MEGAN\ Installer.app/Contents/MacOS/JavaApplicationStub -c
4
Program Overview
In this section, we give an overview over the main design goals and features of this program. Basic
knowledge of the underlying design of the program should make it easier to use the program.
MEGAN is written in the programming language Java. The advantages of this is that we can provide
versions that run under the Linux, MacOS, Windows and Unix operating systems.
7
Typically, after generating a RMA file (read-match archive) from a BLAST file, the user will
then interact with the program, using the Find toolbar to determine the presence of key species,
collapsing or un-collapsing nodes to produce summary statistics and using the Inspector window
to look at the details of the matches that are the basis of the assignment of reads to taxa. The
assignment of reads to taxa is computed using the LCA-assignment algorithm, see [7] for details.
In addition to taxonomic binning, MEGAN also allows functional analysis. Another main feature
is the comparison of samples. There are a number of tools for graphing data, and for import and
export of data.
The Community Edition of MEGAN provides a graphical user interface to allow the interactively
explore and analyze their samples.
The Ultimate Edition provides a graphical user interface with a number of additional features. UE
Moreover, the Ultimate Edition provides a command-line mode, in which the program reads
commands from a file or from standard input and writes output to files or to standard output. The
usage of command-line mode is described in Sections 33 and 34.
5
Importing, Reading and Writing Files
To open an existing RMA file or MEGAN file, select the File→Open... menu item and then
browse to the desired file. Alternatively, if the file was recently opened by the program, then it
may be contained in the File→Open Recent submenu.
By default, when parsing an input file, for each read, taxon and RefSeq id, only
one best-scoring match is kept.
For example, if read R has two equally high-scoring
matches M1 and M2 to two sequences from E. coli, say, then MEGAN will discard one of the two matches, unless they have different RefSeq accession numbers,
or unless exactly one of the two matches does not have a RefSeq accession number.
To turn this filter off, use the Window→Command Input...
menu item to enter the following UE
command setProp oneMatchPerTaxon=false.
5.1
Blast Files
New input to the program is usually provided as a BLAST file obtained from a BLAST comparison
of the given set of reads to a database such as NCBI-NR or NCBI-NT, see Section 32 for details of
the file formats used. MEGAN supports BLASTN, BLASTX and BLASTP standard text-format,
and BLAST XML format as well as multiple output formats provided by tools similar to BLAST,
like RapSearch2 and DIAMOND.
The BLAST files and reads files may also be parsed in gzip format or zip format . In this case,
the file names should have concatenated suffixes ending on .gz or .zip, such as .blastn.gz or
.fna.zip.
MEGAN can also parse tabular BLAST output (generated using BLAST option -m 8, however
as this form of output does not contain the subject line for sequences matched, it is unsuitable
for MEGAN because MEGAN cannot determine the taxon or gene associated with the database
8
sequence. However, if you add an additional column to this format containing the associated taxon
name or numerical NCBI taxon-id for each line then MEGAN will parse these and use them as
input. For unknown taxa, write either unknown or -1 in the column.
Note that, in all cases, the reads file should be given to use the full potential of the program.
The BLAST file and reads file are supplied to MEGAN when setting up a new MEGAN project
. Both files are parsed and all information is stored in the project file. The input data is then
analyzed and can be interactively explored. All reads and BLAST matches are contained in the
project file and MEGAN provides different mechanisms for extracting them again. A MEGAN
project file contains all reads and all significant BLAST matches (by default, up to 100 matches per
read) in a binary and incrementally compressed format. The size of such a project file is around
20% of the size of the original input files and is thus usually smaller than the file that one obtains
by simply compressing the BLAST file. MEGAN provides control over whether and how BLAST
matches and reads are stored, see the discussion of the Import Blast window.
MEGAN5 uses a new algorithm for determining the taxon associated with a given reference sequence. In previous versions, the program looked in the header line of a reference sequence for the
longest substring that matches some valid taxon name (or synonym) in the NCBI taxonomy. This
determined which taxon to assign to the match. However, because many entries in the NR database
mention multiple different species for a given match, the program now determines only maximal
matching names in the header line and assigns the match to the LCA of the taxa mentioned. (So,
in particular, the LCA algorithm is used twice in MEGAN, namely once to figure out which taxon
to assign to a match and then, based on this, again to determine which taxon to assign to a given
read.)
Thus, it is important that alignment programs used in conjunction with MEGAN must list all taxa
associated with a given reference sequence.
5.2
SAM Files
MEGAN can now parse files in SAM format [10]. Note, however, that SAM files usually do not
contain the names of the taxa associated with the reference sequences and so one must supply
suitable mapping files that map identifiers used for the reference sequences to NCBI taxa, KEGG,
COG and/or SEED identifiers, see below.
5.3
RDP Files
In addition, MEGAN can import rRNA analysis files downloaded from the RDP website at
http://rdp.cme.msu.edu/ [4]. Go to the website and upload your rRNA sequences and then let
the website process them for you. Please note that the RDP website allows one to download two
types of files, namely a hierarchy as text file from its Classifier :: Hierarchy View window
and a text file obtained from its Classifier :: Assignment Detail window. Input to MEGAN
must be of the latter type. The RDP website recommends using a Min Score setting of 80. MEGAN
calls this the RDP-Assignment-Detail format.
If you use the standalone RDP classifier, then the output has a different format. MEGAN calls this
the RDP-standalone format. In this case, MEGAN expects the format to be a tab-separated file in
9
which each line corresponds to one read:
read-name [-] [taxon-name rank-name score] [taxon-name rank-name score] ...
In more detail, the first token is a string that identifies the read. The next token is either empty,
or a minus, in the latter case indicating that the read is reverse complemented. Then all further
tokens come in groups of three, indicating the name of a taxon, the name of the rank of the taxon
and a score between 0 and 1 (which MEGAN will multiple by 100). MEGAN reports each such taxon
as a separate hit for the read.
5.4
Silva Files
Similarly, MEGAN can import rRNA analysis files downloaded from the Silva website at http:
//www.arb-silva.de [18]. To create a file using the Silva website that can be imported into
MEGAN, go to the Aligner tab of the Silva website and upload your sequences and then press the
align sequences button. Once the Silva website has computed an alignment, you will be able to
download two files, an arb file and a log file. MEGAN requires the log file as input, not the arb file.
When importing such a file into MEGAN, one must specify that MEGAN uses the synonyms file
called silva2ncbi.map to map Silva accession numbers to NCBI taxa. This file is available from
the MEGAN download page.
5.5
CSV Files
MEGAN supports import of data from other programs in a delimiter-separated format (using
comma’s or tabs) from a CSV file.
5.6
BIOM Format Files
BIOM is a file format for exchanging data between different metagenome analysis tools. MEGAN
can import and export data inBIOM 1.0 (JSON) format, see http://biom-format.org/. MEGAN
currently does not support BIOM2.0 (HSF5) or higher. To convert BIOM2 format to BIOM1,
please use the conversion tool provided with the biom-format package at https://github.com/
biocore/biom-format.
One can for example import OTU classification data generated by the QIIME package [3], or
taxonomic and functional classifications generated by MG-RAST [6], using the Import→BIOM
Format... menu item. To export data in BIOM format, open the viewer for the type of data
that you would like to export. For example, if you want to export a SEED classification, then
open the SEED Analyzer window and select those nodes that you want to export. Then use the
Export→BIOM Format... to save the data to a file. The suffix of a BIOM file is .biom.
6
Taxonomic Binning
By default, MEGAN uses the NCBI taxonomy for taxonomic binning.
10
6.1
The NCBI Taxonomy
TheNCBI taxonomy provides unique names and IDs for over 660,000 taxa, including approximately
25,000 prokaryotes, 84,000 animals, 65,000 plants, and 17,000 viruses. The individual species are
hierarchically grouped into clades at the levels of: Superkingdom, Kingdom, Phylum, Class, Order,
Family, Genus, and Species (and some unofficial clades in between).
At startup, MEGAN automatically loads a copy of the complete NCBI and then displays the taxonomy as a rooted tree. The taxonomy is stored in an NCBI tree file and an NCBI mapping file,
which are supplied with the program.
6.2
The NCBI-NR and NCBI-NT Databases
The NCBI-NR (“non-redundant”) protein sequence database is available from the NCBI website.
It contains entries from GenPept, Swissprot, PIR, PDF, PDB and RefSeq. It is non-redundant in
the sense that identical sequences are merged into a single entry.
TheNCBI-NT nucleotide sequence database is available from the NCBI website. It contains entries
from GenBank and is not non-redundant. It contains untranslated gene coding sequences and also
mRNA sequences.
6.3
Assigning Reads to Taxa
The main problem addressed by MEGAN is to compute a “species profile” by assigning the reads
from a metagenomics sequencing experiment to appropriate taxa in the NCBI taxonomy. At
present, this program implements the following naive approach to this problem:
1. Compare a given set of DNA reads to a database of known sequences, such as NCBI-NR or
NCBI-NT [2], using a sequence comparison tool such as BLAST [1].
2. Process this data to determine all hits of taxa by reads.
3. For each read r, let H be the set of all taxa that r hits.
4. Find the lowest node v in the NCBI taxonomy that encompasses the set of hit taxa H and
assign the read r to the taxon represented by v.
We call this the naive LCA-assignment algorithm (LCA = “lowest common ancestor”). In this
approach, every read is assigned to some taxon. If the read aligns very specifically only to a single
taxon, then it is assigned to that taxon. The less specifically a read hits taxa, the higher up in the
taxonomy it is placed. Reads that hit ubiquitously may even be assigned to the root node of the
NCBI taxonomy.
If a read has significant matches to two different taxa a and b, where a is an ancestor of b in the
NCBI taxonomy, then the match to the ancestor a is discarded and only the more specific match
to b is used.
The program provides a threshold for the bit score of hits. Any hit that falls below the threshold
is discarded. Secondly, a threshold can be set to discard any hit whose score falls below a given
11
percentage of the best hit. Finally, a third threshold is used to report only taxa that are hit by a
minimal number of reads or minimal percent of all assigned reads. By default, the program requires
at least 0.1% of all assigned reads to hit a taxon, before that taxon is deemed present. All reads
that are initially assigned to a taxon that is not deemed present are pushed up the taxonomy until
a node is reached that has enough reads. This is set using the Min Support Percent or Min
Support item.
Taxa in the NCBI taxonomy can be excluded from the analysis. For example, taxa listed under root
- unclassified sequences - metagenomes may give rise to matches that force the algorithm to
place reads on the root node of the taxonomy. This feature is controlled by Options→Taxon
Disabling menu. At present, the set of disabled taxa is saved as a program property and not as
part of a MEGAN document.
Note that theLCA-assignment algorithm is already used on a smaller scale when parsing individual
blast matches. This is because an entry in a reference database may have more than one taxon
associated with it. For example, in the NCBI-NR database, an entry may be associated with up
to 1000 different taxa. This implies, in particular, that a read that may be assigned to a high
level node (even the root node), even though it only has one significant hit, if the corresponding
reference sequence is associated with a number of very different species.
Note that the list of disabled taxa is also taken into consideration when parsing a BLAST file.
Any taxa that are disabled are ignored when attempting to determine the taxon associated with a
match, unless all recognized names are disabled, in which case the disabled names are used.
MEGAN contains one enhancement of the naive LCA. The LCA of a fixed percent places each read
on the lowest node that covers the given percentage t (between 50 and 100) of taxa associated with
its alignments. By default, t = 100 and the algorithm is identical to the simple naive LCA. This is
set using the LCA Percent item.
7
Functional Analysis
MEGAN allows functional analysis using SEED, COG and KEGG.
MEGAN Ultimate Edition also includes functional analysis using PFAM and allows the user to UE
generate and use additional classifications.
7.1
Identification of SEED Functional Classes
The SEED classification of gene function consists of a collection of biologically defined subsystems
[15]. The SEED classification can be displayed as a tree containing about 10,000 nodes and edges.
Genes are mapped onto functional roles and these are present in one or more subsystems. The
program will attempt to map each read onto a gene that has an known functional role and then
into one or more subsystems.
To perform this analysis, MEGAN uses a mapping of RefSeq ids to SEED functional roles. Hence,
if a SEED-based analysis is desired, then the database that is used in the BLAST comparison
must contain RefSeq-ids. This is the case for the NCBI-NR database. The Import Blast dialog
12
provides other options for identifying SEED functional roles.
7.2
Identification of COGs
The COG classification of gene function consists of a collection of biologically defined clusters of
orthologous groups [19, 17]. The COG classification can be displayed as a tree containing many
nodes and edges. Genes are mapped onto COGs and NOGs . The program will attempt to map
each read onto a gene that has an known COG or NOG.
To perform this analysis, MEGAN uses a mapping of RefSeq ids to COGs. Hence, if a COG-based
analysis is desired, then the database that is used in the BLAST comparison must contain RefSeqids. This is the case for the NCBI-NR database. The Import Blast dialog provides other options
for identifying COGs.
7.3
Mapping of Reads to KEGG groups and pathways
The KEGG database provides a collection of metabolic pathways and other pathways [9]. The
KEGG classification can be displayed as a tree, which we refer to as the Kegg tree . Genes are
mapped onto so-called KO groups and these are present in one or more pathways. The program
will attempt to map each read onto a gene that has a valid KO identifier and thus to one or more
pathways.
To perform this analysis, MEGAN uses a mapping of RefSeq-ids to KO groups. Hence, if a KEGGbased analysis is desired, then the database that is used in the BLAST comparison must contain
RefSeq-ids. This is the case for the NCBI-NR database. The Import Blast dialog provides other
options for identifying KO groups.
Due to KEGG licensing restrictions, KEGG pathways cannot be viewed in KEGG. However, if
you have a KEGG ftp license, then the Ultimate Edition of MEGAN allows you to view KEGG
pathways within MEGAN using files downloaded from KEGG. In this case, using your paid access
to the KEGG ftp site, download the pathway/map directory from the KEGG ftp site and copy all
map*.png and map*.conf to the directory called class/resources/kegg in the MEGAN installation directory. Then restart MEGAN6 Ultimate Edition and you will be able to view KEGG
pathways in the KEGG Viewer.
8
Comparison of samples
Multiple samples can be opened simultaneously and then displayed together in a comparison view,
by selecting Options→Compare... .
9
Main Window
The Main window is used to display the taxonomy and to control the program via the main menus.
Initially, at startup, before reopening or creating a new RMA file, the Main window displays the
13
NCBI taxonomy. By default, the taxonomy is only drawn to its third level. Parts of the taxonomy,
or the full taxonomy, can be explored using the menu items of the window.
Once a data set has been read in, the full NCBI taxonomy is replaced by the taxonomy that is
induced by the data set. The size of nodes indicates the number of reads that have been assigned
to the nodes using the algorithm described in Section 6.3.
Double-clicking on a node will produce a textual report stating how many reads have been assigned
to the corresponding taxon and how many reads have been assigned in total to the taxon and to
any of the taxa below the given node in summary.
Subtrees can be collapsed and expanded, as described below. Most windows in MEGAN provide
access to their functionality through menus, a tool bar that contains a selection of the menu items,
and popup menus that also provide contextual access to menu items.
We now discuss all menus of the Main window.
9.1
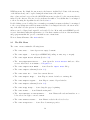
The File Menu
The
File menu contains the following items:
• The
File→New... item: Open a new empty document.
• The
File→Open... item: Open a MEGAN file (ending on .rma, .meg or .megan).
• The
File→Open Recent submenu (Section 9.2).
• The File→Open From Server...
item: Open the Server Browser window to allow
access to files hosted on an instance of MeganServer.
• The
File→Import From BLAST... item: Show the Import Blast dialog.
• The
File→Import submenu (Section 9.3).
• The
File→Save As... item: Save current data set.
• The
File→Export Image... item: Export content of window to an image file.
• The
File→Export Legend... item: Export content of legend window.
• The
File→Export submenu (Section 9.4).
• The
File→Page Setup... item: Setup the page for printing.
• The
File→Print... item: Print the main panel.
• The File→Extract To New Document...
below selected node(s) to a new document.
item: Extract all reads and matches on or
• The
File→Extract Reads... item: Extract reads for the selected nodes.
• The
File→Properties... item: Show document properties.
14
• The
File→Close item: Close the window.
• The
File→Quit item: Quit the program (Windows and Linux only).
9.2
The Open Recent Submenu
The
Open Recent menu allows the user to reopen recently opened files.
9.3
The Import Submenu
The
Import menu contains the following items:
• The Import→CSV Format...
item: Load data in delimiter-separated-values (CSV)
format: READ-NAME,CLASS-NAME,SCORE or CLASS,COUNT(,COUNT...).
• The Import→BIOM Format...
item: Import data from a table in BIOM1 format (see
http://biom-format.org/documentation/format-versions/biom-1.0.html).
• The Import→Metadata...
item: Import a metadata mapping file (as defined in
http://qiime.org/documentation/file_formats.html).
9.4
The Export Submenu
The
Export menu contains the following items:
• The Export→CSV Format...
item: Export assignments of reads to nodes to a CSV
(comma or tab-separated value) file.
• The Export→BIOM Format... item: Export data in BIOM 1.0 format (see http://biomformat.org/documentation/format-versions/biom-1.0.html).
• The Export→Metadata...
item: Export a metadata mapping file (as defined in
http://qiime.org/documentation/file-formats.html).
• The Export→Taxonomic Paths... item: Export assignments of reads weighted taxonomic
paths.
• The
Export→Tree... item: Export induced tree (in Newick format).
• The Export→Reads...
nodes, if any selected).
item: Export all reads to a text file (or only those for selected
• The Export→Matches...
item: Export all matches to a text file (or only those for
selected nodes, if any selected).
• The Export→Alignments...
leaves.
item: Calculate and export alignments for all selected
15
• The Export→Assembly...
nodes.
• The
item: Compute and export assembly of reads for all selected
Export→MEGAN Summary File... item: Export as summary file.
9.5
The Edit Menu
The
Edit menu contains the following items:
• The
Edit→Cut item: Cut.
• The
Edit→Copy item: Copy.
• The
Edit→Copy Image item: Copy image to clipboard.
• The
Edit→Copy Legend item: Copy legend image to clipboard.
• The
Edit→Paste item: Paste.
• The
Edit→Edit Node Label item: Edit the node label.
• The
Edit→Edit Edge Label item: Edit the edge label.
• The
Edit→Description... item: Edit or show the description of the data.
• The
Edit→Format... item: Format nodes and edges.
• The
Edit→Find... item: Open the find toolbar.
• The
Edit→Find Again item: Find the next occurrence.
• The
Edit→Preferences submenu.
9.6
The Preferences Submenu
The
Preferences menu contains the following items:
• The
Preferences→Fix Taxon Mapping submenu.
• The Preferences→Use Alternative Taxonomy... item: Open alternative taxonomy.tre
and taxonomy.map files.
• The
Preferences→Use Default NCBI Taxonomy item: Open default NCBI taxonomy.
16
9.7
The Fix Taxon Mapping Submenu
The
Fix Taxon Mapping menu contains the following items:
• The Fix Taxon Mapping→Add A Change...
mapping for a given taxon.
item: Change the taxon name to taxon id
• The
Fix Taxon Mapping→List All Changes... item: List all changes.
• The
Fix Taxon Mapping→Clear All Changes... item: Clear all changes.
9.8
The Select Menu
The
Select menu contains the following items:
• The
Select→All Nodes item: Select nodes.
• The
Select→None item: Deselect all nodes.
• The
Select→From Previous Window item: Select from previous window.
• The Select→All Leaves item: Select all leaves (except Not Assigned, No Hits and Low
Complexity).
• The
Select→All Internal Nodes item: Select all internal nodes.
• The
Select→All Intermediate Nodes item: Select all intermediate nodes.
• The
Select→Subtree item: Select subtree.
• The
Select→Leaves Below item: Select all leaves below currently selected nodes.
• The
Select→Nodes Above item: Select all nodes above the currently selected nodes.
• The
Select→Invert item: Invert selection.
• The
Select→Taxonomic Rank submenu.
9.9
The Taxonomic Rank Submenu
The
Taxonomic Rank menu contains the following items:
• The
Taxonomic Rank→Super Kingdom item: Select Super Kingdom.
• The
Taxonomic Rank→Phylum item: Select Phylum.
• The
Taxonomic Rank→Class item: Select Class.
• The
Taxonomic Rank→Order item: Select Order.
17
• The
Taxonomic Rank→Family item: Select Family.
• The
Taxonomic Rank→Genus item: Select Genus.
• The
Taxonomic Rank→Species item: Select Species.
9.10
The
The Options Menu
Options menu contains the following items:
• The Options→Change LCA Parameters... item: Rerun the LCA analysis with different
parameters.
• The Options→Set Number Of Reads...
item: Set the total number of reads in the
analysis (will initiate recalculation of all classifications).
• The
Options→Taxon Disabling submenu.
• The Options→List Summary... item: List summarized counts for nodes selected of tree.
• The
Options→List Paths... item: List path from root to node for all selected.
• The Options→Shannon-Weaver Index... item: Compute the Shannon-Weaver diversity
index.
• The Options→Simpson-Reciprocal Index...
diversity index.
• The Options→Compare...
multiple datasets.
item: Compute the Simpson-Reciprocal
item: Open compare dialog to produce a comparison of
• The Options→Compute Taxonomic Profile...
item: Compute a taxonomic profile.
This is experimental code and a paper is in preparation.
• The Options→Open NCBI Web Page... item: Open NCBI Taxonomy web site in browser.
• The
9.11
The
Options→Inspect... item: Inspect the read-to-taxon assignments.
The Taxon Disabling Submenu
Taxon Disabling menu contains the following items:
• The
Taxon Disabling→Enable All item: Enable all taxa.
• The
Taxon Disabling→Disable... item: Disable all selected taxa or all named ones.
• The
Taxon Disabling→Enable... item: Enable all selected taxa or all named ones.
• The
Taxon Disabling→List Disabled... item: List all disabled taxa.
18
9.12
The
The Layout Menu
Layout menu contains the following items:
• The
Layout→Show Legend item: Show horizontal or vertical legend, or hide.
• The
Layout→Increase Font Size item: Set the font size.
• The
Layout→Decrease Font Size item: Decrease the font size.
• The
Layout→Expand/Contract submenu.
• The
Layout→Layout Labels item: Layout labels.
• The
Layout→Scale Nodes By Assigned item: Scale nodes by number of reads assigned.
• The Layout→Scale Nodes By Summarized item: Scale nodes by number of reads summarized.
• The
Layout→Set Max Node Height... item: Set the maximum node height in pixels.
• The
Layout→Zoom To Selection item: Zoom to the selection.
• The
Layout→Fully Contract item: Contract tree vertically.
• The
Layout→Fully Expand item: Expand tree vertically.
• The
Layout→Draw Circles item: Draw data as circles.
• The
Layout→Draw Pies item: Draw data as pie charts.
• The
Layout→Draw Coxcombs item: Draw data as coxcombs.
• The
Layout→Draw Bars item: Draw nodes as bars.
• The
Layout→Draw Heatmaps item: Draw data as heat maps.
• The
Layout→Linear Scale item: Show values on a linear scale.
• The
Layout→Sqrt Scale item: Show values on square-root scale.
• The
Layout→Log Scale item: Show values on log scale.
• The Layout→Rounded Cladogram item: Draw tree as rounded cladogram with all leaves
positioned as right as possible.
• The
Layout→Cladogram item: Draw tree as cladogram with all leaves aligned right.
• The Layout→Rounded Phylogram item: Draw tree as rounded phylogram with all leaves
positioned as left as possible.
• The Layout→Phylogram item: Draw tree as phylogram with all leaves positioned as left
as possible.
19
• The
Layout→Use Magnifier item: Turn the magnifier on or off.
• The
Layout→Draw Leaves Only item: Only draw leaves.
• The
Layout→Highlight Differences submenu.
9.13
The
The Expand/Contract Submenu
Expand/Contract menu contains the following items:
• The
Expand/Contract→Expand Horizontal item: Expand canvas horizontally.
• The
Expand/Contract→Contract Horizontal item: Contract view horizontally.
• The
Expand/Contract→Expand Vertical item: Expand canvas vertically.
• The
Expand/Contract→Contract Vertical item: Contract view vertically.
9.14
The
The Highlight Differences Submenu
Highlight Differences menu contains the following items:
• The Highlight Differences→Uncorrected item: In a comparison of exactly two samples,
highlight statistically significant differences, using no correction.
• The Highlight Differences→Holm-Bonferroni Corrected item: In a comparison of
exactly two datasets, highlight statistically significant differences, using Holm-Bonferroni correction.
• The Highlight Differences→Bonferroni Corrected item: In a comparison of exactly
two datasets, highlight statistically significant differences, using Bonferroni correction.
• The Highlight Differences→Set Highlight Color...
parison highlight color.
9.15
The
item: Set the pairwise com-
The Tree Menu
Tree menu contains the following items:
• The
Tree→Collapse item: Collapse nodes.
• The
Tree→Collapse at Level... item: Collapse all nodes at given depth in tree.
• The
Tree→Collapse At Taxonomic Rank submenu.
• The Tree→Collapse All Others item: Collapse all parts of tree that are not above or
below the selected nodes.
20
• The
Tree→Uncollapse item: Uncollapse selected nodes.
• The
Tree→Uncollapse Subtree item: Uncollapse whole subtree beneath selected nodes.
• The
Tree→Uncollapse All item: Uncollapse all nodes.
• The
Tree→Hide Low Support Nodes... item: Hide all nodes that have low support.
• The
Tree→Show Names item: Determine what to label nodes with.
• The
Tree→Show IDs item: Display the NCBI ids of taxa.
• The Tree→Show Number of Reads Assigned item: Display the number of reads assigned
to a taxon.
• The Tree→Show Number of Reads Summarized item: Display the total number of hits to
a taxon and its descendants.
• The
Tree→Node Labels On item: Show labels for selected nodes.
• The
Tree→Node Labels Off item: Hide labels for selected nodes.
• The Tree→Show Intermediate Labels item: Show intermediate labels at nodes of degree
2.
9.16
The
The Collapse At Taxonomic Rank Submenu
Collapse At Taxonomic Rank menu contains the following items:
• The
Collapse At Taxonomic Rank→Super Kingdom item: Collapse Super Kingdom.
• The
Collapse At Taxonomic Rank→Phylum item: Collapse Phylum.
• The
Collapse At Taxonomic Rank→Class item: Collapse Class.
• The
Collapse At Taxonomic Rank→Order item: Collapse Order.
• The
Collapse At Taxonomic Rank→Family item: Collapse Family.
• The
Collapse At Taxonomic Rank→Genus item: Collapse Genus.
• The
Collapse At Taxonomic Rank→Species item: Collapse Species.
9.17
The
The Window Menu
Window menu contains the following items:
• The
Window→About... item: Display the ’about’ window (Windows and Linux only).
• The
Window→Check For Updates... item: Check for updates.
21
• The
Window→How to Cite... item: Show how to cite the program.
• The
Window→Website... item: Go to the program website.
• The
Window→Message Window... item: Open the message window.
• The
Window→Reset Window Location item: Reset the location of a window.
• The
Window→Set Window Size... item: Set the window size.
• The
Window→Inspector Window... item: Open inspector window.
• The Window→Show Alignment... item: Show alignment of reads to a specified reference
sequence.
• The
Window→Main Viewer... item: Brings the main viewer to the front.
• The
Window→Open COG Viewer... item: Open COG viewer.
• The
Window→Open KEGG Viewer... item: Open KEGG viewer.
UE
• The
Window→Open PFAM Viewer... item: Open PFAM viewer.
• The
Window→Open SEED Viewer... item: Open SEED viewer.
• The
Window→Sample Viewer... item: Opens the Sample Viewer.
• The
Window→Time Series Viewer... item: Opens the Time Series Viewer.
• The
Window→Groups Viewer... item: Show groups viewer.
• The
Window→Chart... item: Show chart.
• The
Window→Word Cloud... item: Show word cloud.
• The
Window→Radial Tree... item: Show radial chart.
• The Window→Comparison Plot...
classes.
item: Plot pairwise comparison of assignments to
• The
Window→Voronoi Tree Map... item: Show Voronoi tree map.
• The
Window→Chart Microbial Attributes... item: Chart microbial attributes.
• The
Window→Cluster Analysis... item: Open a cluster analysis window.
• The Window→Rarefaction Analysis... item: Compute and chart a rarefaction curve
based on the leaves of the tree shown in the viewer.
22
9.18
Popup Menus
Many of the menu items listed above are also available through context-specific popup menus,
which are activated by a right mouse click.
9.19
The Toolbar
The toolbar contains the following items:
• The Open... item: Open a MEGAN file (ending on .rma, .meg or .megan).
• The Print... item: Print the main panel.
• The Export Image... item: Export content of window to an image file.
• The Find... item: Open the find toolbar.
• The Expand Vertical item: Expand canvas vertically.
• The Contract Vertical item: Contract view vertically.
• The Expand Horizontal item: Expand canvas horizontally.
• The Contract Horizontal item: Contract view horizontally.
• The Fully Contract item: Contract tree vertically.
• The Fully Expand item: Expand tree vertically.
• The Rounded Cladogram item: Draw tree as rounded cladogram with all leaves positioned
as right as possible.
• The Cladogram item: Draw tree as cladogram with all leaves aligned right.
• The Rounded Phylogram item: Draw tree as rounded phylogram with all leaves positioned
as left as possible.
• The Phylogram item: Draw tree as phylogram with all leaves positioned as left as possible.
• The Collapse item: Collapse nodes.
• The Uncollapse item: Uncollapse selected nodes.
• The Uncollapse Subtree item: Uncollapse whole subtree beneath selected nodes.
• The Super Kingdom item: Collapse Super Kingdom.
• The Phylum item: Collapse Phylum.
• The Class item: Collapse Class.
• The Order item: Collapse Order.
23
• The Family item: Collapse Family.
• The Genus item: Collapse Genus.
• The Species item: Collapse Species.
• The Draw Circles item: Draw data as circles.
• The Draw Pies item: Draw data as pie charts.
• The Draw Coxcombs item: Draw data as coxcombs.
• The Draw Bars item: Draw nodes as bars.
• The Draw Heatmaps item: Draw data as heat maps.
• The Linear Scale item: Show values on a linear scale.
• The Sqrt Scale item: Show values on square-root scale.
• The Log Scale item: Show values on log scale.
• The Chart... item: Show chart.
• The Word Cloud... item: Show word cloud.
• The Radial Tree... item: Show radial chart.
• The Comparison Plot... item: Plot pairwise comparison of assignments to classes.
• The Voronoi Tree Map... item: Show Voronoi tree map.
• The Inspect... item: Inspect the read-to-taxon assignments.
• The Show Alignment... item: Show alignment of reads to a specified reference sequence.
• The Extract Reads... item: Extract reads for the selected nodes.
• The Rarefaction Analysis... item: Compute and chart a rarefaction curve based on
the leaves of the tree shown in the viewer.
• The Chart Microbial Attributes... item: Chart microbial attributes.
• The Main Viewer... item: Brings the main viewer to the front.
• The Open COG Viewer... item: Open COG viewer.
• The Open KEGG Viewer... item: Open KEGG viewer.
UE
• The Open PFAM Viewer... item: Open PFAM viewer.
24
• The Open SEED Viewer... item: Open SEED viewer.
• The Cluster Analysis... item: Open a cluster analysis window.
• The Sample Viewer... item: Opens the Sample Viewer.
• The Time Series Viewer... item: Opens the Time Series Viewer.
• The Show Legend item: Show horizontal or vertical legend, or hide.
9.20
The MEGAN Menu
Under MacOS, there is an additional, standard menu associated with the program, called the
MEGAN menu. As usual, this contains the Window→About... and File→Quit menu items.
9.21
Wheel Mouse and Special Keys
Use of a wheel mouse is recommended for zooming of graphics displayed in different windows. The
default is vertical zoom . For horizontal zoom , additionally press the shift key.
To scroll the graph, either press and drag the mouse (using the right mouse button), or use the
arrow keys. To zoom the graph in verticial or horizontal direct, press the shift-key while using the
arrow keys. To increase the zoom factor, additionally press the alt key or the control key.
To select a region of nodes using the mouse, click, hold for a second until the cursor changes to an
arrow and then drag the mouse to capture the nodes to be selected.
10
Sample Viewer
The Sample Viewer provides a tabular view of all samples present in a document. The samples
can have multiple attributes and these attributes can be modified. They can also be used to color
the samples. Samples can be extracted or merged in a number of different ways.
The Sample Viewer has a number of specific menus:
10.1
The
The Attributes Menu
Attributes menu contains the following items:
• The
Attributes→Set Color... item: Set the color for all selected items.
• The
Attributes→Set Value... item: Set value for all selected items.
• The
Attributes→New... item: Create a new attribute (column) in the data table.
• The Attributes→Import From File... item: Import one or more attributes from a file
into the data table.
25
• The
Attributes→Duplicate... item: Duplicate an existing attribute (column).
• The
Attributes→Rename... item: Rename an existing attribute (column).
• The
Attributes→Delete... item: Delete an existing attribute (column).
• The Attributes→Select All Same item: Select all cells that have the same attribute and
value.
10.2
The
The Samples Menu
Samples menu contains the following items:
• The
Samples→Node Shape submenu.
• The
Samples→Group Nodes item: Group selected nodes in PCoA plot.
• The
Samples→Ungroup All item: Ungroup nodes in PCoA plot.
• The
Samples→Add... item: Add samples from open document.
• The
Samples→Add From File... item: Add samples from another document.
• The Samples→Open RMA File...
server file.
item: Open the original source RMA file or MEGAN-
• The
Samples→Show All item: Show all samples.
• The
Samples→Show Selected item: Show selected samples.
• The
Samples→Hide Selected item: Hide selected samples.
• The
Samples→Hide Unselected item: Hide samples.
• The
Samples→Duplicate... item: Duplicate selected samples (rows).
• The
Samples→Rename... item: Rename selected samples (rows).
• The
Samples→Delete... item: Delete an existing sample (row).
• The
Samples→Move Up item: Move Up.
• The
Samples→Move Down item: Move samples down.
• The Samples→Apply Reordering To Viewers item: Reorder samples in all viewers as
currently listed in table.
• The
Samples→Set Color... item: Set the color for all selected samples.
• The
Samples→Color By Attribute item: Color samples by attribute states.
26
10.3
The
The Node Shape Submenu
Node Shape menu contains the following items:
• The
Node Shape→Circle item: Circle node shape.
• The
Node Shape→Square item: Square node shape.
• The
Node Shape→Triangle item: Triangle node shape.
• The
Node Shape→Diamond item: Diamond node shape.
10.4
The
The Algorithms Menu
Algorithms menu contains the following items:
• The Algorithms→Extract Samples...
document.
• The Algorithms→Compute Core Biome...
appear in a majority of the samples.
item: Determine taxa and functions that
• The Algorithms→Compute Total Biome...
and functional content.
item: Determine total (union) taxonomic
• The Algorithms→Compute Rare Biome...
appear in a minority of samples.
item: Determine taxa and functions that
• The Algorithms→Compute Shared Biome...
taxonomic and functional content of samples.
item: Determine shared (i.e. intersection)
• The
11
item: Extract selected samples to a new
Algorithms→Resample... item: Resample selected samples to a new document.
Cluster Analysis Viewer
TheCluster Analysis viewer provides methods for comparing multiple samples. It can be opened
for any comparison document containing at least four samples. The Cluster Analysis viewer allows
one to compute a distance matrix on the set of samples, based either on their taxon profiles, or
based on their functional classification (for example SEED or KEGG) profiles. The viewer provides
a number of different ecological indices to compute the distances. By default the distances are
based on the leaves of the corresponding tree, however, if some nodes of the tree are selected, then
only those nodes are used in the calculation.
The calculated distances are displayed as a PCoA plot (principle coordinates analysis), a hierarchical
clustering (UPGMA tree), an unrooted tree (Neighbor-Joining tree) or an unrooted split network
(Neighbor-net), see [12] for details.
27
MEGAN also computes and displays biplot vectors in a PCoA plot . These vectors indicate which
taxa or functional groups have the largest influence in PCoA plot. MEGAN is able to show both a
two dimensional PCoA and a three dimensional PCoA plot.
When viewing a three dimensional PCoA plot, click and drag the mouse to roll the plot around.
To rotate it, in addition, press the control key. To slide it, in addition, press the alt key.
The cluster viewer has a number of specific menus:
11.1
The
The Cluster Analysis Viewer Edit Menu
Cluster Analysis Viewer Edit menu contains the following items:
• The
Edit→Copy item: Copy the current data.
• The
Edit→Copy Image item: Copy the current data as an image.
• The
Edit→Copy Legend item: Copy legend image to clipboard.
• The
Edit→Paste item: Paste the current data.
• The
Edit→Format... item: Format nodes and edges.
• The
Edit→Node Shape submenu.
• The
Edit→Group Nodes item: Group selected nodes in PCoA plot.
• The
Edit→Ungroup All item: Ungroup nodes in PCoA plot.
• The
Edit→Show Groups item: Show groups using convex hull.
• The
Edit→Find... item: Open the find toolbar.
• The
Edit→Find Again item: Find the next occurrence.
11.2
The
The Cluster Analysis Node Shape Submenu
Node Shape menu contains the following items:
• The
Node Shape→Circle item: Circle node shape.
• The
Node Shape→Square item: Square node shape.
• The
Node Shape→Triangle item: Triangle node shape.
• The
Node Shape→Diamond item: Diamond node shape.
28
11.3
The
The Cluster Analysis Viewer Select Menu
Cluster Analysis Viewer Select menu contains the following items:
• The
Select→All item: Select all nodes.
• The
Select→None item: De-select nodes.
• The
Select→Invert item: Invert selection of nodes.
• The
Select→From Previous Window item: Select from previous window.
11.4
The
The Cluster Analysis Viewer Layout Menu
Cluster Analysis Viewer Layout menu contains the following items:
• The
Layout→Show Legend item: Show horizontal or vertical legend, or hide.
• The
Layout→Increase Font Size item: Set the font size.
• The
Layout→Decrease Font Size item: Decrease the font size.
• The
Layout→Expand/Contract submenu.
• The
Layout→Zoom to Fit item: Zoom to fit.
• The
Layout→Flip Horizontally item: Flip horizontally.
• The
Layout→Flip Vertically item: Flip vertically.
• The
Layout→Rotate submenu.
• The
Layout→Use Colors item: Use colors.
• The
Layout→Show Labels item: Show node labels.
• The
Layout→Set Node Radius... item: Set node radius.
• The
Layout→PC1 vs PC2 item: Set principle components to use.
• The
Layout→PC1 vs PC3 item: Set principle components to use.
• The
Layout→PC2 vs PC3 item: Set principle components to use.
• The
Layout→PCi vs PCj... item: Set principle components to use.
• The
Layout→PC1 PC2 PC3 item: Display first three principle components.
• The
Layout→PCi PCj PCk... item: Display three principle components.
29
11.5
The
The Rotate Submenu
Rotate menu contains the following items:
• The
Rotate→Rotate Left item: Rotate 3D PCoA plot left.
• The
Rotate→Rotate Right item: Rotate 3D PCoA plot right.
• The
Rotate→Rotate Up item: Rotate 3D PCoA plot up.
• The
Rotate→Rotate Down item: Rotate 3D PCoA plot down.
11.6
The
The Cluster Analysis Viewer Options Menu
Cluster Analysis Viewer Options menu contains the following items:
• The Options→Use Normalized Goodall item: Use normalized Goodall’s ecological index.
• The
Options→Use Goodall item: Use Goodall’s ecological index.
• The
Options→Use Chi-Square item: Use ChiSquare ecological index.
• The
Options→Use Kulczynski item: Use Kulczynski ecological index.
• The
Options→Use Bray-Curtis item: Use Bray-Curtis ecological index.
• The
Options→Use Hellinger item: Use Hellinger ecological index.
• The
Options→Use Euclidean item: Use Euclidean ecological index.
• The
Options→Use Pearson item: Use Pearson’s correlation distance.
• The Options→Use JSD item: Use square root of Jensen-Shannon divergence (see Arumugam
et al. 2011).
• The
11.7
The
Options→Sync item: Sync view of data.
The Cluster Analysis Viewer View Menu
Cluster Analysis Viewer View menu contains the following items:
• The
View→PCoA item: Open the PCoA tab.
• The
View→UPGMA Tree item: Open the UPGMA tree tab.
• The
View→NJ Tree item: Open the NJ tree tab.
• The
View→Network item: Open the network tab.
• The
View→Matrix item: Open the matrix tab.
30
• The
View→Show BiPlot item: Show biplot loading vectors.
• The
View→BiPlot Size... item: Set the number of bi-plot vectors to show.
• The
View→Show TriPlot item: Show tri-plot loading vectors.
• The
View→TriPlot Size... item: Set the number of tri-plot vectors to show.
11.8
The Cluster Analysis Viewer Toolbar
The Cluster Analysis Viewer toolbar contains the following additional items not included in the
Main View toolbar:
• The PC1 vs PC2 item: Set principle components to use.
• The PC1 vs PC3 item: Set principle components to use.
• The PC2 vs PC3 item: Set principle components to use.
• The PCi vs PCj... item: Set principle components to use.
• The PC1 PC2 PC3 item: Display first three principle components.
• The PCi PCj PCk... item: Display three principle components.
• The Shape item: Change selected nodes to circle, square, triangle or diamond node shape.
• The Group Nodes item: Group selected nodes in PCoA plot.
• The Ungroup All item: Ungroup nodes in PCoA plot.
• The Sync item: Sync view of data.
12
Import Dialog
TheImport Blast dialog is used to import new data from BLAST (or a similar tool) and to create
a new RMA file. The dialog has a number of tabbed panes.
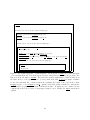
12.1
Files Tab
The Files tab is used to setup the location of the input and output files. The program allows
to open more than one BLAST file or reads files, for the case that reads and matches are spread
across multiple files. Please note that all reads must have unique names (where the name of a read
is the first word of hits header line) and all BLAST matches associated with a given read must
appear consecutively within a BLAST file. If the matches associated with a given read are located
in different parts of a file or even in different files, then MEGAN will not be able to handle this
gracefully and a messy error may occur. The first item is used to specify the location of the BLAST
file or a similar comparison file in a BLAST-like or SAM format. Once the file has been specified,
31
MEGAN will attempt to detect the type of the file provided. If the program is unsuccessful at this,
then use the dropdown menus to set the file type and the datatype stored in the file. The second
item is used to specify the location of the reads file. If the reads are from a paired-read project,
then selecting the Paired reads check box will request MEGAN to perform a paired-read analysis
(see [13]). Paired reads are expected to start with the same header, only differing in a suffix that
the user is prompted to specify, if selecting the paired-read mode (or not differing at all).
The third item is used to specify the location of the new RMA file. The Max number of matches
per read item specifies how many matches per read to save in the RMA file. A small value will
reduce the size of the RMA file, but may exclude some important matches. By default, the 100
highest scoring matches per read are saved.
The fourth item allows the user to enter a one-line description of the sample. This will appear as
a Description attribute in the samples Sample Viewer.
Once this information has been collected, the user should review the other panels, as described
below, before pressing the Apply button to import the data.
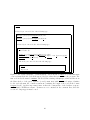
12.2
Taxonomy Tab
The Taxonomy Tab is used to specify how MEGAN identifies taxa in BLAST output or a similar
file. By default, the program attempts to parse taxon names. Additionally, a mapping file that
maps RefSeq ids to taxon ids can be used, or a file that maps GI accession numbers to taxon ids,
or a file that maps arbitrary strings (“synonyms”) to taxon ids. The format of the mapping files
is as follows: each line contains two items, separated by a tab. The files should end on .map, .txt
and can be gripped (ending with .gz). In addition, MEGAN can process indexed GI mapping files
that are available from the MEGAN6 website. These files end on .bin and contain a binary index
that is not read into memory. Mapping files ending on .map are assumed to contain tab separated
pairs of GI numbers and classification ids.
12.3
COG Tab
The COG Tab is used to specify how MEGAN identifies COG classes in a BLAST or similar file.
By default, the program uses a built-in RefSeq to COG mapping. Other options are an external
RefSeq ids to COG id mapping, or a file that maps GI accession numbers to COG ids, or a file
that maps arbitrary strings (“synonyms”) to COG ids. See Taxonomy Tab for a brief description
of file formats.
12.4
KEGG Tab
The KEGG Tab is used to specify how MEGAN identifies KEGG KO groups in a BLAST or
similar file. By default, the program uses a built-in RefSeq to KO mapping. Other options are an
external RefSeq ids to KO mapping, or a file that maps GI accession numbers to KOs, or a file that
maps arbitrary strings (“synonyms”) to KOs ids. See Taxonomy Tab for a brief description of file
formats.
32
UE
12.5
PFAM Tab
The PFAM Tab is used to specify how MEGAN identifies PFAM functional roles in a BLAST or
similar file. By default, the program uses a built-in RefSeq to PFAM mapping. Other options are
an external RefSeq ids to PFAM id mapping, or a file that maps GI accession numbers to PFAM
ids, or a file that maps arbitrary strings (“synonyms”) to PFAM ids. See Taxonomy Tab for a
brief description of file formats.
12.6
SEED Tab
The SEED Tab is used to specify how MEGAN identifies SEED functional roles in a BLAST or
similar file. By default, the program uses a built-in RefSeq to SEED mapping. Other options are
an external RefSeq ids to SEED id mapping, or a file that maps GI accession numbers to SEED
ids, or a file that maps arbitrary strings (“synonyms”) to SEED ids. Note that the SEED ids used
by MEGAN are not official ids. See Taxonomy Tab for a brief description of file formats.
12.7
LCA Parameters Tab
The LCA Parameters Tab contains all items of the Parameters dialog (see Section refsec:Parameters Dialog) which allows one to set the parameters used by the LCA algorithm. Because
re-computation of an analysis at a later stage can take quite long on a very large sample, it is recommended to set these values appropriately before starting the import process.
13
Inspector Window
The Inspector Window can be used to inspect the alignments that are the basis of the assignment
of reads to taxa. It can be opened either using the Window→Inspector Window... menu item or
by right-clicking on a taxon and then selecting the Inspect popup item. This window displays
data hierarchically using a data tree. The root node of this tree represents the current input file.
This window can only be opened when data has been loaded into the program.
Any taxon added to the window, either by right-clicking a taxon and then selecting the Inspect
popup item in the main viewer, or by using the Edit→Show Taxon item, is shown at a second
level below the root. In a similar way you can add specific reads by using the Edit→Show Reads
item, which will allow you to select reads by specifying a regular expression matching the read
names. Clicking on a taxon node will open a new level of nodes, each read node representing a
read that has been assigned to the named taxon. Clicking on a read node will then open a new
level of nodes, each such read hit node representing an alignment of the given read to a sequence
associated with some taxon. Finally, double-clicking on a read hit node will display the actual
BLAST alignment provided to deduce the relationship.
33
13.1
Inspector Menus
Here we describe those menu items that are different from the main window.
13.2
The
The Inspector Edit Menu
Edit menu contains the following items:
• The
Edit→Cut item: Cut from inspector.
• The
Edit→Copy item: Copy.
• The
Edit→Paste item: Paste.
• The
Edit→Clear item: Clear the selected nodes, or all, if none selected.
• The
Edit→Find... item: Open the find toolbar.
• The
Edit→Find Again item: Find the next occurrence.
• The
Edit→Show Taxon... item: Show the named taxon and all reads assigned to it.
• The Edit→Show Reads...
expression.
13.3
The
14
item: Show all reads whose names match the given regular
The Inspector Options Menu
Options menu contains the following items:
• The
Options→Collapse item: Collapse the selected nodes, or all, if none selected.
• The
Options→Expand item: Expand the selected nodes, or all, if none selected.
• The
Options→Sort Reads Alphabetically item: Sort reads alphabetically.
Rarefaction Window
The Rarefaction Window is used to compute and draw a species rarefaction plot. This operates
by repeatedly sampling subsets from a set of reads and computing the number of leaves to which
taxa have been assigned. This analysis uses the current leaves of the taxonomy, in other words
collapsing or uncollapsing nodes will lead to a different result. There are two properties that can
be set: Use setprop NumberRareFactionDataPoints=hnumberi to set the number of datapoints
to be plotted for each sample. Use setprop NumberRareFactionReplicates=hnumberi to set the
number of replicates to be used for each datapoint.
Here we describe those Rarefaction Window menu items that are different from the main window.
34
14.1
The
The Rarefaction Window Edit Menu
Edit menu contains the following items:
• The
Edit→Cut item: Cut.
• The
Edit→Copy item: Copy.
• The
Edit→Copy Image item: Copy image to clipboard.
• The
Edit→Copy Legend item: Copy legend image to clipboard.
• The
Edit→Paste item: Paste.
• The
Edit→Select All item: Selection.
• The
Edit→Select None item: Deselect all.
• The
Edit→Select Top... item: Select top items only.
• The
Edit→From Previous Window item: Select from previous window.
• The
Edit→Show All item: Show data items.
• The
Edit→Show Selected item: Show selected data items.
• The
Edit→Hide Unselected item: Hide unselected data items.
• The
Edit→Hide Selected item: Hide selected data items.
• The
Edit→Set Color... item: Set the color of a series or class.
• The
Edit→Find... item: Open the find toolbar.
• The
Edit→Find Again item: Find the next occurrence.
14.2
The
The Rarefaction Window Options Menu
Options menu contains the following items:
• The
Options→Set Title... item: Set the chart title.
• The
Options→Set Series Label... item: Set the series label of the data set.
• The
Options→Set Classes Label... item: Set the classes label of the data set.
• The
Options→Set Counts Label... item: Set the counts label of the data set.
• The
Options→Linear Scale item: Show values on a linear scale.
• The
Options→Sqrt Scale item: Show values on square-root scale.
• The
Options→Log Scale item: Show values on log scale.
• The
Options→Percentage Scale item: Show values as percentage assigned.
35
14.3
The
The Rarefaction Window Layout Menu
Layout menu contains the following items:
• The
Layout→Font submenu.
• The
Layout→Show Legend item: Show chart legend.
• The
Layout→Show Values item: Show values as text.
• The
Layout→Show x-Axis item: Show the x-axis.
• The
Layout→Show y-Axis item: Show the y-axis.
• The
Layout→Use Jitter item: Jitter points in 2D plot to make them more visible.
• The
Layout→Rectangle Shape item: Set wordcloud shape.
• The
Layout→Show Internal Labels item: Show internal labels in Radial Chart.
• The Layout→Set Max Radius...
co-occurrence plot.
item: Set the max radius to use for nodes in a
• The
Layout→Labels Standard item: Category labels drawn standard.
• The
Layout→Labels Up 45o item: Category labels drawn upward in 45o angle.
• The
Layout→Labels Down 45o item: Category labels drawn downward in 45o angle.
• The
Layout→Labels Up 90o item: Category labels drawn upward in 90o angle.
• The
Layout→Labels Down 90o item: Category labels drawn downward in 90o angle.
• The
Layout→Expand Horizontal item: Expand view.
• The
Layout→Contract Horizontal item: Contract view.
• The
Layout→Expand Vertical item: Expand view vertically.
• The
Layout→Contract Vertical item: Contract view vertically.
• The
Layout→Zoom To Fit item: Zoom to fit.
• The
Layout→Rotate Left item: Rotate Radial Chart left.
• The
Layout→Rotate Right item: Rotate Radial Chart right.
• The
Layout→Transpose item: Transpose the chart.
36
14.4
The
The Rarefaction Window Font Submenu
Font menu contains the following items:
• The
Font→Title Font... item: Set the font used for the title.
• The
Font→X-Axis Font... item: Set the font used for the x-axis.
• The
Font→Y-Axis Font... item: Set the font used for the y-axis.
• The
Font→Legend Font... item: Set the font used for values.
• The
Font→Values Font... item: Set the font used for values.
• The
Font→Draw Font... item: Set the font used for drawing.
15
Chart Window
There is one chart window per document per type of analysis.
15.1
Taxon Chart Window
The Taxon Chart Window is used to visualize the abundance distribution of the taxa as a (stacked)
bar chart , brick chart , bubble chart , co-occurrence network , heat map , (stacked) line chart , pie chart
radial space filling tree , Voronoi tree map or word cloud .
It can be opened using the Window→Chart... menu item. To present a specific set of taxa in
the chart, select them in the main window and then press the sync button in the chart window
tool bar.
The co-occurrence network is controlled by a number of parameters. The threshold sets the
minimum count required for a taxon to be considered present in a sample. The min prevalence
and max prevalence parameters are used to set the minimum and maximum percentage of samples
in which a taxon can occur, respectively, so as to have the taxon to be presented by a node in
the network. The probablity sets parameter defines the minimum probability that a co-occurrence
between two taxa A and B must attain so as to be represented by an edge in the graph. The
probability of coocurrence is computed as the number of samples that contain both A and B,
divided by the number number of samples that contain either A or B.
16
SEED Window
The SEED window is used to display a SEED analysis of gene function, based on [15]. The SEED
classification is displayed as a tree. Genes are mapped onto functional roles and these are present
in one or more subsystems. Modes of interaction and available menu items are similar to those of
the main window.
37
The window is split into two panes. The right pane contains a tree-based display of the result of
the SEED classification. The left pane contains two tabs, one containing a textual tree-based view
and the other using a heat-map style listing of the current leaf nodes of the tree displayed in the
right pane.
17
COG Window
The COG window is used to display a COG analysis of gene function, based on [15]. The SEED
COG is displayed as a tree. Genes are mapped onto COGs and these are present in one or more
subsystems. Modes of interaction and available menu items are similar to those of the main window.
The window is split into two panes. The right pane contains a tree-based display of the result of
the COG classification. The left pane contains two tabs, one containing a textual tree-based view
and the other using a heat-map style listing of the current leaf nodes of the tree displayed in the
right pane.
18
KEGG Window
The KEGG window is used to display a KEGG analysis of gene function, based on [9]. The KEGG
classification is displayed as a tree. Genes are mapped onto enzymes and these are present in one
or more pathways. Modes of interaction and available menu items are similar to those of the main
window.
The window is split into two panes. The right pane contains a tree-based display of the result of
the KEGG classification. The left pane contains two tabs, one containing a textual tree-based view
and the other using a heat-map style listing of the current leaf nodes of the tree displayed in the
right pane.
In the Ulimate Edition, the right pane of the window is tabbed. Initially, only the tree-based UE
display of the KEGG classification is visible. However for Ultimate Edition users who own a valid
KEGG licence, by double-clicking on any item in the left pane for which a KEGG-pathway diagram
exists, a new pathway tab is opened containing the corresponding pathway. Different shades of
green are used to indicate how many reads were assigned to any given enzyme of gene-product in
the pathway.
Another way to open a pathway tab is to use the following menu item, which is available in the
Options menu and from context menus associated with nodes:
• The
Options→Show KEGG Pathway... item: Show the specified KEGG pathway.
38
UE
19
PFAM Window
The PFAM window is used to display aPFAM analysis of gene function [5]. The PFAM classification
is displayed as a tree. Genes are assigned to protein families, which are clustered in clans of related
families. Modes of interaction and available menu items are similar to those of the main window.
The window is split into two panes. The right pane contains a tree-based display of the result of
the PFAM classification. The left pane contains two tabs, one containing a textual tree-based view
and the other using a heat-map style listing of the current leaf nodes of the tree displayed in the
right pane.
20
User-defined Classifiers
In MEGAN6 Ultimate Edition, users can define and use their own classifiers. To generate a classifier,
a tab separated mapping file (.map) assigning the classifiers IDs to GI identifiers is needed, as well
as a naming file, assigning names to the classifiers IDs. Additionally the hierarchical structure of
the classifiers has to be provided as a tree (.tre) in Newick format. From these three files, a classifier
for MEGAN can be generated and used in a similar way as the predefined functional classifications.
Each user defined classification is displayed as a tree. Modes of interaction and available menu
items are similar to those of the main window.
The window is split into two panes. The right pane contains a tree-based display of the result of
the classification. The left pane contains two tabs, one containing a textual tree-based view of the
hierarchy and the other using a heat-map style listing of the current leaf nodes of the tree displayed
in the right pane.
21
Alignment Viewer
TheAlignment Viewer is used to compute and visualize a multiple sequence alignment of all reads
that have significant matches to a reference sequences associated with a given taxon, SEED class
or KEGG class. It can be opened using the Window→Show Alignment... menu item or by
right-clicking on a taxon and then selecting the Show Alignment...
popup item. Here is
an overview of the menus available in this viewer and those menu items that do not appear in the
main viewer.
21.1
The Alignment Viewer Export Submenu
The Export submenu in the File menu of the Alignment Viewer contains the following items:
• The
Export→Alignment... item: Save alignment to a file.
• The
Export→Contigs... item: Assemble reads and export contigs.
• The
Export→Consensus... item: Export consensus sequence to a file.
39
• The
Export→Reference... item: Export reference sequence to a file.
• The Export→Overlap Graph...
nodes.
21.2
The
item: Build and export the overlap graph for selected
The Alignment Viewer Edit Menu
Edit menu contains the following items:
• The
Edit→Cut item: Cut.
• The
Edit→Copy item: Copy.
• The
Edit→Paste item: Paste.
• The
Edit→Copy Alignment item: Copy.
• The
Edit→Copy Consensus item: Copy selected consensus sequence to clipboard.
• The
Edit→Copy Reference item: Copy selected reference sequence to clipboard.
• The
Edit→Copy Read Names item: Copy the names of selected reads to the clip-board.
• The
Edit→Select All item: Select all cells of the alignment.
• The
Edit→Select None item: Select none of the cells of the alignment.
• The
Edit→From Previous Window item: Select from previous window.
• The
Edit→Find... item: Open the find toolbar.
• The
Edit→Find Again item: Find the next occurrence.
• The
Edit→Find Read... item: Find and select a read using a regular expression.
• The
Edit→Preferences submenu.
21.3
The
The Alignment Viewer Preferences Submenu
Preferences menu contains the following items:
• The Preferences→Set Minimum Number of Reads... item: Globally set the minimum
number of aligned reads required for a reference sequence to be listed in the alignment viewers.
40
21.4
The
The Alignment Viewer Options Menu
Options menu contains the following items:
• The
Options→Move Up item: Move selected sequences up.
• The
Options→Move Down item: Move selected sequences down.
• The
Options→Translate... item: Translate sequenced DNA or cDNA sequence.
• The
Options→Chart Diversity... item: Chart diversity ratio.
• The
Options→Show Insertions item: Show insertions in reads.
• The
Options→Contract Gaps item: Contract all columns consisting only of gaps.
• The
Options→Show Nucleotides item: Show nucleotides in alignment.
• The
Options→Show Amino Acids item: Show amino-acids in alignment.
• The
Options→Show Reference item: Show reference sequence.
• The
Options→Show Consensus item: Show consensus sequence.
• The
Options→Show Unaligned item: Show the unaligned prefix and suffix of reads.
• The
Options→Set Amino Acid Colors... item: Set the color scheme for amino acids.
• The Options→Matches Vs Reference item: Color letters that match the reference sequence.
• The Options→Mismatches Vs Reference
reference sequence.
• The
Options→Matches Vs Consensus
sequence.
item: Color letters that match the consensus
• The Options→Mismatches Vs Consensus
consensus sequence.
21.5
The
item: Color letters that do not match the
item: Color letters that do not match the
The Alignment Viewer Layout Menu
Layout menu contains the following items:
• The
Layout→As Mapping item: Layout sequences as mapped.
• The
Layout→By Start item: Layout sequences by their start positions.
• The
Layout→By Name item: Layout sequences alphabetically by their names.
• The
Layout→By Contigs item: Layout sequences by assembled contigs.
41
• The
Layout→Unsorted item: Layout sequences in unsorted order.
• The
Layout→Expand/Contract submenu.
• The
Layout→Zoom To Fit item: Zoom to fit.
• The
Layout→Expand To Height item: Expand to readable height.
• The
Layout→Reset Zoom item: Reset.
• The
Layout→Zoom To Selection item: Zoom to selection.
The minimum overlap required to assemble two reads aligned to the same reference into a contig is 20 bp (as used in the
Export→Contigs
menu
item).
At present, this is a program property (i.e., not document specific).
It can be changed to 40, for example, by entering the command setprop UE
alignment-min-overlap=40 using the Window→Command Input... window.
By default, the alignment viewer only shows as many positions as covered by alignments. To
show additional positions at the end of the alignment, enter the following command setprop
alignmentViewerAdditionalPositions=hnumberi using the Window→Command Input... menu
item.
22
Group Viewer
The Group Viewer is used to define or display groups of samples.
23
Find Toolbar
The Find toolbar can be opened using the Edit→Find... item. Its purpose is to find taxa,
genes or other strings in a window. Use the following check boxes to parametrize the search:
• If the Whole words only item is selected, then only taxa or reads matching the complete
query string will be returned.
• If the Case sensitive item is selected, then the case of letters is distinguished in comparisons.
• If the Regular Expression item is selected, then the query is interpreted as a Java regular
expression.
• In the taxonomy viewer, use the
among currently collapsed nodes.
Uncollapse item to allow MEGAN to search for taxa
Press the Close, First or Next buttons to close the toolbar, or find the first, or next occurrence
of the query, respectively. Press the All button to find all occurrences of the query.
Press the From File button (marked by a file image) to load a set of queries, one per line, from a
text file.
42
24
Format Dialog
The Format dialog is opened using the Edit→Format... item. This is used to change the font,
color, size and line width of all selected nodes and edges. Also, it is used to turn labels on and off.
25
Message Window
The Message window is opened using the Window→Message Window... item. The program
writes all messages to this window. The window contains the usual File and Edit menu items.
26
Parameters Dialog
The Parameters dialog is used to control the parameters of the LCA-assignment algorithm. It
can be invoked by selecting Options→Change LCA Parameters... . The dialog options in the
Parameters tab are:
• The Min Score item is used to set a minimum threshold for the bit score of alignments or
“hits”. Any hit in the input data that scores less than the given threshold is ignored.
• The Max Expected item is used to set a maximum threshold for the expected value of hits.
Any hit in the input data whose E-value exceeds this value is ignored.
• The Min Percent Identity item is used to set a minimum percent identity for alignments.
• The Top Percentage item is used to set a threshold for the maximum percentage by which
the score of a hit may fall below the best score achieved for a given read. Any hit that falls
below this threshold is discarded.
• The Min Support item is used to set a threshold for the minimum support that a taxon
requires, that is, the number of reads that must be assigned to it so that it appears in the
result. Any read that is assigned to a taxon that does not have the required support is pushed
up the taxonomy until a node is found that has sufficient support.
The dialog options in the Advanced tab are:
• The Min Support Percent item is used to set a threshold for the minimum support that
a taxon requires, as a percentage of assigned reads. This feature is turned off by setting the
value to 0. If a value greater than 0 (and at most 100) is given, then the program will set the
Min Support threshold appropriately.
• The LCA Percent item is used to set the percent of matches that the LCA of a read must
cover, in the range 50-100. When a value of less than 100 is specifiedm then the LCA of a
fixed percent is used. The Min Complexity item is used to identify low complexity reads
[20, 14]. These are placed on a special Low Complexity node. To turn this filter off, set the
value to 0. A value of 0.3 catches most low complexity short reads.
43
• The Paired Reads item is used to turn paired-read awareness of MEGAN on and off.
In paired-read mode, MEGAN utilities read-pairing information to enhance the taxonomic
assignment of reads.
• The Use 16S Percent Identity Filter item is used to turn on an additional filter for
assigning reads to a specific taxonomic level. When this is active, the percent identity of
a match must exceed the given value of percent identity to be assigned at the given rank:
Species 99%, Genus 97%, Family 95%, Order 90%, Class 85%, Phylum 80%. This should
only be used when analyzing 16S rRNA sequences.
27
Compare Dialog
The Compare dialog is opened using the Options→Compare... item. This dialog provides a
list of currently open samples. To construct a comparison, select at least two different samples
and then press “Apply”. Select Use Absolute Counts , if you want the comparison the original
counts of reads for each sample. Select Use Normalized Counts , if you want all counts to be
normalized to the smallest number of reads of any of the selected samples. Select Use Square
Root Normalization , if you want to normalize counts by taking their square-root (recommended
by statistician Susan Holmes). Select Use Sub-Sampled Counts , if you want all counts to be
randomly subsampled download to the smallest count of any of the given samples. Each sample
is subsampled 1000 times and then the rounded average counts are used. To globally change the
number of replicates used, enter the following command setprop subSampleReplicates=hnumberi
using the Window→Command Input... menu item. Select Ignore all unassigned reads , if
you want all reads assigned to the three special nodes labeled ’Not Assigned’, ’No Hits’ and ’Low
Complexity’ (if present) to be ignored.
28
Extractor Dialog
This provides an alternative to the Export→Reads... item which allows to save reads from
different taxa to files whose names contain the taxon name.
The Extractor dialog is opened using the File→Extract Reads... item. The dialog is used
to extract all reads assigned to selected nodes. For any selected nodes, all reads assigned to it are
saved to a file. By selecting the Include Summarized Reads checkbox you not only extract all
reads assigned to the selected node, but also the reads assigned to all nodes below them.
Use the Browse button to specify the output directory. Specify the file name for output in the
File name field. If the name contains %t, then the program will produce one output file per node,
and the name of the file is generated by replacing %t by the node name. Otherwise, all reads are
written to one file.
44
29
Export Image Dialog
The Export Image dialog is opened using the File→Export Image... item. This dialog is used
to save a picture of the current tree in a number of different formats, see Section 32.6.
The format is chosen from a menu. There are two radio buttons Save whole image to save the
whole image, and Save visible image to save only the part of the image that is currently visible
in the main viewer. If the chosen format is EPS, then selecting the Convert text to graphics
check box will request the program to render all text as graphics, rather than fonts.
Pressing the apply button will safe the graphics file to the location given in the File field.
30
About Window
The About Window is opened using the Window→About... item. It shows the program’s splash
screen.
31
Server Browser Window
The Server Browser window is opened using the File→Open From Server... menu item.
The window is used to connect MEGAN to one or more MeganServer instances, allowing the user
to open MEGAN files that are stored remotely on a server.
MeganServer is a light-weight server program, written by Hans-Joachim Ruscheweyh, that runs on
a server and provides access to selected RMA files on the server via a REST interface. (See the
documentation for MeganServer for details).
Use the
Server Browser:Add server tab to connect to a new remote server.
For example, set the server to http://megan-db.org/Public, and the user and password both to
guest to access 12 MEGAN RMA files computed for the samples described in [11], as well as other
example datasets.
Once an instance of MeganServer has been successfully contacted, a directory tree will be displayed
that mirrors the directory structure of the server. Double-clicking on a file name will open that
file. To open a comparison document for multiple files, select the files of interest and then press
the Compare button.
A currently opened server will have its own tab in the Server Browser, until it is closed by selecting
the Close remote server toolbar item.
MEGAN will remember previously contacted MeganServer instances and thus previously opened
files can be directly reopened using the Open Recent menu. If you do not want this to happen
without MEGAN requesting the confidentials for the server again, you can deselect the Save
credentials checkbox when first connecting to the server.
45
32
File Formats
MEGAN uses its own file formats to store the data describing the result of a sequence comparison
computation between a file of DNA reads and a database of reference sequences, such as computed
by BLASTX, BLASTP or BLASTN [1].
32.1
RMA Files
Files ending in .rma are in a compressed binary format called RMA (read-match archive), which
is a new open format that we will describe in a separate document. MEGAN 1 used a text format
(files ending on .megan or .meg), which are now deprecated and will not be supported by futher
versions of the program. By convention, we use the suffix .megan for MEGAN text files and .rma
for binary read-match archive files.
With MEGAN 4, we introduced a new version of the RMA format, internally known as RMA 2.
This format was more flexible, as it does not necessarily need to contain all reads and matches.
Moreover, it has better locality and thus updating it is much faster.
MEGAN6 uses another update of the RMA file format, known as RMA6. Older RMA file versions
can still be opened in MEGAN6, but RMA6 files are not compatible with previous versions. RMA6
requires only a third of the space that RMA2 does. Internally, it uses a compression version of the
SAM format.
A RMA file is generated using the File→Import From BLAST... menu item from a BLAST
file and a read file (or from multiple files, if the reads are spread across multiple files).
32.2
The Text File Summary Format
A MEGAN file starts with a number of header lines, each starting with a . These lines can occur
in any order. This is best illustrated by an example:
1
2
3
4
5
6
7
8
9
10
11
@Creator
MEGAN (version 4.0alpha20, built 14 Oct 2010)
@CreationDate
Wed Oct 27 17:10:52 CEST 2010
@ContentType
Summary4
@Names 155_PE_1_fixed-paired
ecoli-testrun-2000-nr
@Uids
1288068180866
1288190195887
@Sizes 51246
2000
@TotalReads
200000
@Collapse
SEED
2000041
@Algorithm
Taxonomy
tree-from-summary
@Parameters
normalizedTo=100000
@NodeStyle
KEGG
piechart
The first and second lines are optional descriptions of who generated the file when. The third line
identifies the format as Summary4, indicating that this is a summary file in the format introduced
with MEGAN 4. The fourth line lists the names of all samples that are represented by this file. In
this case there are two. Line 5 of this example lists the unique identifier numbers associated with the
46
samples, if any. Line 6 lists the original sizes of the samples. Line 7 lists the total number of reads.
This is not necessary the sum of the original sizes. Line 8 specifies, for the SEED classification,
which nodes are to be collapsed in the visual representation of the classification. The keyword
SEED can be replaced for example by TAXONOMY or KEGG for the other classifications. Line
9 contains the name of the algorithm used to compute a classification. The second word here is a
keyword to identify which classification is meant. Line 10 lists parameters of the computation used
to generate the file. Line 11 specifies the style used to draw nodes in a given classification, in this
case KEGG.
The main body of a MEGAN text file contains multiple lines as follows:, in any order:
TAX
TAX
TAX
TAX
TAX
KEGG
KEGG
KEGG
SEED
199310
1
28216
32523
2
7716
3859
7714
54
0
271
35
8
8336
12
2
2
6
1250
100
1350
100
50
The general format is classification, count-1, count-2, ..., count-n. Here, classification is either
TAX for taxonomy, SEED or KEGG. This is followed by a number indicating a class in the given
classification. In the case of taxonomy, this is the NCBI taxonId. This is followed by up to n
numbers, where n is the number of samples mentioned in the header, indicating how many reads
in the 1-st, 2-nd etc sample were assigned to the given class.
32.3
Required Syntax of BLAST Files
MEGAN imports data from a BLAST file. MEGAN can parse BLAST files (from BLAST and tools
producing comparable output) in standard or XML format obtained using the BLAST output option
-m 0 or -m 7, respectively. MEGAN can also parse tabular format (BLAST output option -m 8).
For this to work, the subject field must either contain taxon names or GI accession numbers. In the
latter case, please use the Load GI-Lookup File button to load a GI lookup file. Alternatively, a
ninth column may be supplied that contains either the taxon name or taxon Id associated with the
database sequence. The program also scans the subject field for RefSeq identifiers to determine
the associated gene.
MEGAN can read gzipped BLAST files and zipped BLAST files .
For human readable format, any BLASTX file or BLASTP file is expected to adhere to the format
shown in Figure 1. Any BLASTN file is expected to adhere to the format shown in Figure 2.
32.4
How MEGAN Parses Taxon Names
MEGAN uses the following algorithm to determine the taxon from the header line of a reference
sequence. If the string consists only of an integer, then this is interpreted as a taxon id. Otherwise,
47
BLASTX text
text...
followed by 0 or more blocks of the following type:
Query= hquery-idi text length=hlengthi text
or
Query= hquery-idi text|length|hlengthi|text
text...
followed by 0 or more blocks of the following type:
> text [hNCBI-taxon-namei] text
(line breaks ok)
Score = hscorei bits (hbitsi ) Expect = he-valuei
Identities = text (hpercent-identitiesi%)
Positives = text (hpercent-positivesi%), Gaps = text (hpercent-gapsi%)
Frame = hframei
followed by 0 or more blocks of the following type:
Query text
text
Sbjct text
Figure 1: The required structure of a BLASTX file. Labels shown as label are tokens that must
occur verbatim in the file. Labels shown as hlabeli are values that are read into the program. The
first word in the file must be BLASTX. The header line starting with Query =, which is taken from
the Fasta header of the query sequence (a read), must start with a one word unique identifier
for the read and must also contain a statement containing the length of the read, in the format
length=hlengthi, or as |length|hlengthi|. Another important feature is that the comment line
of the database sequence must contain a NCBI-taxon name. If names are not contained in the
comment lines, then the accession lookup support must be used. Finally, the Gaps= statement is
optimal.
48
BLASTN text
text...
followed by 0 or more blocks of the following type:
Query= hquery-idi text length=hlengthi text
or
Query= hquery-idi text|length|hlengthi|text
text...
followed by 0 or more blocks of the following type:
> text hNCBI-taxon-namei text
(line breaks ok)
Score =hscorei bits (hbitsi ) Expect =he-valuei
Identities = text (hpercent-identitiesi%) Gaps = text (hpercent-gapsi%)
Strand= hstrandi / hstrandi
followed by 0 or more blocks of the following type:
Query text
text
Sbjct text
Figure 2: The required structure of a BLASTN file. Labels shown as label are tokens that must
occur verbatim in the file. Labels shown as hlabeli are values that are read into the program. The
first word in the file must be BLASTN. The header line starting with Query=, which is taken from
the Fasta header of the query sequence (a read), must start with a one word unique identifier
for the read and must also contain a statement containing the length of the read, in the format
length=hlengthi. Another important feature is that the comment line of the database sequence
must contain a NCBI-taxon name. If names are not contained in the comment lines, then the
accession lookup support must be used.
49
if Use Synonyms is turned on, then MEGAN attempts to match an entry in the given synonyms
file. A synonyms file defines a mapping between words that appear in the match header and taxa
or other classes. The longest matching synonym is used to determine the taxon. Otherwise, if Use
GI Lookup is turned on, then MEGAN searches for an occurrence of the string gi| followed by a
number and tries to use the number as a GI accession to determine the taxon.
Otherwise, if the header line contains a semi-colon, then MEGAN assumes that a list of taxon names
is given, e.g. Bacteria;Proteobacteria; Alpha proteobacteria, as present, for example, in the
Silva database. In this case, MEGAN uses the right-most name to determine the taxon id.
Otherwise, if the header line contains the text /TAXON ID=, then MEGAN will attempt to read
a taxon id following the text. This syntax is used in BLAST files obtained from the CAMERA
website.
Otherwise, MEGAN searches for all pairs of disjoint square brackets and attempts to parse the
strings between such brackets to obtain a set of taxon ids. The taxon id for the match is then
set to the LCA of the ids. (In the NCBI-NR database, names of taxa are placed between square
brackets.)
Otherwise, MEGAN searches for maximal and non-overlapping substrings that can be mapped onto
an NCBI taxon id. Again, the taxon id of the match is set to the LCA.
Otherwise, the taxon is set to ’unknown’.
32.5
Required Format of Read Files
Reads from sequencing are assume to be provided in fasta format or fastq format in a reads file .
The file (or files) may be gzipped. The first word of a FastA header is assumed to be the read-id.
32.6
Graphics Formats
The following graphics formats are supported:
• BMP, “Bitmap”.
• EPS, “Encapsulated PostScript”, vector format.
• GIF, “Graphics Interchange Format”.
• JPEG, “Joint Photographic Experts Group”.
• PDF, “Portable Document Format”, vector format.
• PNG, “Portable Network Graphics”.
• SVG, “Scalable Vector Graphics”, vector format.
50
32.7
CSV File Format
MEGAN supports importing data from other programs in a comma-separated format from a CSV
file , using the Import→CSV Format... menu item. The input file must be a text file in which
either all lines each contain two strings that are separated by a comma or tab. or all lines each
contain three strings separated by commas or tabs.
Importing read assignments If each line of the CSV file contains two strings separated by
a comma, then the first string will be intepreted as a taxon name or taxon id and the second
string will be intepreted as an integer specifying the number of reads assigned to the named taxon.
MEGAN will assume that this is the result of some analysis and thus will produce a summary file
from it and will simply display it on the NCBI taxonomy with no further analysis.
For example, assume that you have performed a metagenome analysis using some other method
and have obtained the following result:
• Gammaproteobacteria: 55 reads
• Mollicutes: 400 reads
• Escherichia coli K-12: 42 reads
• Unknown: 100 reads
To import this data into MEGAN so as to visualize the taxonomical assignments, produce the
following CSV file:
Gammaproteobacteria, 55
Mollicutes, 400
Escherichia coli K-12, 42
Not assigned, 100
MEGAN will draw a tree with four nodes, one for each of the named taxa.
Importing read matches Otherwise, if each line of the CSV file contains three strings separated
by a comma, the first string will be interpreted as a read id, the second one as a taxon name or id
and the third one will be interpreted as a bit score for this assignment. MEGAN will assume that
this data describes a collection of reads and their matches. This data will be analysed using the
LCA algorithm and the result will be displayed on the NCBI taxonomy.
For example, assume that you have done a database search using some other method than BLAST
and have obtained the following result:
• The read r01 matches Escherichia coli CFT073 with a bitscore of 100,
• The read r01 matches Escherichia coli K-12 with a bitscore of 110, and
• The read r01 matches Salmonella enterica subsp. enterica serovar Choleraesuis str. SC-B67
with a bitscore of 120.
51
• The read r02 matches Caldicellulosiruptor saccharolyticus DSM 8903 with a bitscore of 90.
To import this data into MEGAN so as to analyze is using the LCA algorithm, produce the following
CSV file:
r01, Escherichia coli CFT073, 100
r01, Escherichia coli K-12, 110
r01, Salmonella enterica subsp. enterica serovar Choleraesuis str. SC-B67,120
r02, Caldicellulosiruptor saccharolyticus DSM 8903, 90
MEGAN can also import SEED, COD or KEGG counts. In addition, MEGAN is able to map
entries consisting of a RefSeq Id and counts to KEGG, COG or SEED. In the Ultimate Edition
this also includes PFAM.
Use the Multiplier field to set a multipler that is applied to all counts.
32.8
Tree and Map Format
The NCBI taxonomy is loaded by MEGAN at startup. It is contained in a NCBI tree file in the
standard Newick tree format. The mapping from taxon-IDs to taxon names is loaded by MEGAN
at startup. It is contained contained in a NCBI mapping file in a line based format in which each
has three entries: taxon-ID, taxon name and then a number indicating the size of the genome, or
-1, if the size is unknown.
33
Command-Line Options
The Ultimate Edition of MEGAN6 allows to run the program in command-line mode . This and UE
the following Section 34 only apply to Ultimate Edition.
MEGAN has the following command-line options:
Mode:
-g, --commandLineMode
Run MEGAN in command-line mode. Default value: false.
Input:
-f, --files [string(s)]
MEGAN file(s) to open.
Commands:
-x, --execute [string]
-c, --commandFile [string]
Configuration:
-E, --quitOnException
Command to execute at startup
(do not use for multiple commands).
File of commands to execute in command-line mode.
Quit if exception thrown in command-line mode.
Default value: false.
52
-p, --propertiesFile [string]
+w, --hideMessageWindow
-V, --version
-S, --silentMode
-d, --debug
+s, --hideSplash
-rc, --registrationCode [string]
Other:
-v, --verbose
-h, --help
Properties file. Default value: Megan.def.
Hide message window. Default value: false.
Show version string. Default value: false.
Silent mode. Default value: false.
Debug mode. Default value: false.
Hide startup splash screen. Default value: false.
Enter registration code.
Echo commandline options and be verbose.
Default value: false.
Show program usage and quit.
When running in command-line mode, the program will first executing any command given with
the -x option and then will read commands from the file specified using the -c command. If no
such file is given, additional commands are read from standard input.
Please note that windows will still open when in command-line mode, but should not be used
interactively. (This is necessary for the program to fully implement all graphical commands.) To
prevent windows from opening, or to use the command-line mode on a server, please use the linux
virtual frame buffer command xvfb-run, as shown here:
xvfb-run --auto-servernum --server-num=1 MEGAN +g
Please be aware that the command-line version of the program uses the same properties file as the
interactive version. So, any preferences set using the interactive version of the program will also
apply to the command-line version of the program. It this is not desired, then please use the -p
option to supply a different properties file.
Another important thing to note is that the command-parser operates in a line-by-line fashion.
When processing commands in a given line, the parser makes note of required updates to the
taxonomy and data-structures. These updates are not executed until all commands in the current
input line have been processed. For example, if you want to open and MEGAN file and then to
save a picture of the taxonomical analysis in a PDF file, then the two commands should be entered
on separate lines because otherwise the taxonomy will be drawn before the data from the MEGAN
file has been processed. Here is an example of the correct way to produce a picture of a taxonomic
analysis:
open file=’/Users/huson/data/megan/x.rma’
export image file=’/Users/huson/data/megan/x.pdf’ format=PDF replace=true
quit
Alternatively, the update command is used to explicitly force MEGAN to update all datastructures, in this case the commands show appear together on one line, e.g.:
open file=’x.rma’;update;exportimage file=’x.pdf’format=PDF replace=true;
53
As described below, the update command takes a number of different parameters that is used to
determine exactly what type of update is required.
Please use the -x option only to specify a single command, as updating may otherwise not work
correctly.
One example of using MEGAN command-line mode is given in Section 34.1. Other examples and
recipes for command-line scripts performing common use cases of MEGAN are available in the
MEGAN community.
34
Command-Line Commands
Each type of window that can be opened by MEGAN has its own command interpreter. Initially, on startup the program will open a Main window and all commands piped to the program
will be executed using the command interpreter associated with the main window. The main
window provides a number of commands for opening other windows. For example, the command show window=seedviewer; will open the SEED classification viewer. To pipe commands
to the SEED viewer, the command context has to be set to the SEED viewer, by entering set
context=seedviewer;. After entering this command, all subsequent commands are handled by
the interpreter associated with the SEED viewer. To obtain a list of all commands available for
the current interpreter, enter help;. In obtain help on a particular command, for example on
export, enter help export;. All command description lines that contain the word “export” (case
insensitive) will be listed.
In the following we list all commands available in the Main viewer. Other viewers support many
of these commands, too, but also other, viewer-specific ones. To determine which commands are
available for a given window, run MEGAN in GUI mode, open the window of interest and then
select the Window→Command Syntax... item to obtain a listing of all commands available for
the given window. Here are the commands that are available in the Main viewer:
Available commands (context=MainViewer):
File menu:
new; - Open a new empty document
open file=<filename> [readOnly={false|true}]; - Open a MEGAN file (ending on .rma, .meg or .megan)
show window=RemoteBrowser; - Open browser for remote files
show window=ImportBlast; - Show the ’Import from Blast’ dialog
save file=<filename> [summary={true|false}]; - Save current data set
exportImage file=<filename> [descriptionFile=<filename>] [format={bmp|eps|gif|jpg|pdf|png|svg}] [replace={false|true}]
[visibleOnly]={false|true}] [textAsShapes={false|true}] [title=<string>];
- Export content of window to an image file
exportLegend file=<filename> [format={bmp|eps|gif|jpg|pdf|png|svg}] [replace={false|true}] [textAsShapes={false|true}];
- Export content of legend window
show window=pagesetup; - Setup the page for printing
show window=print; - Print the main panel
extract what=document file=<megan-filename> [data={COG|KEGG|PFAM|SEED|Taxonomy}]
[ids=<SELECTED|numbers...>] [allBelow={false|true}];
- Extract all reads and matches for all selected nodes to a new document
show window=ExtractReads; - Extract reads for the selected nodes
show window=properties; - Show document properties
close; - Close the window
Import sub-menu:
import csv={reads|summary} separator={comma|tab} file=<fileName> fNames={COG|KEGG|PFAM|SEED|Taxonomy,...} [topPercent=<num>] [minScore=<num>] [minSupportPercent=<num>]
- Load data in CSV (comma- or tab-separated value) format: READ_NAME,CLASS-NAME,SCORE or CLASS,COUNT(,COUNT...)
import format=biom file=<fileName>;
- Import data from a table in BIOM 1.0 format (see http://biom-format.org/documentation/format_versions/biom-1.0.html)
import metaData=<file> [format={metaDataMapping}];
- Import a metadata mapping file (as defined in http://qiime.org/documentation/file_formats.html)
Export sub-menu:
export what=CSV format={format} [separator={comma|tab}] [counts={assigned|summarized}] file=<filename>;
54
[m
- Export assignments of reads to nodes to a CSV (comma or tab-separated value) file
export format=biom data={COG|KEGG|PFAM|SEED|Taxonomy} file=<filename>;
- Export data in BIOM 1.0 format (see http://biom-format.org/documentation/format_versions/biom-1.0.html)
export metaData=<file> [format={metaDataMapping}];
- Export a metadata mapping file (as defined in http://qiime.org/documentation/file_formats.html)
export what=paths file=<filename>; - Export assignments of reads weighted taxonomic paths
export what=tree file=<filename> [simplify={false|true}] [showInternalLabels={true|false}] [showUassigned={true|false}];
- Export induced tree (in Newick format)
export what=reads [data={COG|KEGG|PFAM|SEED|Taxonomy}] file=<filename>;
- Export all reads to a text file (or only those for selected nodes, if any selected)
export what=matches [data={COG|KEGG|PFAM|SEED|Taxonomy}] file=<filename>;
- Export all matches to a text file (or only those for selected nodes, if any selected)
export what=alignment file=<filename> data={COG|KEGG|PFAM|SEED|Taxonomy} classId={number[,number...]|selected} [asConsensus={false|true}] [asContigs={false|true}]
[useEachReadOnlyOnce={true|false}] [useEachReferenceOnlyOnce={true|false}] [includeInsertions={true|false}]
[refSeqOnly={false|true}] [contractGaps={false|true}] [translateCDNA={false|true}] [minReads={number}] [minLength={number}] [minCoverage={number}];
- Calculate and export alignments for all selected leaves
export assembly file=<name> [minOverlap=<number>] [minReads=<number>] [minCoverage=<number>] [minLength=<number>] [showGraph={false|true}] ;
- Compute and export assembly of reads for all selected nodes
Edit menu:
copyLegend; - Copy legend image to clipboard
set description=<text>; - Edit or show the description of the data
show window=formatter; - Format nodes and edges
show findToolbar={true|false}; - Open the find toolbar
Preferences sub-menu:
Fix Taxon Mapping sub-menu:
changeMapping taxName=<taxon-name> taxId=<taxon-id>;
- Change the taxon name to taxon id mapping for a given taxon
changemapping list; - List all changes
changemapping clear; - Clear all changes
Select menu:
select nodes={all|none|leaves|internal|previous|subtree|leavesBelow|nodesAbove|intermediate|invert}
- Select nodes
select nodes=previous; - Select from previous window
Taxonomic Rank sub-menu:
Options menu:
recompute [minSupportPercent=<number>] [minSupport=<number>] [minScore=<number>] [maxExpected=<number>] [topPercent=<number>] [lcaPercent=<number>] [minComplexity=<number>
[useMinimalCoverageHeuristic={false|true}] [pairedReads={false|true}] [useIdentityFilter={false|true}]
[fNames={COG|KEGG|PFAM|SEED]; - Rerun the LCA analysis with different parameters
set totalReads=<num>;
- Set the total number of reads in the analysis (will initiate recalculation of all classifications)
list summary nodes={all|selected} [outFile=<name>];
- List summarized counts for nodes selected of tree
list paths nodes=selected [outFile=<name>]; - List path from root to node for all selected
compute index={Shannon|SimpsonReciprocal} [data={Taxonomy|SEED|KEGG}];
- Compute the Shannon-Weaver diversity index
compare mode={ABSOLUTE|RELATIVE|SUBSAMPLE|SQRT} [ignoreUnassigned={false|true}] [pid=<number> ...] [meganFile=<filename> ...];
- Open compare dialog to produce a comparison of multiple datasets
show window=profile; - Compute a taxonomic profile
show webpage taxon=<name|id>; - Open NCBI Taxonomy web site in browser
inspector taxa=selected; - Inspect the read-to-taxon assignments
Taxon Disabling sub-menu:
enable taxa=all; - Enable all taxa
disable taxa={selected|<name,...>}; - Disable all selected taxa or all named ones
enable taxa={selected|all|<name,...>}; - Enable all selected taxa or all named ones
list taxa=disabled; - List all disabled taxa
Layout menu:
show legend={horizontal|vertical|none}; - Show horizontal or vertical legend, or hide
set fontSize={<number>|increase|decrease}; - Set the font size
set autoLayoutLabels={true|false}; - Layout labels
set scaleBy={Summarized|Assigned|None}; - Scale nodes by number of reads assigned
set maxNodeHeight=<number>; - Set the maximum node height in pixels
zoom selected; - Zoom to the selection
zoom fit; - Contract tree vertically
zoom full; - Expand tree vertically
set nodeDrawer={Summarized|Assigned|None}; - Draw data as pie charts
set scale={linear|percent|log}; - Show values on a linear scale
set magnifier={true|false}; - Turn the magnifier on or off
set drawLeavesOnly={true|false}; - Only draw leaves
Expand/Contract sub-menu:
expand direction={horizontal|vertical}; - Expand canvas horizontally
contract direction={horizontal|vertical}; - Contract view horizontally
Highlight Differences sub-menu:
set highlightDifferences={true|false} [correction={none|bonferroni|holm_bonferroni}];
- In a comparison of exactly two samples, highlight statistically significant differences, using no correction
set comparisonHighlightColor=<number>; - Set the pairwise comparison highlight color
Tree menu:
collapse nodes={SELECTED|name [name name ...]}; - Collapse nodes
55
collapse level=<num>; - Collapse all nodes at given depth in tree
collapse except={id...}; - Collapse all parts of tree that are not above or below the selected nodes
uncollapse nodes={all|selected|<name ...>} [subtree={false|true}]; - Uncollapse selected nodes
hide minSupport=<number>; - Hide all nodes that have low support
nodeLabels [names=<bool>] [ids=<bool>] [assigned=<bool>] [summarized=<bool>];
- Determine what to label nodes with
show labels=selected; - Show labels for selected nodes
hide labels=selected; - Hide labels for selected nodes
show intermediate=<bool>; - Show intermediate labels at nodes of degree 2
Collapse At Taxonomic Rank sub-menu:
Window menu:
register licenseKey=<string>; - Register a license key
show window=howToCite; - Show how to cite the program
show window=website; - Go to the program website
show window=message; - Open the message window
reset windowLocation; - Reset the location of a window
set windowSize=<width> x <height>; - Set the window size
show window=inspector; - Open inspector window
show window=aligner; - Show alignment of reads to a specified reference sequence
show window=mainViewer; - Brings the main viewer to the front
open viewer=COG; - Open COG viewer
xOpen viewer=KEGG; - Open KEGG viewer
open viewer=PFAM; - Open PFAM viewer
open viewer=SEED; - Open SEED viewer
show window=sampleViewer; - Opens the Sample Viewer
show window=timeSeriesViewer; - Opens the Time Series Viewer
show window=groups; - Show groups viewer
show chart drawer={BarChart,BricksChart,BubbleChart,CoOccurrencePlot,HeatMap,LineChart,NormalizedBarChart,PieChart,Plot2D,RadialTreeChart,StackedBarChart,StackedLineChart,
- Show chart
show comparisonPlot [data={COG|KEGG|PFAM|SEED|Taxonomy]};
- Plot pairwise comparison of assignments to classes
show VoronoiTree data={COG|KEGG|PFAM|SEED|Taxonomy}; - Show Voronoi tree map
show window=clusterViewer; - Open a cluster analysis window
show rarefaction data={COG|KEGG|PFAM|SEED|Taxonomy};
- Compute and chart a rarefaction curve based on the leaves of the tree shown in the viewer
help [keyword(s)]; - Show syntax of commands for current viewer
Additional commands:
addSample [sample=<name>] source=<filename|pid> ... [overwrite={false|true}];
- Add samples from other documents
addServer url=<url> [user=<user>] [password=<password>];
- Add a MEGAN server to the persistent list of known servers
apply majorityVote voteConfidence=<\%ofConfidence>
- Apply a the majority vote filter. Reads with a defined percentage of matches assigned to one taxon will bypass the LCA and assign the read to this taxon.
collapse rank={SuperKingdom|Kingdom|Phylum|Class|Order|Family|Varietas|Genus|Species_group|Species|Subspecies}
- Collapse tree at specific taxonomic rank
compare title=<string> name=<string> samples=<string ...> [name=<string> samples=<string ...>] ... [comparisonMode={ABSOLUTE|RELATIVE|SUBSAMPLE|SQRT}] [ignoreUnassigned={f
- Compare some groups of samples
compute profile={Projection|MatchBased} rank={SuperKingdom|Kingdom|Phylum|Class|Order|Family|Varietas|Genus|Species_group|Species|Subspecies [minPercent=number]};
- Computes a taxonomic profile by projecting all counts on to a given rank
export overlapGraph file=<name> [minOverlap=<number>] [showGraph={false|true}];
- Build and export the overlap graph for selected nodes
export readname2taxpath file=<file>; - Export readname to taxonomic path for all reads
export selected path file=<file>; - Export select Path
export taxonname_count separator={comma|tab} folder=<foldername> - Export assignments
export what=matchPatterns taxon=<id or name> rank=<name> file=<filename>;
- Export all match signatures for the select node
extract samples=<name1 name2 ...>; - Extract samples to a new document
extract what=reads outDir=<directory> outFile=<filename-template> [data={COG|KEGG|PFAM|SEED|Taxonomy}][ids=<SELECTED|numbers...>]
[names=<names...>] [allBelow={false|true}]; - Extract reads for the selected nodes
help [keyword(s)]; - Show syntax of commands for current viewer
import blastFile=<name> [,<name>...] [fastaFile=<name> [,<name>...]] meganFile=<name> format={BlastText|BlastXML|BlastTab|RapSearch2Aln|RDPAssignmentDetails|RDPStandalone
mode={BlastN|BlastP|BlastX|Classifier} [maxMatches=<num>] [minScore=<num>] [maxExpected=<num>]
[topPercent=<num>] [minSupportPercent=<num>] [minSupport=<num>] [lcaPercent=<num>] [minComplexity=<num>] [useIdentityFilter={false|true}]
[fNames={COG|KEGG|PFAM|SEED|Taxonomy...} [paired={false|true} [pairSuffixLength={number}]]
[hasMagnitudes={false|true}] [description=<text>];
- Import BLAST (or RDP or Silva or SAM) and reads files to create a new MEGAN file
list assigned nodes={all|selected} [outFile=<name>]; - List assigned counts for selected nodes of tree
list assignmentsToLevels [outFile=<name>];
- List the number of reads assigned to each level of the taxonomy
listServers; - List all added servers
load colorFile=<filename>; - Load a palette of colors from a file (one RGB color per line)
load mapFile=<filename> mapType=<mapType> cName=<name> ; - Loads a mapping file
load taxonomyFile=<filename> [mapFile=<filename>]; - Load taxonomy.tre and taxonomy.map files
mpAnalyzer what={lca-ranks|compare} infile=<filename> outfile=<filename>;
- Compute the rank at which the LCA is found for each mate-pair, or preprocess comparison
open viewer=KEGG; - Open KEGG viewer
open viewer=Taxonomy; - Open Taxonomy viewer
queryServer url=<url> query={countFiles|listFiles}; - Query a known server
quit; - Quit the program
remoteServer url=<url>; - Add a MEGAN server to the persistent list of known servers
scrollTo node=<name>; - Scroll to a specific node
select id=<number> ...; - Select the nodes for the given ids
select name=<name> <name> ... [state={true|false}]; - Select the named nodes
select rank={SuperKingdom|Kingdom|Phylum|Class|Order|Family|Varietas|Genus|Species_group|Species|Subspecies}
- Select nodes by rank
56
set color={<color>|null}; - Set the color of selected nodes and edges
set context={<window-type>|?};
- Choose command context, i.e. the window that will parse subsequent commands. Use ? to list current context and all available contexts.
set dir=<directory> - Set the current directory
set drawer={RectangularCladogram,RectangularPhylogram,RoundedCladogram,RoundedPhylogram};
- Set the tree drawer
set edgeShape={angular|straight|curved}; - Set the shape of selected edges
set edgeWidth=<integer>; - Set the width of selected edges
set fillColor={<color>|null} - Set the fill color of selected nodes
set font=<name-style-size>; - Set font nodes or edges, e.g. arial-italic-12
set fullScreen={false|true}; - Full Screen Mode
set groupNodes={none|selected}; - Group selected nodes in PCoA plot
set highlightContrasts={true|false} [alpha={number}] [bonferroni={false|true}] [ignoreUnassigned={true|false}];
- In a comparison of exactly two datasets, highlights nodes that show a significant difference
set labelColor={<color>|null}; - Set the label color of selected nodes and edges
set labelFillColor={<color>|null}; - Set the label color of selected nodes and edges
set magnifyallmode={true|false}; - Magnify the whole tree
set margin [left=<number>] [right=<number>] [bottom=<number>] [top=<number>];
- Set margins used in tree visualization
set nodeShape={none|circle|square|triangle|diamond}; - Set the node shape
set nodeSize=<integer>; - Set the size of selected nodes
set useMagnitude={true|false};
- Use reads magnitude values to weight reads, if present in their FastA header lines
setProp <name>=<value>; - Set a property
show histogram taxonId=<num>; - Shows the distribution of matches for a given taxon
show keggTab id=<num,num,...>; - Show the specified KEGG pathway
show webpage classification=<name> id=<id>; - Search for selected items in browser
show window=about; - Display the ’about’ window
show window=attributes; - Open Microbial Attributes window
show window=comparisonStats; - Open dialog to produce a statistical comparison of two datasets
toFront [file=name]; - Bring window to front
update [reProcess={false|true}] [reset={false|true}] [reInduce={false|true}]; - Update data
use fViewer=<name> state={true|false}; - Determine whether to perform a specific functional analysis
use mapType=<mapType> cName=<name> state=<true|false>; - Set activity state of map type
version; - Show version info
57
UE
34.1
Writing Scripts
The best way to run scripts with MEGAN is to prepare a file of commands and then pipe these
to MEGAN in command-line mode. Use of the -x option to supply commands is not encouraged
because of update issues. MEGAN uses updates all windows etc after a line of commands has been
entered and all commands provided using the -x option are considered to be contained in a single
line.
Here is an example of how one would use MEGAN in command-line mode on a Mac to save some
information on KEGG assignments:
/Applications/Megan/MEGAN.app/Contents/MacOS/JavaApplicationStub -g -E < commands.txt
where the
file commands.txt contains the following lines:
open file=’/Users/huson/data/megan/microbiome.rma’; show window=KeggViewer; set context=KeggViewer;
update; uncollapse nodes=all; select nodes=leaves; export what=CSV format=keggpath count
separator=tab file=’/Users/huson/data/megan/kegg.txt’; quit;
The first line is used to open a MEGAN file. Please surround the file name with single quotes as
shown here.
The second line opens the KEGG window (or KeggViewer, as it is referred to here).
The third line sets the command context to the KeggViewer (so that subsequent commands are
interpreted by the KeggViewer). The argument of this command is case sensitive. Please use
KeggViewer and not keggviewer.
The fourth line ensures that the KEGG window is uptodate.
The fifth line uncollapses the whole KEGG tree.
The sixth line selects all leaves of the KEGG tree.
The seventh line exports all KEGG paths and read counts to a file in “Delimiter separated format”.
The eight line quits the program.
More examples for using command scripts with MEGAN are available on the Community website.
35
Using More Memory
The MEGAN installer allows you to specify the amount of MEGAN that the program can use. We
recommend at least 2 GB on a 64-bit machine and recommend 8 GB on a desktop.
MEGAN is a memory-hungry application. When importing BLAST files, we recommend that you
use a machine that allows you to run MEGAN with at least 4 GB of main memory. Using less
memory will work, but Java will be forced to perform frequent garbage collection, which will slow
the program down. Also, because the program is i/o intensive, it is best to have all files on local
disks, as this will increase the speed of the program.
To run MEGAN with more than 2GB under MacOS X or Linux, edit the file
MEGAN.vmoptions contained in the installation directory, as follows: Edit the amount of memory
mentioned there to reflect the desired amount, e.g.:
-Xmx8000M
58
36
MEGAN Tools
The Linux and MacOS distributions of MEGAN have an additional tools directory that contains a
number of standalone utility programs.
The program sam2rma can be used on a server to generate a RMA file on a server. The input
must be one or more SAM files generated by either DIAMOND or MALT.
The program blast2lca provides a standalone implementation of the LCA algorithm and can also
perform KEGG classification. Input is a BLAST file or similar.
The program blast2rma is similar to the sam2rma program, it is used generate RMA files from
BLAST output on a server without running MEGAN.
More tools will follow.
37
Acknowledgments
This program uses a number of external Java libraries. The JARs and their licenses are contained
in the jars directory. MEGAN is obfuscated using yguard.
Voronoi tree maps are computed using VoronoiTreemapLibrary.jar, which was written by Arlind
Nocaj [?].
This manual was updated to MEGAN6 by Sina Beier.
References
[1] S.F. Altschul, T.L. Madden, A.A. Schaffer, J. Zhang, Z. Zhang, W. Miller, and D.J. Lipman.
Gapped BLAST and PSI-BLAST: a new generation of protein database search programs.
Nucleic Acids Res., 25:3389–3402, 1997.
[2] D.A. Benson, I. Karsch-Mizrachi, D.J. Lipman, J. Ostell, and D.L. Wheeler. Genbank. Nucleic
Acids Res, 1(33):D34–38, 2005.
[3] J Gregory Caporaso, Justin Kuczynski, Jesse Stombaugh, Kyle Bittinger, Frederic D Bushman,
Elizabeth K Costello, Noah Fierer, Antonio Gonzalez Pena, Julia K Goodrich, Jeffrey I Gordon,
et al. Qiime allows analysis of high-throughput community sequencing data. Nature methods,
7(5):335–336, 2010.
[4] J. R. Cole, Q. Wang, E. Cardenas, J. Fish, B. Chai, R. J. Farris, A. S. Kulam-Syed-Mohideen,
D. M. McGarrell, T. Marsh, G. M. Garrity, and J. M. Tiedje. The ribosomal database
project: improved alignments and new tools for rrna analysis. Nucleic Acids Research, 37(suppl
1):D141–D145, January 2009.
[5] Robert D Finn, John Tate, Jaina Mistry, Penny C Coggill, Stephen John Sammut, HansRudolf Hotz, Goran Ceric, Kristoffer Forslund, Sean R Eddy, Erik L L Sonnhammer, and Alex
Bateman. The Pfam protein families database. Nucleic Acids Res, 36:D281–D288, Jan 2008.
59
[6] Elizabeth M. Glass, Jared Wilkening, Andreas Wilke, Dionysios Antonopoulos, and Folker
Meyer. Using the metagenomics rast server (mg-rast) for analyzing shotgun metagenomes.
Cold Spring Harb Protoc, 2010(1):pdb.prot5368+, January 2010.
[7] D. H. Huson, A. F. Auch, J. Qi, and S. C. Schuster. MEGAN analysis of metagenomic data.
Genome Res, 17(3):377–386, March 2007.
[8] Daniel H Huson, Suparna Mitra, Nico Weber, Hans-Joachim Ruscheweyh, and Stephan C
Schuster. Integrative analysis of environmental sequences using MEGAN 4. Genome Research,
21:1552–1560, 2011.
[9] M. Kanehisa and S. Goto. KEGG: Kyoto encyclopedia of genes and genomes. Nucleic Acids
Res, 28(1):27–30, Jan 2000.
[10] H. Li, B. Handsaker, A. Wysoker, T. Fennell, J. Ruan, N. Homer, G. Marth, G. Abecasis,
and R. Durbin. The sequence alignment/map (SAM) format and SAMtool. Bioinformatics,
25:2078–9, 2009.
[11] Rachel Mackelprang, Mark Waldrop, Kristen DeAngelis, Maude David, Krystle Chavarria,
Steven Blazewicz, Edward Rubin, and Janet Jansson. Metagenomic analysis of a permafrost
microbial community reveals a rapid response to thaw. Nature, 480(7377):368–371, 2011.
[12] S. Mitra, J.A. Gilbert, D. Field, and D.H. Huson. Comparison of multiple metagenomes using
phylogenetic networks based on ecological indices. ISME J, 2010. doi:10.1038/ismej.2010.51.
[13] Suparna Mitra, Max Schubach, and Daniel H Huson. Short clones or long clones? a simulation
study on the use of paired reads in metagenomics. BMC Bioinformatics, 11(Suppl 1):S12+,
2010.
[14] David W. Mount. Using the basic local alignment search tool (BLAST). Cold Spring Harbor
Protocols, 2007(7):pdb.top17, 2007.
[15] Ross Overbeek, Tadhg Begley, Ralph M Butler, Jomuna V Choudhuri, Han-Yu Chuang,
Matthew Cohoon, Val´erie de Cr´ecy-Lagard, Naryttza Diaz, Terry Disz, Robert Edwards,
Michael Fonstein, Ed D Frank, Svetlana Gerdes, Elizabeth M Glass, Alexander Goesmann, Andrew Hanson, Dirk Iwata-Reuyl, Roy Jensen, Neema Jamshidi, Lutz Krause, Michael Kubal,
Niels Larsen, Burkhard Linke, Alice C McHardy, Folker Meyer, Heiko Neuweger, Gary Olsen,
Robert Olson, Andrei Osterman, Vasiliy Portnoy, Gordon D Pusch, Dmitry A Rodionov,
Christian R¨
uckert, Jason Steiner, Rick Stevens, Ines Thiele, Olga Vassieva, Yuzhen Ye, Olga
Zagnitko, and Veronika Vonstein. The subsystems approach to genome annotation and its use
in the project to annotate 1000 genomes. Nucleic Acids Res, 33(17):5691–5702, 2005.
[16] Hendrik N Poinar, Carsten Schwarz, Ji Qi, Beth Shapiro, Ross D E Macphee, Bernard Buigues,
Alexei Tikhonov, Daniel H Huson, Lynn P Tomsho, Alexander Auch, Markus Rampp, Webb
Miller, and Stephan C Schuster. Metagenomics to paleogenomics: large-scale sequencing of
mammoth dna. Science, 311(5759):392–394, Jan 2006.
[17] Sean Powell, Damian Szklarczyk, Kalliopi Trachana, Alexander Roth, Michael Kuhn, Jean
Muller, Roland Arnold, Thomas Rattei, Ivica Letunic, Tobias Doerks, Lars Juhl Jensen, Christian von Mering, and Peer Bork. eggNOG v3.0: orthologous groups covering 1133 organisms
at 41 different taxonomic ranges. Nucleic Acids Research, 40(Database-Issue):284–289, 2012.
60
[18] E. Pruesse, C. Quast, K. Knittel, B. Fuchs, W. Ludwig, J. Peplies, and F.O. Gl¨ockner. SILVA:
a comprehensive online resource for quality checked and aligned ribosomal RNA sequence data
compatible with ARB. Nuc. Acids Res., 35(21):7188–7196, 2007.
[19] R. L. Tatusov, E. V. Koonin, and D. J. Lipman. A genomic perspective on protein families.
Science, 278(5338):631–637, Oct 1997.
[20] John Wootton and Scott Federhen. Statistics of local complexity in amino acid sequences and
sequence databases. Computers & Chemistry, 17(2):149–163, 1993.
[21] Yongan Zhao, Haixu Tang, and Yuzhen Ye. RAPSearch2: a fast and memory-efficient protein
similarity search tool for next-generation sequencing data. Bioinformatics, 28(1):125–126,
2012.
61
Index
(stacked) bar chart, 37
(stacked) line chart, 37
-m 0, 47
-m 7, 47
-m 8, 47
.bin, 32
.biom, 10
.gz, 32
.map, 32
.meg, 46
.megan, 46
.rma, 46
.txt, 32
.blastn.gz, 8
.fna.zip, 8
.gz, 8
.zip, 8
About, 45
About..., 21, 25, 45
Add A Change..., 17
Add From File..., 26
Add..., 26
Algorithms, 27
Algorithms→Compute Core Biome..., 27
Algorithms→Compute Rare Biome..., 27
Algorithms→Compute Shared Biome..., 27
Algorithms→Compute Total Biome..., 27
Algorithms→Extract Samples..., 27
Algorithms→Resample..., 27
Alignment Viewer, 39
Alignment..., 39
Alignments..., 15
All, 29, 42
All Intermediate Nodes, 17
All Internal Nodes, 17
All Leaves, 17
All Nodes, 17
Apply Reordering To Viewers, 26
arb file, 10
As Mapping, 41
assemble, 42
Assembly..., 16
Attributes, 25
Attributes→Delete..., 26
Attributes→Duplicate..., 26
Attributes→Import From File..., 25
Attributes→New..., 25
Attributes→Rename..., 26
Attributes→Select All Same, 26
Attributes→Set Color..., 25
Attributes→Set Value..., 25
BIOM, 10
BIOM 1.0, 10
BIOM Format..., 10, 15
BIOM2.0, 10
BiPlot Size..., 31
BLAST file, 47
blast2lca, 59
blast2rma, 59
BLASTN file, 47
BLASTP file, 47
BLASTX file, 47
BMP, 50
Bonferroni Corrected, 20
brick chart, 37
bubble chart, 37
By Contigs, 41
By Name, 41
By Start, 41
Case sensitive, 42
Change LCA Parameters..., 18, 43
Chart Diversity..., 41
Chart Microbial Attributes..., 22, 24
Chart..., 22, 24, 37
Check For Updates..., 21
Circle, 27, 28
Cladogram, 19, 23
Class, 17, 21, 23
class/resources/kegg, 13
Classifier :: Assignment Detail, 9
Classifier :: Hierarchy View, 9
Clear, 34
Clear All Changes..., 17
Close, 15, 42
Close remote server, 45
Cluster Analysis, 27
62
Cluster Analysis Viewer Edit, 28
Cluster Analysis Viewer Layout, 29
Cluster Analysis Viewer Options, 30
Cluster Analysis Viewer Select, 29
Cluster Analysis Viewer View, 30
Cluster Analysis..., 22, 25
clusters of orthologous groups, 13
co-occurrence network, 37
COG, 13, 38
COG Tab, 32
COGs, 13
Collapse, 20, 23, 34
Collapse All Others, 20
Collapse at Level..., 20
Collapse At Taxonomic Rank, 20, 21
Collapse At Taxonomic Rank→Class, 21
Collapse At Taxonomic Rank→Family, 21
Collapse At Taxonomic Rank→Genus, 21
Collapse At Taxonomic Rank→Order, 21
Collapse At Taxonomic Rank→Phylum, 21
Collapse At Taxonomic Rank→Species, 21
Collapse At Taxonomic Rank→Super Kingdom,
21
Color By Attribute, 26
color, change, 43
command context, 54
Command Input..., 8, 42, 44
Command Syntax..., 54
command-line, 52
command-line installation, 7
command-line mode, 52
commands.txt, 58
Compare, 44, 45
Compare..., 13, 18, 44
Comparison Plot..., 22, 24
Compute Core Biome..., 27
Compute Rare Biome..., 27
Compute Shared Biome..., 27
Compute Taxonomic Profile..., 18
Compute Total Biome..., 27
Consensus..., 39
Contigs, 42
Contigs..., 39
Contract Gaps, 41
Contract Horizontal, 20, 23, 36
Contract Vertical, 20, 23, 36
Convert text to graphics, 45
Copy, 16, 28, 34, 35, 40
Copy Alignment, 40
Copy Consensus, 40
Copy Image, 16, 28, 35
Copy Legend, 16, 28, 35
Copy Read Names, 40
Copy Reference, 40
CSV file, 51
CSV Format..., 15, 51
Cut, 16, 34, 35, 40
Decrease Font Size, 19, 29
Delete..., 26
Description, 32
Description..., 16
Diamond, 27, 28
Disable..., 18
Draw Bars, 19, 24
Draw Circles, 19, 24
Draw Coxcombs, 19, 24
Draw Font..., 37
Draw Heatmaps, 19, 24
Draw Leaves Only, 20
Draw Pies, 19, 24
Duplicate..., 26
E-value, 43
Edit, 16, 34, 35, 40
Edit Edge Label, 16
Edit Node Label, 16
Edit→Clear, 34
Edit→Copy, 16, 28, 34, 35, 40
Edit→Copy Alignment, 40
Edit→Copy Consensus, 40
Edit→Copy Image, 16, 28, 35
Edit→Copy Legend, 16, 28, 35
Edit→Copy Read Names, 40
Edit→Copy Reference, 40
Edit→Cut, 16, 34, 35, 40
Edit→Description..., 16
Edit→Edit Edge Label, 16
Edit→Edit Node Label, 16
Edit→Find Again, 16, 28, 34, 35, 40
Edit→Find Read..., 40
63
Edit→Find..., 16, 28, 34, 35, 40, 42
Edit→Format..., 16, 28, 43
Edit→From Previous Window, 35, 40
Edit→Group Nodes, 28
Edit→Hide Selected, 35
Edit→Hide Unselected, 35
Edit→Node Shape, 28
Edit→Paste, 16, 28, 34, 35, 40
Edit→Preferences, 16, 40
Edit→Select All, 35, 40
Edit→Select None, 35, 40
Edit→Select Top..., 35
Edit→Set Color..., 35
Edit→Show All, 35
Edit→Show Groups, 28
Edit→Show Reads, 33
Edit→Show Reads..., 34
Edit→Show Selected, 35
Edit→Show Taxon, 33
Edit→Show Taxon..., 34
Edit→Ungroup All, 28
Enable All, 18
Enable..., 18
enzymes, 38
EPS, 50
Expand, 34
Expand Horizontal, 20, 23, 36
Expand To Height, 42
Expand Vertical, 20, 23, 36
Expand/Contract, 19, 20, 29, 42
Expand/Contract→Contract Horizontal, 20
Expand/Contract→Contract Vertical, 20
Expand/Contract→Expand Horizontal, 20
Expand/Contract→Expand Vertical, 20
Export, 14, 15, 39
Export Image, 45
Export Image..., 14, 23, 45
Export Legend..., 14
Export→Alignment..., 39
Export→Alignments..., 15
Export→Assembly..., 16
Export→BIOM Format..., 10, 15
Export→Consensus..., 39
Export→Contigs, 42
Export→Contigs..., 39
Export→CSV Format..., 15
Export→Matches..., 15
Export→MEGAN Summary File..., 16
Export→Metadata..., 15
Export→Overlap Graph..., 40
Export→Reads..., 15, 44
Export→Reference..., 40
Export→Taxonomic Paths..., 15
Export→Tree..., 15
Extract Reads..., 14, 24, 44
Extract Samples..., 27
Extract To New Document..., 14
Extractor, 44
Family, 18, 21, 24
fasta format, 50
fastq format, 50
File, 14, 39
File→Close, 15
File→Export, 14
File→Export Image..., 14, 45
File→Export Legend..., 14
File→Extract Reads..., 14, 44
File→Extract To New Document..., 14
File→Import, 14
File→Import From BLAST..., 6, 14, 46
File→New..., 14
File→Open From Server..., 14, 45
File→Open Recent, 8, 14
File→Open..., 8, 14
File→Page Setup..., 14
File→Print..., 14
File→Properties..., 14
File→Quit, 15, 25
File→Save As..., 14
Files, 31
Find, 42
Find Again, 16, 28, 34, 35, 40
Find Read..., 40
Find..., 16, 23, 28, 34, 35, 40, 42
First, 42
Fix Taxon Mapping, 16, 17
Fix Taxon Mapping→Add A Change..., 17
Fix Taxon Mapping→Clear All Changes..., 17
Fix Taxon Mapping→List All Changes..., 17
Flip Horizontally, 29
64
Flip Vertically, 29
Font, 36, 37
Font→Draw Font..., 37
Font→Legend Font..., 37
Font→Title Font..., 37
Font→Values Font..., 37
Font→X-Axis Font..., 37
Font→Y-Axis Font..., 37
font, change, 43
Format, 43
Format..., 16, 28, 43
From File, 42
From Previous Window, 17, 29, 35, 40
Fully Contract, 19, 23
Fully Expand, 19, 23
functional roles, 12
genome, 4
Genus, 18, 21, 24
GI accession, 50
GIF, 50
Group Nodes, 26, 28, 31
Group Viewer, 42
Groups Viewer..., 22
guest, 45
gzip format, 8
gzipped BLAST files, 47
Import Blast, 31
Import From BLAST..., 6, 14, 46
Import From File..., 25
Import→BIOM Format..., 10, 15
Import→CSV Format..., 15, 51
Import→Metadata..., 15
Include Summarized Reads, 44
Increase Font Size, 19, 29
Inspect, 6, 33
Inspect..., 18, 24
Inspector, 33
Inspector Window..., 22, 33
Invert, 17, 29
JPEG, 50
KEGG, 13, 38
KEGG Tab, 32
Kegg tree, 13
KO, 13
Labels Down 45o, 36
Labels Down 90o, 36
Labels Standard, 36
Labels Up 45o, 36
Labels Up 90o, 36
Layout, 19, 36, 41
Layout Labels, 19
Layout→As Mapping, 41
heat map, 37
Layout→By Contigs, 41
Hide Low Support Nodes..., 21
Layout→By Name, 41
Hide Selected, 26, 35
Layout→By Start, 41
Hide Unselected, 26, 35
Layout→Cladogram, 19
Highlight Differences, 20
Highlight Differences→Bonferroni Corrected, 20 Layout→Contract Horizontal, 36
Highlight Differences→Holm-Bonferroni Cor- Layout→Contract Vertical, 36
Layout→Decrease Font Size, 19, 29
rected, 20
Highlight Differences→Set Highlight Color..., 20 Layout→Draw Bars, 19
Layout→Draw Circles, 19
Highlight Differences→Uncorrected, 20
Layout→Draw Coxcombs, 19
Holm-Bonferroni Corrected, 20
Layout→Draw Heatmaps, 19
horizontal zoom, 25
Layout→Draw Leaves Only, 20
How to cite, 3
Layout→Draw Pies, 19
How to Cite..., 22
Layout→Expand Horizontal, 36
http://megan-db.org/Public, 45
Layout→Expand To Height, 42
Layout→Expand Vertical, 36
Ignore all unassigned reads, 44
Layout→Expand/Contract, 19, 29, 42
Import, 14, 15
65
Layout→Flip Horizontally, 29
Layout→Flip Vertically, 29
Layout→Font, 36
Layout→Fully Contract, 19
Layout→Fully Expand, 19
Layout→Highlight Differences, 20
Layout→Increase Font Size, 19, 29
Layout→Labels Down 45o, 36
Layout→Labels Down 90o, 36
Layout→Labels Standard, 36
Layout→Labels Up 45o, 36
Layout→Labels Up 90o, 36
Layout→Layout Labels, 19
Layout→Linear Scale, 19
Layout→Log Scale, 19
Layout→PC1 PC2 PC3, 29
Layout→PC1 vs PC2, 29
Layout→PC1 vs PC3, 29
Layout→PC2 vs PC3, 29
Layout→PCi PCj PCk..., 29
Layout→PCi vs PCj..., 29
Layout→Phylogram, 19
Layout→Rectangle Shape, 36
Layout→Reset Zoom, 42
Layout→Rotate, 29
Layout→Rotate Left, 36
Layout→Rotate Right, 36
Layout→Rounded Cladogram, 19
Layout→Rounded Phylogram, 19
Layout→Scale Nodes By Assigned, 19
Layout→Scale Nodes By Summarized, 19
Layout→Set Max Node Height..., 19
Layout→Set Max Radius..., 36
Layout→Set Node Radius..., 29
Layout→Show Internal Labels, 36
Layout→Show Labels, 29
Layout→Show Legend, 19, 29, 36
Layout→Show Values, 36
Layout→Show x-Axis, 36
Layout→Show y-Axis, 36
Layout→Sqrt Scale, 19
Layout→Transpose, 36
Layout→Unsorted, 42
Layout→Use Colors, 29
Layout→Use Jitter, 36
Layout→Use Magnifier, 20
Layout→Zoom To Fit, 36, 42
Layout→Zoom to Fit, 29
Layout→Zoom To Selection, 19, 42
LCA, 9
LCA of a fixed percent, 12
LCA Parameters Tab, 33
LCA Percent, 43
LCA-assignment algorithm, 12
Leaves Below, 17
Legend Font..., 37
License, 3
line width, change, 43
Linear Scale, 19, 24, 35
Linux, 7
List All Changes..., 17
List Disabled..., 18
List Paths..., 18
List Summary..., 18
Load GI-Lookup File, 47
log file, 10
Log Scale, 19, 24, 35
Low Complexity, 43
MacOS, 7
MacOS X, 7
Main, 13
Main Viewer..., 22, 24
map*.conf, 13
map*.png, 13
Matches Vs Consensus, 41
Matches Vs Reference, 41
Matches..., 15
Matrix, 30
Max Expected, 43
Max number of matches per read, 32
max prevalence, 37
MEGAN, 25
MEGAN file, 46
MEGAN project, 9
MEGAN Summary File..., 16
MEGAN COMMUNITY macos 6.1.20alpha.dmg,
7
MEGAN COMMUNITY unix 6.1.20alpha.sh, 7
MEGAN COMMUNITY windows64x 6.1.20alpha.exe, 7
66
MEGAN COMMUNITY windows 6.1.20alpha.exe,Node→Show Alignment..., 39
Nodes Above, 17
7
NOGs, 13
MEGAN Ultimate macos 6.1.20alpha.dmg, 7
None, 17, 29
MEGAN Ultimate unix 6.1.20alpha.sh, 7
MEGAN Ultimate windowsOpen COG Viewer..., 22, 24
64x 6.1.20alpha.exe, 7
Open From Server..., 14, 45
MEGAN Ultimate windows 6.1.20alpha.exe, 7
Open KEGG Viewer..., 22, 24
MeganServer, 45
Open NCBI Web Page..., 18
Message, 43
Open PFAM Viewer..., 22, 24
Message Window..., 22, 43
Open Recent, 8, 14, 15
metabolic pathways, 13
Open RMA File..., 26
Metadata..., 15
Open SEED Viewer..., 22, 25
metagenome, 4
Open..., 8, 14, 23
metagenomics, 4
Options, 18, 34, 35, 41
MG-RAST, 10
Options→Change LCA Parameters..., 18, 43
Min Complexity, 43
Options→Chart Diversity..., 41
Min Percent Identity, 43
Options→Collapse, 34
min prevalence, 37
Options→Compare..., 13, 18, 44
Min Score, 9, 43
Options→Compute Taxonomic Profile..., 18
Min Support, 43
Options→Contract Gaps, 41
Min Support Percent, 43
Options→Expand, 34
minimum overlap, 42
Options→Inspect..., 18
Mismatches Vs Consensus, 41
Options→Linear Scale, 35
Mismatches Vs Reference, 41
Options→List Paths..., 18
Move Down, 26, 41
Options→List Summary..., 18
Move Up, 26, 41
Options→Log Scale, 35
Multiplier, 52
Options→Matches Vs Consensus, 41
Options→Matches Vs Reference, 41
NCBI mapping file, 52
Options→Mismatches Vs Consensus, 41
NCBI taxonomy, 11
Options→Mismatches Vs Reference, 41
NCBI tree file, 52
Options→Move Down, 41
NCBI-NR, 11
Options→Move Up, 41
NCBI-NT, 11
Options→Open NCBI Web Page..., 18
Network, 30
Options→Percentage Scale, 35
New..., 14, 25
Options→Set Amino Acid Colors..., 41
Next, 42
Options→Set Classes Label..., 35
NJ Tree, 30
Options→Set Counts Label..., 35
Node Labels Off, 21
Options→Set Number Of Reads..., 6, 18
Node Labels On, 21
Options→Set Series Label..., 35
Node Shape, 26–28
Options→Set Title..., 35
Node Shape→Circle, 27, 28
Options→Shannon-Weaver Index..., 18
Node Shape→Diamond, 27, 28
Options→Show Amino Acids, 41
Node Shape→Square, 27, 28
Options→Show Consensus, 41
Node Shape→Triangle, 27, 28
Options→Show Insertions, 41
node size, change, 43
Options→Show KEGG Pathway..., 38
Node→Inspect, 6, 33
67
Options→Show Nucleotides, 41
Options→Show Reference, 41
Options→Show Unaligned, 41
Options→Simpson-Reciprocal Index..., 18
Options→Sort Reads Alphabetically, 34
Options→Sqrt Scale, 35
Options→Sync, 30
Options→Taxon Disabling, 12, 18
Options→Translate..., 41
Options→Use Bray-Curtis, 30
Options→Use Chi-Square, 30
Options→Use Euclidean, 30
Options→Use Goodall, 30
Options→Use Hellinger, 30
Options→Use JSD, 30
Options→Use Kulczynski, 30
Options→Use Normalized Goodall, 30
Options→Use Pearson, 30
Order, 17, 21, 23
Overlap Graph..., 40
Page Setup..., 14
Paired Reads, 44
Paired reads, 32
Parameters, 43
Paste, 16, 28, 34, 35, 40
pathway tab, 38
pathway/map, 13
PC1 PC2 PC3, 29, 31
PC1 vs PC2, 29, 31
PC1 vs PC3, 29, 31
PC2 vs PC3, 29, 31
PCi PCj PCk..., 29, 31
PCi vs PCj..., 29, 31
PCoA, 30
PCoA plot, 28
PDF, 50
Percentage Scale, 35
PFAM, 39
PFAM Tab, 33
Phylogram, 19, 23
Phylum, 17, 21, 23
pie chart, 37
PNG, 50
Preferences, 16, 40
preferences, 53
Preferences→Fix Taxon Mapping, 16
Preferences→Set Minimum Number of Reads...,
40
Preferences→Use Alternative Taxonomy..., 16
Preferences→Use Default NCBI Taxonomy, 16
Print..., 14, 23
probability of coocurrence, 37
probablity, 37
properties file, 53
Properties..., 14
QIIME, 10
Quit, 15, 25
radial space filling tree, 37
Radial Tree..., 22, 24
RAPSearch2, 6
Rarefaction, 34
Rarefaction Analysis..., 22, 24
rarefaction plot, 34
RDP, 9
RDP-Assignment-Detail, 9
RDP-standalone, 9
read file, 46
read hit node, 33
read node, 33
reads file, 50
Reads..., 15, 44
Rectangle Shape, 36
Reference..., 40
RefSeq, 12
Regular Expression, 42
Rename..., 26
Resample..., 27
Reset Window Location, 22
Reset Zoom, 42
RMA, 46
RMA file, 46
Rotate, 29, 30
Rotate Down, 30
Rotate Left, 30, 36
Rotate Right, 30, 36
Rotate Up, 30
Rotate→Rotate Down, 30
Rotate→Rotate Left, 30
Rotate→Rotate Right, 30
68
Rotate→Rotate Up, 30
Rounded Cladogram, 19, 23
Rounded Phylogram, 19, 23
SAM, 9
sam2rma, 59
Sample Viewer, 25
Sample Viewer..., 22, 25
Samples, 26
Samples→Add From File..., 26
Samples→Add..., 26
Samples→Apply Reordering To Viewers, 26
Samples→Color By Attribute, 26
Samples→Delete..., 26
Samples→Duplicate..., 26
Samples→Group Nodes, 26
Samples→Hide Selected, 26
Samples→Hide Unselected, 26
Samples→Move Down, 26
Samples→Move Up, 26
Samples→Node Shape, 26
Samples→Open RMA File..., 26
Samples→Rename..., 26
Samples→Set Color..., 26
Samples→Show All, 26
Samples→Show Selected, 26
Samples→Ungroup All, 26
Save As..., 14
Save credentials, 45
Save visible image, 45
Save whole image, 45
Scale Nodes By Assigned, 19
Scale Nodes By Summarized, 19
SEED, 12, 37
SEED Tab, 33
Select, 17
Select All, 35, 40
Select All Same, 26
Select None, 35, 40
Select Top..., 35
Select→All, 29
Select→All Intermediate Nodes, 17
Select→All Internal Nodes, 17
Select→All Leaves, 17
Select→All Nodes, 17
Select→From Previous Window, 17, 29
Select→Invert, 17, 29
Select→Leaves Below, 17
Select→Nodes Above, 17
Select→None, 17, 29
Select→Subtree, 17
Select→Taxonomic Rank, 17
Server Browser, 45
Server Browser:Add server, 45
Set Amino Acid Colors..., 41
Set Classes Label..., 35
Set Color..., 25, 26, 35
Set Counts Label..., 35
Set Highlight Color..., 20
Set Max Node Height..., 19
Set Max Radius..., 36
Set Minimum Number of Reads..., 40
Set Node Radius..., 29
Set Number Of Reads..., 6, 18
Set Series Label..., 35
Set Title..., 35
Set Value..., 25
Set Window Size..., 22
Shannon-Weaver Index..., 18
Shape, 31
Show Alignment..., 22, 24, 39
Show All, 26, 35
Show Amino Acids, 41
Show BiPlot, 31
Show Consensus, 41
Show Groups, 28
Show IDs, 21
Show Insertions, 41
Show Intermediate Labels, 21
Show Internal Labels, 36
Show KEGG Pathway..., 38
Show Labels, 29
Show Legend, 19, 25, 29, 36
Show Names, 21
Show Nucleotides, 41
Show Number of Reads Assigned, 21
Show Number of Reads Summarized, 21
Show Reads, 33
Show Reads..., 34
Show Reference, 41
Show Selected, 26, 35
69
Show Taxon, 33
Show Taxon..., 34
Show TriPlot, 31
Show Unaligned, 41
Show Values, 36
Show x-Axis, 36
Show y-Axis, 36
Silva, 10
silva2ncbi.map, 10
Simpson-Reciprocal Index..., 18
Sort Reads Alphabetically, 34
Species, 18, 21, 24
Sqrt Scale, 19, 24, 35
Square, 27, 28
subsystems, 12
Subtree, 17
Super Kingdom, 17, 21, 23
SVG, 50
Sync, 30, 31
sync, 37
synonyms file, 50
taxon assignment to matches, 9
Taxon Chart Window, 37
Taxon Disabling, 12, 18
Taxon Disabling→Disable..., 18
Taxon Disabling→Enable All, 18
Taxon Disabling→Enable..., 18
Taxon Disabling→List Disabled..., 18
taxon node, 33
Taxonomic Paths..., 15
Taxonomic Rank, 17
Taxonomic Rank→Class, 17
Taxonomic Rank→Family, 18
Taxonomic Rank→Genus, 18
Taxonomic Rank→Order, 17
Taxonomic Rank→Phylum, 17
Taxonomic Rank→Species, 18
Taxonomic Rank→Super Kingdom, 17
Taxonomy Tab, 32
three dimensional PCoA, 28
threshold, 37
Time Series Viewer..., 22, 25
Title Font..., 37
tools directory, 59
Top Percentage, 43
Translate..., 41
Transpose, 36
Tree, 20
Tree→Collapse, 20
Tree→Collapse All Others, 20
Tree→Collapse at Level..., 20
Tree→Collapse At Taxonomic Rank, 20
Tree→Hide Low Support Nodes..., 21
Tree→Node Labels Off, 21
Tree→Node Labels On, 21
Tree→Show IDs, 21
Tree→Show Intermediate Labels, 21
Tree→Show Names, 21
Tree→Show Number of Reads Assigned, 21
Tree→Show Number of Reads Summarized, 21
Tree→Uncollapse, 6, 21
Tree→Uncollapse All, 21
Tree→Uncollapse Subtree, 6, 21
Tree..., 15
Triangle, 27, 28
TriPlot Size..., 31
two dimensional PCoA, 28
Type-setting conventions, 3
Uncollapse, 6, 21, 23, 42
Uncollapse All, 21
Uncollapse Subtree, 6, 21, 23
Uncorrected, 20
Ungroup All, 26, 28, 31
Unix, 7
Unsorted, 42
update, 53, 54
UPGMA Tree, 30
Use 16S Percent Identity Filter, 44
Use Absolute Counts, 44
Use Alternative Taxonomy..., 16
Use Bray-Curtis, 30
Use Chi-Square, 30
Use Colors, 29
Use Default NCBI Taxonomy, 16
Use Euclidean, 30
Use GI Lookup, 50
Use Goodall, 30
Use Hellinger, 30
Use Jitter, 36
Use JSD, 30
70
Use
Use
Use
Use
Use
Use
Use
Use
Kulczynski, 30
Magnifier, 20
Normalized Counts, 44
Normalized Goodall, 30
Pearson, 30
Square Root Normalization, 44
Sub-Sampled Counts, 44
Synonyms, 50
Values Font..., 37
vertical zoom, 25
View→BiPlot Size..., 31
View→Matrix, 30
View→Network, 30
View→NJ Tree, 30
View→PCoA, 30
View→Show BiPlot, 31
View→Show TriPlot, 31
View→TriPlot Size..., 31
View→UPGMA Tree, 30
virtual frame buffer, 53
Voronoi tree map, 37
Voronoi Tree Map..., 22, 24
Window→Reset Window Location, 22
Window→Sample Viewer..., 22
Window→Set Window Size..., 22
Window→Show Alignment..., 22, 39
Window→Time Series Viewer..., 22
Window→Voronoi Tree Map..., 22
Window→Website..., 22
Window→Word Cloud..., 22
Windows, 7
word cloud, 37
Word Cloud..., 22, 24
X-Axis Font..., 37
xvfb-run, 53
Y-Axis Font..., 37
zip format, 8
zipped BLAST files, 47
Zoom To Fit, 36, 42
Zoom to Fit, 29
Zoom To Selection, 19, 42
Website..., 22
Whole words only, 42
Window, 21
Window→About..., 21, 25, 45
Window→Chart Microbial Attributes..., 22
Window→Chart..., 22, 37
Window→Check For Updates..., 21
Window→Cluster Analysis..., 22
Window→Command Input..., 8, 42, 44
Window→Command Syntax..., 54
Window→Comparison Plot..., 22
Window→Groups Viewer..., 22
Window→How to Cite..., 22
Window→Inspector Window..., 22, 33
Window→Main Viewer..., 22
Window→Message Window..., 22, 43
Window→Open COG Viewer..., 22
Window→Open KEGG Viewer..., 22
Window→Open PFAM Viewer..., 22
Window→Open SEED Viewer..., 22
Window→Radial Tree..., 22
Window→Rarefaction Analysis..., 22
71