1
NEC Express5800 Series
NEC ESMPRO Manager
User's Guide
12-2006
ONL-4156aN-COMMON-127-99-0612
PROPRIETARY NOTICE AND LIABILITY DISCLAIMER
The information disclosed in this document, including all designs and related materials, is the
valuable property of NEC, Inc. (NEC) and/or its licensers. NEC and/or its licensers, as appropriate,
reserve all patent, copyright and other proprietary rights to this document, including all design,
manufacturing, reproduction, use, and sales rights thereto, except to the extent said rights are
expressly granted to others.
The NEC product(s) discussed in this document are warranted in accordance with the terms of the
Warranty Statement accompanying each product. However, actual performance of each such
product is dependent upon factors such as system configuration, customer data, and operator control.
Since implementation by customers of each product may vary, the suitability of specific product
configurations and applications must be determined by the customer and is not warranted by NEC.
To allow for design and specification improvements, the information in this document is subject to
change at any time, without notice. Reproduction of this document or portions thereof without prior
written approval of NEC is prohibited.
Windows is a registered trademark of Microsoft Corporation in the United States and other countries.
Mylex is a registered trademark of LSI Logic Corporations of the U.S.
"OpenView" and "HP OpenView" are registered trademarks of HEWLETT PACKARD.
All other product, brand, or trade names used in this publication are the trademarks or registered trademarks of
their respective trademark owners.
Contents
Chapter 1 ...............................................................................................................................1
Introducing NEC ESMPRO...................................................................................................1
Functions and Features .................................................................................................................... 1
Configuration................................................................................................................................... 2
System Requirements ...................................................................................................................... 3
Chapter 2 ...............................................................................................................................4
Installing the NEC ESMPRO Manager ................................................................................4
Before Installing .............................................................................................................................. 4
About a Virtual Directory the Web Component Creates ............................................................. 4
Setting Up Network Services ...................................................................................................... 4
Setting Up the NEC ESMPRO User Group ................................................................................ 4
Installing IIS................................................................................................................................ 5
Installing HP OpenView Network Node Manager ...................................................................... 5
Installation ....................................................................................................................................... 6
Installing the Manager Software ................................................................................................. 6
Adding/Removing the Optional Features.................................................................................. 11
Chapter 3 .............................................................................................................................12
Using the NEC ESMPRO Manager ....................................................................................12
Starting the NEC ESMPRO Manager............................................................................................ 12
Tool Bar and Menus .................................................................................................................. 13
Detecting Agents Automatically................................................................................................ 14
Changing Icon Properties .......................................................................................................... 15
Adding an Icon Manually.......................................................................................................... 15
Changing an Icon ...................................................................................................................... 16
Creating an Icon Type ............................................................................................................... 17
Changing the Popup Menu ........................................................................................................ 18
Setting Up Inter-Manager Communication ............................................................................... 19
Monitoring Agents..................................................................................................................... 24
Browsing MIF................................................................................................................................ 25
Screen........................................................................................................................................ 25
Browsing MIB ............................................................................................................................... 27
Browsing MIB ............................................................................................................................... 27
Chapter 4 .............................................................................................................................28
AlertViewer ..........................................................................................................................28
Accessing the ALERTVIEWER .................................................................................................... 28
Message Notification ..................................................................................................................... 30
Getting More Details................................................................................................................. 31
Finding and Sorting Alert Messages.......................................................................................... 32
Sorting Alert Messages.............................................................................................................. 32
Filtering Alert Messages............................................................................................................ 33
ii Contents
Configuring the AlertViewer .....................................................................................................33
Setting Notification Options......................................................................................................34
Receiving SNMP Traps .............................................................................................................37
Forwarding Alert Messages .......................................................................................................38
Automatically Save Alert Log Settings .....................................................................................38
Chapter 5 ............................................................................................................................ 39
DataViewer.......................................................................................................................... 39
Setting Threshold Limits................................................................................................................41
Setting Threshold Limits................................................................................................................41
How Threshold Limits and Reset Values Work..............................................................................42
Fatal and Warning Limits ..........................................................................................................42
Local Polling..................................................................................................................................43
Mylex GAM Launcher View .........................................................................................................45
Creating Graphs .............................................................................................................................46
Automatic Data Collection ............................................................................................................47
Setting Up Automatic Data Collection ......................................................................................47
Saving Data with the ODBC Interface ......................................................................................48
Printing Statistical Data .................................................................................................................50
Chapter 6 ............................................................................................................................ 51
Web Component ................................................................................................................ 51
About the Web Component............................................................................................................51
Getting Started ...............................................................................................................................52
Setting User Authority ...............................................................................................................52
Checking the Operation of the Web Component .......................................................................53
Before You Manage Server(s) via Web Browser .......................................................................54
Re-creating the Virtual Directory for the Web Component .......................................................54
Operation Window .........................................................................................................................55
Starting the Operation Window .................................................................................................55
Registering a Server to be Managed..........................................................................................57
Monitoring the Server Status .....................................................................................................64
AlertViewer....................................................................................................................................65
Starting the AlertViewer ............................................................................................................65
Viewing Detailed Alert Information ..........................................................................................66
DataViewer ....................................................................................................................................67
Displaying Server Configuration Information...........................................................................67
Customizing the Monitoring Item Set .......................................................................................69
Agent Control Panel.......................................................................................................................70
Starting the Agent Control Panel ...............................................................................................70
Changing the Operational Settings ............................................................................................71
Remote Wake Up ...........................................................................................................................84
Remote Shutdown..........................................................................................................................85
Remotely Shutting Down a Managed Server ............................................................................85
Setting the Agent Settings..........................................................................................................86
Chapter 7 ............................................................................................................................ 87
HP OpenView Integration .................................................................................................. 87
Contents iii
ABOUT THE HP OPENVIEW INTEGRATION.......................................................................... 87
GETTING STARTED.................................................................................................................... 87
Setting a Method for Receiving SNMP Traps ........................................................................... 87
Before Executing Auto-discovery of the NEC ESMPRO Agent............................................... 87
USING HP OPENVIEW INTEGRATION.................................................................................... 88
Auto-discovering NEC ESMPRO Agent................................................................................... 88
Monitoring the NEC ESMPRO Agent Status............................................................................ 88
Deleting NEC ESMPRO Agent................................................................................................. 88
Launching the DataViewer........................................................................................................ 88
Launching the Operation Window............................................................................................. 88
Launching the AlertViewer ....................................................................................................... 89
Displaying NEC ESMPRO Agent Traps ................................................................................... 89
Appendix A..........................................................................................................................90
Inter-Manager Communication .........................................................................................90
Appendix B..........................................................................................................................92
Notes....................................................................................................................................92
Manager......................................................................................................................................... 92
Web Component .......................................................................................................................... 103
About This Guide
NEC ESMPRO monitors the configuration, failures, and performance of systems across a network.
This user's guide is intended for the system administrator and describes NEC ESMPRO capabilities,
installation, features, and use.
This manual is composed of the following chapters.
Chapter 1, Introducing NEC ESMPRO, describes NEC ESMPRO features, configuration
and system requirements.
Chapter 2, Installing the NEC ESMPRO Manager, provides instructions for getting the
appropriate network protocols running, creating a user group called the NEC ESMPRO
User Group, and installing the Manager software on the system to be used for monitoring
Agents across the network.
Chapter 3, Using the NEC ESMPRO Manager, explains how to start the NEC ESMPRO
Manager, set up network maps, use toolbars and buttons, and get the most out of the NEC
ESMPRO Manager.
Chapter 4, AlertViewer, describes how to access and read the Alert Log, sort the Alert list,
and interpret Alert data.
Chapter 5, DataViewer, provides details about checking hardware and software features
on Agents being monitored, printing reports and statistical data, setting thresholds, and
creating graphs.
Chapter 6, Web Component, describes how to use the Web Component.
Chapter 7, HP OpenView Integration, explains how to use HP OpenView Integration.
Appendix A, Inter-Manager Communication, describes the communication capabilities
between network type and community levels.
Appendix B, Notes, provides information and restrictions regarding NEC ESMPRO
Manager.
Chapter 1
Introducing NEC ESMPRO
NEC ESMPRO lets a system administrator manage remote servers across a network. NEC
ESMPRO monitors server hardware and software configurations, failures, and performance. With
log data collected by NEC ESMPRO, a system administrator can track long-term and short-term
performance, monitor server usage, create graphs to record trends, and check server failure rates.
The administrator can use the information collected to create more efficient data routing procedures
and optimize server usage.
FUNCTIONS AND FEATURES
NEC ESMPRO offers many functions and features for managing remote servers across a network.
These features help the system administrator perform daily system operation, system extension, and
transfer tasks. Some features of NEC ESMPRO include:
Hardware and software server configuration
– Hardware resources mounted in servers, such as the CPU, memory, disks, disk array,
and LAN boards.
– Software resources, such as operating system information and drivers running on each
server.
Server failures
– On-screen real-time displays provide the system administrator with the failure type,
location, cause, and suggested corrective action.
– Failure data includes hardware failure information such as system board temperature,
memory failure, crashes, and software failure information.
Performance
– NEC ESMPRO monitors server performance and displays information such as the rate
of CPU load, memory usage, disk usage, and LAN traffic. Usage threshold values can
help the system administrator monitor and prevent server overloads.
2 Introducing NEC ESMPRO
CONFIGURATION
NEC ESMPRO consists of a Manager program that runs on a management computer and an Agent
program that runs on servers to be managed.
The Manager collects hardware, software, and firmware information from Agents
connected to the network. The Manager displays Agent information, failures, and error
logs on the screen.
The Agent monitors server hardware, software and firmware and transmits the information
over the network to the Manager using SNMP. The Agent lets you view system settings
and reset some NEC ESMPRO thresholds locally. See the NEC ESMPRO Agent User's
Guide.
Each managed server must have the Agent installed and running. Using SNMP, the Agent sends data
across the network to the Manager, which collects the server information.
In addition, when you install both IIS and the Web Component on the management computer, you
can manage servers through the web browser.
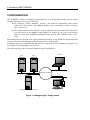
The following figure shows a sample Manager/Agent Configuration.
Agent
Browser
Agent
Intranet / Internet
Manager + IIS + Web Component
Browser
Figure 1-1 Manager/Agent Configuration
Introducing NEC ESMPRO 3
SYSTEM REQUIREMENTS
NEC ESMPRO Manager requires the following hardware and software:
Hardware
– Memory: 20MB of free memory for 32-bit and x64 systems or 230MB for 64-bit
Itanium-based systems.
– Hard Disk space: 130MB (150MB with Web Component)
100MB (120MB with Web Component) is required for installing the program.
In addition to the above, disk capacity of 30MB is required at installation as the area for
creating work files in a temporary directory the operating system manages.
– Additional storage space
When operating ESMPRO, the files below are created.
Please confirm there is the capacity in addition to the 100MB (120MB with Web
Component) required for installing the program.
1) Automatic Data Collection
Approx. 40KB per information collection.
2) Alert information
Approx. 500 bytes per alert.
3) Others
Approx. 10MB as the management area of server registered in the Operation
Window.
– Network Interface Card
– Display: a high-resolution monitor (Some dialog boxes do not fit on a display set to
640 x 480 pixels.)
Software
– Operating System:
Windows 2000 Server/Professional
Windows XP Professional/Home Edition
Windows XP Professional x64 Edition
Windows XP 64-bit Edition (Service Pack 1)
Windows Server 2003, Standard Edition/Enterprise Edition
Windows Server 2003, Standard x64 Edition/Enterprise x64 Edition
Windows Server 2003, Enterprise Edition for Itanium-based Systems
Windows Server 2003 R2, Standard Edition/Enterprise Edition
Windows Server 2003 R2, Standard x64 Edition/Enterprise x64 Edition
– Communications Protocol: TCP/IP (comes standard with the OS)
– Web Server (required for the Web Component): IIS 5.0 - 6.0
* Web Component doesn't run on Windows XP Home Edition.
– Web Browser (required for the Web Component): IE 6.0 (JavaScript must be enabled.)
Chapter 2
Installing the NEC ESMPRO Manager
BEFORE INSTALLING
About a Virtual Directory the Web Component Creates
A virtual directory "esmpro" is created at the first web site (it is usually "Default Web Site") on the
Web Server by installing the Web Component. If a virtual directory "esmpro" already exists, the
directory will be overwritten. Therefore, please change the directory name before installing the Web
Component.
Setting Up Network Services
The NEC ESMPRO Manager uses TCP/IP as its communication protocol. Please set up network
services so that TCP/IP works properly.
Setting Up the NEC ESMPRO User Group
To use the NEC ESMPRO Manager, you must belong to a user group called the NEC ESMPRO
User Group for security purposes.
NOTE: If you are using Windows XP Home Edition, which doesn't
support creating optional user groups, Computer Administrator meets
the requirement.
The NEC ESMPRO User Group name should be determined during the installation. The Manager
setup names it "Administrators" by default.
If you want to specify another user group name, you must create it before installing the NEC
ESMPRO Manager and specify the group name during installation. The NEC ESMPRO User Group
is case sensitive.
Also, to make this security feature function effectively, please install the NEC ESMPRO Manager
on a hard drive formatted with NTFS.
NOTE: When you create the NEC ESMPRO User Group as a global
group, make sure that there is no local group having the same name.
Also, when you install the NEC ESMPRO Manager on a backup
domain Controller, you must create it as a global group.
Installing the NEC ESMPRO Manager 5
Installing IIS
If you use the Web Component, install IIS before installing the NEC ESMPRO Manager.
Installing HP OpenView Network Node Manager
If you use HP OpenView Integration, install HP OpenView Network Node Manager before
installing the NEC ESMPRO Manager.
6 Installing the NEC ESMPRO Manager
INSTALLATION
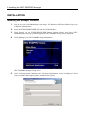
Installing the Manager Software
1.
Log on as a user with administrative privileges. For Windows XP Home Edition, log on as
Computer Administrator.
2.
Insert the EXPRESSBUILDER CD into the CD-ROM drive.
3.
Click [Setup] on the EXPRESSBUILDER Master Control Menu, and select [NEC
ESMPRO] from the pop-up menu appeared. NEC ESMPRO Setup will be displayed.
4.
Click [Manager] on NEC ESMPRO Setup Main Menu.
NEC ESMPRO Manager Setup starts.
5.
After verifying system conditions, the "Customer Information" screen is displayed. Enter
your user name and company name, and then click [Next].
Installing the NEC ESMPRO Manager 7
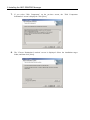
6.
Depending on the environment, a dialog box for selecting features to install might appear
when you install NEC ESMPRO Manager. Select the features you want to install and click
[Next].
[Features]
Manager:
Basic component of NEC ESMPRO Manager. It is required to install.
Web Component:
Enables you to access NEC ESMPRO Manager from Web Brower.
Internet Information Services is required to install this feature.
HP OpenView Integration:
Integrates NEC ESMPRO Manager with HP OpenView. This feature is
available when HP OpenView Network Node Manager is installed on
the same computer.
NOTE: The optional features can be added at any time after this
installation.
8 Installing the NEC ESMPRO Manager
7.
If you select "Web Component" on the previous screen, the "Web Component
Information" screen is displayed. Click [Next].
8.
The "Choose Destination Location" screen is displayed. Select the installation target
folder, and then click [Next].
Installing the NEC ESMPRO Manager 9
9.
10.
The "Start Copying Files" screen is displayed. Click [Next].
The "Enter Text" screen is displayed. Specify the NEC ESMPRO User Group, and then
click [Next].
Wait a few minutes. As the software is installed, several windows open and then close
automatically.
NOTE: When you install the NEC ESMPRO Manager on Windows
XP Home Edition, accept the default user group "Administrators" as the
NEC ESMPRO User Group and proceed with installing.
10 Installing the NEC ESMPRO Manager
11.
The "Installation Completed" screen appears. Click [OK].
The installation of the NEC ESMPRO Manager is complete. You may close the NEC
ESMPRO Manager menu window manually.
Restart the computer before using the NEC ESMPRO Manager.
IMPORTANT: Depending on the environment, a setup window may
remain on the screen after you click [OK]. In such a case, follow the
instructions below.
1. Click [Close] on the title bar of the setup window.
2. An End Program dialog appears. Click [End Now].
3. A confirmation dialog for sending an error report is displayed.
Click [Don't Send].
4. A dialog which says "1628: Failed to complete installation."
appears. Click [OK].
Installation of the NEC ESMPRO Manager has been successfully
completed. There will be no problem in later operations.
NOTE: Except for Windows XP Home Edition
When installing the NEC ESMPRO Manager in an already existing
directory, the NEC ESMPRO Manager will not operate unless the
access permissions required for the Server Management Manager
operation have been set.
When installing the NEC ESMPRO Manager in a directory created by
the installation software, the following access rights are set:
Administrators
Everyone
SYSTEM
Full Control (All)(All)
Read (RX)(RX)
Full Control (All)(All)
If you specified a user group other than the default (Administrators) as
the NEC ESMPRO User Group at the installation, Full Control access
rights will be set for it.
Installing the NEC ESMPRO Manager 11
Adding/Removing the Optional Features
To add/remove the optional features, set up the NEC ESMPRO Manager again by following the
"Installing the Manager Software" process.
Select the check box of the feature you want to add, deselect the check box of the feature you want
to delete, and then click [Next].
IMPORTANT: You cannot go to the next step with all check boxes
cleared.
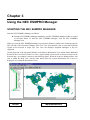
Chapter 3
Using the NEC ESMPRO Manager
STARTING THE NEC ESMPRO MANAGER
Start the NEC ESMPRO Manager as follows:
During NEC ESMPRO Manager installation, an NEC ESMPRO Manager folder is created
in the Start Menu. To start the NEC ESMPRO Manager, click the NEC ESMPRO
Manager icon.
When you start the NEC ESMPRO Manager, an Operation Window similar to the following appears.
The left side of the Operation Window is the Tree View that contains a list of icons that represent
Agents in the network or maps. The Tree View also displays Neighbor Managers if any are
registered.
On the right side of the Operation Window is the Map or Information View, which shows additional
details for the icon selected in the Tree View. Agents within your network are shown as icons on the
network map. An example is shown in the following figure. When the icons are displayed here, this
side is called the Map View. On the other hand, when the system information for a server is
displayed, it is called the Information View.
Tree View
Map or Information View
Using the NEC ESMPRO Manager 13
When the Operation Window first appears, servers on the same network can be detected and
recorded on the Map View. (See Detecting Agents Automatically, page 14)
The NEC ESMPRO Manager automatically monitors Agents at specific intervals. The background
color of the icon indicates the Agent status. Normally, the icon background is green. If the status is
red or yellow, use the DataViewer and AlertViewer to identify the problem.
Tool Bar and Menus
The tool and menu bars at the top of the Operation Window give you access to many NEC
ESMPRO functions. The tool bar gives you quick access to many frequently used menu items.
Simply click the button to access the function. These buttons include the following:
Upper Map
Cut (shortcut to Edit Menu/Cut)
Copy (shortcut to Edit Menu/Copy)
Paste (shortcut to Edit Menu/Paste)
Paste with a New Name (shortcut to Edit Menu/Paste with New Name)
Delete (shortcut to Edit Menu/Delete)
Properties (shortcut to File Menu/Properties)
Shrink to Fit (shortcut to View Menu/Shrink to Fit)
Alias (shortcut to View Menu/Alias)
DataViewer (shortcut to Tools Menu/DataViewer)
AlertViewer (shortcut to Tools Menu/AlertViewer)
SMS (short cut to Tools Menu/SMS)
MIB Browser
MIF Browser
Help
To obtain more details about a menu item, tool bar icon, or field, click the Help icon from the tool
bar and click the screen.
14 Using the NEC ESMPRO Manager
Detecting Agents Automatically
NEC ESMPRO Manager can detect Agents automatically and register an icon on the Map View
when it finds them. If you prefer, you can add Agents manually. (See Adding an Icon Manually,
page 15.)
Initiate automatic Agent detection as follows.
1.
Ensure that the SNMP service is running on the Agents.
2.
Open the map where you want Agents registered automatically.
3.
From the Tools Menu, select Autodiscover/Foreground.
4.
Select TCP/IP Hosts.
5.
Proceed as follows.
Enter the network address and network mask for the network you want to find. Also, enter
the value set for the Agent to be detected in the SNMP Community field. The default is
public.
If you are entering more than one SNMP community name, separate the names with
commas, as in public, xxx.
If Class A (255.0.0.0) or Class B (255.255.0.0) is specified, the number of addresses
becomes enormous and the automatic detection takes a very long time. If the network in
use is Class B, we recommend that you modify the network address and network mask
appropriately and carry out a partial detection.
If you want to access the details of auto discovery, click [Details] and check the following
items.
– Update properties
To update server properties that have already been set, check this item.
– Discover DMI Agent
To detect DMI agent, check this item.
– Restrict the objects
To specify NEC ESMPRO Agent, check this item.
Please refer to on-line help for more details.
6.
Click [Start].
7.
When automatic detection is finished, click [Close]. Any Agents detected appear on the
map as icons.
It is also possible to detect Agents periodically in the background by specifying the SNMP
community name and the interval in Autodiscover/Background on the Tools Menu.
Using the NEC ESMPRO Manager 15
Changing Icon Properties
After icons are added during Autodiscover, you may want to view and edit their properties.
1.
Right-click the icon.
2.
Select Properties from the popup menu.
3.
Make changes in the Properties window. Use the on-line help for details on field entries.
To delete an icon, select it and select Delete from the Edit Menu. If your attempt is denied, make
sure that Enable Edit is selected in the Options Menu.
You can move an icon by dragging it.
Adding an Icon Manually
Follow this procedure to add an icon manually.
1.
From the View Menu, select the Icon Palette. If it is already running, press [Alt][Tab] to
access it.
2.
Click on the icon in the palette that best represents the Agent. If none of the icons is
suitable, you can modify the standard ones or create your own. (See Changing an Icon on
page 16, or Creating an Icon Type on page 17, for details.)
3.
Move your cursor to the Map View side of the screen and click to deposit the icon where
you want it.
4.
When the Properties window appears, enter the appropriate information for the Agent or
map being created. Use the on-line help for a description of the fields.
5.
When you finish, click [OK]. The icon is automatically added to the Tree View.
16 Using the NEC ESMPRO Manager
Changing an Icon
Follow this procedure to change an icon's image.
You can only change a map icon to another map icon or change a server icon to another server icon.
You can determine which is a map icon and which is a server icon in the Icon Type window. (Select
Customize and Icon Type from the Options Menu.) In the following figure, city, factory, building
and floor are map icons. Fulltower and minitower are server icons. A floor icon can change to a
building icon but cannot be changed to a full tower icon.
1.
Highlight the icon that you want to change in the Map View.
2.
Ensure that Icon Palette is selected in the View Menu.
3.
Select Change Icon Type from the Edit Menu.
4.
Ensure that the Icon Palette is visible. You may have to press [Alt][Tab] to display it again.
5.
Click on an icon in the Icon Palette. The old icon changes to the new one selected.
Using the NEC ESMPRO Manager 17
Creating an Icon Type
You can create your own icon types and add them to the Icon Palette.
1.
From the Options Menu, select [Customize] - [Icon Type].
2.
Highlight an icon.
Icons are listed hierarchically and by type. The new icon type will be placed under the one
you highlight here.
There are several factors to consider when deciding where to add icons:
– The Properties window for the new icon will be based on the parent icon.
– The icon's image can be changed later once they have been added to the map, but they
can only be changed to another icon in the same group (that is, map or server).
3.
Click [Add].
4.
Enter a name for the new icon.
5.
Click [Edit], select the Bitmap tab, and click [Add].
6.
Enter the drive, path and filename to specify the bitmap.
7.
Click [Open] and the new bitmap file appears in the window with the existing bitmaps.
The icon appears in the Icon Palette when the Operation Window is restarted.
18 Using the NEC ESMPRO Manager
Changing the Popup Menu
These procedures will show you how to edit the popup menu for an icon type. Once these changes
are made to the icon type, new icons created with the icon type have the new popup menu. Popup
menus for icons created previously remain unchanged.
1.
From the Options Menu, select [Customize] - [Icon Type].
2.
Highlight the icon type you want to change.
3.
Click [Edit]. The Icon Type Properties window displays. The Menu Item list on the
Command tab displays the items that appear in the popup menu.
¾ To add an item to the popup menu:
1.
Click [Add].
2.
Enter the new text to appear in the popup menu in the Text field.
3.
Enter the command that starts the program in the Command field.
4.
Enter any arguments needed to run the program in the Argument field. (This field is
optional.)
5.
If you want to activate the item with double-clicking an icon, check Action for Double
Click.
6.
You can change the order that the items will appear by using the up and down arrow keys.
¾ To delete an item from the popup menu:
– Items that you have added can be deleted with the [Remove] button.
– Standard items like Open and Properties can be eliminated by checking the Invisible check
box.
Using the NEC ESMPRO Manager 19
Setting Up Inter-Manager Communication
These settings define the exchange of information between Managers on maps and agents registered
in the remote manager.
To establish the inter-Manager communication, you must specify the following.
My Manager
Neighbor Managers
Routing
Access rights
Notification options
My Manager
Inter-Manager communication requires that each Manager have a unique name. Define My Manager
as follows.
1.
From the Options Menu, select Customize and then My Manager.
20 Using the NEC ESMPRO Manager
2.
Set parameters for each field. Details are available in the on-line help.
NOTE: Regarding the method of receiving an SNMP Trap, when
software other than Server Management Manager receives an SNMP
Trap, Server Management Manager may not be able to receive an
SNMP Trap correctly due to a clash on the SNMP Trap board.
In this case, select "Use SNMP Trap Service".
Note that when you select "Use SNMP Trap Service", the function that
restricts receiving SNMP Traps by SNMP community names cannot be
used. (The function can be configured from [Options] - [Customize] [Environment] in the Operation Window.)
When you have selected "Use own method", be sure to not start up
"SNMP Trap Service".
Using the NEC ESMPRO Manager 21
Neighbor Manager
The Neighbor Manager communicates directly with My Manager. The setting for the Neighbor
Manager allows managers not registered as Neighbor Managers to communicate via the Neighbor
Manager. Define the Neighbor Manager as follows.
1.
From the Options Menu, select Customize/Remote Manager.
2.
Select the Neighbor Manager tab.
3.
Click [Add] or [Properties].
4.
Enter the appropriate information in each field. Field details are available from the on-line
help.
5.
Click [OK].
22 Using the NEC ESMPRO Manager
Routing
Inter-Manager communication to managers not directly connected (not neighboring) requires
routing tables. Set up routing paths as follows.
1.
From the Options Menu, select Customize/Remote Manager.
2.
Select the Routing Manager tab and click [Add] or [Properties].
3.
Set the parameters for each field. Help is available from on-line help.
4.
Click [OK].
Access Rights
Defines read-only access or read/write access for inter-Manager communication from a specific
Manager.
1.
From the Options Menu, select Customize/Remote Manager.
2.
Select the Access Permission tab and click [Add] or [Properties].
3.
Enter the appropriate information in each field. Details about field entries are available in
the on-line help.
4.
Click [OK].
Using the NEC ESMPRO Manager 23
Notification Options
Define notification options as follows.
1.
From the Options Menu, select Customize/Remote Manager.
2.
Select the Notification Event tab and click [Add] or [Properties].
3.
Fill in the appropriate information for each field. Details on field entries are available in
the on-line help.
4.
Click [OK].
24 Using the NEC ESMPRO Manager
Monitoring Agents
After creating the network map, registering Agent icons, and establishing communications, the NEC
ESMPRO Manager automatically monitors the Agent status at specific intervals.
When the Manager detects a faulty Agent, the icon color changes according to the type of fault.
Default colors are:
Table 3-1 Agent Status
Color
Green
Yellow
Red
Gray
State
Normal
Warning
Error
Unknown
Description
All Agent components are operating normally.
A minor error occurred in an Agent component.
A major error occurred in an Agent component.
The Agent cannot be monitored or identified because the Agent is not
started, the Agent software is not set up, or the server is down.
If the Agent status is red or yellow, use the DataViewer and AlertViewer to determine the problem.
You can change the fault indicators by selecting Fault Indicators from the Customize selections
under the Options Menu. A screen similar to the following appears.
When a fault occurs in the agent managed by the remote manager, the background color of the rmap
icon changes into the color indicating the condition, but it will turn back to the color showing
normal condition after a period of time (30 seconds is the default).
Using the NEC ESMPRO Manager 25
BROWSING MIF
Screen
MIF Browser consists of the following views.
Menu
Tool Bar
Title View
Tree View
Detail View
List View
1.
Menu
Displays the following menu on MIF Browser.
File
View
Help
– File menu
Displays the following menu on the File Menu.
File
Add Server... Ctrl+A
Delete Server
Exit
Add Server
Delete Server
Exit
: Add the server to be monitored.
: Delete the server to be monitored.
: Close the MIF Browser
26 Using the NEC ESMPRO Manager
– View menu
Displays the following menu on the View Menu.
View
Tool Bar
Status Bar
Refresh
Status Bar : When Status Bar is checked in the View menu, the Status Bar displays at
the bottom of the screen.
Tool Bar : When Tool Bar is checked in the View Menu, the Tool Bar displays at the
bottom of the screen
Refresh
: Refresh the selected server information.
– Help menu
Displays the following menu on the Help Menu.
Help
Help Topics
About MIF Browser...
Help Topics
: Accesses on-line help.
About MIF Browser : Provides revision information for the MIF Browser.
2.
Tree View
The names of component, Group, Row, and Attribute are available from the Tree View.
3.
Title View
The selected names (Component, Class, Row, Attribute) in the Tree View are available
from the Title View.
4.
Detail View
The details of the selected names in the Tree View are available from the Detail View.
5.
List View
List is available if the selected group in Tree View has multiple rows. Not available
otherwise.
Using the NEC ESMPRO Manager 27
BROWSING MIB
1.
Select MIB Browser from the Tools Menu or click the MIB Browser icon on the Toolbar.
2.
Select the destination Agent from the Manager Name and Component drop-down lists.
3.
Specify the MIBs to be retrieved. You can specify several OIDs at one time. When the
OID is not the last one in the directory, all entries under the OID are also selected.
4.
Set the interval of retrieval. When the interval is 0, the MIB Browser retrieves just once.
5.
Select the output style for the information: Text, Line Chart, Bar Chart or Pie Chart.
6.
Click
to start the collection.
Chapter 4
AlertViewer
The AlertViewer displays failures and warnings issued from servers running NEC ESMPRO Agent
software. The log provides the date and time of the alert, the server name, and a brief description of
the problem. The icon in the Summary column is displayed in alert colors that indicate the severity
of the problem.
ACCESSING THE ALERTVIEWER
To access the AlertViewer from the Operation Window, select AlertViewer from the Tools menu or
the AlertViewer icon in the tool bar. A screen similar to the following appears.
By clicking on any column title, alert messages are sorted by that column. You can also adjust the
column widths by dragging the edge of a column title box to the left or right.
AlertViewer 29
The central part of the AlertViewer is the Alert Log in which alert messages are displayed. New
alert messages are added to the top of the list as they arrive.
Summary — gives a brief description of the alert message.
Icon (Summary column) — displays the icon of the component in trouble. The icon color
indicates the level of the alert. These colors include:
– Green is informational and indicates a slight error or a warning recovery.
– Yellow is a caution and indicates that the server has a problem that should be
investigated.
– Red is a warning and indicates a major problem with the server.
You can also use standard Windows icons without background color by checking "Use
standard icons for alert list" in the Options dialog box.
Check — lets you define and mark the status of an alert. Two marks are available, a cloud
and lightning.
Read/Unread — indicates whether the details of the alert message have been reviewed on
the Alert Detail screen. The Read icon looks like an opened envelope. The Unread icon
looks like a sealed envelope. (See Getting More Details, page 31, for more information.)
Type —identifies the type of alert, such as FT Disk, System Reboot, or System Error.
Manager — identifies the remote manager where the alert originated.
Component — identifies the server that sent the alert.
Address — gives the TCP/IP address of the server that sent the alert. For a NetWare server,
this address is the IPX address.
Received — shows the date and time when the alert was received by the AlertViewer.
Source — identifies the service that sent the alert.
Event ID — the Event ID of the alert. (This column is not displayed in the default
configuration. To display this column, select Columns in the View Menu.)
Severity — the severity of the alert: major, minor, or information. (This column is not
displayed in the default configuration. To display this column, select Columns in the View
Menu.)
30 AlertViewer
MESSAGE NOTIFICATION
When a new alert message arrives, you may hear a beep and see a notification message similar to
the one shown next. (These options are set in the View Menu. See Setting Notification Options,
page 34.) If your system has audio capability, you can also specify different sounds to signify
different alert levels. Otherwise, the system sounds a beep through the internal speaker.
Click [Alert Log] to open the Alert Log Detail screen, or click [Invoke] to start the DataViewer. If
you do not wish to view alert messages or details, click [Close].
AlertViewer 31
Getting More Details
For details on an alert message, double-click on the message line in the AlertViewer. You can also
click [Alert Log] on the notification message. A window similar to the following displays the details
of the alert message, including corrective actions to take.
Once the Details window appears, the message is marked as Read in the Alert Log. (The symbol in
the Read/Unread column changes to an opened envelope.) You can also mark messages as Read or
Unread from the Edit Menu. Simply highlight the message and select Mark as Read or Mark as
Unread.
32 AlertViewer
Finding and Sorting Alert Messages
You can search for alert messages by specifying severity, component, or type. Do so as follows:
1.
From the Tools menu, select Find.
2.
In the dialog box that appears, enter the search criteria you want to use.
3.
Click [Find Next]. The next alert that matches the criteria is highlighted in the Alert Log.
(Double-click on the line to see the Details screen.)
Sorting Alert Messages
The AlertViewer lets you sort alert messages in the Alert Log. This allows you to list a specific class
of messages first, like all warning messages or those related to fan errors.
1.
From the View menu, select Sort.
2.
From the drop down "Sort items by" list, select the sort criteria to use. You can use any of
the AlertViewer columns as your sort criteria.
3.
Select the circle next to Ascending or Descending to specify the order in which the
messages should appear.
4.
Select Sort to sort the alert messages or Close to abort.
Another way to sort messages is to click on a column title in the Alert Log. Clicking once will sort
all messages in ascending order using the selected column as the sorting criteria. Clicking again will
sort in descending order.
AlertViewer 33
Filtering Alert Messages
You can filter alert messages by specifying a set of conditions.
1.
On the filter bar, click [Add].
2.
In the dialog box that appears, select filtering conditions and name the filter.
3.
Click [OK] to save the setting and close the window.
4.
Specify filter settings by selecting the drop-down list on the filter bar.
Please refer to on-line help for more details.
Configuring the AlertViewer
You can configure the appearance of the AlertViewer in a number of ways. You can select the
information you want to appear in the Alert Log. You can also hide the tool and status bars from the
screen if they are not needed.
34 AlertViewer
To view or remove the Tool Bar and Status Bar
You can display the Toolbar and Status Bar on the screen or remove them from the screen
by checking or removing the check from the appropriate line under the View menu.
– A check next to the item indicates that it is displayed on the screen.
– No check next to the line indicates that the toolbar or status bar will not appear.
To add or delete columns from the Alert Log
You can choose the information to include in the AlertViewer Log. From the View menu,
select Columns. A window similar to the following appears:
– Information that appears in the Alert Log is listed in the box "Show the following
columns."
– Information under "Available Columns" can be added to the Alert Log.
To add a new column to your screen, highlight an item from the "Available Columns" box
and click [Add ->]. To remove a column from the Alert Log, highlight an item in "Show
the following columns" and click [<- Remove].
Setting Notification Options
You can configure how you are notified of new alert messages. You can filter notification messages
by severity.
From the Tools menu, select Options. A screen similar to the following appears.
AlertViewer 35
Set up notification options as follows:
If you don't want to receive any notification messages when alert messages arrive at the
AlertViewer, select "Don't display a notification message."
If you choose to display notification messages (like the one on page 30), you can also
select the type. For example, you may not want to be notified when informational
messages arrive. To see a notification message when a new alert is received, select
"Display a notification message" and check a severity level. If no boxes are checked, no
messages are displayed.
To hear a warning tone or .wav file when new messages arrive, check "Play a Sound."
Wave files have already been assigned to error messages types. If you want to review or
change these assignments, select the Alert Types tab.
Check "Always center notification message dialog" if you want notification messages to
be centered on the desktop.
36 AlertViewer
Check "Display received time on title" if you want the time to be shown on the title bar of
the notification message.
"Maximum notification dialogs" allows you to define the maximum number of
notification messages displayed at one time.
Please refer to on-line help for more details.
AlertViewer 37
Receiving SNMP Traps
By default, AlertViewer only receives and shows Enterprise Specific traps originating from
ESMPRO Agent. You can configure AlertViewer to receive all other SNMP traps.
From the Tools menu, select Options and click the "SNMP Trap" tab. A screen similar to the
following appears.
Set up SNMP Trap options as follows:
Check "Cold Start" if you want AlertViewer to receive cold start traps.
Check "Warm Start" if you want AlertViewer to receive warm start traps.
Check "Link Down" if you want AlertViewer to receive link down traps.
Check "Link Up" if you want AlertViewer to receive link up traps.
Check "Authentication Failure" if you want AlertViewer to receive authentication failure
traps.
Check "EGP Neighbor Loss" if you want AlertViewer to receive EGP neighbor loss traps.
Check "Enterprise Specific" if you want AlertViewer to receive enterprise specific traps.
"Registered Enterprise" shows the list of traps for which AlertViewer can show detailed
38 AlertViewer
and meaningful information.
Check "Also receive all Enterprise Specific traps other than above" if you want
AlertViewer to receive all enterprise specific traps.
After setting the options, you must restart the computer for the changes to take effect.
Forwarding Alert Messages
You can forward alert messages to various destinations by using Alert Manager. Select Report
Setting on the Tools menu to invoke Alert Manager. For details regarding Alert Manager, please
refer to the NEC ESMPRO Alert Manager User's Guide.
Automatically Save Alert Log Settings
Automatically Save Alert Log Settings function automatically saves received alert data in files. The
received alerts can be saved as long as there is enough disk space. Newly received alerts after you
set here will be logged. From the Tools menu, select AlertLogAutoSave settings. A screen similar to
the following appears.
NOTE: This function uses some KB of disk capacity whenever
receiving a new alert. Make sure to regularly create back up of or delete
alert log files. You can not specify a network drive as the log file
directory.
Chapter 5
DataViewer
This section describes the DataViewer and its many options. The DataViewer lets you check
hardware and software features on Agents that are monitored by NEC ESMPRO Manager.
Access the DataViewer as follows.
1.
From the Operation Window, click on an Agent icon to select it.
2.
Once the Agent icon is selected, you can open the DataViewer using any of the following
methods.
– Selecting DataViewer from the Tools menu
– Clicking the DataViewer icon in the toolbar
– Selecting DataViewer from the Command menu (popup menu accessed with the right
mouse button)
A screen similar to the following appears.
40 DataViewer
– The Tree View on the left side of the screen lists the folders.
– The Information View on the right side of the screen displays the status or statistical
information about the Agent
– The status bar at the bottom of the window describes the current function and shows
the alert color legend.
3.
Double-click on a folder entry in the tree view. A series of icons are displayed in the
Information View, and devices and device categories are listed under the entry.
4.
Click on a device or an icon. Data screens appear and provide detailed information about
the device selected. The following screen is an example.
NOTE: Sometimes buttons or item names disappear when you start up
a graph or change the screen size, but DataViewer is operating correctly.
If this occurs, you can correct the display by changing the screen size
again.
DataViewer 41
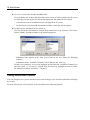
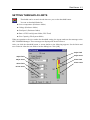
SETTING THRESHOLD LIMITS
Thresholds can be set and viewed wherever you see the threshold button.
You can set threshold limits for:
Server temperature (Enclosure folder)
Voltage (Enclosure folder)
Fan Speed (Enclosure folder)
Rate of CPU load (System folder, CPU Total)
Free Capacity (File System folder)
When an operation or device reaches the threshold setting, the Agent sends an alert message to the
NEC ESMPRO Manager. These messages are displayed in the AlertViewer.
After you click the threshold button, a screen similar to the following appears. Set the limits and
reset values in either the text fields or on the sliding bar. Click [OK].
major limit
major limit
major reset
minor limit
minor reset
major reset
minor limit
minor reset
42 DataViewer
HOW THRESHOLD LIMITS AND RESET VALUES WORK
When a parameter exceeds the threshold limit, an alert message appears in the AlertViewer. The
corresponding icons in the DataViewer and Operation Window turn red or yellow to show the
warning or abnormal alert status. (The default colors red, yellow, and green are assumed here.)
The alert status returns to normal when the parameter falls below the reset value. A recover message
appears in the AlertViewer, and the icons in the DataViewer and Operation Window return to green.
Fatal and Warning Limits
Most parameters have two limits (Fatal and Warning or Major and Minor) and a reset value for each
limit. When the parameter exceeds the Warning limit, a warning alert message (such as CPU Load
Warning) appears in the AlertViewer. The Agent's icon in the Operation Window and the appropriate
folder icon in the DataViewer turn yellow to indicate the warning status.
The warning status continues until it falls below the Warning Reset value, at which time the status
returns to normal. A warning recover message (such as CPU Warning Recover) appears in the
AlertViewer, and the icons in the DataViewer and Operation Window return to green.
The Fatal limit is similar. As the parameter increases and reaches the fatal limit, an error message
displays in the AlertViewer (such as CPU Load Error). Icons in the DataViewer and Operation
Window change to red to indicate the abnormal status.
When the parameter falls below the Fatal reset, the status is reset from Abnormal to Warning and an
Error Recover message displays in the AlertViewer. Icons change to yellow since the parameter still
exceeds the Warning limit. Status is normal when the value falls below the Warning reset value.
DataViewer 43
LOCAL POLLING
Selecting the Local Polling item on the Tree View shows the following screen.
The Local Polling window allows you to monitor data that has an Integer attribute. You can set or
change the monitoring data and threshold levels.
The [Configure…] button configures local polling settings for the selected item.
The [Reset] button resets local polling settings for the selected item.
Select an item and click [Configure…]. A dialog box similar to the one below appears.
44 DataViewer
1.
Specify the OID in Item field. Some OIDs are selectable from the [Browse…] button.
Then check the Enable Polling check box.
NOTE: In Item field, enter the OID including the Index.
When using the [Browse…] button, the location where the Index needs
to be specified is shown by "Transmitted Error Packets. [%index%]" in
the comment column.
When these OIDs are selected, character strings ending with "." such as
"1.3.6.1.2.1.10." are set in the item field. Enter the index value after ".".
2.
Set the duration and the interval. When the duration is 0, polling is continuous.
3.
Set the threshold limits and reset values for the OID. In addition to the text entry boxes,
you can set the threshold using the sliding bars to the right.
4.
Check Enable Sending Trap. This issues a trap corresponding to the current threshold
settings.
5.
Click [OK].
DataViewer 45
MYLEX GAM LAUNCHER VIEW
"MYLEX GAM launcher view" launches a utility of disk array management "GAM client".
NOTES:
"MYLEX GAM launcher view" launches GAM Client with
following installation pass by default. If installation pass is different
from real it of GAM Client, please change it using Setting Button.
C:\Program Files\Mylex\GAM CLIENT\gam2cl.exe.
If "GAM Server" doesn't exist in monitor server, this view isn't
shown.
In case of using NEC ESMPRO Ver.3.8 agent or older version, this
launcher view is to be displayed. With NEC ESMPRO Ver.4.0
agent or later version, this viewer is not to be displayed.
To start GAM client, launch from [Start Menu].
46 DataViewer
CREATING GRAPHS
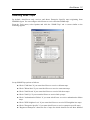
The DataViewer lets you create real-time graphs using the dynamic information collected from the
Agent. The Graph window displays the change of values using the time increments specified.
A graph button appears next to parameters that can be graphed. Clicking the
graph button displays a window similar to the following.
The GraphViewer lets you define the appearance of the graph, including the type of graph (step or
line), grid, line color, weight, and style. Additional information on creating graphs is provided in the
on-line help.
DataViewer 47
AUTOMATIC DATA COLLECTION
The NEC ESMPRO Manager has a function to collect statistical data automatically within a specific
cycle.
Setting Up Automatic Data Collection
Set up data for automatic collection as follows:
1.
On the Operation Window, right-click on the server icon and select "Automatic Data
Collection Setting" from the pop-up menu.
2.
Verify that your Agent is in the Collecting Servers list.
3.
Set the Collection Cycle frequency to every month, week, day, hour, or every 30 minutes.
– When the frequency is every month, you can set the day of the month and the hour.
– When the frequency is every week, you can set the day of the week and the hour.
– When the frequency is every day, you set the hour.
– When the frequency is every hour, you can set minutes.
– When the frequency is every 30 minutes, you can set minutes.
4.
Enter a value of up to 9999 in the "Overwrite Data Older than" field to specify how many
days the data is saved before being overwritten with new data.
5.
Click [OK] to accept the data collection settings.
When you start Automatic Data Collection, the server icon on your network map changes to show a
graph within the icon. This indicates that the Manger is collecting statistical data on the server.
48 DataViewer
Saving Data with the ODBC Interface
When you select ODBC as the data saving mode, a table for the Server Name is created in the
specified database. The following information is recorded:
– DataName — saves the data name collected, for example, ABC Network Board.
– DataKind — stores the data type collected, for example, Total Send Packets.
– GetTime — stores the date and time (TIMESTAMP) of data collection in a DateTime
field.
– GetValue — saves integer data collected.
– DataType — saves the data type that was collected as an integer.
0: Indicates an item that has an unsigned value (e.g. Transmitted Total Packets).
1: Indicates an item that has a value with a percent sign (e.g. CPU load).
2: Indicates an item that has a signed value (e.g. Voltage Level).
NOTE: The server name is used as the table name, therefore, if the
server name includes characters that cannot be used in ODBC, no data
is stored. Check your database specifications for acceptable characters.
DataViewer 49
ODBC data collection must be specified in NEC ESMPRO and matching information must be
entered in your selected database. Initiate ODBC data collection in NEC ESMPRO as follows:
1.
Press the "Database …" button on the Automatic Data Collection Setting window.
2.
Select ODBC and enter an ODBC Data Source Name.
NOTE: Enter what you have set as System Data Source, in ODBC
Data Source Name.
3.
Click OK to save the setting and close the window.
4.
Add servers to the Collecting Servers list as follows:
– Highlight the servers in the All Servers list.
– Click the Add button.
5.
Specify collection cycles by selecting a Frequency, Day, Month, and Time for each server
and press OK.
NOTE: If automatic statistical data collection is not executed, no data
is stored in ODBC.
Set up your data base for ODBC collection as follows:
1.
Install and configure the ODBC drive for your particular database.
2.
Set the environment in ODBC using the same Data Source Name used in the Statistical
Data Saving Mode screen in NEC ESMPRO. (Step 2 in the preceding procedure.)
3.
In your database manager software, create a database template or table with the following
fields.
– DataName
– DataKind
– GetTime
– GetValue
– DataType
4.
Save the database.
5.
Enter the name of this database into your ODBC driver's settings where appropriate.
50 DataViewer
PRINTING STATISTICAL DATA
This section explains how to print the data collected through Automatic Data Collection.
1.
On the Operation Window, right-click on the server icon and select "Print Statistical Data"
from the pop-up menu.
NOTE: Data values and graphs are printed on separate sheets.
2.
From the drop down list, select the form name to print. The NEC ESMPRO Manager
comes with a number of forms already set up for you to use. A number of forms are
available including options to print the forms with or without graphs.
Chapter 6
Web Component
ABOUT THE WEB COMPONENT
The Web Component allows you to use the main functions of the NEC ESMPRO Manager from
your Web browser via Web server.
The Web Component consists of the following tools.
Operation Window
Adds, edits or deletes the managed servers, displays maps in a tree structure, and
launches tools for managing servers.
AlertViewer
Displays alert messages issued by managed servers.
DataViewer
Displays a list of the detailed information on the NEC ESMPRO Agent. (Version
3.7 or later).
Agent Control Panel
Allows you to set operational settings for the NEC ESMPRO Agent. (Version 4.0 or
later for Windows, Version 4.2 or later for Linux).
52 Web Component
GETTING STARTED
When you use the Web Component, please follow the instructions below.
Setting User Authority
To use the Web Component, you must set the appropriate user authority. Follow the instructions
shown below to set the user authority.
The following procedure explains how to set the Web Component using IIS 6.0 on Windows Server
2003 R2. For other environments, see the help for each Web server.
1.
Start the Internet Information Services (IIS) Manager on the Web server and display the
virtual directory "esmpro" properties of the Default Web Site.
2.
Click [Edit] of the Authentication and access control group on the Directory Security tab.
Then set up the authentication methods.
3.
Join the user with the authenticated access to the NEC ESMPRO User Group you
specified during installation.
4.
Restart the Web server computer.
NOTE:
Considering your security, we do not recommend that you allow
anonymous access. It is recommended that you disable anonymous
access and use the authenticated access.
Web Component 53
Checking the Operation of the Web Component
The initial URL for accessing the Web Component is:
http://a web server name/esmpro/index.html
Go to the above URL via your web browser to check that the following title page appears:
If the above title page does not appear, the authentication methods for the virtual directory may not
have been correctly set up. Check the settings.
If starting the Operation Window from the above title page displays the following message:
'Failed to collect information. (No authorization was obtained. (5))'
the user that you accessed might not belong to the NEC ESMPRO User Group. Check that the
setting is correct.
NOTE:
When you access the Web Component from the browser of a Web
machine with the Integrated Windows authentication, the CGI window
(command prompt), which is normally executed in the background,
may be displayed. This is only a display issue. There are no problems in
its operation.
If you access the Web Component from the browser of a remote
machine, the CGI window will not be displayed.
54 Web Component
Before You Manage Server(s) via Web Browser
1.
Adding the server you want to manage
There is no server registered in the NEC ESMPRO Manager right after the installation.
Before you manage the server via your web browser, register the server you want to
manage using the Manager (not web-based).
2.
Updating the Agent Version
In order to run DataViewer or Agent Control Panel for the managed servers registered, the
Agent Version property must be set properly.
To set the value, open the Operation Window in the Web Component and execute 'Agent
Version Update' with the target servers.
3.
Setting the number of the alerts to be stored
To increase the number of alerts to be stored, specify the number of the alerts in the
Manager (AlertViewer) beforehand. The default is 500 alerts.
Re-creating the Virtual Directory for the Web Component
Even if you perform an overwrite installation, a virtual directory is not created.
If you have deleted the virtual directory for the Web Component, follow the instructions shown
below to re-create it.
1.
Logon to the Web server as a user with administrative privileges, and open the Command
Prompt.
2.
Type 'cd "C:\Program Files\ESMPRO\ESMBASE\ESMSMWEB"' to change the
current directory.
* NEC ESMPRO Manager is assumed to be installed on "C:\Program Files\ESMPRO".
3.
Type 'cscript sitelist.vbs'.
A list of Web sites that exist on the Web server will appear. The numbers displayed on the
left are the Web site numbers. Confirm the web site number for which you want to create
the virtual directory.
4.
Type 'cscript websetup.vbs -s the site number -a the virtual directory name'.
* '-s 1 -a esmpro' is set up in the initial setting.
Web Component 55
OPERATION WINDOW
The Operation Window displays a list of the managed servers connected to the network on a map.
Server monitor status and server properties can be accessed on the Operation Window. Additionally,
tools for managing components can be launched from the Operation Window.
Starting the Operation Window
Click on the "Operation Window" displayed on the Web Component title page.
The Operation Window starts.
56 Web Component
NOTE:
The Web Component uses the same management information as the
NEC ESMPRO Manager. Therefore, the maps and servers already
registered in the Manager are displayed on the Web Component.
The Web Component does not support Inter-Manager communication.
Thus, it does not display the Neighbor Manager information even if the
Inter-Manager communication has been set in the NEC ESMPRO
Manager.
Web Component 57
Registering a Server to be Managed
To register a server to the Operation Window, use the Autodiscovery function. If you already have
managed server information in hand, you can manually input a host name, a map name, and
required information, and register them.
In addition, in order to start various tools from the Operation Window, it is necessary to set up the
Agent Version property for the registered managed server appropriately.
Executing the Autodiscovery Function
1.
Start the Operation Window, and select the Autodiscover menu from the Menu Bar.
2.
Select the map for registering the discovered servers from the Map list.
3.
Select Address and Mask from Address… to enter an appropriate value in the Network
Address box and the Network Mask box, or select Range to enter the range of the address.
4.
Type an appropriate community name in the SNMP Community Name box.
5.
Click [Start Autodiscovery].
58 Web Component
NOTE:
The map selected from the tree frame on the left of the Operation
Window will be the default target map.
Keep in mind that the Web Component cannot perform Autodiscovery
while the NEC ESMPRO Manager is performing Autodiscovery or
while performing Autodiscovery from other browsers.
It is recommended that you edit the map configuration in the NEC
ESMPRO Manager before editing the map configuration in the Web
Component. Doing so helps you flexibly operate the map configuration.
Web Component 59
Setting the Agent Version
1.
Select the check box of hosts or maps containing hosts you want to update on the
Operation Window, and select the Agent Version Update menu from the Menu Bar.
2.
Select hosts in the Target Host(s) list, and click [Execute].
60 Web Component
Manually Adding a Map
1.
Select the map to which you want to add a new map.
2.
Click on Edit above the Map List.
3.
Enter an appropriate value in each box on the Area for adding a new map.
4.
Click on Add on the Map List.
Web Component 61
Manually Adding a Host
1.
Select the map to which you want to add a new host.
2.
Click on Edit above the Host List.
3.
Enter an appropriate value in each box on the Area for adding a new host.
4.
Click on Add on the Host List.
62 Web Component
Editing Properties of Maps or Hosts
1.
Select the map containing the map or host you want to edit.
2.
Click on Edit above the Map or Host List.
3.
Change the value on the properties of the map or host you want to edit.
4.
Click on Update the Selected Component(s) above the Map or Host List.
NOTE:
When you move to other entry items after changing a property of a map
or host, the check box of the map or host is automatically turned on.
Web Component 63
Deleting the Map or Host
1.
Select the map containing the map or host you want to delete.
2.
Click on Edit above the Map or Host List.
3.
Select the check box by the map or host you want to delete.
4.
Click on Delete the Selected Component(s) above the Map or Host List.
64 Web Component
Monitoring the Server Status
The status of the registered server is automatically monitored, and icons on the Operation Window
are changed according to the server status.
The following status icons are displayed to show the server status:
Status
Icon
Normal
Warning
Abnormal
Unknown
NOTE:
The list of the managed servers and their status colors is updated at one
minute intervals. However, each property information needs to be
updated by clicking [Refresh].
The status icon is displayed in gray (Unknown) when a target server is
stopped or in sleep mode or when any problems occur on the network.
Web Component 65
AlertViewer
The AlertViewer displays the alert messages sent to the NEC ESMPRO Manager.
Starting the AlertViewer
Click on "AlertViewer" on the Web Component title page.
The AlertViewer starts, and a list of the received alert messages appears.
NOTE: A newly received message is not automatically added to the
current list. Click [Reload] to obtain the latest alert information.
66 Web Component
Viewing Detailed Alert Information
Click on Summary to show the details of the alert. The detailed alert information is displayed
in the Details window.
Web Component 67
DataViewer
The DataViewer obtains the configuration information on the server in which the NEC ESMPRO
Agent is installed and displays it in a tabular form.
Displaying Server Configuration Information
1.
Position the cursor on a host name on the Operation Window. Click on DataViewer when
the pop-up menu appears.
The DataViewer starts.
68 Web Component
2.
Select the monitoring item set to be managed from the Monitoring Item list, and click
[Collect]. The information on the selected monitoring item set is displayed.
NOTE:
The Agent Version of a target host must be properly set to start the
DataViewer.
The information is not periodically updated. Click [Collect] to obtain
the latest information.
Customizing the Monitoring Item Set
The Monitoring Item Set can be customized. Defining it enables you to flexibly manage the servers.
1.
Click [Edit the Monitoring Item Set…] in the upper right corner of the DataViewer
window. The Edit Monitoring Item Set window appears.
2.
Click [Add] of the Monitoring Item Set.
3.
The "Enter Monitoring Item Set name to add" dialog box appears.
Type a monitoring item set name, and click [OK].
4.
Select an item from the Monitoring Item List, and click [<= Add] to add the item to the
Monitoring Item Set List.
5.
Add all items to be monitored, and click [Set].
NOTE:
Up to 100 monitoring item sets can be registered.
Clicking [Copy] enables you to create a new monitoring item set based
on an existing monitoring item set.
70 Web Component
AGENT CONTROL PANEL
The Agent Control Panel allows you to change the operational settings of the NEC ESMPRO Agent.
Starting the Agent Control Panel
Position the cursor over a component on the Operation Window. Click on Agent Control
Panel when the pop-up menu appears.
The Agent Control Panel appears.
NOTE: The Agent Version of a target host must be properly set to start
the Agent Control Panel.
Web Component 71
Changing the Operational Settings
1.
In order to change settings, click on the tab of the item which you want to change in the
upper part of the Agent Control Panel.
2.
Enter or select the setting item on each tab.
3.
Click [Set].
NOTE:
The information is not periodically updated. Click on the tab of the item
again to obtain the latest information.
Depending on servers, some tabs may not be displayed or cannot be
selected, or all or a part of the information may not be displayed or
cannot be selected.
An item displayed in a pale color indicates that the NEC ESMPRO
Agent did not return the information on that item for some reason, for
example, the server does not support the item.
72 Web Component
General
The General tab allows you to set the general settings for the Agent such as SNMP settings.
System
The system tab allows you to set the settings for monitoring the memory dump settings. Enabling
"Monitor the memory dump settings" monitors the setting of the memory dump which is collected
at the failure occurrence. Monitoring the memory dump setting helps avoid problems such that the
necessary memory dump for investigating a failure cannot be collected.
The dump setting which the memory dump can not be properly obtained is notified to the NEC
ESMPRO Manager.
Web Component 73
CPU
The CPU tab allows you to set the settings for monitoring CPU load. Monitoring CPU load can
provide early detection of a high CPU load rate.
The CPU load status is displayed as the status color on the DataViewer. It is reported to the NEC
ESMPRO Manager.
File System
The File System tab allows you to configure settings for monitoring the free capacity of the File
System. Monitoring File System capacity can provide early detection of a potential shortage of free
capacity.
Lack of free capacity is shown as the status color on the DataViewer. It is reported to the NEC
ESMPRO Manager.
74 Web Component
Storage
The Storage tab allows you to configure the settings for monitoring storage devices. The hard disk
pre-failure prediction function monitors any potential failures in the hard disk. When monitoring
storage devices is enabled, a failure can be detected before the hard disk breaks down. Therefore,
you can take action to prevent it, for example, replacing the hard disk.
The failure status of the hard disk is reported to the NEC ESMPRO Manager.
Web Component 75
LAN
The LAN tab allows you to configure the settings for monitoring packets received from and sent to
servers. When monitoring the packets is enabled, a failure on a line, a high load placed on a line,
and lack of server resources can be detected.
A failure of the LAN is reported to the NEC ESMPRO Manager or registered in the event log of the
system.
HW Event Log
The HW Event Log tab allows you to set the settings for the hardware event log.
76 Web Component
ESRAS
The ESRAS tab allows you to set the settings for activating the Off-line Maintenance Utility.
You can execute the preventive maintenance of hardware, isolate a failure, and restore the system
according to the events detected from the hardware with the off-line utility.
Web Component 77
Watchdog Timer
The Watchdog Timer tab allows you to set the settings for monitoring system hangs. Monitoring
system hangs helps minimize the server stop time and negative effect on the business at the system
hangs in automated/unmanned systems.
The monitored system hangs is notified to the NEC ESMPRO Manager.
78 Web Component
Shutdown
The Shutdown tab allows you to set the settings for monitoring the status of shutting-down the OS.
When monitoring the status of shutting-down is enabled, whether or not the OS is correctly
shutdown can be monitored. The monitored system hangs at shutdown is notified to the NEC
ESMPRO Manager.
SAF-TE
The SAF-TE tab allows you to specify the monitoring interval for power units, fan and door covered
on the SAF-TE instrumented system.
Web Component 79
Blade Server
The Blade Server tab allows you to set whether or not to report chassis events on a Blade server.
The Blade Server has a sensor which is shared by all blades. Therefore, the same chassis event is
reported by the agent on each blade, resulting in multiple alerts from a single event. You can control
the notifications from the all blades to avoid this when you set the notification settings here.
80 Web Component
Syslog
The Syslog tab allows you to configure the settings for monitoring Syslog.
Web Component 81
Local Polling
The Local Polling tab allows you to configure the settings for monitoring local polling.
Using this function, you can monitor the items for which the threshold setting function is not
supported (e.g., network traffic information and used physical memory). Thus, an alert for the items
will be sent when the monitored values are outside of the threshold range.
The monitoring status of managed servers is displayed as the status color on the DataViewer, and it
can be seen with the alert notification function of the NEC ESMPRO Manager.
82 Web Component
To use the Local Polling function, follow the instructions below.
1.
Click on the Local Polling tab.
2.
On the Polling Targets list, click [Configure…] of the target to be registered or changed.
Web Component 83
3.
Enter the object ID in the Object ID box. The object ID can be selected from the Object
ID List by clicking [Browse…] if needed.
4.
Set Duration, Interval, Maximum Value and Minimum Value.
5.
Set the appropriate threshold values.
6.
Enable Polling allows you to set whether or not to monitor MIB. The value set in Interval
is enabled only when this is checked.
NOTE:
Local Polling is a function for monitoring any items (only integers).
This function is called "Local Polling" because the server status is
monitored on the agent side (local) according to the values set. With
this function, you can monitor the managed servers according to your
system by setting a threshold. For example, the server status color will
change and/or an alert will be sent when the monitored values are out of
the threshold range.
If another SNMP agent is installed on the server to be managed, the
MIB defined in that product can be monitored in the same way as above.
Note that an understanding of the managed server MIB information is
required to determine appropriate local polling settings.
84 Web Component
REMOTE WAKE UP
The Remote Wake Up function allows you to power on systems on the network.
To use the Remote Wake Up function, follow the instructions below.
1.
Select the check box of the host or a map containing the host you want to start on the
Operation Window, and select the Remote Wake Up menu.
2.
Select the hosts you want to start from the Target Host(s) List, and click [Execute].
NOTE:
To use the Remote Wake Up function, the "RWU MAC Address" and
"RWU IP Broadcast Address" must be set.
The Remote Wake Up function needs to be enabled on the target host to
use this function. See the manual for each component for how to set it
up.
Additionally, the direct broadcast needs to be enabled in a router to use
this function over the network via the router. See the router manual for
details.
Web Component 85
REMOTE SHUTDOWN
The Remote Shutdown function allows you to remotely shut down a system running on the network.
Remotely Shutting Down a Managed Server
1.
Select the check box of a target host or a map containing the target host to be shut down
on the Operation Window, and select the Remote Shutdown menu from the Menu Bar.
2.
Select the hosts to be shut down from the Target Host(s) List, and click [Execute].
NOTE:
To use the Remote Shutdown function, the NEC ESMPRO Agent
version 3.0 or later needs to be installed on the target host and its
version also needs to be properly set on the properties on the target host.
86 Web Component
Setting the Agent Settings
The NEC ESMPRO Agent settings must be set on the target server to run the Remote Shutdown
function.
1.
Select NEC ESMPRO Agent from the Control Panel.
2.
Select "Permit Remote Shutdown / Reboot" on the General tab.
3.
Click [Report Setting] on the General tab to open the Alert Manager window.
4.
Select Base Setting from the Setting menu to open the Base Setting window. Select the
Other tab and check whether the icon displayed on the left of the "Shutdown Delay" item
is green as shown below. If not, click the icon to change it to green.
5.
Click [OK] to exit the menu.
Chapter 7
HP OpenView Integration
ABOUT THE HP OPENVIEW INTEGRATION
NEC ESMPRO Manager-HP OpenView Integration (HP OpenView Integration) is an application
for using the server management functions provided in NEC ESMPRO Manager on the HP
OpenView Network Node Manager.
HP OpenView Integration includes the following functions:
– Auto-discovering and deleting NEC ESMPRO Agent
– Monitoring the NEC ESMPRO Agent status
– Launching the DataViewer
– Launching the Operation Window
– Launching the AlertViewer
– Displaying NEC ESMPRO Agent traps
GETTING STARTED
Before you use HP OpenView Integration, follow the instructions below.
Setting a Method for Receiving SNMP Traps
To receive SNMP traps in the environment where NEC ESMPRO Manager and HP OpenView
Network Node Manager coexist, select [Options] - [Customize] - [My Manager] on the Operation
Window and set the Method of receiving SNMP Trap to "Use SNMP Trap Service" on the My
Manager dialog.
Before Executing Auto-discovery of the NEC ESMPRO Agent
Before you execute auto-discovery of the NEC ESMPRO Agent to be managed, the sub map of the
managed host needs to be registered on the HP Open View Network Node Manager. If not, autodiscovery cannot be executed for the host. Therefore, be sure the host is registered before executing
auto-discovery.
88 HP OpenView Integration
USING HP OPENVIEW INTEGRATION
Auto-discovering NEC ESMPRO Agent
To register an NEC ESMPRO Agent to be managed, select [Tools] - [NEC ESMPRO Manager] [Agent Discovery] to display the NEC ESMPRO Agent Discovery wizard.
This function finds nodes which support SNMP from among those registered on the HP OpenView
Network Node Manager, and then discovers NEC ESMPRO Agent from among those nodes. When
NEC ESMPRO Agent is discovered, an NEC ESMPRO Agent symbol is registered on a node sub
map corresponding to it.
Monitoring the NEC ESMPRO Agent Status
The HP OpenView Integration function collects the status information obtained by NEC ESMPRO
Manager and reflects it in the color of the NEC ESMPRO symbol. Thus, the status color of the
managed NEC ESMPRO Agent is reflected to the NEC ESMPRO Agent symbol.
Deleting NEC ESMPRO Agent
To delete a registered NEC ESMPRO Agent symbol, select [Tools]-[NEC ESMPRO Manager] [Delete Agent] to display the Delete NEC ESMPRO Agent dialog.
First, the process for finding NEC ESMPRO Agent symbols from the selected network symbol is
executed. Then component names are set in the NEC ESMPRO Agent Component Name field, and
sub map names on which symbols are registered are listed.
Select the NEC ESMPRO Agent you want to delete from the list, and click [Delete] to delete it. If
you click [Select All], all symbols in the list are selected.
Launching the DataViewer
To launch the DataViewer, double-click an NEC ESMPRO Agent symbol, or select DataViewer
from the pop-up menu displayed by right-clicking the symbol.
Launching the Operation Window
To launch the Operation Window, select [Tools] - [NEC ESMPRO Manager] - [Operation Window].
HP OpenView Integration 89
Launching the AlertViewer
To launch the AlertViewer, select [Tools] - [NEC ESMPRO Manager] - [AlertViewer].
Displaying NEC ESMPRO Agent Traps
HP OpenView Integration enables SNMP traps sent by NEC ESMPRO Agent to be displayed on the
Alarm Browser of HP OpenView.
The ESMPRO/SM Trap Redirection service receives an SNMP trap sent by NEC ESMPRO Agent
and sends it to the HP OpenView Network Node Manager (local host).
Then, the SNMP trap is displayed on Alarm Browser.
The setting for this forwarding function is always automatically done at installation. However, you
may have to manually set it after the installation if:
– 'public' is not registered as the SNMP community name that HP OpenView accepts.
– Other settings have been already set for the ESMPRO/SM Trap Redirection service.
In such cases, select [NEC ESMPRO Manager] - [SNMP Trap Redirection Setting] from the Start
menu to launch SNMP Trap Redirection Setting, and change or add the following items in
Destination Setting:
Host name or IP address: 127.0.0.1
Community name:
The name of an SNMP community that HP OpenView accepts
Appendix A
Inter-Manager Communication
NEC ESMPRO software in a Manager can monitor approximately 100 units, although this number
varies according to what is monitored. You can register more than 100 units in the configuration
information on the screen. The number of units that can be managed depends on the performance of
managers and routers. Limitations occur when availability management is carried out on all
managed units within a short interval.
The NEC ESMPRO system exchanges packets with the SNMP Agent. To monitor many Agents
over a thin line, such as a private line, you should divide them into communities for best results.
Figure A-1 shows two different routing configurations.
Managing with a single Manager
Managing with multiple Managers
Figure A-1 Routing Configurations
Each Manager is recognized by a Manager name that consists of up to 63 characters including the
hyphen (-), underscore (_), and period (.). The Manager name can be changed in the My Manager
Dialog screen by selecting My Manager from the Customize menu in the Options menu.
Inter-Manager Communication 91
You can group communities by network, level, or a combination of the two for inter-Manager
communication. Figures A-2 and A-3 show the two types of configurations. In Figure A-2, foo, bar,
and shina are Manager names. If you group communities by level, you may want to name the
communities using the Domain Name System (DNS).
Figure A-2 Network Manager Group
Figure A-3 Ladder Manager Group
In Figure A-3, the three communities, nvs, kawa.tk.nvs, and foo.tk.nvs, are directly connected to
each other. ks.nvs and tk.nvs are adjacent communities. A TCP/IP connection is always established
to adjacent communities. However, establishing a connection between two adjacent communities
requires making some settings in the Remote Manager dialog.
Indirect communication to a non-adjacent Manager can be made available with the Manager routing
function. For details about these procedures, see Setting Up Inter-Manager Communication, in
Chapter 3, Using the NEC ESMPRO Manager.
Appendix B
Notes
MANAGER
1.
About versions of NEC ESMPRO Manager and NEC ESMPRO Agent
If a version of NEC ESMPRO Manager is older than that of NEC ESMPRO Agent, a
problem may occur such as the configuration information cannot be displayed, or received
alerts are not correctly displayed, and so forth. Update NEC ESMPRO Manager to the
version equal to or later than that of NEC ESMPRO Agent.
2.
About coexistence of NEC ESMPRO Manager with other vendor’s SNMP management
application
When another vendor's SNMP management application which receives an SNMP trap is
used along with NEC ESMPRO Manager, one of them may fail to receive the SNMP trap
due to conflict between the two applications. Through the following procedures, the
situation can be avoided.
<Work Around 1>
If the other vendor's SNMP management application supports the trap reception function
of standard SNMP Trap Service, you can change the setting of NEC ESMPRO
Management Manager according to the instruction below.
Select [Options] - [Customize] - [My Manager] on the Operation Window, and change the
Method of receiving an SNMP Trap to "Use SNMP Trap Service".
Note that when you select "Use SNMP Trap Service", the function that restricts receiving
SNMP Traps by SNMP community names cannot be used. (The function can be
configured from [Options] - [Customize] - [Environment] of the Operation Window.)
< Work Around 2 >
By utilizing the "TCP/IP report to Manager" function of NEC ESMPRO Agent, the alert
reception function of NEC ESMPRO operates normally.
TCP/IP report to Manager: Transfers an alert from a server to the NEC
ESMPRO using an original protocol on TCP/IP.
Note that the operability of the SNMP Trap reception function on the other vendor's
SNMP management application cannot be guaranteed.
3.
About the operation of machine with Suspend/Resume function
With the use of Suspend/Resume function, the performance of manager might become
unstable. In such case, do not use this function.
Notes 93
4.
About transfer of DMI events on Inter-Manager Communication
DMI events are not transferred between the Inter-Manager Communication.
5.
Installing other DMI management application and manager on the same machine
In case when other DMI management application is installed to the same machine,
receiving DMI events with AlertViewer may not work properly.
Be sure not to install Manager and DMI management application on the same machine.
6.
About monitoring DMI Agents
The DMI monitoring function has been removed from the NEC ESMPRO Manager Ver.
4.1 or later. As a result, the Manager behaves as follows.
– DMI Agents are discovered by the auto-discovery function, and displayed as icons on
the Operation Window.
– DMI events are received, and displayed on the AlertViewer.
– Status of DMI Agents are not monitored through DMI even if the "Watch Server
Status" properties are "On".
– The information of the DMI Agents is not viewed on the DataViewer or the
GraphViewer, and not collected by the Automatic Data Collection function.
7.
Receiving DMI events from the machine belonging to multiple networks
Receiving DMI events from the machine (with multiple IP addresses) belonging to
multiple networks may not be available. In such cases, use SNMP trap or TCP/IP In-Band
for notification from Agent to Manager.
8.
About using NEC ESMPRO Manager on a machine with a high load
– When a machine on which the NEC ESMPRO Manager is installed is under high load:
If you use the machine with an extremely high load such as when 100% of the CPU has
been used for a long time period, the following message may appear:
Communication with NVBASE System Service became invalid.
Manager applications communicate with a service (NVBase System Service) by design.
The above message appears when the communication is timed-out due to high load.
In such a case, decrease the load on the machine and restart the application.
– When a machine on which the NEC ESMPRO Agent is installed is under high load:
If a machine on which the NEC ESMPRO Agent is installed is operating with a high
load, NEC ESMPRO Agent does not respond to the query from the NEC ESMPRO
Manager. Therefore, the following problems may occur:
– The icon for the machine is grayed out on the Operation Window.
– The following error messages are displayed when the DataViewer is started.
Could not collect information on the server.
Please refer to Recovery Action for errors in DataViewer Help.
– The machine information becomes "Unknown" on the DataViewer.
– The following message is registered in the AlertViewer when the "Detect Server
94 Notes
Down" property is "On".
Summary: No response from the server.
Detail:
Alert generation time ...
The server doesn't respond to SNMP access from the Manager. There
is the possibility that the server is down, the load on the server has
been excessively increased, or the network is not functioning properly.
9.
About usage of DHCP
As NEC ESMPRO Manager manages the system according to its IP Address, a DHCP
which assigns IP address dynamically cannot be used.
10.
About transmitting and receiving packets between NEC ESMPRO Manager and NEC
ESMPRO Agent
Packets will be transmitted/received between NEC ESMPRO Manager and the Agent at
the following times.
We recommend reasonable care in operating in a system which charges you for things
such as connection on a WAN.
– At autodiscovery of servers on the Operation Window.
– At a specified interval after specifying regular autodiscovery on the Operation Window.
– When deleted server where DMI agent is checked for its properties on Operation
Window.
– When DMI Agent is registered on Operation Window.
– When the DMI Agent is turned OFF on Operation Window.
– When the DMI Agent is turned ON on Operation Window.
– When Remote Wake UP is executed on the Operation Window.
– Irregularly, after specifying inter-manager communication on the Operation Window.
– At receipt of an SNMP Trap.
– At receiving DMI event.
– At startup of Operation Window, for all the DMI agents registered at Operation
Window.
– About every one minute after DataViewer is started.
– About every one minute after GraphViewer is started.
– At a specified interval for a specified server, after setting Automatic Data Collection.
– Regular polling about every one minute to monitor server status.*
* Can be avoided by turning "Watch Server Status" off at the Properties dialog on the
Operation Window's server icon. However, the server status will not be reflected in the
color of the icon on the Operation Window.
Notes 95
11.
Setting an SNMP trap destination
When you install NEC ESMPRO Manager and NEC ESMPRO Agent on the same
computer, specify the IP address assigned to the network card or the host name as the
SNMP trap destination for the computer, instead of the loop back address 127.0.0.1.
If you specify 127.0.0.1, "unknown server" may be displayed on the AlertViewer.
On the other hand, you may need to specify 127.0.0.1 for a computer not connected to the
network. For more information, see "Settings on standalone environments without
network connections" below.
If the following is displayed on the AlertViewer even when you have specified as above,
Component: {unknown server}
Address:
127.0.0.1
change the IP address to 127.0.0.1 on the properties of the server icon on the Operation
Window.
12.
Settings on standalone environments without network connections
When you install the NEC ESMPRO Manager and the NEC ESMPRO Agent on a
machine together, if the machine is not connected to the network take the following steps
to monitor the machine itself:
– Specify 127.0.0.1 for Start Address and End Address as a range for the Autodiscovering..
– Specify 127.0.0.1 for the SNMP trap destination.
If you have already registered server icons, execute AutoDiscover after deleting the icons.
13.
About the NEC ESMPRO User Group
Since security for the NEC ESMPRO Manager is managed by the NEC ESMPRO User
Group, the NEC ESMPRO never starts without accessing this group.
Note the following:
1) Do not delete/change the NEC ESMPRO User Group after installing the NEC
ESMPRO Manager.
2) When the NEC ESMPRO User Group is registered as a global group member, it is
necessary to start the Domain Controller before the Manager machine boots.
14.
About the threshold dialog for temperature sensor
For some servers, only the Fatal status may be displayed on the dialog for setting
threshold vales of temperature sensor. In this case, the sliders show yellow as normal
status, but green is displayed as the actual status color when temperature of a target
machine is lower than the specified Fatal limit.
96 Notes
15.
About versions when using Inter-Manager Communication
If you use Inter-Manager Communication between different versions of the NEC
ESMPRO Manager, the following problems may occur.
– The alerts will not be sent to the neighbor manager.
– Part of the information will not be displayed in the DataViewer.
When you use Inter-Manager Communication, in advance, be sure to use same version of
the NEC ESMPRO Manager by performing update installation if needed.
16.
Operations with a user who does not have Administrators privilege
When you log on as a user who belongs to the ESMPRO Users Group but does not have
Administrators privilege, you cannot use the following functions (unless you specified the
default Administrators as the ESMPRO Users Group during installation of NEC ESMPRO
Manager):
– Changing the method of receiving SNMP traps on the Operation Window
– Autodiscovery of DMI agents on the Operation Window
– Report settings of AlertViewer
If you execute any of the above functions by mistake, do the following:
<Changing the method of receiving SNMP traps>
[Problem]
When you restart the system after changing the method of receiving SNMP traps on the
My Manager window displayed by selecting [Options]-[Customize]-[My Manager] in the
Operation Window and clicking [OK], the following problem will occur:
– When you have changed to "Use SNMP Trap Service":
After the system restarts, NVBase System Service is "Starting" for a while and then it
stops. Therefore, the Operation Window will not be able to start.
– When you have changed "Use own method":
NVBase System Service will not be able to receive traps after the system restarts.
[Measure]
1) Log on as a user with Administrators privilege.
2) If NVBase System Service is "Starting", wait for it to stop.
When it stops, manually start NVBase System Service and ESM Alert Service.
* To check the service status and to manually start the services, use [Services] from
Control Panel (Administrative Tools).
3) Restore the method of receiving SNMP traps on the My Manager window in the
Operation Window to the previous status, and click [OK].
4) Open the My Manager window again, change the method of receiving SNMP traps
to one that you want, and click [OK].
5) Restart the system.
Notes 97
After you do the above, you can perform subsequent operations with a user who does not
have Administrators privilege.
<Autodiscovery of DMI agents>
[Problem]
When you check "Discover DMI Agents" on the Details of AutoDiscover window of
Operation Window to execute autodiscovery, or when you open the Properties window of
a server icon and select "On" for "DMI" and "Watch DMI Event", the following will
occur:
DMI events cannot be received.
[Measure]
Log on as a user with Administrators privilege, change settings of autodiscovery or its
properties again.
<Report settings>
[Problem]
When you select [Tools]- [Report Settings] to open the Alert Manager window, select
[Setting]-[Base Setting] on that window to open the Receive tab of the Base Setting
window and change the setting of Receive from Agent (TCP/IP) or Receive from SMB,
the following will occur:
– When you have changed from Receive valid (green) to Receive invalid (red):
Even though the status of each item appears to be changed to "Receive invalid (red)",
the service (Alert Manager Socket(R) Service or Alert Manager ALIVE(R) Service)
does not actually stop. In such a case, alert messages can never be received but an
unnecessary service is running. This results in a waste of resources. In addition,
whenever you change this status to Receive valid (green), the following error appears:
"Failed to start the service. : Service name"
– When you have changed from Receive invalid (red) to Receive valid (green):
Although the following message appears, the status of each item is changed to
"Receive valid (green)".
"Failed to start the service. : Service name"
However, alert messages cannot be received because the service (Alert Manager
Socket(R) Service or Alert Manager ALIVE(R) Service) failed to start.
[Measure]
Log on as a user with Administrators privilege.
– If you have changed each item from Receive valid (green) to Receive invalid (red),
restore it to "Receive valid (green)", and change it to "Receive invalid (red)" again.
– If you have changed each item from Receive invalid (red) to Receive valid (green),
restore it to "Receive invalid (red)", and change it to "Receive valid (green)" again.
17.
To upgrade your operating system
Please uninstall NEC ESMPRO Manager before upgrading Operating System.
98 Notes
For Windows Server 2003 and Windows Server 2003 R2, however, upgrade the NEC
ESMPRO Manager to this version first, and then upgrade the operating system. Doing so
allows you to go on using the NEC ESMPRO Manager.
If the Web component has been installed in this case, you may not use it because the
World Wide Web Publishing Service is disabled. In such a case, start up IIS (Internet
Information Service) Manager on a Web server, and then start Default Web Site (Stopped).
18.
About the alert message in AlertViewer
In the AlertViewer, the alert message containing characters other than English (e.g.
Chinese) cannot be displayed correctly. Therefore, keep in mind that even if the alert
message which contains those characters is watched and notified by the event log
monitoring function of NEC ESMPRO Agent, it cannot be checked in the AlertViewer.
19.
Maps to be specified at autodiscovery
After you execute Autodiscover on the Operation Window, maps may be displayed as if
they were registered infinitely as shown below:
Ex.) My Manager
+ Internet
+ 192.168.1.0
+ mapA
+ mapA .........(*)
+ mapA
:
This problem occurs when you execute Autodiscover on maps which were created at
autodiscovery, such as rackmount maps, cluster maps and blade maps. In such a case,
delete the second mapA (marked with (*) in this example) to resolve the situation.
If you re-execute Autodiscover with icons already registered, do not specify maps which
were automatically created at the previous autodiscovery, such as rackmount maps, cluster
maps and blade maps.
20.
AlertViewer shows "unknown server" in the Component column
If a managed server is not registered in the Operation Window, AlertViewer shows
"unknown server" in the Component column.
To show the correct server name in any following alerts, autodiscover the managed server
in the Operation Window.
To autodiscover the managed server, go to Operation Window, Tools, Autodiscover,
Foreground, TCP/IP Hosts. Select the appropriate map (network) in the Autodiscover
dialog box and click [Start].
21.
Note on using NEC ESMPRO Manager on Windows XP
On Windows XP, communication between NEC ESMPRO Manager and NEC ESMPRO
Agent will be interrupted due to the Windows Firewall. Do the following to avoid this
issue:
Setting a Windows Firewall Port
[Problem]
Notes 99
Under the following Windows XP environments, the Windows Firewall is enabled. In
this case, NEC ESMPRO Manager and NEC ESMPRO Agent cannot communicate
each other. Therefore, servers cannot be monitored.
– Windows XP Professional/Home Edition (Service Pack 2)
– Windows XP Professional x64 Edition
[Steps to open the Windows Firewall Port]
1) Open [Control Panel], and click [Security Center].
2) On the [Windows Security Center] dialog box, click [Windows Firewall].
3) On the [Windows Firewall] dialog box, click the [Exceptions] tab and click [Add
Port...].
4) On the [Add a Port] dialog box, enter values in the [Name] and [Port number] fields,
select [TCP] or [UDP], and click [OK].
[Target Ports]
The following table shows the ports for the Windows Firewall to be set on the [Add a
Port] dialog box on a machine on which NEC ESMPRO is installed.
Name
(can be changed)
Inter-Manager
communication
SNMP Trap
High Reliable
Notification
Express Notification
via Manager
Web Component
Port
number
8806
Protocol
Environment
TCP
162
UDP
31134
TCP
31136
TCP
80
TCP
When Inter-Manager communication is
used.
When Manager Notification (SNMP) is
used (default).
When Manager Notification (TCP/IP in
Band) is used.
When Express Notification Service is
used via Manager.
When Web Component is used.
Monitoring a server where multiple IP addresses are set for a single network card.
[Problem]
If a monitored server has multiple IP addresses for a single network card, the IP address
of the SNMP Response packet from NEC ESMPRO Agent may differ from the source
address in the IP header of the SNMP Request packet from NEC ESMPRO Manager.
In such a case, if NEC ESMPRO Manager receives the Response packet from NEC
ESMPRO Agent before Windows Firewall Service starts, the server cannot be
monitored thereafter.
[Steps to avoid this issue]
On the Operation Window, open [Properties] on the server icon, change the IP address
to another one that is set on the monitored server, and reboot the Manager computer.
22.
Autodiscovery of Blade Servers
When you execute Autodiscover and register blade servers, the number of slots for storing
blades may be displayed differently from the actual one, and icons may be placed outside
of the frame.
100 Notes
In such a case, follow the steps below to change map properties on Operation Window of
the main NEC ESMPRO Manager:
1) Right-click the target blade map icon, and select [Properties] from the pop-up menu.
2) Double-click [Background], and select an appropriate background image.
3) Double-click [Maximum Number of Blade Slot in Chassis], and set an appropriate
maximum number of slots.
4) Click [OK] to complete the settings.
23.
About autodiscovery of SIGMABLADE
When you autodiscover SIGMABLADE, some icons named IP address may be registered
outside of Blade Enclosure. These are, for example, the floating IP of EM card, and the IP
used for out of band management. You can delete these icons manually as they are not
used for the management function provided by Manager.
24.
About a value that displayed in "Rebuild Status" when LSI Logic's disk array controller is
used
When a physical device is rebuilt, an incorrect value may appear in "Rebuild Status" of
the [Physical Device] window from [Disk Array] of DataViewer. In such a case, use
"Power Console Plus" (Management Utility of a disk array RAID system) to check the
actual rebuild status. You can check the rebuild completion with the [Physical Device]
window. When the rebuild successfully completes, "Status" is turned from "Rebuild" to
"Online".
25.
Display of network speed on DataViewer
When you monitor Linux servers, Speed will not be displayed on the Network General
window of DataViewer. In such a case, check it on target servers.
26.
Ports used by NEC ESMPRO Manager and Agent
NEC ESMPRO Manager and Agent use the following ports. If a firewall is placed
between Manager and Agent, or if Windows Firewall is enabled, open the following ports.
Between Manager and Agent
Function
Operation
Window
(Autodiscovery)
Operation
Window
(Server Status Polling)
Manager
(Port)
Undetermined
Direction
→
←
→
←
Agent
(Port)
-
Protocol
Remarks
icmp
icmp
161
UDP
snmp
Undetermined
Undetermined
UDP
snmp-trap
TCP
-
DataViewer
Server Down Detection
Report to Manager
(SNMP)
Report to Manager
(TCP/IP In-Band)
Report to Manager
(TCP/IP Out-of-Band)
162
31134
→
←
→
←
Notes 101
- The upper direction shows the direction at start-up, and the lower shows the return.
- Change both Agent and Manager settings when you change the port number for the
Report to Manager (TCP/IP In-Band).
The setting method is as follows.
<Agent>
1) Click the “Setting” - “Destination Setting” menu on Alert Manager, then you
can see Destination Setting dialog showed.
2) Select the “TCP/IP In-Band” and click [Modify ID] on Destination Setting
dialog, then you can see ID Setting dialog showed.
3) Click [Address] on ID Setting dialog, then you can see Manager (TCP/IP InBand) Setting dialog showed.
4) Set the port number to “Port Number” on Manager (TCP/IP In-Band) Setting
dialog.
<Manager>
1) Click the “Setting” - “Base Setting” menu on Alert Manager, then you can see
Base Setting dialog showed.
2) Select the “Receive from Agent (TCP/IP)” and click [Configure] on Base
Setting dialog, then you can see Receive from Agent (TCP/IP) setting dialog
showed.
3) Set the port number to “Port Number” on Receive from Agent (TCP/IP)
Setting dialog.
- Change both Agent and Manager settings when you change the port number for the
Report to Manager (TCP/IP Out-of-Band).
<Agent>
1) Click the “Setting” - “Destination Setting” menu on Alert Manager, then you
can see Destination Setting dialog showed.
2) Select the “TCP/IP Out-of-Band” and click [Modify ID] on Destination
Setting dialog, then you can see ID Setting dialog showed.
3) Click [Address] on ID Setting dialog, then you can see Manager (TCP/IP
Out-of-Band) Setting dialog showed.
4) Set the port number to “Port Number” on Manager (TCP/IP Out-of-Band)
Setting dialog.
<Manager>
1) Click the “Setting” - “Base Setting” menu on Alert Manager, then you can see
Base Setting dialog showed.
2) Select the “Receive from Agent (TCP/IP)” and click [Configure] on Base
Setting dialog, then you can see Receive from Agent (TCP/IP) setting dialog
showed.
3) Set the port number to “Port Number” on Receive from Agent (TCP/IP)
Setting dialog.
- “Undetermined” means that the unoccupied port at the communication start-up will
102 Notes
be selected.
Between Manager and Manager
Function
Inter-Manager
Communication
Manager
(Port)
Undetermined
Direction
→
←
Manager
(Port)
8806
Protocol
Remarks
TCP
-
- The port number can be changed in the Remote Manager dialog by selecting
Operation Window menu [Option] → [Customize] → [Remote Manager].
- “Undetermined” means that the unoccupied port at the communication start-up will
be selected.
Between Manager or Agent and Mail Server
Function
Internet Mail
Manager (Port)
or Agent (Port)
Undetermined
Direction
→
←
Mail Server
(Port)
25
Protocol
Remarks
TCP
smtp
- The port number for the Internet Mail can be changed by following.
1) Click the “Setting” - “Base Setting” menu on Alert Manager, then you can see
Base Setting dialog showed.
2) Select the “Internet Mail” and click [Configure] on Base Setting dialog, then you
can see Internet Mail setting dialog showed.
3) Set the port number to “SMTP Port number” on Internet Mail Setting dialog.
- “Undetermined” means that the unoccupied port at the communication start-up will
be selected.
Notes 103
WEB COMPONENT
1.
About the virtual directory for the Web Component after uninstalling
If you have changed the default virtual directory name (esmpro) of IIS used by the Web
Component, the virtual directory is not deleted even when you uninstall the Web
Component. In such a case, uninstall the Web component, and then manually delete the
virtual directory.
2.
About display of SCSI Slot General on the Web Component
If you are trying to see the ft server information "SCSI Slot General" of the NEC
ESMPRO Agent Ver. 3.8 series on DataViewer of the Web Component installed on NEC
ESMPRO Manager Ver. 4.07 or later, the following items may not be correctly displayed:
–
–
–
–
3.
Vendor
Model
Revision
Serial Number
Security levels of Internet Explorer when the Web Component is used
The Web Component uses the JavaScript function of Internet Explorer.
Therefore, set the security level of Internet Explorer for the Web Component to "Medium"
or lower.
Note that the Security level for the Internet zone of Internet Explorer is set to "High" on
Windows Server 2003 by default. In such a case, set the security level to "Medium" or
lower, or add the Web Component site in the Trusted Sites list.
4.
When you use the Web Component through Internet Explorer on Windows Server 2003
If you use the Web Component through Internet Explorer on Windows Server 2003, titles
(e.g., tool name, host name, and manager name) may not be correctly displayed on the
title bar. In such a case, see the information displayed in the window.
5.
Autodiscovery of Blade Servers
When you execute Autodiscover and register blade servers, the number of slots for storing
blades may be displayed differently from the actual one, and some blade images may not
be displayed.
In such a case, follow the steps below to change amp properties on Operation Window of
the main NEC ESMPRO Manager:
1) Right-click the target blade map icon, and select [Properties] from the pop-up menu.
2) Double-click [Background], and select an appropriate background image.
3) Double-click [Maximum Number of Blade Slot in Chassis], and set an appropriate
maximum number of slots.
4) Click [OK] to complete the settings.
6.
About autodiscovery of SIGMABLADE
When you autodiscover SIGMABLADE, some hosts named IP address may be registered.
104 Notes
These are, for example, the floating IP of EM card, and the IP used for out of band
management. You can delete these hosts manually as they are not used for the
management function provided by Manager.
7.
Display of network speed on DataViewer
When you monitor Linux servers, Speed will not be displayed on the Network General
window of DataViewer. In such a case, check it on target servers.
8.
Note on using NEC ESMPRO Manager on Windows XP
Under the Windows XP environment, Web Component does not work properly due to the
Windows Firewall. Therefore, you need to make settings on a Manager machine. See
"Note on using NEC ESMPRO Manager on Windows XP" described in the MANAGER
section of this appendix for how to set it.