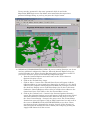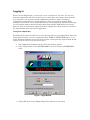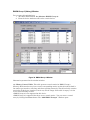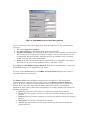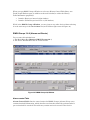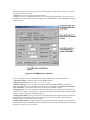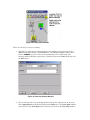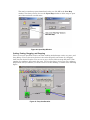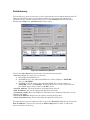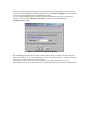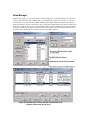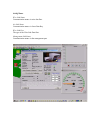
1
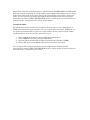
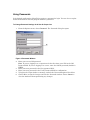
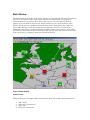
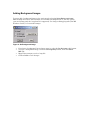
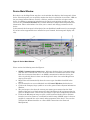
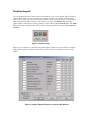
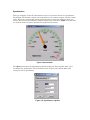
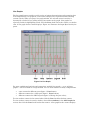
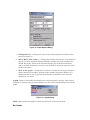
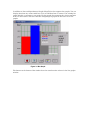
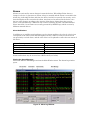
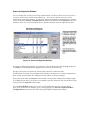
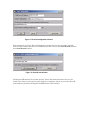
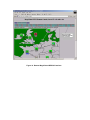
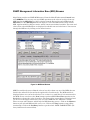
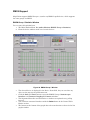
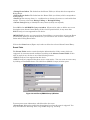
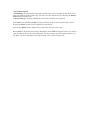
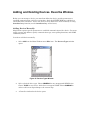
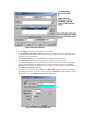
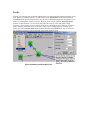
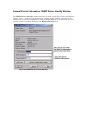
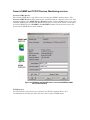
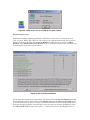
MegaVision Network Management System User Manual MRV Communications, Inc. URL: http://www.mrv.com WARRANTY The software described in this document is subject to change without notice. The information in this document is subject to change without notice and should not be construed as a commitment by the seller. The seller reserves the right to revise this publication without obligation to provide notification of such revisions. While reasonable precautions have been taken, the seller assumes no responsibility for errors that may appear in this document. No part of this publication may be copied or reproduced in any form or by any means without prior written consent of the seller. Copyright © 2000 All rights reserved. Jan 2003, ML46654, Rev. 03 Contact Information For customer support, you can: • Contact your local MRV representative • E-mail us at [email protected] • Visit our MRV Web site at http://www.mrv.com Contents 1. Overview 2. Quick start 3. Logging in 4. Using passwords 5. Main Window 6. Adding Background Images 7. Device Main Window 8. Control windows 9. Graphics support 10. Alarms 11. SNMP MIB Browser 12. Interfaces monitoring 13. RMON support 14. Adding and deleting devices. Describe window. 15. Autodiscovery 16. Links 17. Generic SNMP and TCPIP devices. Services Monitoring 18. Alias manager 19. TereScope™ Management 20. Running MegaVision as a plug- in application for different NMS platforms Overview MegaVision is a network management application. Its main function is managing a specific set of supported devices, however, it can discover and perform many functions with virtually any vendor SNMP or TCP/IP devices. It provides you with the consistent view of your whole network, helps with its configuration, monitoring and troubleshooting. This manual contains only generic MegaVision information, which is applicable to the whole system and all managed devices. For multiple details about different devices management please refer to MegaVision online HELP. There are two basic versions of MegaVision: MegaVision-WEB and MegaVision Classic. MegaVision-WEB MegaVision-WEB runs on Win95/Win98/WinNT/Win2000. However, its rich GUI (graphical user interface) can be accessed on ANY platform (see below). There are two different ways, which MegaVision-WEB GUI can be accessed: 1. Local GUI is provided on the same PC, which is running MegaVision-WEB. 2. Remote WEB-Console GUI can be accessed from any computer (any OS, including UNIX, Linux...), which is capable of running Java-enabled WEB-browser (like Netscape or Internet Explorer). There is NO specific console software required. Just start your WEB-browser and point it to the address: "http://<IP Address>/", where <IP Address> is IP Address of the PC MegaVision-WEB is running on. This feature allows to monitor/configure your network from any point in the world, which has Internet/Intranet connection. It also allows managing supported devices from standard NMS platforms (such as HP OV NNM UNIX, please see below) MegaVision Classic MegaVision Classic is an older version of MegaVision. It is kept mostly for backward compatibility and capability of native integration with some NMS platforms. MegaVision Classic runs on Win3.1/ Win95/Win98/WinNT/Win2000 MegaVision Classic can be installed as: 1. Standalone MS-Windows application. In this configuration it provides its own mapping, alarm color-handling and polling capabilities. MegaVision Classic Standalone version is kept for backward compatibility only. It is strongly recommended using MegaVision-WEB as a standalone application. MegaVision-WEB local GUI has all the capabilities of MegaVision Classic Standalone and much more. 2. Plug-in application for HP OpenView Windows (version 7.1 and higher, including HP OV Professional Suite). 3. Plug-in application for Castle Rock SNMPc 4.x or SNMPc NT 5.x. 4. Plug-in application for Cabletron SPECTRUM 4.0 rev1 and higher (WinNT 3.51). 5. Plug-in application for HP OV NNM (WinNT, Win2000). When working as plug-in application MegaVision uses mapping and alarm color handling features provided by the corresponding NMS platform. MegaVision Features MegaVision helps you to quickly configure the network. It detects network problems, provides device and port control, and offers real-time and historical graphical and statistical displays. Here is the list of main features applicable to both MegaVision Classic and MegaVision-WEB: • Rich user-friendly GUI full management for the supported family of products. • Ability to discover and monitor any vendor SNMP or TCP/IP compliant device. • End-to-end network monitoring and configuration. Hierarchical maps allow graphical presentation and inventory of the whole network. • In-band and/or out-of-band access via SLIP RS-232. • Multiple devices are monitored and controlled at the same time. • TFTP/BootP client/server. • RMON groups 1,2,3,9 GUI supported for any RMON capable device. • Automatic inactivity discovery of SNMP and TCP/IP devices. • Configurable immediate visual and sound notification of SNMP alarms/traps. • Virtual LANs graphical setup and display. • User defined alarms thresholds. • Adjustable polling intervals to limit network management overhead • Access security through use of passwords. Two levels of passwords allow monitoring and display only (user) or monitoring, display and configuration of the devices (supervisor). MegaVision-WEB additionally contains the following features: • • • • WEB-GUI interface. All the MegaVision screens may be accessed remotely via WEB from ANY platform including UNIX/LINUX and HP OV NNM UNIX. (The local GUI interface is still there). Configurable E-mail Notification (through e-mail it can go to pagers, etc.); Devices are being polled and receive traps, even if they belong to CLOSED MAP. This feature basically takes out the limitation of the network size. Services Monitor: possibility to monitor performance of mission-critical Layer-7 network services, such as e-mail, FTP, e-commerce (http) etc. Collecting history in log files is available. Helps carriers (service providers) to track the SLAs (Service Level Agreements) and can be used to discover the need for QoS (Quality of Services) configuration. MegaVision is designed with the network manager in mind. By using built-in tools for monitoring up-to-the minute information and statistics, and reconfiguring the system as network requirements grow and evolve, you can maintain a network that operates at peak performance—maximum throughput, network stability, and minimal downtime. Quick Start 1. Always reboot MS-Windows before installing MegaVision-WEB. Make sure that no other MegaVision version is running. 2. Install MegaVision-WEB by running "…/DISK1/setup.exe" from MegaVision-WEB CD or Installation Kit via "Start"/"Run" function of MS Windows. Follow instructions on the screen. This is a standard MS Windows installation. 3. After installation is completed start MegaVision via "Start"/"Programs"/"MegaVision WEB"/"MegaVision WEB" menu item of MS Windows. The "Login" Screen will appear. Choose SUPERVISOR and press OK with NO password. 4. Because it is your first time start, the "License Password" request screen will appear. You need to enter your license password in order to continue. This password is connected to the IP Address of the PC running MegaVision-WEB. You can obtain your password via e-mail from "[email protected]". Your e-mail request for password must include the IP Address and MegaVision Serial Number (found on the package). 5. Use MegaVision Main Menu "Map"/"Autodiscovery" or "Edit"/"Add" functions to add devices icons to the MegaVision map. The device icons colors mean: a. Green (OK): the device communication status is OK. b. Red (Critical): there is no communication with the device. c. Gray (Unknown): the device communication status is unknown. d. Yellow (Warning): there are some warnings about this device in the alarms log. e. Purple (Info): there are some info messages about this device in the alarms log. Double-click on the device icon. The Device Main window appears. It usually represents the device front panel with real-time status LEDs. Ports that are grayedout are inactive. Click on the Company/device logo symbol to enter the System management subtree. Click on a port to enter the Port Management subtree. The Main window menu or the Device Main window menu provides shortcuts to other windows. If you need more information, use the ON-LINE HELP or the windowspecific HELP. 6. Use "Edit"/"Add Link”,” Map"/"Set Background Image”, "Edit"/"Add Device"(SUBMAP) to create links, submaps and get the realistic view of your network. 7. Use "Internet Options"/"E-mail configuration" and "Options"/"Alarms Configuration" to configure alarms and e-mail notifications. Use "Monitor/Services Monitor" to monitor mission-critical network services, such as e-mail, FTP, e-commerce, etc. 8. In order to get access via WEB you must leave your MegaVision-WEB running all the time. You may reconfigure the HTTP port value via "Internet options"/"Set HTTP Port" (by default this port is 80 but you may need to configure another value if you have another WEB-server application (like Microsoft Internet Information Server) running on the same PC.) 9. You may use the WEB-Console from any computer, which is connected to the Internet/Intranet. Start the WEB-browser and point it to the following URL: a. If you did not reconfigure the HTTP port value (it is 80 by default) enter: "http://a.b.c.d/" b. If you reconfigured the HTTP port value (e.g. port=2000) enter: "http://a.b.c.d:2000/" (where a.b.c.d is the IP Address of the PC running MegaVision WEB, e.g.: 192.168.1.97) Your WEB-browser will show the "Remote Console" Login/Password Screen. Please, note the "password" is the same "password" which is used in the MegaVision-WEB Login screen. By default, after installation the supervisor's password is Empty String, so you may just press the "Login" button. 10. IMPORTANT TROBLESHOOTING INFO!!! If you are running Netscape, you do not need any additional configuration. However, Microsoft Internet Explorer may give you the following error: "Error: Security Exception while creating Server socket" If you receive such error, please do the following configuration steps: a. From the Internet Explorer main menu enter to the "Tools"/"Internet Options"/"Security" screen. b. Click on the "Trusted Sites" image. c. Click on "Sites..." button. The "Trusted Sites" Screen will appear. Add the following address to your trusted sites: "http://a.b.c.d" (where a.b.c.d is the IP address of the computer running MegaVision-WEB. Do not forget to uncheck the check box: "Require server verification (https:) for all sites in this zone" (Otherwise, Internet Explorer will not allow to add the above address to the trusted sites lists). Click "OK" to close the "Trusted Sites" screen. d. Click on the "Custom Level..." button in the "Internet Options"/"Security" screen. The "Security Settings" screen will appear. Scroll in the screen to find "Microsoft VM/Java Permissions/Custom" check box and check it. Click on the "Java Custom Setting..." button in the same screen. The "Trusted Sites" Permissions screen will appear. Click on "Edit Permissions" bar and scroll in the screen to ENABLE (check) ALL THE OPTIONS you see there. Please, note that you do not compromise the security, because all the changes are done ONLY for the trusted sites zone Confirm your changes by pressing the "Apply"/"OK" button in all the screens. e. Close the Internet Explorer and enter it again. You should not see this error any more. 11. IMPORTANT TROBLESHOOTING INFO!!! If you do not succeed to see any independent window (only HTML-based screens inside your WEB-browser main window) it may mean that your WEB-browser does not support Java. For example, Internet Explorer/Netscape could be installed without Java option. In that case you should reinstall your WEB-browser and make sure that Java option is enabled. 12. Tip: while working with remote console via WEB browser there maybe physical network problems or too slow Internet connection which can lead to the session canceling because of timeouts. User is required to enter his password again to be connected to the server and continue the work (security reasons). All the previous session windows may stay on the screen, though they are not usable any more. In that case it is recommended to close WEB browser and enter it again BEFORE entering a new session. This will automatically close all the previous session windows. (If you prefer not to close the browser, you can still close the old session windows "one by one" using double-click on the windows upper left corner, however, please note that the window will be closed only after three consecutive double-clicks) 13. Some known problems. a. It is strongly recommended NOT TO INSTALL MegaVision-WEB on the DRIVES, which belong to remote network computers. The issue is connected to selecting MegaVision-WEB root directory. This may crash MegaVision WEB server. b. It is strongly recommended NOT TO USE long directory names like "Program Files” as a root MegaVision directory. The issue is connected to selecting MegaVision-WEB root directory. This may crash MegaVision WEB server. c. It is strongly recommended NOT TO USE SLOW computers as a WEBremote console (see MegaVision WEB platform requirements below). This may lead to slow GUI and regular sessions canceling because of timeouts. Using MegaVision as a plug-in application for standard NMS platforms. Working under HP OV NNM UNIX MegaVision-WEB GUI can be accessed from any standard NMS platform. Please, review the following notes for HP OV NNM UNIX as an example how to organize such interface. HP OV NNM Versions 5.x and higher allow to call WEB browser for any device icon, which is located on the HP OV NNM Map. This feature may be used to provide seamless GUI access to all managed devices. Here are the steps you should perform. a) Use HP OV NNM "Edit"/"Find"/"Object by Attribute"/"IP Address" to find the PC which is running MegaVision-WEB (IP address" "a.b.c.d"). (Note: If you cannot find such icon, you must create it manually via "Edit"/"Add Object"). b) Use "Right Mouse Button click"/"Object Properties" to open HP OV NNM "Object Properties" Window. Select "General Attributes" and make sure that "isHTTPsupported" and "isHTTPmanaged" properties are enabled. Enter the "ManagementURL" like this: b1. If you did not reconfigure the HTTP port value (it is 80 by default) enter: "http://a.b.c.d/”; b2. If you reconfigured the HTTP port value (e.g. port=2000) enter: "http://a.b.c.d:2000/" c) Use "Tools"/"WEB browser"/"Management Page" in order to get GUI access to all supported devices. You may leave the browser window open and switch to it whenever you need it. Please note that polling is done automatically and you will always see the most recent status in this window. d) Optional. You may perform step b. for any supported device located on the HP OV map. In this case you can receive MegaVision-WEB GUI without looking for the MegaVision-WEB PC Icon first. MegaVision-WEB platform requirements 1. Server Platform Minimum Configuration. Pentium PC 450 MHz, 19" Monitor 64 MB Memory (128 MB recommended) 40 MB available hard disk space. OS: Win95/Win98/WinNT/Win2000 (WinNT recommended) 2. Client Platform Minimum Configuration. CPU NOT LESS than 440 MHz (example: SPARCstation ULTRA 10-440Mhz CPU, or Pentium PC 450 MHz), Important Note: anything less will result a slow GUI) Memory: 512 MB for UNIX workstations or 64 MB for PC, 19" monitor. Standard Hard DRIVE according to OS requirements. Any OS: MS-Windows/Solaris/HP UX/AIX/Linux etc. Java enabled WEB browser (like Internet Explorer 4.0 and higher or Netscape 4.0 and higher. For MS-Windows Internet explorer is recommended. For UNIX/LINUX Netscape is recommended Note: a) You can download Netscape for free from http://home.netscape.com/download/index.html b) You can download Internet Explorer for free from the Microsoft web site. Logging In When you start MegaVision, you can log in as user or supervisor. As a user, you can view network configuration and device status, but you cannot make any changes in the network. As a supervisor, you can view network configuration and device status, and change configurations and parameters of network devices. If you are operating multiple NMS managers in a network, it is recommended that only one manager have supervisor privileges to avoid conflicts between network changes made from multiple NMS supervisor consoles. However, there is no automatic limitation for this configuration. Login modes are selected in the Login window when you load the application. To Login as a Supervisor The following directions describe how to log in the first time you enter MegaVision. After this initial login procedure, you can set up passwords for USER or SUPERVISOR modes, or set up the Password window to bypass the Login window. At this point the Login window should already be on the screen. If so, proceed to step 2. 1. Select Login from the Options menu. The Login window appears. 2. In the Login window, choose SUPERVISOR to enter the system in SUPERVISOR mode. Figure 1. Login Window 3. Choose OK. If you choose Cancel, MegaVision software is not loaded. MegaVision allows the network manager to switch between SUPERVISOR and USER modes while the program is running. To change modes, select Login from the Options menu, change modes, then choose OK. If you choose Cancel, the Login window closes and no changes are made. You can bypass the startup Login window and start MegaVision without operator intervention, in either USER or SUPERVISOR mode by setting up the Password window as described in the “Using Passwords” section in this chapter. To Login as a User The following directions describe how to login for the first time you enter MegaVision as USER. After this initial login procedure, you can set up a new password for USER mode, or set up the Password window to bypass the Login window. At this point the Login window should already be on the screen. If so, proceed to step 2. 1. 2. 3. 4. Select Login from the Options menu. The Login window opens. Choose USER to enter the system in USER mode. Type the default password in the Enter Password field. (Default is USER.) Choose OK. If you choose Cancel, MegaVision software is not loaded. You can bypass the startup Login window and start MegaVision without operator intervention, in either USER or SUPERVISOR mode by setting up the Password window as described in the “Using Passwords” section. Using Passwords In its default configuration, MegaVision requires a password to login. You can also set up the Password window to start the program without a password.. To Change Password Settings As A User Or Supervisor 1. From the Options menu, choose Password. The Password dialog box opens. Figure 2. Password Window 2. Enter your correct Old password. Note: If you are logging in as a supervisor for the first time, press Tab in the Old Password field. If you are logging in as a user, enter the default password (default is USER). 3. Enter your new password in the New password field. 4. Enter your new password in the Verify Password field for confirmation. 5. To bypass the Login window at startup, uncheck the Password Required check box. 6. Choose OK to accept the changes and exit the Password window. Choose Cancel to close the window without performing any changes. Main Window The MegaVision main window is the major gateway to all monitoring and control functions of devices on your network. The main window contains the map/submap - the graphical representation of your network. Each device that has been correctly added to the map appears as an icon with its device name. Double-clicking an icon opens the Device main window, which presents a graphical depiction of the device’s front panel. (See “About the Device Main Window” below.) Choosing an icon makes that device the “current device”. Additional commands are available through cascading menus of the menu bar, or by using the shortcut icons under the menu items. Note, that you may move devices icons on the map with your mouse by “dragging” them into the desired location. Figure 3. Main Window Shortcut Icons Thirteen shortcut icons appear under the menu bar. From left to right, their functions are: 1. 2. 3. 4. Add a device. Delete the current device. Add a link. Delete the current link. 5. 6. 7. 8. 9. 10. 11. 12. 13. Copy the selected device to buffer (for later paste) Cut: copy and remove the selected device from the map. Paste previously cut/copied device. Open the Describe window for the selected device. Open the SNMP Device Identify window for the selected device. Open the ARP Table for the selected device. Open the Alias Manager window for the selected device. Open the Alarms Log window. Open MegaVision’s help file. Refer to the relevant sections of this manual for more information on these functions. Note: If you leave the pointer over an icon, its function appears in a highlighted box. Main Window Notes • Generic SNMP/TCPIP device types allow you to manage any SNMP/TCPIP compliant device – see “Generic Devices” section for more information. • Current devices are highlighted and tiled. • As a shortcut, you can right-click on a device to open the device specific menu window. • Current link is highlighted. Double-click on any link name to open the Link Describe window. See later for more information on links. • You can drug and drop any device icon into a submap icon. Double-click on a submap icon to open the corresponding submap. (e.g. see “Paris” icon on Figure 3.) • If a device is colored gray, MegaVision does not have any information about it (it is currently being polled). Devices are gray immediately after MegaVision is loaded, or just after you have added it to the map. After the device has been polled, one of the color states is assigned to it. Device colors Legend: a. Green (OK): the device communication status is OK. b. Red (Critical): there is no communication with the device. c. Gray (Unknown): the device communication status is unknown. d. Yellow (Warning): there are some warnings about this device in the alarms log. e. Purple (Info): there are some info messages about this device in the alarms log. Adding Background Images You may add a background image to the main map by selecting Select Background Image from the Map menu item. Some bitmaps are included with MegaVision, or you may specify your own bitmap (only the .bmp format is supported). Use Images editing programs (like MS Windows “Paint”) to create/edit bitmaps. Figure 4. Set Background Image • • • • If you have a background, but no longer want it, select the Set No Image radio button. To select a background image, select the Set Image Bmp button, then click Select BMP File. MegaVision prompts you for a .bmp file. Click on Close to save changes. Device Main Window Each device on the MegaVision map has a main window that displays the front panel of that device. From this panel you can quickly monitor the device’s operations in real time. LEDs on the port image buttons indicate activity, collisions, and flow control for each port on the device. In addition to monitoring information, the Device main window provides you with access to sets of Control Windows that contain additional configuration and performance information. These sub-windows also allow you to control and change parameters of the device. In this manual the front panel of the Optical Access OptiSwitch 800R is used as an example. If you have other supported devices installed on your network, the front panel display will vary. Figure 5. Device Main Window Please review the following notes for Figure 5. 1. SNMP Communication status icon. Indicates whether there is communication with the device. Blue/Green color icon means that the communication status is OK. Red color icon means that there is no SNMP communication with the device (the device is probably down: in that case the high level device icon on the MegaVision map is red as well) 2. MegaVision will automatically show the correct type of modules installed in the device. 3. Use the menu bar to access additional sets of Control Windows for this device. 4. Click on the Company Logo symbol to access the general Device System information Window. 5. The port images color show the current port status (green means that the Link Status of the port is on; black means that the Link Status is off; red means that the port is in disabled state. Click on the port image to open Port Configuration window. 6. Click on the RS-232 port image to open a telnet session with this device. (RS-232 interface is used to connect to a terminal for initial setup of SNMP agent or for nongraphical, command-line style control and management of the device. You can also configure the RS-232 interface as a direct SLIP connection to the Network Management) Control Windows The Device Main Window provides access to a set of Control Windows, through which the Network Manager can perform remote control operations on the managed devices, change the device parameters. Although control windows come in a variety of layouts and perform different functions, most have a common set of features as can be seen in the following Port Configuration window. Figure 6. Control Window MPORTANT NOTE: Control Windows generally have OK, CANCEL and HELP buttons. 1. Clicking on the CANCEL button will close the window without sending any changes to the device. 2. Clicking on the OK button will send changes (if any) to the device and close the window if the device accepted the changes, otherwise there will be an error message. No changes will be sent to a managed device until user presses the OK button. 3. Clicking on the HELP button opens the help description. Sometimes you can receive help description by right mouse clicking on the desired item. When you see an item with a letter underlined, you can use a keyboard shortcut instead of the mouse to select the item. Press the alt key and the underlined letter. Graphics Support You can graphically view counters data as speedometer, line, or bar graphs. These alternate views of data make it easier to analyze and compare statistics at a glance. A tiling option allows you to neatly line up several graphic windows on the screen. Statistics in any window that contains the Graphics image can be viewed as a graph. The Ports button will open a graph window, which allows seeing graphs for all the counters per selected port. The Cnts button will open a graph window, which allows seeing graphs for all the ports per selected counter. Figure 7. Graphics Image. Figure 8 is an example of a window with graph support. Whenever you encounter a window with graphic support elements, counter data can be viewed as a speedometer, line or bars graph. Figure 8. Graphic Support Elements in a typical graph Window Speedometers This type of display shows the instantaneous value of a selected counter in a speedometerlike window. The window contains a moving indicator, the counter category, and the current value. This view is most helpful during situations such as excessive collisions, where you need to adjust system parameters to improve traffic flow. Click on the Spdm check box next to a desired counter to open a Speedometer graph for this counter. Figure 9. Speedometer. The Optn button opens the Speedometer Options dialog box. These options allow you to reconfigure the speedometer. The band between the Critical value and the Max value changes to red on speedometer. Figure 10. Speedometer Options Line Graphs The line graph feature provides a wide variety of options for monitoring and comparing data. In its simplest form, one graph for each counter is displayed in separate windows showing current activity. When you open a line graph window, the selected counter’s activity is dynamically recorded in one polling interval increments on the graph. Line graphs are especially useful for highlighting trends. Click the Line check box for the counter you wish to view. A line graph for the counter displays. Figure 11a illustrates the Input Bytes activity for port 2. Figure 11a. Line Graph. For more sophisticated analysis and comparison, multiple line graphs — up to 16 linear graphs— can be included in a single window. You can view statistics in many configurations: • • • same counter for different ports (figure 7, Cnts button); different counters for a single port (figure 7, Ports button); different counters for different ports (figure 8, Change the port value); To view another counter in the same window click the Line check box for that counter. To view another counter in another window, choose New windows in the Add Graphs As section, then click the Line check box for that counter. A line graph for the counter displays in a new window. Figure 11b. Multiple Line Graphs. For some statistic-to-graph conversions, you will need to use the multiply coefficients to properly scale graph lines, especially when you use two counter categories, where values might have large differences. By entering a multiply coefficient for a counter, its current graph value is multiplied by the coefficient. This allows you to view several counters that have different dimensions in one graph window, for example, Received Bytes and Transmitted Packets. Buttons located below the graph (Figure 11a) allow you to obtain further information and provide options for additional window configuration. Stop - Halts recording of statistics on a graph. To resume drawing, click on the button again. Help - Provides a brief description of graphics support features. Options - Opens the Graph Options dialog box. Please, note that these options allow you to reconfigure the Lines graph window parameters and polling interval for the parent window (see figure 8.) Figure 12. Graph Options Dialog. 1. Polling Interval Changes the value for the Lines graph main window and its parent (see figure 8.) 2. Min Y, Max Y, Min t, Max t Changes the scaling ranges for the Y-axis and X (t) axis. If you check Automatic Change of Ranges, changes are made automatically. NOTE: For graphs, where the X-axis indicates time, the X check box should be always checked. Sometimes it is better to turn off the Y check box, especially when graphs have peaks. 3. Show in the graph Change these values to correspond to the type of statistic a graph contains. For example, Absolute Value (number of packets), Relative to X (packets/second), Value in percents (same function as Absolute Value, but data ranges from 0 to 100%) Legend - Opens a sub-window that displays the current statistics: category, time elapsed, and value. Category names and port numbers are color-coded corresponding to lines on the graph. Figure 13. Legend Dialog. Grid - Adds a grid to the graph. To delete the grid, click on the button again. Bar Graphs In addition to Line and Speedometer Graphs, MegaVision also supports bar graphs. You can display data from any counter with bars. You can add data from a counter to an existing bar graph (default), or generate a new graph Use bar graphs for comparing the relative amounts of two or more values. The basic rules for configuring bar graphs are the same as for line graphs. Figure 14. Bar Graph. The buttons at the bottom of the window have the same function as those in the line graphs window. Alarms Alarms are activated by status changes in network devices. When MegaVision detects a change in a device, it generates an alarm. A beep is sounded and the alarm is recorded in the Alarm Log, indicating the date and time, the device in which it occurred, the severity, and a short description of the reason for the alarm. An alarm is also reflected in the device icon— the icon color changes according to the severity of the alarm. Alarms have four severity levels, each represented by a different color: Critical, Warning, Normal, and Informational. Please note that a lot of alarms are actually generated by SNMP Traps, which are sent by different network devices. Alarm Notifications In addition to an audible sound notifying you of an alarm condition, the color of a device icon corresponds to the latest alarm with the highest severity. When an event received cancels any previously received alarm, and the color of the icon is updated to reflect the new status of the device. Alarm Severity Informational Normal Critical Unknown Color Purple Green Red Gray Alarm notifications may be received via e-Mail as well (see below). Viewing the Alarm Messages Choose the Monitor/Alarm Log item from the Main Window menu. The Alarm Log window opens. Figure 15. Alarm Log Window. Alarms Configuration Window You can change the severity level of any situation that calls for an alarm. You can choose to record or not record an alarm in the Alarm Log. You can also choose to receive e-mail notifications about some alarms. To open the Alarms Configuration window for the selected device click on the Alarms Configuration from the main window menu Options item. This window can be also accessed from the device specific functions menu by right mouse click. Figure 16. Alarms Configuration Window. An alarm is added to the Alarms Log if the Log = Yes for that alarm. Set the Log combo-box to Yes/No for enabling/disabling logging of the alarm in the Alarm Log. Set the severity for each alarm by selecting the respective combo-box value. NOTE: Alarm severities are not updated on alarms received prior to an alarm configuration. Only alarms received after the configuration will adhere to the new settings. Please note that when the Generic radio button is selected the configuration changes apply to all MegaVision devices. In order to see/configure specific alarms for the current device type (if any) select the Specific radio button. Use the Send E-Mail check box to receive e-mail notifications for the selected alarm. Note, that you must also configure your e-mail properties via Internet Options/E-Mail Configuration main menu item. This will open E-Mail Configuration window: Figure 17. E-mail Configuration window. After setting the necessary E-mail Configuration parameters you may send the control Email in order to make sure that e-mal notification works. Click on the Send E-mail button to open Send E-mail window. Figure 18. Send E-mail window. Clicking the OK button will send the message. Please note that this feature may be also useful if you want to send a brief e-mail message to somebody and the access to the Send Email window is provided via MegaVision-WEB remote GUI interface. Figure 19. Remote MegaVision-WEB GUI interface. SNMP Management Information Base (MIB) Browser MegaVision provides an SNMP MIB browser. From the Main Window menu Control item, select MIBView. You can carry out any SNMP operation on the value of an object from any MIB listed in the MIB files list. Select a device from the Devices list and a MIB from the MIB files list. The MIB Objects list box displays a list of the MIB entries of the current MIB, together with Free Objects entries, which contain non-indexed variables. The name and value of the selected MIB Object are displayed in editable text and value boxes. You traverse through the MIB tree by clicking on the desired entries. Figure 20. MIBView Window MIBView enables the user to Get the value of any object from any one of the MIBs that are listed in the mibs.all file (located in the application’s root directory). The MIB variable is displayed either as a text in the edit box, or as a value in a combo-box (if it is enumerated in the MIB). Users can also use the Next button to perform SNMP Get-Next operation or the Set button to change the value of an object. The name of the current device is displayed and can be set via the upper combo-box. Users can select MIB from the “MIB files” list box. There are some other buttons, which help the MIB browsing process. Click on the Monitor button to poll selected MIB-variable every 1 sec. Click on the Stop button to stop polling (monitoring). Click on the GetEntry button to get the whole SNMP TABLE ENTRY (the entry index must be entered first). Add, Remove, Change, and Compile buttons are used to add new MIBs to the MibView window. It is recommended to place the MIB file in the application’s MIBS directory. Important: There is no guarantee that new MIBs will be compiled properly. That is why those users, who want to use this feature, must have ability to analyze the output errors and understand ASN1 language. Please, note also, that usually there is no need to add new MIBs, because a lot of standard and private MIBs are already included by default. Interfaces Monitoring MegaVision provides extensive monitoring performance of any SNMP devices interfaces, whether they belong to the supported set of devices or not. Interfaces monitoring may be accessed through the Monitor menu item on the main menu bar. The various options will be described below. Interfaces Table Window Enter this window via Monitor/Interfaces Table in the main menu bar or by clicking the Interfaces Table button in the Identify Window. The Interfaces Table window displays information about a device’s interfaces. It based on the information from the ifTab (RFC1213, MIB-II). Any SNMP-compliant device must support Interfaces Table. Figure 21. Interfaces Table. Below is a list of information presented in the Interfaces Table, regardless of the interface type: • • • • • Interface Number – number of interface (corresponds to ifIndex from MIB-2) Interface Description - a textual string containing information about the interface. Interface Type - the type of interface, distinguished according to the physical/link protocol(s) immediately ‘'below' the network layer in the protocol stack. Interface Speed - an interface's current bandwidth in bits per second. For interfaces, which do not vary in bandwidth, or for those where no accurate estimation can be made, this object should contain the nominal bandwidth. MAC Address - the interface's address at the protocol layer immediately ‘below’ the network layer in the protocol stack. For interfaces, which do not have such an address (e.g., a serial line), this object should contain an octet string of zero length. If the address does not have an alias, then the raw address will be displayed. Otherwise, the current alias name will be displayed. The user may add/edit aliases via the ARP Add/Edit window, Alias Manager Window, or other windows, which allow aliases editing. • Operational Status of the Interface (up/down/testing) – the current operational state of the interface. The testing state indicates that no operational packets can be passed. Double click on the desired interface line or click on the Statistics and Graphs per Interface button to open Interfaces Statistics (per interface) window (described immediately after this section, figure 22.) This action will display performance information about this particular interface. Press on the Statistics and Graphs per Counter button to open Interfaces Statistics (per counter), window (described after Interface Statistics window, figure 23.). This action will display performance information about all the interfaces on this particular device The Utilization button brings up a graph window representing the interfaces utilization. This window is described later in this section (figure 24.) Interfaces Statistics (per Interface) Window This window shows the interface statistics counters for the selected interface. Enter this window via the Statistics and Graphs per Interface button in the Interfaces Table Window. By default the interfaces numbers next to all the counters correspond to the selected interface, but you may change them. The counters are updated in real time, based on the polling interval. You can use the standard Graphics Support for the windows counters .You can select various counters per interface to display graphically via the check boxes. If you want to graph data from another interface, use the Intf# fields to select the desired interface number. Figure 22. Interfaces Statistics (per interface) window The information is based on the ifTab (RFC1213, MIB-II). The counters are described there as follows: • Input Bytes - the total number of octets received on the interface, including framing characters. • Input Unicast Packets - the number of subnetwork-unicast packets delivered to a higher-layer protocol. • Input Non-Unicast Packets - the number of non-unicast (i.e., subnetworkbroadcast or subnetwork-multicast) packets delivered to a higher-layer protocol. • Input Discarded Packets - the total number of inbound packets which were chosen to be discarded even though no errors had been detected to prevent their being deliverable to a higher-layer protocol. One possible reason for discarding such a packet is to free up buffer space. • Input Error Packets - the number of inbound packets that contained errors preventing them from being deliverable to a higher-layer protocol. • Input Unknown Protocol Packets - the number of packets received via the interface, which were discarded because of an unknown or unsupported protocol. • Output Bytes - the total number of octets transmitted out of the interface, including framing characters. • Output Unicast Packets - the total number of packets that higher-level protocols requested be transmitted to a subnetwork-unicast address, including those that were discarded or not sent. • Output Non-Unicast Packets - the total number of packets that higher-level protocols requested be transmitted to a non-unicast (i.e., a subnetwork-broadcast or subnetwork-multicast) address, including those that were discarded or not sent. • Output Discarded Packets - the number of outbound packets, which were chosen to be discarded even though no errors had been detected to prevent their being transmitted. One possible reason for discarding such a packet could be to free up buffer space. • Output Error Packets - the number of outbound packets that could not be transmitted because of errors. • Output Queue Length - the length of the output packet queue (in packets). Statistics and Graphs per Counter (Interfaces Statistics per Counter) Window This window shows the interfaces statistics counters for the selected counter. Enter this window via the Statistics and Graphs per counter button in the Interfaces Table or Identify windows, or through the Main Window Menu. You may select the desired counter via the check box. The counters are updated each polling interval. “Graphics Support” section describes the different types of graphs and explains using the graphics support. The information presented in the window is based on the ifTab (RFC1213 , MIB-II) and is described in the Interfaces Statistics (per interface) Window section. Figure 23. Statistics and Graphs per Counter window Interfaces Utilization Window. You may enter this window from: 1. The Main Menu Bar (under Monitor) 2. The Utilization button in the Interfaces Table window 3. From the device window menu bar of certain devices. Figure 24. Interfaces Utilization window The buttons at the bottom of the graphs have the same function as those in the line graphs window. This window shows the interface’s utilization in percent (right bar graphs) and the interface’s errors per second (left trend graph). The information is based on device Interface Table (ifTable from MIB-II, RFC1213). You can use the standard Graphics Support for this window (described in the “Graphics Support” section). RMON Support MegaVision supports RMON Groups 1,2,3,9 for any RMON-capable device, which supports the same groups via SNMP. RMON Group 1 Statistics Window You can enter this window from: 1. The Main Window Menu Bar (under Monitor: RMON Group 1 Statistics) 2. From the device window menu bar of certain devices. Figure 29. RMON Group 1 Window. • • • • • The selected device is displayed in the Device Name field, but you can select any device on the map via the pull-down menu. Click the Intfs and Cnts buttons to open the RMON Group 1 Statistics per Interface and Counters Graphs per Counter windows. The Segments Errors/Sec and Utilization % windows are updated every polling interval. You can delete unwanted interfaces with the Delete button in the Control Table Entries section. The buttons at the bottom of the graphs have the same function as those in the line graphs window. • This window shows the Control Table in the upper left corner. The table presents control entries for RMON Group 1. Each entry corresponds to one of the device’s interfaces. Usually this table contains entries for all of the interfaces on the monitored device. If this table is empty it may be due to one of the following: RMON Group 1 is not supported for this device or RMON Group 1 is supported but there are no control entries: You can create an entry for any interface by clicking on the Create button. The Add RMON Group 1 window opens. You are required to enter the desired interface number , if this operation fails it probably means that RMON • Note the Segments utilization in percents (right bars graph) and segments errors per second (left trend graph). The information is based on RMON Group 1 (Ethernet Statistics). In order to be presented in the graphs the segment (interface) must have the corresponding Control Entry (see Control Table above, it is usually presented there by default). You may change polling interval by clicking the Optn button on any of the graphs. You may change X and Y axes intervals for Errors graph by clicking the Optn button on the left graph. You can use the standard Graphics Support for this window – see the Graphics Support section. Group 1 is not fully supported for this device • You may view more detailed graphs for all RMON Group 1 Counters by pressing the Intfs button (Statistics per Interface graphs) or Cnts button (Statistics per Counter graphs). RMON Group 2 (History) Window You can enter this window from 1. The Main Window Menu Bar (Monitor: RMON Group 2) 2. From the device window menu bar for certain devices. Figure 30. RMON Group 2 Window. Information presented in the window includes: The History Control Table. This table presents control entries for RMON Group 2 (History). Each interface may have several corresponding entries in this table (the default is two entries per interface, with long and short reporting intervals). The table usually contains entries for all the device interfaces, but it may also be empty. If the table is empty, it is due to one of the following reasons: • RMON Group 2 is not supported on this device. • RMON Group 2 is supported but there are no control entries. You can create a control entry by clicking the Create button. The "Add RMON Group 2” Window opens. Figure 31. Add RMON Group 2 Control Entry Window. You are required to enter some information, which describes how to collect statistics for reporting: 1. The desired Interface Number. 2. The Owner String to identify the entry owner (not required); 3. Number of Buckets: the requested number of discrete time intervals over which data will be collected. It is actually the number of samples. Values greater than 50 are not recommended. When the number of buckets reaches its maximum value, the oldest bucket is deleted and a new bucket added. 4. Interval: the time period in seconds over which the data is sampled for each bucket. This interval can be set to any number between 1 and 3600 (1 hour). Press OK in the Add RMON Group 2 Window. If the Create operation fails, it may mean that RMON Group 2 is not supported on this device. You may use the Delete button in the RMON Group 2 Window (Figure 30) in order to delete the undesired control entry. The History Table contains history information for one interface. This information corresponds to the currently selected control entry in the History Control Table (see above). In order to change an entry (interface), click on the desired entry in the History Control Table. After data retrieving, the History Table fills with the corresponding information. Every History Table line corresponds to one sample (bucket) and includes the following information: 1. Time: The start time of the interval over which the sample was measured. 2. Octets: The total number of octets received by the interface during the specified interval. 3. Packets: The total number of packets received by the interface during the specified interval. 4. Utilization: The interface utilization, in percents. 5. Errors: The total number of error packets received by the interface during the specified interval. When you open RMON Group 2 Window or select any History Control Table Entry, two Trend Graph Windows open (in addition to the main window) to reflect the History Table Information graphically: • • Interface Errors per interval (right window). Interface Utilization per interval in % (left window). While in the RMON Group 2 Window, you may jump to any other device without selecting it in the main map via the Device Name box (in the bottom right corner of Figure 30). RMON Groups 3 & 9 (Alarms and Events) You can enter this window from: 1. The Main Menu Bar (Monitor: RMON Groups 3:9...) 2. The Device Window Menu bar for certain devices. Figure 32. RMON Groups 3,9 Window Alarms control Table Alarms Control Table lists the control entries for RMON Group 3 (Alarms). Every entry contains threshold information, which describes an alarm that should be generated when a pre-set threshold is exceeded. This table may contain entries for several of the device’s interfaces, but may be empty as well (this is the default ). If this table is empty, it is due to one of the following reasons: • RMON Group 3 is not supported on this device. • RMON Group 3 is supported but there are no control threshold entries. You can create a threshold entry for any interface by clicking on the Create button. The Add RMON Group 3 window opens. Figure 33. Add RMON Group 3 Window You are required to enter some information describing the threshold information: • Interface Index (or index of the selected MIB variable). • Reporting Interval: In seconds, e.g.: 10 sec or 1 sec. • What to monitor: You can select one of the predefined IfTable (MIB-II) counters, e.g.: InErrors (Input Errors) or any MIB variable. You may also refer to “Interfaces Statistics (per interface)” section earlier for more information on MIB-2 counters. • Sample Type: Select the method of sampling: Absolute means that the threshold will be applied to the counter’s absolute value. Delta means that the threshold will be applied to the counter changes during the sampling interval. • Rising Threshold: A single event will be generated after the sampled value exceeds this threshold. The next Rising event alarm will be generated only after the threshold for a Falling Event (see below) has been reached. • Falling Threshold: A single event will be generated after the sampled value falls below this threshold. The next Falling event will be generated only after the threshold for a Rising Event (see above) has been reached. • Rising Event Index: The Index from the Events Table (see below) which corresponds to Rising Event. • Falling Event Index: The Index from the Events Table (see below), which corresponds to Falling Event. • Start Up: The start-up alarm, i.e., conditions for an alarm to be sent as a result of the first sample. You may select from: Rising, Falling, or RisingOrFalling. • Owner String: String to Identify the entry owner (usually not required). Press OK in the Add RMON Group 3 window (Figure 32) in order to add the new event description (new Alarm Control Entry). If the Create operation fails, it may mean that RMON Group 3 is not supported for this device. IMPORTANT: In order to create an Alarm Control Entry, you must have at least one Event in the Events Table (see below). Without one, you will not be able to enter a Rising Event Index and a Falling Event Index. Click on the Delete button (Figure 32) in order to delete the selected Alarm Control Entry. Events Table The Events Table entries contain descriptive information for all the events, which are "triggered" by current network conditions according to the Alarms Control Table. If this table is empty it may be due to one of the following reasons: • RMON Group 9 is not supported on this device. • RMON Group 9 is supported but there are no event entries. You can create an event entry by clicking on the Create button. The Add Event (RMON Group 9) window opens. Figure 34. Add Event (RMON Group 9) Window You must enter some information, which describes the event: • Event Type: Defines the notification that takes place when the event is triggered. You may select from the following: None, Log, SNMP Trap, Log, and Trap. • Event Description • Community: A value for the trap being sent when the event is triggered. Note that all the traps are reflected in the Alarms Log. You may view the Alarms Log by selecting the Monitor: Alarm Log main menu item. • Owner String: A string to identify the entry owner (usually not required). Press OK in the Add Event (RMON Group 9) window. If the Create operation fails, it may mean that RMON Group 9 is not supported on this device. Click on the Delete button (Figure 32) to delete the selected event entry. Every RMON compatible device keeps information about RMON triggered events. In order to view the information click on the Log button. You may change current monitoring device via the Device Name Combo-Box in the right bottom corner (refer to Figure 32). Adding and Deleting Devices. Describe Window. Before you can manage a device, you must first define the device, provide parameters to establish communication, and select an interface. Only the SUPERVISOR may add devices and modify their attributes. Please note that you may add devices either manually or using Autodiscovery function (see the Autodiscovery section later). Adding Devices Manually. MegaVision requires specific parameters to establish communication with a device. You must supply a name and address, specify communication type, enter polling durations, and SNMP community names. In order to add device manually: 1. Select Add from the Main Window menu Edit item. The Devices Types window opens: Figure 35. Devices Types Window 2. Select a desired device type. Choose GENERIC for any unsupported SNMP device. Choose TCPIP for any device, which does not support SNMP. Choose SUMBAP in order to add a new map/submap to the current map. 3. A Describe window for the device opens. Figure 36. Describe Window. 4. In the Name field, type a map name for the device. 5. In the SNMP Community Names section, type a Community Name for GET and a Community Name for SET. (The default values are “public” for Get operations and “private” for Set operations.) 6. Use the Notepad field to note additional comments about the device. 7. The Interfaces list defines all IP interfaces available to the device for communication with the network. The first interface on the list receives the highest priority for establishing communication. If communication cannot be established through that interface, the next interface is tried. You enter interface specifications in the Define Interface Window. 8. To define new interfaces choose Add in the Describe window. You may also modify the existing interface. To do this, select it and press Modify button or double-click on the interface line. The Define Interface Window opens. Figure 37. Define Interface Window. 9. In the IP Address field, enter the IP Address for the interface. Select an interface from the Interface Type list. Choose Ethernet when this interface is connected to the Ethernet LAN. Choose SLIP when the interface is connected to the serial line. Enter values for Polling Interval, Time-Out, and Number of Retries. CAUTION: Set the Polling Interval time with care. Setting it to a high value may cause a slow response to network errors, while setting it to a low value may flood the network with large quantities of management traffic. It is recommended that you use the default value of 10 seconds, however, if you have more than 1000 devices on all the maps, you should probably increase this value. It also depends on the fact how powerful your NMS PC is. 10. Choose OK to add/modify the interface. The Describe window displays with the newly defined interface inserted above the highlighted line. 11. Choose OK in the Describe Window. The icon representing the new device now appears on the map. If communication has been successfully established, the device icon will become green. If communication has not been established, the device icon will become red. After a device has been successfully defined, it is polled at every poll interval to check the communication status. The device’s configuration is automatically learned after initial connection is established. Modifying Device Settings. After a device has been added, you can change set-up parameters or add/modify/delete an interface through the Describe window. Deleting Devices. You can remove a device from a map via Main Window Edit/Delete menu item. You can also select the desired device and press the Del key on your keyboard. Submaps MegaVision allows you to add a submap type icon to any map, easing visualization of your network. Please note that terms “map” and “submap” means the same in this manual. You can add any device type in a submap, including other submaps. To open a submap, doubleclick on its icon. The submap from which it was called is automatically added, enabling you to quickly navigate between maps. You can also jump between different submaps by adding a submap and giving it the name of the map you want to jump to. You can also use the Open Map window to Open/Add/Delete maps. Figure 38. A map with a submap. There are two ways to create a submap. 1. The first way will create a submap and place the submap icon on the map. Select Add from the Main Window menu Edit item. The Devices Types window opens. Choose SUMBAP in order to add a new map/submap to the current map. The Describe Submap Window opens. Enter a submap name in the Name field and click the OK button. Figure 39. Describe Submap Window. 2. The second way will create a submap without placing the submap icon on the map. Select Open Map from the Main Window menu Map item. The Open Map window opens. Click on the New Map button and enter the name in the New Map window. The newly created map opens immediately after you click OK in the New Map window. Note that you may also use the Open Map window to delete maps or open any of the previously created maps. Figure 40. Open Map Window. Cutting, Pasting, Dragging, and Dropping There are several operations, which can make working with submaps easier: cut, paste, and drag & drop. You can also move devices icons on the map with your mouse by “dragging” them into the desired location. You can cut or copy a device from one map and paste it into another. Its attributes will remain the same. You can also drag a device icon over a submap. MegaVision asks you whether you want to move it to that submap, as shown in the following figure. Figure 41. Drop Confirmation Autodiscovery The autodiscovery process allows you to easily add network devices without knowing their IP addresses. MegaVision polls each IP address within the given range and adds devices automatically. To start the autodiscovery process, select Autodiscovery from the Main Window menu Map item. Autodiscovery window opens. Figure 43. Autodiscovery Window Click on the Start Discovery button after entering the desired options. • Discovery Type: You may choose to discover: 1) Only supported SNMP devices. 2) All SNMP devices. Any unknown SNMP device will be added as a “GENERIC” device or “ROUTER”. 3) All SNMP or TCP/IP devices. Any unknown SNMP device will be added as a “GENERIC” device or “ROUTER”. Any TCP/IP device (i.e. device, which does not have SNMP agent) will be added as “TCPIP” device. • Start IP Address: The first IP address that MegaVision will poll. • End IP Address: The last IP address that MegaVision will poll. • Community Name: Enter the SNMP Get community name, if known. Otherwise, use the default value “public”. • Current IP Address: Displays the IP address currently being polled. • Start / Stop Discovery: Press to Start/Stop the Autodiscovery process. The Autodiscovery process continues until you press the Stop Discovery button or when the End IP Address is reached. You must press Add to Map button in order to add all the discovered devices to the map. Links To help you visualize your network configuration, you may add links between devices on the map. Links are added manually. To add a link, select Add Link from the Main Window menu Edit item (pictured below). The current link is highlighted (p3p4 in the figure). To rename an existing link, double-click on it. Both of these actions open the Describe Link window. In this window, you can name the link and select its color and width. When selecting a device name you may type its first letter repeatedly to scroll between all device names starting with that letter. To delete a link, select it (highlight it by clicking on it’s name) and choose Delete Link from the Main Window menu Edit item. You can also use the add/delete shortcut icons to add and delete links from the map. Figure 42. Adding and Describing Link. General Device Information: SNMP Device Identify Window The SNMP Device Identify window provides you with a quick look at basic information about a device — items such as product type, up time, device location, and contact. The information is retrieved via SNMP according to MIB-2 (RFC-1213) specification. You can open the window via Main Window menu Monitor/Identify item. Figure 43. SNMP Device Identify Window Generic SNMP and TCP/IP Devices, Monitoring services Generic SNMP Device. The Generic SNMP Device type allows you to manage any SNMP compliant device. The Generic SNMP Device window opens when you double click on a Generic device icon. This window is similar to the SNMP Device Identify window. Generic SNMP devices may send standard SNMP traps (alarms) and MegaVision is able to receive them. There are two types of Generic SNMP Devices: GENERIC and ROUTER. Double-click on Generic device icon opens Generic SNMP Device main window. Figure 44. GENERIC and ROUTER device icons and GENERIC SNMP Device Main Window TCPIP Device. The TCPIP Device type allows you to monitor any TCP/IP compliant device. It is recommended to use this type when the device does not have SNMP Agent. Figure 45. TCPIP device icon and TCPIP device main window Monitoring Services. MegaVision allows to monitor performance of business-critical Layer 7 network services, such as e-mail, HTTP, FTP, DNS, etc. The services are learned automatically for any device, which is located on the map. The Services Monitor window may be accessed via Main Window menu Monitor/Services Monitor item, or via device specific menu, which pops up by right mouse click on the selected device. Figure 46. Services Monitor Window If any of the discovered services goes down, it becomes red in the Services Monitor window. Also a warning (yellow) alarm comes to the Alarms Log. Also the RESPONSE TIME (given in milliseconds) may be used as a relative performance indicator of the corresponding service. Network manager should be concerned if a service goes down or becomes prohibitively slow – the RESPONSE TIME becomes too big. File “…/data/services.def” in the MegaVision root directory contains information how to see/modify the full list of monitored services. You can use the standard MegaVision Graphics Support (see the Graphics Support section) in order to view the corresponding services performance graphs. You can configure MegaVision to collect the history performance data into a file for later analysis. Click on the Configure Collecting… button to enter the Services Configuration window. Figure 47. Services Configuration Window Set the Report every field to the time interval, which will be used for reporting, and click OK. Note in Figure 47: services performance values are written into the …\data\internal.log (“internal” is a device name) every 10 seconds. This feature helps carriers and service providers to track the SLAs (Service Level Agreements) and can be used to discover the need for QoS (Quality of Services) configuration. Alias Manager MegaVision allows you to assign aliases to MAC addresses, easing identification of network devices and stations. Each network device (a workstation, switch, hub, printer, etc) has it’s own unique 12 hexadecimal digit MAC-Address. This MAC-Address is associated with the network interface, used to connect the device. The first 6 digits denote the device vendor. The user may assign an alias to any complete MAC address or the 6-digit vendor code. The Alias manager includes the 6-digit vendor codes for most vendors. Once an alias defined it will be shown in many MegaVision windows instead of raw MAC-address. Figure 48. Alias Manager window and ARP Table window as an example window with aliases used. If there is only a vendor part of MAC address, MegaVision will append the remaining digits. If there is no corresponding alias entry just the MAC address will be displayed. Please, note that there are some other windows (besides Alias Manager), which allow assigning aliases to MAC Addresses, e.g. Add/Edit ARP Entry window, which is accessible via ARP Table window. TereScope™ Management In order to optimally integrate the TereScope™ Wireless Optical links into complete network solutions, the TereScope™ products are SNMP manageable. Each of the two transceiver units of the wireless optical link is equipped with a separate management 10 Base T interface. Through this interface TereScope™ systems can be managed through Optical Access MegaVision™ SNMP Web Based management software as indicated in the picture. On each managed parameter thresholds can be set and alarms can be logged. The following data can be obtained through the management GUI: General Device parameters: Product Type MAC address UDP port # IP Address Communication mode Gateway address Software version Hardware version Management port type Wirelink port type Managed parameters RSSI Description: Laser Rx Signal Strength Indicator in voltage. Include thresholds for up/down limits and alarms notification with different severity. BIAS Description: System BIAS value. Include thresholds for up/down limits and alarms notification with different severity. Internal Temp Description: Temperature inside the System. Include thresholds for up/down limits and alarms notification with different severity. On/Off Status Wire Link Status Communication status via wire data Port. Air Link Status Communication status via Laser Data Ray. Wire Link Port The type of the Wire Link Data Port. Management Link Status Communication status via the management port. Running MegaVision as a plug-in application for different NMS platforms There some differences between the way MegaVision-WEB and MegaVision Classic work under standard NMS Platforms. MegaVision-WEB uses its Java-based WEB interface to access its GUI from different platforms. Please, note that in order to achieve such integration there should be a PC running MegaVision-WEB server plugged somewhere in the network, which runs 24x7 collecting management data. MegaVision Classic uses native MS-Windows GUI, however the list of supported NMS platforms is limited to: 1) HP OpenView Windows (version 7.1 and higher, including HP OV Professional Suite). 2) Castle Rock SNMPc 4.x or SNMPc NT 5.x. 3) Cabletron SPECTRUM 4.0 rev1 and higher (WinNT 3.51). 4) HP OV NNM (WinNT, Win2000). It is recommended using MegaVision Classic for the above PC NMS platforms. If you need to manage MegaVision supported devices under UNIX based platforms, use MegaVision-WEB. MegaVision-WEB under HP OV NNM UNIX MegaVision-WEB GUI can be accessed from any standard NMS platform. Please, review the following notes for HP OV NNM UNIX as an example how to organize such interface. HP OV NNM Versions 5.x and higher allow to call WEB browser for any device icon, which is located on the HP OV NNM Map. This feature may be used to provide seamless GUI access to all managed devices. Here are the steps you should perform. 1. Use HP OV NNM "Edit"/"Find"/"Object by Attribute"/"IP Address" to find the PC which is running MegaVision-WEB (IP address" "a.b.c.d"). (Note: If you cannot find such icon, you must create it manually via "Edit"/"Add Object"). 2. Use "Right Mouse Button click"/"Object Properties" to open HP OV NNM "Object Properties" Window. Select "General Attributes" and make sure that "isHTTPsupported" and "isHTTPmanaged" properties are enabled. Enter the "ManagementURL" like this: b1. If you did not reconfigure the HTTP port value (it is 80 by default) enter: "http://a.b.c.d/”; b2. If you reconfigured the HTTP port value (e.g. port=2000) enter: "http://a.b.c.d:2000/" 3. Use "Tools"/"WEB browser"/"Management Page" in order to get GUI access to all supported devices. You may leave the browser window open and switch to it whenever you need it. Please note that polling is done automatically and you will always see the most recent status in this window. 4. Optional. You may perform step b. for any supported device located on the HP OV map. In this case you can receive MegaVision-WEB GUI without looking for the MegaVision-WEB PC Icon first. MegaVision Classic under HP OpenView Windows The following directions describe how to install a MegaVision for HP OpenView for MSWindows. Following that are instructions for adding a device, which is necessary before you can access the device with MegaVision. Before you install MegaVision software, you must have MS-Windows and HP OpenView for MS-Windows, version 7.1 or higher (including HP OV Professional Suite) installed on the management station. Under the MS-Windows Program Manager (or File Manager), go to the disk1 folder and run SETUP.EXE from the MegaVision Classic Installation kit. This is a standard MS-Windows installation. Select MegaVision for HP OV option. When the software has completed the installation, select the OpenView group in the Program Manager window and Run the HP OpenView application. MegaVision starts automatically. To define a new device with HP OV 1. Select Add from the HP OV Edit menu. The Add window opens. 2. Select Components in the pull-down menu. Scroll down the icon window until the required device icon appears. Choose the icon representing the device you wish to add. (The cursor changes shape.) 3. Drag and drop the device icon to the HP OpenView map window. The device icon is added to the map and a MegaVision Describe window opens. See “Adding and Deleting Devices, Describe Window” section for additional information. 4. Click OK to return to the HP OpenView main window. A submap with the newly defined device icon displays. The device icon in the submap is colored, according to HP OpenView color codes to reflect the current device status. From this point on, the windows are as described for the MegaVision standalone version, with the exception of the submap window. To open the device main window, double-click on the device icon. 5. For more information on running HP OpenView, refer to the HP OpenView user manuals. IMPORTANT! If you are using HP OV Autodiscovery: After all the devices are discovered and added to the map: 1. Close discovery process. 2. Save the map. ("File->Save" or "File->Save As"); 3. Open the same map again: ("File->Open"); Note that otherwise MegaVision will not get information about newly discovered devices. Double-click on the device will lead to the error message: "Device is not registered" MegaVision Classic under Castle Rock SNMPc Network Manager SNMPc version must be 4.x or SNMPc for Win-NT (5.x). Please note that MegaVision has two different options for SNMPc 4.x and SNMPc NT (5.x). There is some Network Management products, that are based on SNMPc, e.g.: a) Fibronics InterView/Win. b) Intel LANDesk Network Manager. c) Cisco CiscoWorks. If you have SNMPc or one of the products you may use MegaVision for SNMPc to manage all the supported different vendors devices from one platform. SNMPc (or LANDesk or InterView/Win, CiscoWorks) must be installed before MegaVision. After MegaVision installation, it will start automatically when SNMPc starts. Open a new map. Add some devices to the map or do SNMPc Autodiscovery. SNMPc will automatically assign the correct icons to the MegaVision devices. When adding devices manually make sure that the "Icon" field equals "AUTOICON”, “Type" field equals "Agent" and "Exec" field equals "auto.exe". Double-click on the device icon will open MegaVision device main window. IMPORTANT: If you are using SNMPc support for HP OpenView, do not install MegaVision for SNMPc. Use MegaVision for HP OV instead. After MegaVision for HP OV installation, MegaVision will manage all the MegaVision devices. SNMPc will manage all the others. MegaVision Classic under Spectrum 4.0 for Windows NT MegaVision Classic can function as an application for Cabletron Spectrum 4.0 rev. 1 and higher, running on Windows NT 3.51. This section contains important information about running MegaVision and managing supported devices on the Spectrum platform: • Pre-Installation Notes • Installing MegaVision • Running MegaVision • Receiving SNMP traps from MegaVision Devices • Troubleshooting Pre-Installation Notes You must install MegaVision on every Windows NT machine, which is supposed to run SpectroGRAPH. Any Spectrum user planning to use MegaVision must have Full Control permissions to the MegaVision directory tree. Please check that you have enough disk memory. 20MB is required. Verify that Spectrum is correctly installed on your Windows NT machine: 1. Go to the command prompt 2. From the prompt type: echo %SPECROOT% The Spectrum directory path appears. Usually it is “C:\WIN32APP\Spectrum”, but there are possible other values like “c:\progra~1\spectr~1”. Installing MegaVision Classic 1. Reboot your Windows NT machine. 2. Login as Local Administrator. 3. Place the MegaVision install CD in the CD drive. 4.Under the Windows NT Program Manager (or File Manager), go to the MegaVision Classic disk1 folder and run SETUP.EXE. Follow the instructions on the screen. The installation process puts a “MegaVision Close” icon into the Spectrum Program Group. Normally this icon is not used. Use it ONLY if you want to close MegaVision (e.g. to free the memory). Running MegaVision Classic 1. Start SpectroGRAPH. 2. You may use Spectrum Autodiscovery or manually add new supported devices to Spectrum views. Important: When adding manually, please use GnSNMPDev Model Type. Supported switches are represented by “SNMP BRIDGE” images, supported hubs are represented by “SNMP HUB” images. Navigate to the desired view and click on the image which represents any supported device to make the image current. 3. Click on the right mouse button to open the Spectrum Icon Submenu. Find the MegaVision item and select it there. The first time you do this, the “MegaVision Started!” WindowMessage appears. After clicking on OK, the MegaVision Device Window with real-time status LEDs appears. MegaVision automatically recognizes the device type. If the SNMP device is not recognized, the MegaVision Generic SNMP Device Window opens. If you navigate to any other device and select the MegaVision item, the MegaVision Device window opens immediately. This is because MegaVision is already running. Troubleshooting Read this section only if you experience problems with MegaVision running under Spectrum. If You Cannot Find The “MegaVision” Item In The Icon Submenu After MegaVision Installation: 1. Check that the current image represents an SNMP device. The “MegaVision” item should not appear within non-SNMP devices. 2. In the DOS prompt or SpectroSHELL prompt, change your working directory to <SpecDir>\SG-Support\CsIib\GnSNMPDev directory, (<SpecDir> is a Spectrum directory) There are three ASCII files if interest there: Large.Bas, Small.Bas, The.OPR You may view/edit them using any DOS editor or the “vi” editor under SpectroSHELL. These files should contain the following string: Script.Act(0,0,Script(“MegaVision”,0x117a7,0x1006e,0x10024,0x1027f,0x100 71, 0x110c4)) The string should appear in the end of every file before “} ” string. 3. Compare the files to the same files in the MegaVision directory.. If You Have Problems Starting MegaVision From The Spectrum Icon Submenu: 1. In the SpectroSHELL prompt change your working directory to: <SpecDir>/SG-Support/CsScript (<SpecDir> is a Spectrum directory) These two files must be present: MegaVision and sendspec.exe 2. If these files do not exist, follow these commands to create them in that directory: cp <MegaVision Dir>/exe/sendspec.exe <SpecDir>/SG-Support/CsScript cp <MegaVision Dir>/megavisi.scr <SpecDir>/SG-Support/MegaVision If you have problems viewing devices front panel (e.g. the sizes of the modules are not correct and you cannot see all the modules) or some data screens seem misaligned, please change these Windows Settings: Change “Control Panel”/”Display”/”Settings”/”Font size” to “Small Fonts”.