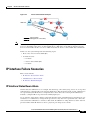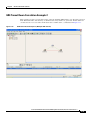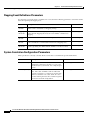
1
Cisco Active Network Abstraction
Fault Management User Guide
Version 3.6 Service Pack 1
THE SPECIFICATIONS AND INFORMATION REGARDING THE PRODUCTS IN THIS MANUAL ARE SUBJECT TO
CHANGE WITHOUT NOTICE. ALL STATEMENTS, INFORMATION, AND RECOMMENDATIONS IN THIS
MANUAL ARE BELIEVED TO BE ACCURATE BUT ARE PRESENTED WITHOUT WARRANTY OF ANY KIND,
EXPRESS OR IMPLIED. USERS MUST TAKE FULL RESPONSIBILITY FOR THEIR APPLICATION OF ANY
PRODUCTS.
Americas Headquarters
Cisco Systems, Inc.
170 West Tasman Drive
San Jose, CA 95134-1706
USA
http://www.cisco.com
Tel: 408 526-4000
800 553-NETS (6387)
Fax: 408 527-0883
Text Part Number: OL-14284-01
THE SOFTWARE LICENSE AND LIMITED WARRANTY FOR THE ACCOMPANYING PRODUCT ARE SET FORTH IN THE INFORMATION PACKET THAT
SHIPPED WITH THE PRODUCT AND ARE INCORPORATED HEREIN BY THIS REFERENCE. IF YOU ARE UNABLE TO LOCATE THE SOFTWARE LICENSE
OR LIMITED WARRANTY, CONTACT YOUR CISCO REPRESENTATIVE FOR A COPY.
The Cisco implementation of TCP header compression is an adaptation of a program developed by the University of California, Berkeley (UCB) as part of UCB’s public
domain version of the UNIX operating system. All rights reserved. Copyright © 1981, Regents of the University of California.
NOTWITHSTANDING ANY OTHER WARRANTY HEREIN, ALL DOCUMENT FILES AND SOFTWARE OF THESE SUPPLIERS ARE PROVIDED “AS IS” WITH
ALL FAULTS. CISCO AND THE ABOVE-NAMED SUPPLIERS DISCLAIM ALL WARRANTIES, EXPRESSED OR IMPLIED, INCLUDING, WITHOUT
LIMITATION, THOSE OF MERCHANTABILITY, FITNESS FOR A PARTICULAR PURPOSE AND NONINFRINGEMENT OR ARISING FROM A COURSE OF
DEALING, USAGE, OR TRADE PRACTICE.
IN NO EVENT SHALL CISCO OR ITS SUPPLIERS BE LIABLE FOR ANY INDIRECT, SPECIAL, CONSEQUENTIAL, OR INCIDENTAL DAMAGES, INCLUDING,
WITHOUT LIMITATION, LOST PROFITS OR LOSS OR DAMAGE TO DATA ARISING OUT OF THE USE OR INABILITY TO USE THIS MANUAL, EVEN IF CISCO
OR ITS SUPPLIERS HAVE BEEN ADVISED OF THE POSSIBILITY OF SUCH DAMAGES.
CCVP, the Cisco logo, and the Cisco Square Bridge logo are trademarks of Cisco Systems, Inc.; Changing the Way We Work, Live, Play, and Learn is a service mark of Cisco Systems,
Inc.; and Access Registrar, Aironet, BPX, Catalyst, CCDA, CCDP, CCIE, CCIP, CCNA, CCNP, CCSP, Cisco, the Cisco Certified Internetwork Expert logo, Cisco IOS, Cisco Press,
Cisco Systems, Cisco Systems Capital, the Cisco Systems logo, Cisco Unity, Enterprise/Solver, EtherChannel, EtherFast, EtherSwitch, Fast Step, Follow Me Browsing,
FormShare, GigaDrive, HomeLink, Internet Quotient, IOS, iPhone, IP/TV, iQ Expertise, the iQ logo, iQ Net Readiness Scorecard, iQuick Study, LightStream, Linksys,
MeetingPlace, MGX, Networking Academy, Network Registrar, PIX, ProConnect, ScriptShare, SMARTnet, StackWise, The Fastest Way to Increase Your Internet Quotient, and
TransPath are registered trademarks of Cisco Systems, Inc. and/or its affiliates in the United States and certain other countries.
All other trademarks mentioned in this document or Website are the property of their respective owners. The use of the word partner does not imply a partnership relationship
between Cisco and any other company. (0708R)
Any Internet Protocol (IP) addresses used in this document are not intended to be actual addresses. Any examples, command display output, and figures included in the
document are shown for illustrative purposes only. Any use of actual IP addresses in illustrative content is unintentional and coincidental.
Cisco Active Network Abstraction Fault Management User Guide, Version 3.6 Service Pack 1
© 1999-2007 Cisco Systems, Inc. All rights reserved.
C O N T E N T S
About This Guide
vii
Obtaining Documentation, Obtaining Support, and Security Guidelines
CHAPTER
1
Fault Management Overview
Managing Events
1-1
1-1
Basic Concepts and Terms 1-2
Alarm 1-2
Event 1-3
Event Sequence 1-3
Repeating Event Sequence 1-4
Flapping Events 1-4
Correlation By Root Cause 1-5
Ticket 1-5
Sequence Association and Root Cause Analysis
Severity Propagation
2
Fault Detection and Isolation
1-7
2-1
Unreachable Network Elements
Sources of Alarms On a Device
Alarm Integrity
3
2-1
2-3
2-3
Integrity Service
CHAPTER
1-6
1-6
Event Processing Overview
CHAPTER
vii
2-3
Cisco ANA Event Correlation and Suppression
Event Suppression
3-1
Root-Cause Correlation Process
Root-Cause Alarms
3-1
3-2
3-3
Correlation Flows 3-3
Correlation by Key 3-3
Correlation by Flow 3-3
DC Model Correlation Cache
Using Weights 3-4
3-4
Cisco Active Network Abstraction Fault Management User Guide, Version 3.6 Service Pack 1
OL-14284-01
iii
Contents
Correlating TCA
CHAPTER
4
3-4
Advanced Correlation Scenarios
4-1
Device Unreachable Alarm 4-1
Connectivity Test 4-1
Device Fault Identification 4-2
Device Unreachable Example 1
Device Unreachable Example 2
4-2
4-2
IP Interface Failure Scenarios 4-3
IP Interface Status Down Alarm 4-3
Correlation of Syslogs and Traps 4-4
All IP Interfaces Down Alarm 4-5
IP Interface Failure Examples 4-5
Interface Example 1 4-6
Interface Example 2 4-6
Interface Example 3 4-7
Interface Example 4 4-7
Interface Example 5 4-8
ATM Examples 4-9
Ethernet, Fast Ethernet, Giga Ethernet Examples
Interface Example 6 4-9
Interface Example 7 4-9
Interface Registry Parameters 4-10
ip interface status down Parameters 4-10
All ip interfaces down Parameters 4-10
Multi Route Correlation 4-11
Multi Route Correlation Example 1
Multi Route Correlation Example 2
Multi Route Correlation Example 3
Multi Route Correlation Example 4
4-11
4-11
4-12
4-13
Generic Routing Encapsulation (GRE) Tunnel Down/Up
GRE Tunnel Down/Up Alarm 4-13
GRE Tunnel Down Correlation Example 1 4-14
GRE Tunnel Down Correlation Example 2 4-15
BGP Process Down Alarm
4-13
4-17
MPLS Interface Removed Alarm
LDP Neighbor Down Alarm
4-9
4-17
4-17
Cisco Active Network Abstraction Fault Management User Guide, Version 3.6 Service Pack 1
iv
OL-14284-01
Contents
CHAPTER
5
Correlation Over Unmanaged Segments
5-1
Cloud VNE 5-1
Types of Unmanaged Networks Supported 5-1
Fault Correlation Across the Frame Relay or ATM or Ethernet Cloud
Cloud Problem Alarm 5-3
Cloud Correlation Example
CHAPTER
6
5-3
Event and Alarm Configuration Parameters
Alarm Type Definition
6-1
6-1
Event (Sub-Type) Configuration Parameters 6-2
General Event Parameters 6-2
Root Cause Configuration Parameters 6-2
Correlation Configuration Parameters 6-3
Network Correlation Parameters 6-3
Flapping Event Definitions Parameters 6-4
System Correlation Configuration Parameters
CHAPTER
7
Impact Analysis
6-4
7-1
Impact Analysis Options
7-1
Impact Report Structure
7-2
Affected Severities
7-2
Impact Analysis GUI 7-3
Affected Parties Tab 7-3
Viewing a Detailed Report For the Affected Pair
Disabling Impact Analysis
7-4
7-6
Accumulating Affected Parties 7-6
Accumulating the Affected Parties In an Alarm 7-7
Accumulating the Affected Parties In the Correlation Tree
Updating Affected Severity Over Time 7-7
APPENDIX
A
Supported Service Alarms
Shelf Out
5-2
7-7
A-1
A-4
Rx Dormant
A-5
Tx Dormant
A-5
Link Over Utilized
A-5
Cisco Active Network Abstraction Fault Management User Guide, Version 3.6 Service Pack 1
OL-14284-01
v
Contents
APPENDIX
B
Event and Alarm Correlation Flow
Software Function Architecture
B-1
B-2
Event Correlation Flow B-3
Event Creation (VNE level) B-3
Event Correlation B-3
Local Correlation (Event Correlator) B-3
Network Correlation (Event Correlator, Flow)
Correlation Logic (Event Correlator) B-4
Alarm Sending (Event Correlator) B-4
Post-Correlation Rule (Event Correlator) B-4
B-3
Cisco Active Network Abstraction Fault Management User Guide, Version 3.6 Service Pack 1
vi
OL-14284-01
About This Guide
This guide includes the following chapters:
•
Chapter 1, “Fault Management Overview”—Describes how to manage events, and introduces some
of the key concepts of Cisco ANA alarm management.
•
Chapter 2, “Fault Detection and Isolation”—Describes unreachable network elements and the
sources of alarms on devices. In addition, it describes alarm integrity and the integrity service
•
Chapter 3, “Cisco ANA Event Correlation and Suppression”—Describes how Cisco ANA performs
correlation logic decisions.
•
Chapter 4, “Advanced Correlation Scenarios”—Describes specific alarms which use advanced
correlation logic on top of the root cause analysis flow.
•
Chapter 5, “Correlation Over Unmanaged Segments”—Describes how Cisco ANA performs
correlation decisions over unmanaged segments.
•
Chapter 6, “Event and Alarm Configuration Parameters”—Describes the details of various
configurable alarm parameters.
•
Chapter 7, “Impact Analysis”—Describes the impact analysis functionality available in Cisco ANA.
•
Appendix A, “Supported Service Alarms”—Provides the list of service alarms that are supported in
Cisco ANA.
•
Appendix B, “Event and Alarm Correlation Flow”—Describes in detail the flow of alarms and
events during the correlation process.
Obtaining Documentation, Obtaining Support, and Security
Guidelines
For information on obtaining documentation, obtaining support, providing documentation feedback,
security guidelines, and also recommended aliases and general Cisco documents, see the monthly
What’s New in Cisco Product Documentation, which also lists all new and revised Cisco technical
documentation, at:
http://www.cisco.com/en/US/docs/general/whatsnew/whatsnew.html
Cisco Active Network Abstraction Fault Management User Guide, Version 3.6 Service Pack 1
OL-14284-01
vii
About This Guide
Obtaining Documentation, Obtaining Support, and Security Guidelines
Cisco Active Network Abstraction Fault Management User Guide, Version 3.6 Service Pack 1
viii
OL-14284-01
CH A P T E R
1
Fault Management Overview
This chapter describes the challenge of managing an overabundance of events, and introduces some of
the key concepts of Cisco ANA alarm management.
•
Managing Events—Describes how to manage events effectively.
•
Basic Concepts and Terms—Describes the basic concepts and terms used throughout this guide.
•
Severity Propagation—Describes the concept of severity, and how severity is propagated.
•
Event Processing Overview—Describes the process for identifying and processing raw events.
Managing Events
The challenge of dealing effectively with events and alarms is to know how to understand and efficiently
process and organize bulks of raw events that may be generated as a result of single root cause events.
Cisco Active Network Abstraction Fault Management User Guide, Version 3.6 Service Pack 1
OL-14284-01
1-1
Chapter 1
Fault Management Overview
Basic Concepts and Terms
Figure 1-1
Event Flood
Syslog: Lost
Neighbor
Lost
Connectivity
Syslog: Lost
OSPF neighbor
!
Trap: Link
Down
!
!
Syslog: Lost
BGP Neighbor
!
Syslog: Lost
OSPF neighbor
!
Unmanaged
Network
Syslog: Lost
BGP Neighbor
!
Syslog: LSP
Reroute
!
!
IP Backbone
Syslog: HSRP
Standby -> Active
!
Trap: Link
Down
Syslog: Lost
OSPF neighbor
Ping: Device
Unreachable
!
Ping: Device
Unreachable
!
Lost
Connectivity
!
Syslog: Lost
BGP Neighbor
!
!
!
Syslog: LSP
Reroute
Syslog: FR
DLCI Down
Trap: DLSw
Peer Down
!
!
!
154391
Trap: DLSw
Peer Down
Meeting the event management challenge is done by correlating related events into a sequence that
represents the alarm lifecycle, and using the network dependency model to determine the causal
inter-relationship between alarms.
Cisco ANA can be used for analyzing and managing faults using fault detection, isolation and
correlation. Once a fault is identified, the system uses the auto-discovered virtual network model to
perform fault inspection and correlation in order to determine the root cause of the fault and, if
applicable, to perform service impact analysis.
Basic Concepts and Terms
Alarm
An alarm represents a scenario which involves a fault occurring in the network or management system.
Alarms represent the complete fault lifecycle, from the time that the alarm is opened (when the fault is
first detected) until it is closed and acknowledged. Examples of alarms include:
•
Link down
•
Device unreachable
Cisco Active Network Abstraction Fault Management User Guide, Version 3.6 Service Pack 1
1-2
OL-14284-01
Chapter 1
Fault Management Overview
Basic Concepts and Terms
•
Card out
•
An alarm is composed of a sequence of events, each representing a specific point in the alarm’s
lifecycle.
Event
An event is an indication of a distinct occurrence that occurred at a specific point in time. Events are
derived from incoming traps and notifications, and from detected status changes. Examples of events
include:
•
Port status change.
•
Connectivity loss between routing protocol processes on peer routers (for example BGP neighbor
loss).
•
Device reset.
•
Device becoming reachable by the management station.
•
User acknowledgement of an alarm.
Events are written to the Cisco ANA database once and never change.
The collected events are displayed in Cisco ANA EventVision. Refer to the Cisco Active Netowrk
Abstraction EventVision User Guide for more information.
Event Sequence
An event sequence is the set of related events which comprises a single alarm. For example,
link down > ack > link up.
Figure 1-2
Event Sequence Example
Typically, a complete event sequence includes three mandatory events:
•
Alarm open (in this example a link-down event).
•
Alarm clear (in this example a link-up event).
•
Alarm acknowledge.
Optionally, there can be any number of alarm change events which can be triggered by new severity
events, affected services update events, and so on.
Cisco Active Network Abstraction Fault Management User Guide, Version 3.6 Service Pack 1
OL-14284-01
1-3
Chapter 1
Fault Management Overview
Basic Concepts and Terms
Note
The event types that will belong to each sequence can be configured in the system registry.
An event sequence can consist of a single event (for example, “device reset”).
The set of events that should participate in Cisco ANA alarm processing can be configured in the system
registry.
Repeating Event Sequence
If a new opening event arrives within a configurable timeout after the clearing event of the same alarm,
the alarm is updatable, and a repeating event sequence is created, that is, the event is attached to the
existing sequence and updates its severity accordingly. If the new opening event occurs after the timeout,
it opens a new alarm (new event sequence).
Figure 1-3
Repeating Event Sequence
Flapping Events
If a series of events that are considered to be of a same sequence occur in the network in a certain
configurable time window a certain (configurable) amount of times, the virtual network element (VNE)
may (upon configuration) reduce further the number of events, and will issue a single event which will
be of type “event flapping”. Only when the alarm stabilizes and the event frequency is reduced, will
another update to the event sequence be issued as “event stopped flapping”. Another update will be
issued with the most up-to-date event state.
Cisco Active Network Abstraction Fault Management User Guide, Version 3.6 Service Pack 1
1-4
OL-14284-01
Chapter 1
Fault Management Overview
Basic Concepts and Terms
Figure 1-4
Flapping Event
Correlation By Root Cause
Root cause correlation is determined between alarms or event sequences. It represents a causal
relationship between an alarm and the consequent alarms that occurred because of it.
For example, a card-out alarm can be the root cause of several link-down alarms, which in turn can be
the root cause of multiple route-lost and device unreachable alarms, and so on. A consequent alarm can
serve as the root cause of other consequent alarms.
Figure 1-5
Root Cause Correlation Hierarchy Example
Ticket
A ticket represents the complete alarm correlation tree of a specific fault scenario. It can be also
identified by the topmost or “root of all roots” alarm. Both Cisco ANA NetworkVision and Cisco ANA
EventVision display tickets and allow drilling down to view the consequent alarm hierarchy.
Cisco Active Network Abstraction Fault Management User Guide, Version 3.6 Service Pack 1
OL-14284-01
1-5
Chapter 1
Fault Management Overview
Severity Propagation
From an operator’s point of view, the managed entity is always a complete ticket. Operations such as
Acknowledge, Force-clear or Remove are always applied to the whole ticket. The ticket also assumes an
overall, propagated severity.
Sequence Association and Root Cause Analysis
There are two different types of relationships in Cisco ANA alarm management:
•
Sequence Association—The association between events, which creates the event sequences and
alarms.
•
Root Cause Analysis—The association between alarms (event sequences) which represents the root
cause relationship.
The following figure shows how both types of relationship are implemented in the ticket hierarchy:
Figure 1-6
Sequence Association vs. Root Cause Analysis
In the above figure, the alarms are correlated into a hierarchy according to root cause. Within each alarm
is its respective event sequence representing the lifecycle of the alarm.
Severity Propagation
Each event has an assigned severity (user-configurable). For example, a link-up event may be assigned
critical severity, while its corresponding link-up event will have normal severity.
Cisco Active Network Abstraction Fault Management User Guide, Version 3.6 Service Pack 1
1-6
OL-14284-01
Chapter 1
Fault Management Overview
Event Processing Overview
The propagated severity of the alarm (the whole event sequence) is always determined by the last event
in the sequence. In the above example, when the link-down alarm is open it will have critical severity;
when it clears it moves to normal severity. An exception to this rule is the informational event (severity
level of info) such as user acknowledge event, which does not change the propagated severity of the
sequence (the alarm).
Each ticket assumes the propagated severity of the alarm with the topmost severity, within all the alarms
in the correlation hierarchy at any level.
Note
Each alarm does not assume the propagated severity of the correlated alarms beneath it. Each alarm
assumes its severity only from its internal event sequence, as described above, while the ticket assumes
the highest severity among all the alarms in the correlation tree.
Event Processing Overview
Cisco ANA provides a customizable framework for identifying and processing raw events. The raw
events are collected into the Event Manager, forwarded to their respective VNE, and then processed as
follows:
Step 1
The event data is parsed to determine its source, type, and alarm-handling behavior.
Step 2
If the event type is configured to try and correlate, the VNE attempts to find a compliant cause alarm.
This is done in the VNE fabric.
Step 3
The event fields are looked up and completed.
Step 4
The event is sent to the Cisco ANA gateway, where:
•
The event is written to the event database.
•
If the event belongs to an alarm, it is attached to its respective event sequence and correlated to the
respective root-cause alarm within the ticket, or a new sequence and new ticket is opened.
•
If the event is marked as ticketable, and it did not correlate to any other alarm, a new ticket will be
opened where the alarm that triggered the ticket will be the root cause of any alarms in the
correlation tree.
Cisco Active Network Abstraction Fault Management User Guide, Version 3.6 Service Pack 1
OL-14284-01
1-7
Chapter 1
Fault Management Overview
Event Processing Overview
Cisco Active Network Abstraction Fault Management User Guide, Version 3.6 Service Pack 1
1-8
OL-14284-01
CH A P T E R
2
Fault Detection and Isolation
This chapter describes unreachable network elements and the sources of alarms on devices. In addition,
it describes alarm integrity and the integrity service:
•
Unreachable Network Elements—Describes how the various VNEs use reachability to check
connectivity with the NEs.
•
Sources of Alarms On a Device—Describes the four basic alarm sources that indicate problems in
the network.
•
Alarm Integrity—Describes what happens when a VNE with associated open alarms shuts down.
•
Integrity Service—Describes the integrity service tests that run on the gateway and/or the units.
Unreachable Network Elements
Reachability used by the VNEs (checks the reachability between the VNEs and NEs) depends on the
configuration of the VNE, and involves multiple connectivity tests, using SNMP, Telnet/SSH and/or
ICMP, as appropriate.
The table describes the various situations below when a NE fails to respond to the protocols:
Table 2-1
VNE Type
Unreachable Network Elements
Checks reachability using
When the NE fails to respond
When the NE is reachable
ICMP ping is restarted, and the
ICMP VNE ICMP only. During the ICMP ICMP ping is suspended, and a VNE
alarm is cleared.
test the unit pings the NE
Unreachable alarm is sent to the
every configured interval.
Cisco ANA Gateway. Only the
reachability tests are executed thereafter to
detect when the device is reachable again.
Cisco Active Network Abstraction Fault Management User Guide, Version 3.6 Service Pack 1
OL-14284-01
2-1
Chapter 2
Fault Detection and Isolation
Unreachable Network Elements
Table 2-1
VNE Type
Generic
VNE
Unreachable Network Elements (continued)
Checks reachability using
•
SNMP only (default).
During the SNMP test the
unit’s “SNMP get” the
sysoid of the NE and
expects to receive a
response
When the NE fails to respond
General polling is suspended, and a VNE
Unreachable alarm is sent to the
Cisco ANA Gateway. Only the
reachability tests are executed thereafter to
detect when the device is reachable again.
If more than one protocol is used, it is
enough for one of them to become
unreachable in order to generate the alarm.
• SNMP only (default),
and adding an ICMP test. The alarm is generic to all the protocols.
When the NE is reachable
•
General polling is restarted.
•
The first time the VNE is
started, all the commands are
submitted to the queue, and the
collector initiates an
immediate session with the
NE. The commands are sent to
the NE in a serial fashion.
•
The alarm is cleared.
•
The first time the VNE is
started, all the commands are
submitted to the queue and the
collector initiates an
immediate session with the
NE. The commands are sent to
the NE in a serial fashion.
•
The alarm is cleared.
or
Full VNE
•
SNMP only (default).
During the SNMP
reachability test, the
VNE polls the device’s
SysOID MIB using a
standard “SNMP Get”
command, and expects to
receive a response
or
•
General polling is suspended, and a VNE
Unreachable alarm is sent to the
Cisco ANA Gateway. Only the
reachability tests are executed thereafter to
detect when the device is reachable again.
If more than one protocol is used, it is
enough for one of them to become
unreachable in order to generate the alarm.
The alarm is generic to all the protocols.
SNMP only (default),
and adding ICMP and
Telnet. During the Telnet
test the unit sends
"Enter" via the open
session and expects to get
a prompt back.
Each of these scenarios have two possible settings in the registry, namely:
•
track reachability (true/false). The default is true.
When this parameter is true reachabilty is tracked according to the specific protocol, for example,
ICMP, SNMP, Telnet, and so on.
When this parameter is false then the test is not performed.
•
lazy reachability (true/false). The default is false. This parameters determines whether there is a
dedicated reachability command ‘in-charge’ of tracking reachability or whether reachability is
determined by the regular polled commands.
When this parameter is true reachability is based on polling, and a dedicated command not activated.
When this parameter is false a dedicated SNMP command is activated, and this test verifies the
response from a specific SNMP oid (sysoid is the default that can be changed).
Note
Changes to the registry should only be carried out with the support of Cisco Professional Services.
Cisco Active Network Abstraction Fault Management User Guide, Version 3.6 Service Pack 1
2-2
OL-14284-01
Chapter 2
Fault Detection and Isolation
Sources of Alarms On a Device
Sources of Alarms On a Device
The following basic sources of alarms exist in the system which indicate a problem in the network:
•
Service Alarms—Alarms generated by the VNE as a result of polling (for example SNMP, Telnet).
Usually such alarms (for example link down, card out, device unreachable and so on) are configured
in such a way that they can become root cause alarms, according to the correlation algorithms.
Service alarms can also be generated by the gateway, for example. the vpn leak alarm.
•
SNMP Traps—Traps sent by the network elements and captured by the Cisco ANA platform. The
platform supports SNMP v1, v2 and v3 traps. The traps are then forwarded to the specific VNEs for
further processing and correlation logic. In addition, reliable traps (inform commands) are
supported, when configured in the registry, where the VNE acknowledges that a trap was received.
•
Syslogs—Syslog messages sent by the network elements and captured by the Cisco ANA platform.
The Syslogs are then forwarded to the specific VNEs for further processing and correlation logic.
•
TCA—Cisco ANA can be used to set a TCA for soft properties. The TCA can be enabled to assign
a condition to the property which will trigger an alarm when violated. The alarm conditions could
be:
– Equal or not equal to a target value.
– Exceeding a defined value range (defined by maximum and minimum thresholds, including
hysteresis), for example CPU level of a device.
– Exceeding a defined rate (calculated across time), for example bandwidth or utilization rate of
a link.
•
System Alarms—Alarms generated by the gateway and/or the units, for example, disk full, database
full, unit unreachable and so on. For more information see Integrity Service.
For information about TCAs see the Cisco Active Network Abstraction Customization User Guide.
Alarm Integrity
When the VNE shuts down while it still has open alarms associated with it, “fixing” events which occur
during the down period will be consolidated when the VNE is reloaded.
Integrity Service
The integrity service is an internal service that runs on the gateway and/or the units, which is responsible
for the stability of the system by running integrity tests in order to maintain the database and eliminate
clutter in the system. In order to prevent the session from stopping, the integrity service tests are run on
a different thread in a separate directory called integrity.
The service integrity tests are run:
•
Manually—The integrity service tests are accessed as part of the Cisco ANA Shell management
services, and they can be accessed by telneting the gateway.
To run a test, the user should cd to the integrity dir, and then enter executeTest followed by the test
name. The user can pass parameters to the tests using Cisco ANA Shell.
•
Automatically—The integrity service tests are scheduled as crontab commands, to run specific tests
at specific intervals. By default the integrity service tests run automatically every 12 hours.
Cisco Active Network Abstraction Fault Management User Guide, Version 3.6 Service Pack 1
OL-14284-01
2-3
Chapter 2
Fault Detection and Isolation
Integrity Service
For example, this line in crontab runs the file every_12_hours.cmd at 11:00AM and 11:00PM:
0 11,23 * * * local/cron/every_12_hours.cmd > /dev/null 2>&1
The integrity service tests can be defined inside the cmd file, for example:
echo “`date '+%d/%m/%y %H:%M:%S -'` running integrity.executeTest alarm”
cd ~/Main ; ./mc.csh localhost 8011 integrity.executeTest alarm >& /dev/null
The first line prompts the user when a test starts to run, the next line runs the test.
The integrity service test parameters are defined in the registry. The registry entries responsible for the
integrity service can be found at:
mmvm/agents/integrity
Note
Changes to the registry should only be carried out with the support of Cisco Professional Services.
The integrity service tests include, for example, the following:
•
Alarm—Deletes cleared alarms if the alarm count is above the defined threshold.
•
businessObject—Checks for invalid OIDs in business objects.
•
Capacity—Checks the disk space capacity.
•
archiveLogs—Deletes Oracle logs.
•
tablespace—Checks that there is enough disk space for tablespace growth.
•
workflowEngine—Deletes all complete workflows that started before a configured period of time.
Cisco Active Network Abstraction Fault Management User Guide, Version 3.6 Service Pack 1
2-4
OL-14284-01
CH A P T E R
3
Cisco ANA Event Correlation and Suppression
This chapter describes how Cisco ANA performs correlation logic decisions:
•
Event Suppression—Describes enabling or disabling port-down, port-up, link-down and link-up
alarms on a selected port.
•
Root-Cause Correlation Process—Describes the root-cause correlation concept.
•
Root-Cause Alarms—Describes the root-cause alarm and weights concepts.
•
Correlation Flows—Describes correlation by flow and correlation by key. In addition, it describes
the DC model correlation cache.
Event Suppression
The user can enable or disable the port-down, port-up, link-down, and link-up alarms on a selected port.
By default, alarms are enabled on all ports except for xDSL. When the alarms are disabled on a port, no
alarms will be generated for the port, and they will not be displayed in the ticket pane. Using the Registry
Editor advanced tool, it is possible to enable or disable service alarms on network entities other than
ports, such as the MPBGP (for enabling or disabling BGP neighbor down events), or the MPLS TE
Tunnel (for TE-Tunnel down service alarm). It is also possible to enable or disable alarm specific types
without regard to a specific network entity.
By default, port-down alarms are suppressed on xDSL ports. Cisco ANA supports selectively enabling
sending of port-down alarms on xDSL ports. This can be done by:
•
Using a command available in the GUI, right-click on the port in the inventory, select Enable
Sending Alarms.
or
•
Setting a flag in the registry under the OID of the port. Changes to the registry should only be carried
out with the support of Cisco Professional Services.
Refer to the Cisco Active Network Abstraction NetworkVision User Guide for information about
disabling or enabling a port alarm.
Events can also be filtered according to their DC type source, for example, all the events that come from
any ATM DC can be filtered by configuring the registry. The following alarm under DC types is filtered
by default:
•
VRF—duplicate
ip on vpn
Cisco Active Network Abstraction Fault Management User Guide, Version 3.6 Service Pack 1
OL-14284-01
3-1
Chapter 3
Cisco ANA Event Correlation and Suppression
Root-Cause Correlation Process
Root-Cause Correlation Process
Root-cause correlation is implemented in various stages within the Cisco ANA VNEs. Initially, the
system tries to find the root-cause alarm. When a VNE detects a fault and opens an alarm, it attempts to
find another open alarm within the same device, which qualifies as the root-cause of the new alarm. For
example, in the case of a “link-down syslog” alarm , the VNE will look for a root-cause alarm within the
device, for example, “link down”. When such a root cause is found and qualified, the correlation
relationship is set in the alarm database. This process is correlation by key.
A more complex scenario is finding the root cause in a different device, which could be many network
hops away. In the above example, the link-down alarm could cause multiple BGP Neighbor Down events
throughout the network. In such cases, the BGP Neighbor Down is configured by default to actively go
and search for a root cause in other VNEs, by initiating correlation by flow. In this example, the VNE
that detected the BGP Neighbor Down uses the network topology model maintained in the Cisco ANA
fabric to trace the path to its lost neighbor. During this trace it will encounter the faulty link, and qualify
it as the BGP Neighbor Down root cause.
The following figure illustrates the local and active correlation processes.
Figure 3-1
Root-Cause Correlation Process
Cisco ANA
Gateway
Alarm Database
Card out
BGP lost
Link down
Cisco ANA
Due to
Link 1-2
down
Card out
BGP lost
Link down
1.2.3.4
1.2.3.4
Cisco ANA - Virtual NE
Network
Segment
Network A
Network B
Unmanaged
cloud
BGP Neighbor
lost (in IP 1.2.3.4)
Card out
1.2.3.4
Two devices share
the same IP!
154392
1.2.3.4
The correlation mechanisms are highly configurable (per alarm), as described in the following sections.
Cisco Active Network Abstraction Fault Management User Guide, Version 3.6 Service Pack 1
3-2
OL-14284-01
Chapter 3
Cisco ANA Event Correlation and Suppression
Root-Cause Alarms
Root-Cause Alarms
Potential root-cause alarms have a determined weight according to the specific event customization.
Refer to Chapter 6, “Event and Alarm Configuration Parameters” for additional information about
setting the weights. For example, a link-down alarm is configured to allow other alarms to correlate to
it, thus when a link-down event is recognized, other alarms that occur in the network may choose to
correlate to it, hence identifying it as the cause for their occurrence. However an event that is configured
to be the cause for other alarms can in its turn correlate to another alarm. The topmost alarm in the
correlation tree is the root cause for all the alarms.
Correlation Flows
The VNEs utilize their internal device component model (DCM) in order to perform the actual
correlation. This action is considered to be a correlation flow. There are two basic correlation
mechanisms used by the VNE:
1.
Correlation by Key (correlation in the same VNE).
2.
Correlation by Flow (correlation across VNEs or in the same VNE).
Each event can be configured to:
•
Not correlate at all.
•
Perform correlation by key.
•
Perform correlation by flow.
For more information about these parameters, see Chapter 6, “Event and Alarm Configuration
Parameters”.
In addition, the DC model cache enables the system to issue correlation flows over an historical network
snapshot that existed in the network before a failure occurred. For more information see DC Model
Correlation Cache.
Correlation by Key
When the root cause problem is at the box level, attempts to correlate to other events are restricted to the
specific VNE. This means that the correlation flow does not cross the DCM models of more than one
VNE. An example is a port-down syslog event correlating to a port-down event.
An exception for this behavior is the link-down alarm. Since a link entity connects two endpoints in the
DCM model, it involves the DCM of two different VNEs, but on each VNE the events are correlated to
their own copy of the link-down event.
Correlation by Flow
Network problems and their effects are not always restricted to one network element. This means that a
certain event could have the capability of correlating to an alarm several hops away. To do this the
correlation mechanism within the VNE uses an active correlation flow that runs on the internal VNE’s
DCM model and tries to correlate along a specified network path to an alarm. This is similar to the
Cisco ANA PathTracer operation when it traces a path on the DCM model from point A to point Z,
except that it is trying to correlate to a root-cause alarm along the way, rather than just tracing a path.
Cisco Active Network Abstraction Fault Management User Guide, Version 3.6 Service Pack 1
OL-14284-01
3-3
Chapter 3
Cisco ANA Event Correlation and Suppression
Correlation Flows
This method is usually applicable for problems in the network layer and above (OSI network model) that
might be caused due to a problem upstream or downstream. An example is an OSPF Neighbor Down
event caused by a link-down problem in an upstream router. Another important distinction between
Cisco ANA PathTracer and the correlation flow is that the correlation flow may run on an historical
snapshot of the network.
DC Model Correlation Cache
The DC model correlation cache represents the network as it was before an event occurred or during a
specific time frame by enabling the DC cache to be stored.
A flow of packets occurs on the virtual network, as part of correlation of all DCs, from one VNE to a
destination VNE while simulating the virtual network state of a past moment in time, and these packets
are forwarded via the message processing mechanism from one DC to another DC according to the rules
of the flow. If there are active DCs, and if there is a change in the DC’s property value or if a DC was
removed, all the DC properties that are marked as cache-based will be stored in the DC model cache for
a configurable period of time as defined in the registry and these property values can be restored.
The DC model cache implements this so that the VNE holds cache information for each flow related to
a DC (for example, routing entries or bridge entries) and for forwarding tables, so when a VNE needs to
reflect its DC model, as it was at some point of time in the past, the VNE will be able to do so based on
the cached information it keeps. The DC Property mechanism stores the related data of each property
(when cache management is enabled) for a configurable period of time. The default is 10 minutes. The
cache can be enabled or disabled in the registry (by default it is enabled).
The cached data (the data that is old according to the configured value in the registry) is periodically
cleaned up, in order to maintain the latest valid VNE cache information. This includes old property
values and also previously removed DCs, so that removed DCs are kept in a cache only for the defined
amount of time. The Cache Manager Component of the DA repeatedly (the period of time is defined in
the registry) sends itself a cleanup message in order to initiate a cleanup of the old property values, and
all of the DCs that were removed outside of the defined period. So after 10 minutes all the DC properties
with a timeout are automatically cleared.
Using Weights
In cases where there are multiple potential root causes along the same service path, Cisco ANA enables
the user to define a priority scheme (weight) which can determine the actual root cause.
The correlation system will use the following information to identify more precisely the root-cause
alarm:
•
weight: >=0 The correlation flow will collect the alarm, but will not stop.
The correlation mechanism will choose the alarm with the highest weight as the root cause for the alarm
that triggered the correlation by flow.
Correlating TCA
TCAs participate in the correlation mechanism, and can correlate or be correlated to other alarms.
Cisco Active Network Abstraction Fault Management User Guide, Version 3.6 Service Pack 1
3-4
OL-14284-01
CH A P T E R
4
Advanced Correlation Scenarios
This chapter describes the specific alarms which use advanced correlation logic on top of the root cause
analysis flow:
•
Device Unreachable Alarm—Describes the device unreachable alarm, its correlation and provides
various examples.
•
IP Interface Failure Scenarios—Describes the ip interface status down alarm and its correlation. In
addition, it describes the all ip interfaces down alarm, its correlation and provides several examples.
•
Multi Route Correlation—Describes support for multi route scenarios and their correlation. In
addition, it provides several examples.
•
Generic Routing Encapsulation (GRE) Tunnel Down/Up—Provides an overview of GRE tunneling,
describes the GRE tunnel alarm, and provides correlation examples.
•
BGP Process Down Alarm—Describes the BGP process down alarm, and its correlation.
•
MPLS Interface Removed Alarm—Describes the MPLS interface removed alarm, and its
correlation.
•
LDP Neighbor Down Alarm—Describes the LDP Neighbor Down alarm, and its correlation.
Device Unreachable Alarm
Connectivity Test
Connectivity tests are used to verify connectivity between the VNEs and managed network elements.
The connectivity is tested using each protocol the VNE uses to poll the device. The supported protocols
for connectivity tests are SNMP, Telnet and ICMP.
A device unreachable alarm will be issued if one or more of the connectivity test fails, that is, the device
does not respond on this protocol. The alarm will be cleared when all the protocol connectivity test are
passed successfully.
Note
The ICMP connectivity test is enabled in Cisco ANA Manage.
Cisco Active Network Abstraction Fault Management User Guide, Version 3.6 Service Pack 1
OL-14284-01
4-1
Chapter 4
Advanced Correlation Scenarios
Device Unreachable Alarm
Device Fault Identification
When a network element stops responding to queries from the management system, one of two things
has happened:
•
Connectivity to that device is lost.
•
The device itself crashes or restarts.
Cisco ANA implements an algorithm that uses additional data to heuristically resolve the ambiguity and
declare the root cause correctly. Refer to the following examples:
•
Device Unreachable Example 1
•
Device Unreachable Example 2
Device Unreachable Example 1
In this example, the router (R1) goes down. As a result the links, L2, L3, and L4 go down in addition to
the R1 session.
Figure 4-1
Device Unreachable Example 1
SW1
ANA Unit
L2
R1
L3
Physical links
Management connectivity
L4
154607
L1
In this case the system will provide the following report:
•
Root cause—Device Unreachable (R1)
•
Correlated events:
– L2 down
– L3 down
– L4 down
Device Unreachable Example 2
In this example, the router (R1) goes down. As a result the links, L2, L3, and L4 go down as well as the
R1 session. The router R2, accessed by the link L3 is also unreachable.
Note
No link-down alarm is displayed for L3 as its state cannot be determined.
Cisco Active Network Abstraction Fault Management User Guide, Version 3.6 Service Pack 1
4-2
OL-14284-01
Chapter 4
Advanced Correlation Scenarios
IP Interface Failure Scenarios
Figure 4-2
Device Unreachable Example 2
SW1
ANA Unit
L2
R1
L3
Physical links
Management connectivity
Note
R2
L4
SW2
154608
L1
If the device has a single link and it is being managed through that link (in-band management), there is
no way to determine if the device is unreachable due to a link down, or the link is down because the
device is unreachable. In this case, Cisco ANA shows that the device is unreachable due to link down.
In this case the system will provide the following report:
•
Root cause—Device Unreachable (R1)
•
Correlated events:
– L2 down
– Device Unreachable (R2)
– L4 down
IP Interface Failure Scenarios
This section includes:
•
IP Interface Status Down Alarm
•
All IP Interfaces Down Alarm
•
IP Interface Failure Examples
IP Interface Status Down Alarm
Alarms related to subinterfaces, for example, line-down trap, line-down syslog, and so on, are reported
on IP interfaces configured above the relevant subinterface. This means that in the system, subinterfaces
are represented by the IP interfaces configured above them. All events sourcing from subinterfaces
without a configured IP are reported on the underlying Layer 1.
An “ip interface status down” alarm is generated when the status of the IP interfaces (whether it is over
an interface or a subinterface) changes from up to down or any other non-operational state. All events
sourced from the subinterfaces correlate to this alarm. In addition an “All ip interfaces down” alarm is
generated when all the IP interfaces above a physical port change state to down.
Cisco Active Network Abstraction Fault Management User Guide, Version 3.6 Service Pack 1
OL-14284-01
4-3
Chapter 4
Advanced Correlation Scenarios
IP Interface Failure Scenarios
Table 4-1
IP Interface Status Down Alarm
Name
Description
Ticketable
Correlation allowed
Correlated to
Severity
Interface
status
down/up
Sent when an IP interface
changes oper status to “down”
Yes
Yes
Link Down/Device
unreachable/Configuration
changed
Major
The alarm’s description includes the full name of the IP interface, for example Serial0.2 (including the
identifier for the subinterface if it is a subinterface) and the source of the alarm source points to the IP
interface (and not to Layer1).
All syslogs and traps indicating changes in subinterfaces (above which an IP is configured) correlate to
the “ip interface status down” alarm (if this alarm was supposed to be issued). The source of these events
is the IP interface. Syslogs and traps that indicate problems in Layer1 (that do not have a subinterface
qualifier in their description) are sourced to Layer1.
Note
In case a syslog or trap is received from a subinterface that does not have an IP configured above it, the
source of the created alarm is the underlying Layer 1.
For example:
•
Line-down trap (for subinterface).
•
Line-down syslogs (for subinterface).
For events that occur on subinterfaces:
•
When sending the information northbound, the system uses the full subinterface name in the
interface name in the source field, as described in the ifDesc/ifName OID (for example Serial0/0.1
and not Serial0/0 DLCI 50).
•
The source of the alarm is the IP interface configured above the subinterface.
•
If there is no IP configured, the source is the underlying Layer 1.
In case the main interface goes down, all related subinterfaces’ traps and syslogs are correlated as child
tickets to the main interface parent ticket.
The following technologies are supported:
•
Frame Relay/HSSI
•
ATM
•
Ethernet, Fast Ethernet, Gigabit Ethernet
•
POS
•
CHOC
Correlation of Syslogs and Traps
When receiving a trap or syslog for the subinterface level, immediate polling of the status of the relevant
IP interface occurs and a polled parent event (for example, ip interface status down) is created. The trap
or syslog is correlated to this alarm.
Cisco Active Network Abstraction Fault Management User Guide, Version 3.6 Service Pack 1
4-4
OL-14284-01
Chapter 4
Advanced Correlation Scenarios
IP Interface Failure Scenarios
Where there is a multipoint setup and only some circuits under an IP interface go down, and this does
not cause the state of the IP interface to change to down, then no “ip interface status down” alarm is
created. All the circuit down syslogs correlate by flow to the possible root cause, for example, Device
unreachable on a customer edge (CE) device.
All IP Interfaces Down Alarm
Note
Table 4-2
•
When all the IP interfaces configured above a physical interface change their state to down, the All
ip interfaces down alarm is sent.
•
When at least one of the IP interfaces changes its state to up, a clearing (active ip interfaces found)
alarm is sent.
•
The ip interface status down alarm for each of the failed IP interfaces is correlated to the All ip
interfaces down alarm.
When an All ip interfaces down alarm is cleared by the active ip interfaces down alarm but there are still
correlated ip interface status down alarms for some IP interfaces, the severity of the parent ticket is the
highest severity among all the correlated alarms. For example, if there is an uncleared interface status
down alarm, the severity of the ticket remains major, despite the fact that the Active ip interfaces found
alarm has a cleared severity.
All IP Interfaces Down
Name
Description
Ticketable
All ip interfaces Sent when all the IP interfaces
Yes
down/Active ip configured above a physical port
interfaces found change their oper status to down
Correlation allowed
Correlated to
Severity
Yes
Link
Major
Down/Configuration
Change
The All ip interfaces down alarm is sourced to the Layer1 component. All alarms from “the other side”,
for example, device unreachable correlate to the All ip interfaces down alarm.
IP Interface Failure Examples
Note
In all the examples that follow it is assumed that the problems that result in the unmanaged cloud, or the
problems that occurred on the other side of the cloud (for example, an unreachable CE device from a
provider edge (PE) device) cause the relevant IP interfaces’ state to change to down. This in turn causes
the ip interface status down alarm to be sent.
If this is not the case, as in some Ethernet networks, and there is no change to the state of the IP interface,
all the events on the subinterfaces that are capable of correlation flow will try to correlate to other
possible root causes, including “cloud problem”.
Cisco Active Network Abstraction Fault Management User Guide, Version 3.6 Service Pack 1
OL-14284-01
4-5
Chapter 4
Advanced Correlation Scenarios
IP Interface Failure Scenarios
Interface Example 1
In this example there is multipoint connectivity between a PE and number of CEs through an unmanaged
Frame Relay network. All the CEs (Router2 and Router3) have logical connectivity to the PE through a
multipoint subinterface on the PE (Router10). The keep alive option is enabled for all circuits. A link is
disconnected inside the unmanaged network that causes all the CEs to become unreachable.
unreachable
Router2
10.222.1.2
Interface Example 1
Multipoint
connectivity
interface Serial0/0.100
point-to-point
10.200.1.2
Frame-Relay
cloud
interface Serial0/0.55
multipoint
10.200.1.10
multipiont
IP interface
State "down"
unreachable
Router2
10.222.1.3
Router10
10.222.1.10
180434
Figure 4-3
interface Serial0/0.101
point-to-point
10.200.1.3
The following failures are identified in the network:
•
A device unreachable alarm is generated for each CE.
•
An ip interface status down alarm is generated for the multipoint IP interface on the PE.
The following correlation information is provided:
•
The root cause is IP subinterface down.
•
All the device unreachable alarms are correlated to the ip interface status down alarm on the PE.
Interface Example 2
In this example there is point-to-point connectivity between a PE and a CE through an unmanaged Frame
Relay network. CE1 became unreachable, and the status of the IP interface on the other side (on the PE1)
changed state to down. The “keep alive” option is enabled. The interface is shut down between the
unmanaged network and CE1.
unreachable
CE1
60.60.60.4
Interface Example 2
interface Serial1/0.500
point-to-point
102.0.0.2
Point-to-point
IP interface
State unknown
Point-to-point
connectivity
Frame-Relay
cloud
Routing Protocol
neighbor down syslog
(BGF, OSPF)
interface Serial1/0.100
point-to-point
102.0.0.1
Point-to-point
IP interface
State "down"
PE1
80.80.80.69
180435
Figure 4-4
The following failures are identified in the network:
•
A device unreachable alarm is generated on the CE.
Cisco Active Network Abstraction Fault Management User Guide, Version 3.6 Service Pack 1
4-6
OL-14284-01
Chapter 4
Advanced Correlation Scenarios
IP Interface Failure Scenarios
•
An ip interface status down alarm is generated on the PE.
The following correlation information is provided:
•
The root cause is device unreachable:
– The ip interface status down alarm is correlated to the device unreachable alarm.
– The syslogs and traps for the related subinterfaces are correlated to the ip interface status down
alarm.
Interface Example 3
In this example there is a failure of multiple IP interfaces above the same physical port (mixed
point-to-point and multipoint Frame Relay connectivity). CE1 (Router2) has a point-to-point connection
to PE1 (Router10). CE1 and CE2 (Router3) have multipoint connections to PE1. The IP interfaces on
PE1 that are connected to CE1, and CE2 are all configured above Serial0/0. The “keep alive” option is
enabled. A link is disconnected inside the unmanaged network that has caused all the CEs to become
unreachable.
Interface Example 3
unreachable
Router2
10.222.1.2
unreachable
Router2
10.222.1.3
interface Serial0/0.100
point-to-point
10.200.1.2
interface Serial0/0.101
point-to-point
10.200.1.3
Mixed Multipoint and
Point-to-point
connectivity
Frame-Relay
cloud
interface Serial0/0.55
multipoint
10.200.1.10
Router10
10.222.1.10
interface Serial0/0.100
point-to-point
10.200.3.10
interface Serial0/0.100
point-to-point
10.200.3.3
All IP interface
above Serial0/0 change
state to "down"
180436
Figure 4-5
The following failures are identified in the network:
•
All the CEs become unreachable.
•
An ip interface status down alarm is generated for each IP interface above Serial0/0 that has failed.
The following correlation information is provided:
•
The root cause is All IP interfaces down on Serial0/0 port:
– The ip interface status down alarms are correlated to the All IP interfaces down alarm.
– The device unreachable alarms are correlated to the All IP interfaces down alarm.
– The syslogs and traps for the related subinterfaces are correlated to the All IP interfaces down
alarm.
Interface Example 4
In this example there is a link down. In a situation where a link down occurs, whether it involves a cloud
or not, the link failure is considered to be the most probable root cause for any other failures. In this
example, a link is disconnected between the unmanaged network and the PE.
Cisco Active Network Abstraction Fault Management User Guide, Version 3.6 Service Pack 1
OL-14284-01
4-7
Chapter 4
Advanced Correlation Scenarios
IP Interface Failure Scenarios
unreachable
Router2
10.222.1.2
unreachable
Router2
10.222.1.3
Interface Example 4
interface Serial0/0.100
point-to-point
10.200.1.2
interface Serial0/0.101
point-to-point
10.200.1.3
Mixed Multipoint and
Point-to-point
connectivity
interface Serial0/0.55
multipoint
10.200.1.10
Frame-Relay
cloud
Link is "down"
Router10
10.222.1.10
All IP interface
above Serial0/0 change
state to "down"
180437
Figure 4-6
The following failures are identified in the network:
•
A link-down alarm is generated on Serial0/0.
•
A device unreachable alarm is generated for each CE.
•
An ip interface status down alarm is generated for each IP interface above Serial0/0.
•
An All interfaces down alarm is generated on Serial0/0.
The following correlation information is provided:
•
The device unreachable alarms are correlated to the link-down alarm
•
The ip interface status down alarm is correlated to the link-down alarm
•
The All interfaces down alarm is correlated to the link-down alarm
•
All the traps and syslogs for the subinterfaces are correlated to the link-down alarm
Interface Example 5
In this example on the PE1 device that has multipoint connectivity, one of the circuits under the IP
interface has gone down and the CE1 device which is connected to it has become unreachable. The status
of the IP interface has not changed and other circuits are still operational.
Figure 4-7
General Interface Example
CE1 unreachable
Mixed Multipoint
and Point-to-point
connectivity
PE1
CE2
Cloud
Circuit
down
syslog
180440
CE3
The following failures are identified in the network:
•
A device unreachable alarm is generated on CE1.
•
A Syslog alarm is generated notifying the user about a circuit down.
Cisco Active Network Abstraction Fault Management User Guide, Version 3.6 Service Pack 1
4-8
OL-14284-01
Chapter 4
Advanced Correlation Scenarios
IP Interface Failure Scenarios
The following correlation information is provided:
•
device unreachable on the CE:
– The Syslog alarm is correlated by flow to the possible root cause, for example, a device
unreachable alarm on CE1
ATM Examples
Similar examples involving ATM technology have the same result, assuming that a failure in an
unmanaged network causes the status of the IP interface to change to down (ILMI is enabled).
Ethernet, Fast Ethernet, Giga Ethernet Examples
Interface Example 6
In this example there is an unreachable CE due to a failure in the unmanaged network.
Figure 4-8
Interface Example 6
PE1
CE1 unreachable
Etherenet
cloud
Subinterface with
IP configured
180438
Subinterface with
IP configured
The following failures are identified in the network:
•
A device unreachable alarm is generated on the CE.
•
A cloud problem alarm is generated.
The following correlation information is provided:
•
No alarms are generated on a PE for Layer1, Layer2 or for the IP layers.
•
The device unreachable alarm is correlated to the cloud problem alarm.
Interface Example 7
In this example there is a link down on the PE that results in the CE becoming unreachable.
Interface Example 7
PE1
CE1 unreachable
Etherenet
cloud
Subinterface with
IP configured
Link is "down"
Subinterface with
IP configured
180439
Figure 4-9
Cisco Active Network Abstraction Fault Management User Guide, Version 3.6 Service Pack 1
OL-14284-01
4-9
Chapter 4
Advanced Correlation Scenarios
IP Interface Failure Scenarios
The following failures are identified in the network:
•
A link-down alarm is generated on the PE.
•
An ip interface status down alarm is generated on the PE.
•
A device unreachable alarm is generated on the CE.
The following correlation information is provided:
•
Link down on the PE:
– The ip interface status down alarm on the PE is correlated to the link-down alarm.
– The device unreachable alarm on the CE is correlated to the link-down alarm on the PE.
– The traps and syslogs for the subinterface are correlated to the link down alarm on the PE
Interface Registry Parameters
ip interface status down Parameters
The following ip interface status down parameters can be controlled through the registry:
Note
•
is-correlation-allowed
•
severity
•
timeout
•
time-stamp-delay
•
weight
•
is-ticketable
For more information about these parameters see Chapter 6, “Event and Alarm Configuration
Parameters”.
All ip interfaces down Parameters
The following All ip interfaces down parameters can be controlled through the registry:
Note
•
is-correlation-allowed
•
is-ticketable
•
severity
•
activate-flow
•
correlate
•
timeout
•
weight
For more information about these parameters, see Chapter 6, “Event and Alarm Configuration
Parameters”.
Cisco Active Network Abstraction Fault Management User Guide, Version 3.6 Service Pack 1
4-10
OL-14284-01
Chapter 4
Advanced Correlation Scenarios
Multi Route Correlation
Multi Route Correlation
The correlation mechanism supports multi route scenarios, thereby eliminating false correlation, and
guaranteeing that the correct root cause alarm is reported.
The correlation mechanism ensures that if multi-route segments exist then all the alarms found on a
certain path (after eliminating invalid paths) are collected into an alarm set. These alarm sets are input
into a multi route filtering algorithm which eliminates irrelevant alarms from these sets, and outputs the
potentially root cause alarms. The root-cause alarm is determined from this group.
Multi Route Correlation Example 1
In this example, a link went down in the multi route segment between P1 and P4, and another link went
down in the single route segment between P6 and PE2. As a result, CE1 lost connectivity to its
management port, and became unreachable.
Multi Route Correlation Example 1
Device
unreachable
CE1
P2
PE1
P3
P1
Link down
#1
Link down
#2
P6
P4
PE2
P5
MNG core
MNG core
182428
Figure 4-10
In this case the system will provide the following report:
•
Note
Root cause—Device Unreachable. Link Down #2 is identified as the root-cause for Device
Unreachable (CE1).
Link Down #1 is not the root-cause of the alarm because after it occurs there is still an alternative route
from CE1 to its management port.
Multi Route Correlation Example 2
In this example, there are traffic engineering routes (RSVP) from router CE2, so that CE2 can reach P1
through only three possible paths, namely:
•
CE2->PE3->P7->P8->P1
•
CE2->PE3->P8->P1
•
CE2->PE3->P7->P1
Several links went down, and as a result, router CE2 became unreachable.
Cisco Active Network Abstraction Fault Management User Guide, Version 3.6 Service Pack 1
OL-14284-01
4-11
Chapter 4
Advanced Correlation Scenarios
Multi Route Correlation
Figure 4-11
Multi Route Correlation Example 2
P2
P3
Link down
#2
P1
PE1
CE1
P7
P6
Link
down #1
P4
Link
down #1
Link
down #2
PE3
PE2
P5
Link
down #3
MNG core
P8
MNG core
182429
Device
unreachable
CE2
In this case the system will provide the following report:
•
Root cause—Device Unreachable. Link Down #1, Link Down #2 or Link Down #3 is identified as
the root cause for Device Unreachable (CE2), depending on which one occurred closest in time to
the Device Unreachable event.
Multi Route Correlation Example 3
In this example, two paths exists from CE1 to PE2. Several links went down and as a result router CE1
became unreachable. In addition, router P4 is an unmanaged device.
Multi Route Correlation Example 3
Device
unreachable
CE1
P2
Link down
#1
PE1
P1
P3
Unmanaged
device
P4
Link down
#2
P6
PE2
P5
MNG core
MNG core
182430
Figure 4-12
In this case the system will provide the following report:
•
Root cause—Device Unreachable. Link Down #1 or Link Down #2 is identified as the root cause for
Device Unreachable (CE1), depending on which one occurred closest in time to the Device
Unreachable event.
Cisco Active Network Abstraction Fault Management User Guide, Version 3.6 Service Pack 1
4-12
OL-14284-01
Chapter 4
Advanced Correlation Scenarios
Generic Routing Encapsulation (GRE) Tunnel Down/Up
Multi Route Correlation Example 4
In this example, two paths exists from CE1 to PE2. Several links went down, and there is a MPLS black
hole in the multi route segment. As a result router CE1 became unreachable.
Figure 4-13
Multi Route Correlation Example 4
Link down
#2
CE1
P2
PE1
P3
P1
Link down
#1
Link down
#2
P6
P4
MPLS
Black hole
MNG core
PE2
P5
MNG core
182431
Device
unreachable
In this case the system will provide the following report:
•
Root cause—Device Unreachable. Link Down #2 is identified as the root cause for Device
Unreachable (CE1).
Generic Routing Encapsulation (GRE) Tunnel Down/Up
Generic Routing Encapsulation (GRE) is a tunneling protocol that encapsulates a variety of network
layer packets inside IP tunneling packets, creating a virtual point-to-point link to devices at remote
points over an IP network. It is used on the Internet to secure virtual private networks (VPNs). GRE
encapsulates the entire original packet with a standard IP header and GRE header before the IPsec
process. GRE can carry multicast and broadcast traffic, making it possible to configure a routing
protocol for virtual GRE tunnels. The routing protocol detects loss of connectivity and reroutes packets
to the backup GRE tunnel, thus providing high resiliency.
GRE is stateless, which means that the tunnel endpoints do not monitor the state or availability of other
tunnel endpoints. This feature helps service providers support IP tunnels for clients, who don't know the
service provider's internal tunneling architecture. It gives clients the flexibility of reconfiguring their IP
architectures without worrying about connectivity.
GRE Tunnel Down/Up Alarm
When a GRE tunnel link exists, if the status of the IP interface of the GRE tunnel edge changes to down,
a GRE Tunnel Down alarm is created. The IP Interface Down alarms of both sides of the link will
correlate to the GRE Tunnel Down alarm. The GRE Tunnel Down alarm will initiate an IP based flow
toward the GRE destination. If an alarm is found during the flow, it will correlate to it.
Cisco Active Network Abstraction Fault Management User Guide, Version 3.6 Service Pack 1
OL-14284-01
4-13
Chapter 4
Advanced Correlation Scenarios
Generic Routing Encapsulation (GRE) Tunnel Down/Up
Note
The GRE Tunnel Alarm Down is supported only on GRE tunnels that are configured with keepalive.
When keepalive is configured on the GRE tunnel edge, if a failure occurs in the GRE tunnel link, both
IP interfaces of the GRE tunnel will be in Down state. If keepalive is not configured on the GRE tunnel
edge, since the alarm is generated arbitrarily from one of the tunnel devices when the IP Interface
changes to the Down state, the GRE Tunnel Down alarm might not be generated.
When a failure occurs, the GRE tunnel link is marked orange. When the IP interface comes back up, a
fixing alarm is sent, and the link is marked green. The GRE Tunnel Down alarm is cleared by a
corresponding GRE Tunnel Up alarm. It will also be cleared when the GRE link is discovered again.
GRE Tunnel Down Correlation Example 1
The following provides an example of a GRE Tunnel Down correlation for a single GRE tunnel.
In this example:
•
Router 1 (R1) is connected to Router 3 (R3) through a physical link L1.
•
Router 3 is connected to Router 2 through a physical link L2.
•
Router 1 is connected to Router 2 through a GRE tunnel.
Figure 4-14
GRE Tunnel Down Example 1 (Single GRE Tunnel)
L1
R1
R3
R2
Physical links
GRE tunnel
183047
L2
GRE tunnel
When a Link Down occurs on L2, a Link Down alarm appears. A GRE Tunnel Down alarm is issued as
the IP interfaces of the tunnel edge devices go down. The IP Interface Status Down alarms will correlate
to the GRE Tunnel Down alarm. The GRE tunnel down will correlate to the Link Down alarm.
The system provides the following report:
•
Root cause—Link down: L2 Router 2 <-> Router 3
•
Correlated events:
GRE tunnel down Router1:tunnel <-> Router 2:tunnel
– IP interface down Router 1:tunnel
– IP interface down Router 2:tunnel
Cisco Active Network Abstraction Fault Management User Guide, Version 3.6 Service Pack 1
4-14
OL-14284-01
Chapter 4
Advanced Correlation Scenarios
Generic Routing Encapsulation (GRE) Tunnel Down/Up
GRE Tunnel Down Correlation Example 2
This example provides a real world scenario, whereby multiple GRE tunnels cross through a physical
link. When this link is shut down by an administrator, many alarms are generated. All the alarms are
correlated to the root cause ticket "Link down due to admin down”, as illustrated in Figure 4-15.
Figure 4-15
GRE Tunnel Down Example 2 (Multiple GRE Tunnels)
Cisco Active Network Abstraction Fault Management User Guide, Version 3.6 Service Pack 1
OL-14284-01
4-15
Chapter 4
Advanced Correlation Scenarios
Generic Routing Encapsulation (GRE) Tunnel Down/Up
Figure 4-16 shows the Correlation tab of the Ticket Properties dialog box, which displays all the alarms
that are correlated to the ticket, including the correlation for each GRE tunnel and its interface status.
Figure 4-16
Alarms Correlation to GRE Tunnel Down Ticket
As illustrated, the system provides the following report:
•
Root cause—Link down due to admin down
•
Correlated events:
GRE tunnel down ME-6524AGRE:Tunnel2 <-> ME-6524B GRE:Tunnel2
– Interface status down ME-6524A IP:Tunnel2
– Interface status down ME-6524B IP:Tunnel2
GRE tunnel down ME-6524AGRE:Tunnel3 <-> ME-6524B GRE:Tunnel3
– Interface status down ME-6524A IP:Tunnel3
– Interface status down ME-6524B IP:Tunnel3
etc.
Cisco Active Network Abstraction Fault Management User Guide, Version 3.6 Service Pack 1
4-16
OL-14284-01
Chapter 4
Advanced Correlation Scenarios
BGP Process Down Alarm
BGP Process Down Alarm
The BGP process down alarm is issued when the BGP process is shut down on a device. If a BGP process
is shutdown on a device, the BGP neighbor down events will correlate to it as well as all the device
unreachable alarms from the CE devices that lost connectivity to the VRF due to the BGP process down
on the route reflector. The syslogs that the device issues expedite the status check of the BGP process
and BGP neighbors.
MPLS Interface Removed Alarm
The MPLS interface removed alarm is issued when a MPLS IP interface is removed and there is no
MPLS TE tunnel on the same interface. In addition, this may lead to two black holes on either side and
MPLS black hole found alarms may be issued. The black holes will send a flood message to the PEs and
check for any broken LSPs, and broken LSP discovered alarms may be issued. The MPLS black hole
found and broken LSP discovered alarms are correlated to the MPLS interface removed alarm. The
syslogs that the device issues expedite the status check of the label switching table and MPLS status.
LDP Neighbor Down Alarm
The "LDP neighbor down" alarm is issued if a session to an LDP neighbor goes down. This can happen
as the result of a failure in the TCP connection used by the LDP session, or if the interface is no longer
running MPLS. The “LDP neighbor down” alarm is cleared by a corresponding “LDP neighbor up”
alarm.
The alarm is issued when a peer is removed from the table in the LDP Neighbours tab. The alarm runs a
correlation flow to detect what event happened in the network core, and then performs a Root Cause
Analysis to find its root cause. The alarm initiates an IP based flow towards the “Peer Transport Address"
destination. If an alarm is found during the flow, it will correlate to it.
Note
The "LDP neighbor down" alarm can correlate to the “MPLS interface removed" alarm. See MPLS
Interface Removed Alarm, page 4-17.
Cisco Active Network Abstraction Fault Management User Guide, Version 3.6 Service Pack 1
OL-14284-01
4-17
Chapter 4
Advanced Correlation Scenarios
LDP Neighbor Down Alarm
Cisco Active Network Abstraction Fault Management User Guide, Version 3.6 Service Pack 1
4-18
OL-14284-01
CH A P T E R
5
Correlation Over Unmanaged Segments
This chapter describes how Cisco ANA performs correlation decisions over unmanaged segments,
namely, clouds.
•
Cloud VNE—Describes managing more than one network segment that interconnects with others,
over another network segment which is not managed.
•
Cloud Problem Alarm—Describes the cloud problem alarm, its correlation, and provides an
example.
Cloud VNE
In some scenarios Cisco ANA is required to manage more than one network segment that interconnects
with others over another network segment which is not managed. In such setups, faults on one device
might be correlated to faults on another device that is located on the other side of the unmanaged segment
of the network, or to unknown problems in the unmanaged segment itself.
A virtual cloud is used for representing unmanaged network segments. It represents the unmanaged
segment of the network as a single device that the two managed segments of the network are connected
to, and has that device simulate the workings of the unmanaged segment.
Virtual clouds support specific network setups. The types of unmanaged networks that are supported are:
•
Frame Relay
•
ATM
•
Ethernet
Types of Unmanaged Networks Supported
This section describes the types of unmanaged networks that are supported when a VNE simulates an
unmanaged segment of a network.
Note
The unmanaged segments referred to in this section must be pure switches, no routing can be involved
with the segment.
Cisco Active Network Abstraction Fault Management User Guide, Version 3.6 Service Pack 1
OL-14284-01
5-1
Chapter 5
Correlation Over Unmanaged Segments
Cloud VNE
Table 5-1
Cloud Types Supported
Technology Type
Supported When...
Logical Inventory
Physical Inventory
ATM
An ATM cloud (representing
unmanaged network segments)
comprised of ATM switches is
connected to routers (managed
segments) with ATM interfaces.
The ATM interface or
sub-interface in the router is IP
over an ATM VC encapsulation
interface with a VC (VPI or VCI)
or VP (VPI) configuration.
The IP interface connected to a
routing entity or VRF
component, for the ATM
interface or sub-interface.
The ATM port connected to the
VC encapsulation, for the ATM
interface or sub-interface.
Frame Relay
A Frame Relay cloud
(representing unmanaged
network segments) comprised of
Frame Relay switches is
connected to routers (managed
segments) with Frame Relay
interfaces. The Frame Relay
interface or sub-interface in the
router is IP over a Frame Relay
VC encapsulation interface with
a DLCI configuration.
The IP interface connected to a
routing entity or VRF
component, for the Frame Relay
interface or sub-interface.
The Frame Relay port connected
to the VC encapsulation, for the
Frame Relay interface or
sub-interface.
Ethernet
A Ethernet LAN cloud
(representing unmanaged
network segments) comprised of
Ethernet LAN switches is
connected to routers (managed
segments) with Ethernet
interfaces. The ethernet interface
or sub-interface in the router can
be either native or VLAN
interfaces.
The IP interface connected to a
routing entity or bridges, for the
ethernet interface or
sub-interface.
The ethernet port connected to
the VLAN encapsulation, for the
ethernet interface or
sub-interface.
Fault Correlation Across the Frame Relay or ATM or Ethernet Cloud
When a Layer 3 or Layer 2 event (for example, reachability problem, neighbor change, Frame Relay
DLCI down, ATM PVC down) occurs, it triggers a flow along the physical and logical path modeled on
the VNEs. This is done in order to correlate to the actual root cause of this fault. If the flow passes over
a cloud along the path flow, it marks it as a potential root cause for the fault. If there is no other root
cause found on the managed devices, then the cloud becomes the root cause. A ticket is then issued and
the original event correlates to it.
Cisco Active Network Abstraction Fault Management User Guide, Version 3.6 Service Pack 1
5-2
OL-14284-01
Chapter 5
Correlation Over Unmanaged Segments
Cloud Problem Alarm
Cloud Problem Alarm
For some events, when there is no root cause found, a special cloud problem alarm is created. These
events are then correlated to the alarm. The cloud problem alarm has a major severity, and is
automatically cleared after a delay.
Note
When required a correlation filter, filters the cloud problem. This enables or disables the ability of an
alarm to create a cloud problem alarm, and to correlate to it. The default value is false for all alarms in
the system, meaning that an alarm does not correlate to the cloud problem alarm by default. However,
there are several alarms that override the default configuration and are set to true, as follows:
BGP neighbor down syslog
OSPF neighbor loss syslog
EIGRP router query to neighbors timeouted syslog
ipx 3 bad igrp sap syslog
Cloud Correlation Example
In this example, two devices that have OSPF configured are connected through a cloud. A malfunction
occurs inside the unmanaged network that causes the OPSF neighbor down alarm to be generated. In this
case the OSPF neighbor down alarm is correlated to the cloud problem.
Figure 5-1
Cloud Correlation Example
Routing Protocol
neighbor down syslog
Interface Serial
1/0.100
point-to-point
102.0.0.2
Frame Relay
CE1
60.60.60.4
PE1
80.80.80.69
Point-to-point
interface
State "down"
180456
ISDN
Backup
Interface Serial
1/0.500
point-to-point
102.0.0.2
On the PE1 device, the OSPF neighbor down alarm was received, and no root cause was detected in any
of the managed devices. A disconnected link inside the unmanaged network caused the OSPF neighbor
down alarm. The following alarms are generated and correlated:
•
Cloud problem on the cloud:
– OSPF neighbor down on the PE1 is correlated to the cloud problem alarm.
Cisco Active Network Abstraction Fault Management User Guide, Version 3.6 Service Pack 1
OL-14284-01
5-3
Chapter 5
Correlation Over Unmanaged Segments
Cloud Problem Alarm
Cisco Active Network Abstraction Fault Management User Guide, Version 3.6 Service Pack 1
5-4
OL-14284-01
CH A P T E R
6
Event and Alarm Configuration Parameters
This chapter describes the different options that exist to modify the alarm behavior by editing the
appropriate alarm parameters in the system registry.
•
Alarm Type Definition—Describes the alarm type concept.
•
Event (Sub-Type) Configuration Parameters—Describes the event and alarm configuration
parameters and values that can be controlled through the registry.
The parameters described in the following section are defined per event (subtype) that belongs to the
alarm.
Note
Changes to the registry should only be carried out with the support of Cisco Professional Services.
Alarm Type Definition
The alarm type serves as an identifier which enables group events from different subtypes to share the
same type and source in a single event sequence.
The event subtype is a specific occurrence of fault in the network. For example, link down and link up
are two subtypes that share the same type.
Cisco Active Network Abstraction Fault Management User Guide, Version 3.6 Service Pack 1
OL-14284-01
6-1
Chapter 6
Event and Alarm Configuration Parameters
Event (Sub-Type) Configuration Parameters
Event (Sub-Type) Configuration Parameters
General Event Parameters
Parameter Name
Description
Permitted Values
severity
Severity level of the event.
Either:
is-ticketable
•
CRITICAL
•
MAJOR
•
MINOR
•
WARNING
•
CLEARED
•
UNKNOWN
•
INFO
Determines whether the alarm will generate a new
True (ticketable)
ticket, if there is no root-cause alarm to correlate to. False (not ticketable)
functionality-type Determines the event type.
Either:
•
SERVICE
(Cisco ANA-generated)
•
SYSLOG
•
TRAP
Root Cause Configuration Parameters
These parameters define the behavior of the alarm when serving as the root cause of other alarms.
Name
Description
Permitted Values
is-correlation-allowed
Defines whether the alarm may serve as a
root cause, and allow child alarms to
correlate to it.
True (correlates) or
False (will not
correlate)
short description
Textual description that describes the event. User defined text
gw-correlation-timeout
The period of time in milliseconds for how Positive integer
long an alarm with the severity Clear or Info
is open for sequence. Alarms with
non-cleared severity are always open for a
consequent alarm. This parameter is
deprecated for non-clearing events (its value
is defined as a very large number, so that it
does not interfere with correlation decisions
from a VNE). This parameter only affects
chaining to clearing events.
Cisco Active Network Abstraction Fault Management User Guide, Version 3.6 Service Pack 1
6-2
OL-14284-01
Chapter 6
Event and Alarm Configuration Parameters
Event (Sub-Type) Configuration Parameters
Name
Description
Permitted Values
select-root-cause-method
Select the class name
Used to determine the most fitting alarm
to be used from the
from the set of possible root causes sets.
This set may be a result of a correlation flow set of classes
or may represent all alarms in the local
Event Correlator component having a
correlation key that matches one of the
EventData object correlation keys.
correlation-filters
Select the class name
Used to define a set of filters that will
to be used from the
remove, from the potential set of alarms,
set of classes
unnecessary root causes. For example,
remove from the list all the root causes that
have a weight lower than the event that
wants to correlate.
post-correlationapplications
Used to define a set of applications that will Select the class name
to be used from the
be invoked after the event was correlated.
set of classes
For example, running affected is such an
application.
For more information about root cause see Correlation By Root Cause, page 1-5.
Correlation Configuration Parameters
These parameters define the behavior of the alarm in finding its root-cause alarm:
Name
Description
Permitted values
correlate
Determines whether the alarm should attempt to True or false
find and correlate to a root-cause alarm. If this
parameter is set to true at least box level
correlation will be performed.
Network Correlation Parameters
These parameters control the alarm’s behavior in initiating an active correlation-search flow:
Note
Name
Description
Permitted values
activate-flow
Determines whether to initiate network level
correlation.
True or false
weight
Defines the weight of an alarm as a correlation Positive integer
candidate. The heavier the alarm, the more
likely it will be chosen as the root cause.
All delays should be smaller than the expiration time to allow correlation to take place. Flow activation
delay is being counted only when the correlation delay has expired.
Cisco Active Network Abstraction Fault Management User Guide, Version 3.6 Service Pack 1
OL-14284-01
6-3
Chapter 6
Event and Alarm Configuration Parameters
Event (Sub-Type) Configuration Parameters
Flapping Event Definitions Parameters
If a flapping event application is enabled on an event, then the following parameters control the alarm’s
behavior regarding its flapping state:
Name
Description
Permitted values
Flapping
interval
The maximum amount of time in milliseconds between two alarms Positive integer
which can be considered as a flapping change.
Flapping
threshold
After this amount of changes (each change arriving at an interval
lower then the flapping interval), the event will be considered as
flapping.
Positive integer
Update
interval
After this interval in milliseconds an update will be sent.
Positive integer
Clear
interval
The amount of time in milliseconds an event has to stay in one state Positive integer
to be considered as a normal alarm and not in a flapping state.
Update
threshold
After this number of flapping alarms, an update will be sent to the
gateway updating the alarm with the number of events received.
Positive integer
System Correlation Configuration Parameters
These parameters correctly correlate all the events that occur within the specified timeframe.
Name
Description
Permitted values
correlation-delay
Positive integer
Period of time in milliseconds to wait before
attempting to find and correlate to a root-cause
parameter (it is system-wide, not configured per
event).
time-stamp-delay
Used for normalization of the event occurrence Positive integer
time. The value in milliseconds is subtracted
from the event time, to compensate for the time
difference with the root-cause alarm. It is also
used for running the network correlation against
the historic network configuration.
Cisco Active Network Abstraction Fault Management User Guide, Version 3.6 Service Pack 1
6-4
OL-14284-01
CH A P T E R
7
Impact Analysis
This chapter describes the impact analysis functionality:
•
Impact Analysis Options—Describes automatic and proactive impact analysis.
•
Impact Report Structure—Describes the structure of the impact report that is generated.
•
Affected Severities—Describes the severities used for automatic impact analysis.
•
Impact Analysis GUI—Describes how the user can view impact analysis information in Cisco ANA
NetworkVision.
•
Disabling Impact Analysis—Describes enabling and disabling impact analysis for specific alarm,
and which alarms support this feature.
•
Accumulating Affected Parties—Describes how Cisco ANA NetworkVision automatically
calculates the accumulation of affected parties during automatic impact analysis.
Impact Analysis Options
Impact analysis is available in two modes:
•
Automatic impact analysis—When a fault occurs which has been identified as potentially service
affecting, Cisco ANA automatically generates the list of potential and actual service resources that
were affected by the fault, and embeds this information in the ticket along with all the correlated
faults.
Note
•
Note
This only applies to specific alarms. Not every alarm initiates affected calculation.
Proactive impact analysis—Cisco ANA provides “what-if” scenarios for determining the possible
affect of network failures. This enables on-demand calculation of affected service resources for
every link in the network, thus enabling an immediate service availability check and analysis for
potential impact and identification of critical network links. Upon execution of the “what-if”
scenario, the Cisco ANA fabric initiates an end-to-end flow, which determines all the potentially
affected edges.
For more information about fault scenarios which are considered as service affecting in an MPLS
network and supported by Cisco ANA, refer to the Cisco Active Network Abstraction MPLS User Guide.
Cisco Active Network Abstraction Fault Management User Guide, Version 3.6 Service Pack 1
OL-14284-01
7-1
Chapter 7
Impact Analysis
Impact Report Structure
Note
Each fault which has been identified as potentially service affecting triggers a generation of impact
analysis calculation event if it is reoccurring in the network.
This chapter describes the automatic impact analysis. For more information about proactive impact
analysis, refer to the Cisco Active Network Abstraction NetworkVision User Guide.
Impact Report Structure
The impact report contains a list of pairs of endpoints when the service between them has been affected.
Each endpoint has the following details:
Note
•
Endpoint physical or logical location—An endpoint can be a physical entity (for example, a port)
or a logical one (for example, a subinterface). The impact report contains the exact location of the
entity. All the location identifiers start with the ID of the device which holds the endpoint. The other
details in the location identifier are varied according to the endpoint type, for example VC, VP, IP
interface.
•
Business tag properties—Key, name, type (if attached to the entity).
For specific information about the report structure in MPLS networks, refer to the Cisco Active Network
Abstraction MPLS User Guide.
Affected Severities
In automatic mode, the affected parties can be marked with one of the following severities:
•
Potentially affected—The service might be affected but its actual state is not yet known.
•
Real affected—The service is affected.
•
Recovered—The service is recovered. This state relates only to entries that were marked previously
as potentially affected. It indicates only the fact that there is an alternate route to the service,
regardless of the service quality level.
•
The initial impact report might mark the services as either potentially or real affected. As time
progresses and more information is accumulated from the network, the system might issue
additional reports to indicate which of the potentially affected parties are real or recovered.
•
The indications for these states are available both through the API and in the GUI.
Note
The reported impact severities vary between fault scenarios. For more information about fault scenarios
in an MPLS network see the Cisco Active Network Abstraction MPLS User Guide.
Note
There is no clear state for the affected services when the alarm is cleared.
Cisco Active Network Abstraction Fault Management User Guide, Version 3.6 Service Pack 1
7-2
OL-14284-01
Chapter 7
Impact Analysis
Impact Analysis GUI
Impact Analysis GUI
The Impact Analysis GUI is available in Cisco ANA NetworkVision and displays the list of affected
service resources which are embedded in the ticket information. This section describes this list.
Affected Parties Tab
The Affected Parties tab displays the service resources (affected pairs) that are affected (automatic
impact analysis) for an event, an alarm, or a ticket depending on which properties window is opened. In
the case of an alarm or a ticket, NetworkVision automatically calculates the accumulation of affected
parties of all the subsequent events. For more information about accumulating affected parties, see
Viewing a Detailed Report For the Affected Pair, page 7-4.
The Affected Parties tab is displayed below.
Figure 7-1
Affected Parties Tab
The Affected Parties tab is divided into two areas, Source and Destination. The Source area displays the
set of affected elements, A side and Z side. The following columns are displayed in the Affected Parties
tab providing information about the affected parties:
•
Location—A hyperlink that opens the Inventory window, highlighting the port with the affected
parties.
•
Key—The unique value taken from the affected element’s business tag key, if it exists.
Cisco Active Network Abstraction Fault Management User Guide, Version 3.6 Service Pack 1
OL-14284-01
7-3
Chapter 7
Impact Analysis
Impact Analysis GUI
•
Name—The subinterface (site) name or business tag name of the affected element, if it exists. For
more information, refer to the Cisco Active Network Abstraction Managing MPLS User Guide.
•
Type—The business tag type.
•
IP Address—If the affected element is an IP interface, the IP address of the subinterface site is
displayed. For more information, refer to the Cisco Active Network Abstraction Managing MPLS
User Guide.
•
Highest Affected Severity—The severest affected severity for the affected pair (destination). The
same source can be part of multiple pairs, and therefore each pair can have different affected
severities. The highest affected severity reflects the highest among these. The affected pair can have
one of the following severities:
– Potential
– Real
– Recovered
– N/A—From the Links view this indicates not relevant.
When an affected side (a row) is selected in the Source area, the selected element’s related affected pairs
are displayed in the Destination area.
The following additional columns are displayed in the Destination area table in the Ticket Properties
window:
•
Affected Severity—The severity of the affected pair as calculated by the client according to the
rules defined above.
•
Alarm Clear State—An indication for each pair of the clear state of the alarm. The following states
exist:
– Not cleared—There are one or more alarms that have not been cleared for this pair.
– Cleared—All the related alarms for this pair have been cleared.
In addition, you can view a detailed report for every affected pair that includes a list of the events that
contributed to this affected pair.
Viewing a Detailed Report For the Affected Pair
You can view a detailed report for every affected pair in NetworkVision. The detailed report includes a
list of the events that contributed to the affected pair.
For information about how to reach a detailed affected report, refer to the Cisco Active Network
Abstraction NetworkVision User Guide.
The Affected Parties Destination Properties dialog box is displayed.
Cisco Active Network Abstraction Fault Management User Guide, Version 3.6 Service Pack 1
7-4
OL-14284-01
Chapter 7
Impact Analysis
Impact Analysis GUI
Figure 7-2
Detailed Report For the Affected Pair
The following fields are displayed at the top of the Affected Parties Destination Properties dialog box:
•
Affected Pair—The details of A side and Z side of the affected pair.
•
Alarm Clear State—An indication for each pair of the clear state of the alarm. The following states
exist:
– Not Cleared—There are one or more alarms that have not been cleared for this pair.
– Cleared—All the related alarms for this pair have been cleared.
•
Affected Severity—The severity of the affected pair as calculated by the client according to the
rules defined in Viewing a Detailed Report For the Affected Pair, page 7-4.
•
Name—The name of the destination from which you opened the detailed report.
Each row in the Instances table represents an event that was reported for the affected pair. The following
columns are displayed in the Instances table of the Affected Parties Destination Properties dialog box:
•
Alarm OID—The ID of the alarm to which the event is correlated as a hyperlink to the relevant
alarm’s properties.
•
Alarm Description—A description of the alarm to which the event is correlated.
•
Alarm Clear State—The alarm’s calculated severity.
•
Event OID—The ID of the event as a hyperlink to the relevant event’s properties.
•
Event Description—A description of the event.
•
Event Time Stamp—The event’s time stamp. The date and time of the event.
•
Affected Severity—The actual affected severity of the pair that was reported by the selected event.
Cisco Active Network Abstraction Fault Management User Guide, Version 3.6 Service Pack 1
OL-14284-01
7-5
Chapter 7
Impact Analysis
Disabling Impact Analysis
Disabling Impact Analysis
You can disable impact analysis for a specific alarm. This option can be set in the Cisco ANA Registry.
If impact analysis is disabled the system will report the event with no impact information. The settings
can be changed dynamically during system runtime.
The following alarms can be disabled:
•
Link down
•
Port down
•
Dropped or discarded packets
•
MPLS black hole
•
BGP neighbor loss
•
MPLS TE tunnel down
•
L2 tunnel down
Accumulating Affected Parties
This section describes how NetworkVision automatically calculates the accumulation of affected parties
during automatic impact analysis. This information is embedded in the ticket along with all the
correlated faults.
In the example below the following types of alarms exist in the correlation tree:
•
Ticket root-cause alarm (Card out).
•
An alarm which is correlated to the root cause and has other alarms correlated to it (Link A down).
•
An alarm with no other alarms correlated to it (Link B down and BGP neighbor loss).
An event sequence is correlated to each of these alarms.
Correlation Tree Example
Card out
|
----- Link A down
| |
| ------BGP neighbor loss
|
----- Link B down
180110
Figure 7-3
NetworkVision provides a report of the affected parties for each type of alarm. This report includes the
accumulation of:
•
The affected parties reported on all the events in the alarm event sequence. This also applies to
flapping alarms.
•
The affected parties reported on the alarms that are correlated to it.
Each report includes the accumulation of the affected report of all the events in its own correlation tree.
For example, in the diagram:
•
BGP neighbor loss includes the accumulation of the affected report of its own event sequence.
Cisco Active Network Abstraction Fault Management User Guide, Version 3.6 Service Pack 1
7-6
OL-14284-01
Chapter 7
Impact Analysis
Accumulating Affected Parties
•
Link A down includes the accumulation of the report of its own event sequence. It also includes the
report of the BGP neighbor loss.
Accumulating the Affected Parties In an Alarm
When there are two events that form part of the same event sequence in a specific alarm, the reoccurring
affected pairs are only displayed once in the Affected Parties tab. Where there are different affected
severities reported for the same pair, the pair is marked with the severity that was reported by the latest
event, according to the time stamp.
Accumulating the Affected Parties In the Correlation Tree
Where there are two or more alarms that are part of the same correlation tree, that report on the same
affected pair of edgepoints, and have different affected severities, then the reoccurring affected pairs are
only displayed once in the Affected Parties tab. Where there are different affected severities reported for
the same pair, the pair is marked with the highest severity.
In this example, X and Y are the OIDs of edgepoints in the network and there is a service running
between them. Both of the alarms, link B down and BGP neighbor loss, report on the pair X<->Y as
affected:
•
Link B down reports on X<->Y as potentially affected.
•
BGP neighbor loss reports on X<->Y as real affected.
The affected severity priorities are:
•
Real—Priority 1
•
Recovered—Priority 2
•
Potentially—Priority 3
Card out reports on X<->Y as real, affected only once.
Updating Affected Severity Over Time
Cisco ANA can update the affected severity of the same alarm report over time due because in some
cases, the affect of the fault on the network cannot be determined until the network has converged.
For example, a link-down alarm creates a series of affected severity updates over time. These updates
are added to the previous updates in the system database. In this case, the system provides the following
reports:
•
The first report of a link down reports on X<->Y as potentially affected.
•
Over time the VNE identifies that this service is real affected or recovered, and generates an updated
report.
•
The Affected Parties tab of the Ticket Properties dialog box displays the latest severity as real
affected.
•
The Affected Parties Destination Properties dialog box displays both reported severities.
This functionality is currently only available in the link-down scenario in MPLS networks.
Cisco Active Network Abstraction Fault Management User Guide, Version 3.6 Service Pack 1
OL-14284-01
7-7
Chapter 7
Impact Analysis
Accumulating Affected Parties
Cisco Active Network Abstraction Fault Management User Guide, Version 3.6 Service Pack 1
7-8
OL-14284-01
A P P E N D I X
A
Supported Service Alarms
This appendix provides the list of service alarms that are supported by Cisco ANA 3.6.
Note
If the source of the alarm is an interface with technology which is not supported by Cisco ANA, then the
alarm will not be generated.
Note
If the source of the alarm is an entity which is not modeled by Cisco ANA, for example, an unsupported
module, then the alarm will not be generated.
The columns displayed in Table A-1 relate to the configuration parameters described in this guide. For
more information about these parameters, see Event (Sub-Type) Configuration Parameters, page 6-2.
The following table lists the supported service alarms:
Table A-1
Service Alarms
Item Name
1
2
Description
HSRP group status
changed
•
Primary HSRP
interface is not
active/Primary
HSRP interface
is active
Sent when an active HSRP
group member is not active
anymore, a link was shut
down
•
Secondary
HSRP interface
is not active/
Secondary
HSRP interface
is active
Secondary member of an
HSRP group is active.
BGP process down/
BGP process up
When the BGP process is
shut down on a device.
is-correlation
-allowed
correlate is-ticketable severity
weight
true
true
true
MAJOR
720
true
false
true
CRITICAL 850
Cisco Active Network Abstraction Fault Management User Guide, Version 3.6 Service Pack 1
OL-14284-01
A-1
Appendix A
Table A-1
Service Alarms (continued)
is-correlation
-allowed
correlate is-ticketable severity
weight
Sent when all IP interfaces
configured above a physical
port change operating status
to down.
true
true
true
MAJOR
750
Sent when an IP interface
changes operating status to
down.
true
true
true
MAJOR
Item Name
Description
3
All ip interfaces
down
Active ip interfaces
found
4
Interface status
down/up
5
•
interface status
Sent when an IP interface
down connection changes operating status to
down on a point to point link.
500
•
interface status
down non
connection
Sent when an IP interface
changes operating status to
down on a multipoint link.
700
•
interface status
down GRE
tunnel
Sent when an IP interface
changes operating status to
down on a GRE tunnel link.
45
Card out/in
•
6
Supported Service Alarms
sub card out
Link down/up
Card in, card out.
true
true
true
MAJOR
Sub card out.
Link down, link up.
100 000
1000
true
true
•
link down due to Sent when an administrator
admin down
shuts down one of the ports
on one of the ends.
false
•
link down due to Sent when a card is removed
card
from one of the sides.
true
•
link down due to Sent when there is an
oper down
operational error between the
endpoints.
true
•
link down on
unreachable
Sent when one of the devices
is unreachable.
true
•
link down
flapping
Sent when a link is down and
is in a flapping state.
true
true
CRITICAL 850
7
Component
Unreachable
The component is no longer
reachable.
true
true
true
MAJOR
600
8
CPU Over Utilized
The device CPU percentage
has passed the configured
threshold.
false
false
true
MAJOR
0
9
Memory Over
Utilized
The device memory
utilization has passed the
configured threshold.
false
false
true
MAJOR
0
10
Device Unsupported
The device is not supported in false
Cisco ANA.
false
true
CRITICAL 0
Cisco Active Network Abstraction Fault Management User Guide, Version 3.6 Service Pack 1
A-2
OL-14284-01
Appendix A
Table A-1
Supported Service Alarms
Service Alarms (continued)
is-correlation
-allowed
correlate is-ticketable severity
weight
The port discard packets
value has passed the
configured settings.
false
true
true
MINOR
0
Dropped Packets
The port dropped packets
value has passed the
configured settings.
false
false
true
MINOR
0
13
MPLS interface
removed/MPLS
interface added
When the MPLS interface is true
removed and there is no
MPLS TE tunnel on the same
interface.
false
true
MAJOR
700
14
Card Down/Up
When the card status changes true
from an OK state, to a
non-OK state (whether this
state is admin-down, disable,
loading-IOS etc.).
false
true
MAJOR
100 000
15
Port Down
Port down.
false
true
MAJOR
100 000
Item Name
Description
11
Discard Packets
12
true
•
Port down card
out
The port is down as the entire
card is out.
true
900
•
Port down
flapping
The port is down and is in a
flapping state.
false
100 000
16
Rx Over Utilized
The percentage of the traffic
on the port passed the
configured threshold.
false
true
true
MINOR
0
17
Tx Over Utilized
The percentage of the traffic
on the port passed the
configured threshold.
false
true
true
MINOR
0
18
BGP Neighbor Loss
When a BGP neighbor’s state true
has changed from established
to any other state or an entry
is found for a neighbor that
no longer exists.
true
true
MAJOR
800
19
Cloud Problem
A problem in an unmanned
segment.
false
true
MAJOR
2000
20
Broken LSP
discovered
When the MPLS black hole’s false
backward flow meets LSE
components on the edge of
the core.
true
true
MAJOR
0
21
MPLS Black hole
found
true
When a BGP (destination)
entry in the label switching
table becomes untagged. This
event is created per outgoing
interface and nextHop.
true
true
WARNIN
G
650
22
Layer 2 Tunnel Down When a martini tunnel goes
down.
true
true
MINOR
0
true
false
Cisco Active Network Abstraction Fault Management User Guide, Version 3.6 Service Pack 1
OL-14284-01
A-3
Appendix A
Supported Service Alarms
Shelf Out
Table A-1
Service Alarms (continued)
is-correlation
-allowed
correlate is-ticketable severity
weight
When a traffic engineering
tunnel goes down.
true
true
true
MAJOR
800
LDP Neighbor
Down/Up
If a session to an LDP
neighbor goes down as the
result of a failure in the TCP
connection used by the LDP
session, or if the interface is
no longer running MPLS.
true
true
true
MAJOR
670
25
GRE Tunnel Down/
GRE Tunnel Up
true
When the state of an IP
interface for a GRE tunnel
edge is identified as Down or
Up.
true
true
MAJOR
50
26
Shelf Out
A shelf was removed from a
network element.
true
false
true
MAJOR
110000
27
Rx Dormant
The traffic received by the
port (measured as a
percentage) dropped below
the configured threshold.
false
false
true
MINOR
0
28
Tx Dormant
The traffic transmitted by the false
port (measured as a
percentage) dropped below
the configured threshold.
false
true
MINOR
0
29
Link Over Utilized
The traffic on the link
(measured as a percentage)
exceeded the configured
threshold.
true
true
MINOR
0
Item Name
Description
23
MPLS TE Tunnel
Down/Flapping
24
Note
true
The service alarms specified in this guide are VNE-related and therefore the level of support provided
for each technology may vary. The user should refer to the Virtual Network Element Reference Guide for
details.
Shelf Out
A Shelf out alarm is issued when a shelf is removed from a network element. This alarm applies only to
network elements that support removable or subtended shelves, such as the ECI HiFocus and the Alcatel
ASAM. The Shelf in alarm is issued after the problem has been fixed.
Cisco Active Network Abstraction Fault Management User Guide, Version 3.6 Service Pack 1
A-4
OL-14284-01
Appendix A
Supported Service Alarms
Rx Dormant
Rx Dormant
An Rx Dormant alarm is issued when the traffic received over a physical port (measured as a percentage
of the port’s capacity) drops below a predefined threshold. The alarm description includes the current
traffic percentage compared with the defined threshold. This alarm provides service providers with a
method for identifying customer services that have slowed down significantly or stopped altogether. An
Rx Dormant Normal alarm is issued after the traffic percentage exceeds a predefined upper threshold.
By default, the Rx Dormant alarm is disabled. This alarm is enabled and its thresholds are configured
using the Cisco ANA Registry Editor.
Note
Changes to the registry should be carried out only with the support of Cisco Professional Services.
Tx Dormant
A Tx Dormant alarm is issued when the traffic transmitted over a physical port (measured as a percentage
of the port’s capacity) drops below a predefined threshold. The alarm description includes the current
traffic percentage compared with the defined threshold. This alarm provides service providers with a
method for identifying customer services that have slowed down significantly or stopped altogether. A
Tx Dormant Normal alarm is issued after the traffic percentage exceeds a predefined upper threshold.
By default, the Tx Dormant alarm is disabled. This alarm is enabled and its thresholds are configured
using the Cisco ANA Registry Editor.
Link Over Utilized
A link over utilized alarm is issued when the traffic transmitted over a port that is connected to another
port via a network link (measured as a percentage of the port’s capacity) exceeds a predefined threshold.
The port over utilization alarm is correlated into a link over utilized alarm. If the ports at both ends of a
link are overutilized, the two port over utilization alarms are correlated into a single link over utilization
alarm. The alarm description includes the direction of the overutilization. A link utilization normal alarm
is issued when the utilization level falls below a predefined threshold. The overutilization thresholds are
configured using the Cisco ANA Registry Editor.
Cisco Active Network Abstraction Fault Management User Guide, Version 3.6 Service Pack 1
OL-14284-01
A-5
Appendix A
Supported Service Alarms
Link Over Utilized
Cisco Active Network Abstraction Fault Management User Guide, Version 3.6 Service Pack 1
A-6
OL-14284-01
A P P E N D I X
B
Event and Alarm Correlation Flow
This chapter describes in detail the flow of alarms and events during the correlation process.
•
Software Function Architecture—Provides an event correlation flow diagram.
•
Event Correlation Flow—Includes the following sections:
– Event Creation (VNE level)
– Event Correlation
– Correlation Logic (Event Correlator)
– Alarm Sending (Event Correlator)
– Post-Correlation Rule (Event Correlator)
Cisco Active Network Abstraction Fault Management User Guide, Version 3.6 Service Pack 1
OL-14284-01
B-1
Appendix B
Event and Alarm Correlation Flow
Software Function Architecture
Software Function Architecture
Figure B-1
Event Correlation Flow (VNE level)
New Event
Event
Correlation
Application
If
correlation
enabled
Read Registry
parameters
No
Continue
Yes
Store alarm
for future
correlation
to it
Yes
Is
correlation
allowed
Send
alarm to
gateway
Pass to event
correlation
application
No
Correlate
Yes (correlation delay
of two minutes)
Wait for
flow
results
Start
correlation
flow
Flow
Flow or
correlation by
key
Correlation by key
Send alarm
to gateway
Correlation by
key
Send to
gateway
Pass control
bark to
Event
Manager
182784
Post
correlation
Cisco Active Network Abstraction Fault Management User Guide, Version 3.6 Service Pack 1
B-2
OL-14284-01
Appendix B
Event and Alarm Correlation Flow
Event Correlation Flow
Event Correlation Flow
Event Creation (VNE level)
An event (EventCorrelationData) is created in the VNE level by three different sources:
•
Device Component (DC)—When processing service alarms.
•
EventProcessor—After parsing Syslog and SNMP trap.
•
TCA Extension—After identifying a change in a property in the IMO.
The EventCorrelationData holds the following information:
Table B-1
Event Correlation Data Parameters
Name
Description
Type
Event Type
The type of the event. Alarms with the same Source and String
Event Type will be considered as a single alarm.
Event Sub Type
The sub type of the event (identifies the exact event
definition that needs to be loaded).
String
Source
The OID of the IMO on which the event occurred on.
Oid
Correlation key
The object used for correlation
Correlation key
array
iFlowForwardData
All forwarding data for the flow (if activate-flow is
enabled).
iFlowForwardData
Event time
The time the event occurred (as determined in the VNE). Long
Description
A description of the event.
String
Event Correlation
Local Correlation (Event Correlator)
Local correlation will be performed if the correlate flag is set true and after waiting the time specified
by the correlation-delay value.
The event correlation key is used to extract alarms that were waiting for correlation on that specific key.
If alarms with the same correlation key exist the correlation logic is invoked to determine the best
candidate of the locally available alarms. If the event did not find an alarm to correlate to, it will be put
into the waiting for correlation event queue with its respective correlation key.
Network Correlation (Event Correlator, Flow)
Network correlation will be performed if the event has the activate_flow flag set to true. The following
actions will be executed:
1.
The Event Correlation application receives an event and it checks the correlation delay depending
on whether it is box-level or flow-level correlation.
Cisco Active Network Abstraction Fault Management User Guide, Version 3.6 Service Pack 1
OL-14284-01
B-3
Appendix B
Event and Alarm Correlation Flow
Event Correlation Flow
If it is box-level correlation the event is stored in the application for the correlation delay period and
during this period collects all possible root causes having the same correlation delay.
If it is flow-level correlation, then the flow will start after the correlation delay.
2.
The flow starting and ending points are defined by the event correlation parameters (see Table B-1).
3.
After the flow finishes it will get a message that contains all the collected alarms. Alarms are
collected on every DC that the flow intercepts regardless of the original correlation key of the event
that triggered it.
Correlation Logic (Event Correlator)
The correlation logic is used for determining the most fitting alarm to serve as a root cause for the
specified event. It selects from the alarms, the most fitting alarm (root cause), based on the correlation
filters and selects the root cause method.
Alarm Sending (Event Correlator)
Once an event has gone through the correlation process it will be transformed into an alarm and will be
sent to the gateway.
Post-Correlation Rule (Event Correlator)
The post-correlation rule is used for performing logic which needs to be performed after the event had
been sent. Usually the post-correlation rule is used for triggering additional behaviors such as search for
affected services that where influenced by the alarm.
Cisco Active Network Abstraction Fault Management User Guide, Version 3.6 Service Pack 1
B-4
OL-14284-01