1
MEMORY AND THREAD DEBUGGER
Intel® Inspector XE 2013
Product Brief
Top Features
Deliver More Reliable Applications
Inspect C, C++, C# and Fortran
Intel® Inspector XE 2013 is an easy to use dynamic memory and threading error detector for
Windows* and Linux*. Enhance productivity, cut cost and speed time-to-market.
No special builds required. Use
your normal compiler and build.
Inspects all code, even if the
source is unavailable
Highlights the error at multiple
source code locations, provides
corresponding call stacks
New! Debugger breakpoints for
easier diagnosis of difficult bugs
New! Heap growth analysis finds
cause of heap growth in a
problematic region
Find memory and threading defects early in the development cycle. The earlier an error is
found, the lower the cost. Intel Inspector XE makes it easy to find and diagnose errors early.
Find errors that traditional regression testing and static analysis miss. Intel Inspector XE
finds latent errors on the executed code path plus intermittent and non-deterministic errors,
even if the error-causing timing scenario does not happen.
Memory Errors
Threading Errors
Memory leaks
Data races
Memory corruption and Illegal Accesses
- Heap races
Allocation / de-allocation API mismatches
- Stack races
Inconsistent memory API usage
“We struggled for a week with a
crash situation, the corruption was
identified but the source was
really hard to find. Then we ran
Intel® Inspector XE and
immediately found the array out of
bounds that occurred long before
the actual crash. We could have
saved a week!”
Mikael Le Guerroué,
Senior Codec Architecture Engineer,
Envivio
Deadlocks
C, C++, C# and Fortran. Or any mix. Is your GUI in C# with performance sensitive code in C++?
Got legacy code in Fortran? Using libraries without the source? No problem, it all works.
Dynamic instrumentation enables inspection of all code including third party libraries where the
source is not available.
Fits your workflow. No special compilers or builds are required, just use your normal debug or
production build. Inspect the same code you are debugging and shipping. Use the graphical
user interface or automate regression testing with the command line. The user interface can be
used standalone on both Windows* and Linux* or integrated with Microsoft Visual Studio*.
Bonus: Get static analysis and pointer checker features when you buy a suite. The Intel®
compiler is not required to use Intel Inspector XE, but you do get additional Intel compiler-based
features when you purchase a suite. Static analysis finds security issues. Pointer Checker is a
compiler-based diagnostic that traps memory accesses beyond allocated addresses.
Intel Inspector XE is included in
these suites:
Intel® Parallel Studio XE
Intel® C++ Studio XE
Intel® Fortran Studio XE
Intel® Cluster Studio XE
OS Support:
Windows*
Linux*
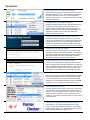
Intel Inspector XE takes you to the source locations of threading and memory errors and provides a call
stack to help you determine how you got there.
Top Features
Choose Your Level - Go Fast or Be Thorough
The first level of analysis has very little overhead. Use it during
development because it is fast. The second level (shown) takes
more time and detects more issues. It is often used before
checking in a new feature. The third level is great for regression
testing and finding bugs.
Debugger Breakpoints Simplify Diagnosis
Debugger breakpoints make it easier to diagnose difficult errors
by breaking into the debugger just before the error occurs.
Examine variables and look at other threads to diagnose the
problem. Microsoft Visual Studio*, GDB and IDB debuggers are
supported. Just select the error and choose “Debug This
Problem” from the pop-up menu.
Analyze Heap Growth + New “Instant” leak report
Puzzled about what is causing your memory use to grow and
grow as your app continues to run? Heap growth analysis helps
you diagnose the cause. Get an instant heap growth report of
allocations not deallocated since the last baseline. New! Now
you can also get an instant report of leaks since the last baseline.
Speed Analysis with Pause/Resume
Pause/Resume Speeds Up Analysis
__itt_suppress_push(__itt_suppress_threading_errors);
/* Any threading errors here will be seen */
Speed-up analysis by limiting its scope. Turn on analysis only
during the execution of the suspected problem. Instrumentation
overhead is reduced to speed through long irrelevant sections of
code. Used carefully, this can be very powerful in situations
where long run times are required to reach the error.
Precise Suppressions Remove False Errors Safely
Suppress False Errors, Share with the Team
Suppression = {
Name = "Example";
Type = { uninitialized_memory_access }
Stacks = {
{
mod=a.out, func=update_x;
func=main;
False errors are easily added to a suppression list so you don’t
need to investigate them next time. Multiple lists are supported
and can be shared with other project members. Create your own
private suppressions to block errors that are not in your code.
Suppressing an entire module can also reduce collection time.
/* Any threading errors here will be ignored */
__itt_suppress_pop();
Team Collaboration
Each error reported contains state information (New, Confirmed,
Fixed, Not Fixed, Regression, Not a Problem, Deferred) to help
you sort and prioritize errors. State information from multiple
developers can now be merged and shared. Users can optionally
comment on errors to explain why a certain state was set.
Filters Manage the Error List
Just want to see the errors from your source file? Just click and
only those errors are shown. Working through the new errors
and only want to see the highest severity? Just click. Filters are
available for many categories: Severity, problem type, state,
module, etc. They weed out the noise and let you focus on what
is most important.
Find difficult to diagnose out-of-bounds accesses
Pointer Checker** is a compiler-based diagnostic that traps
memory accesses beyond allocated addresses. Find dangling
pointers, buffer overflows, etc. Speed-up diagnosis by breaking
into the debugger when the exception occurs.
**Bonus feature available when purchased as a part of one of the Intel® Parallel Studio XE family of tool suites (see page 4).
Details
Fewer False Positives, Better Error Messages
Intel® Inspector XE understands the semantics of the Intel® Threading Building Blocks (Intel® TBB), Intel® OpenMP and Intel® Cilk™ Plus parallel
programming models. This saves time.
1) It reports fewer false positives than competitive products.
2) Errors are described using familiar terms from the source, not with cryptic internal runtime labels.
Dynamic Instrumentation: Simple, Reliable, Accurate
Unlike other memory and threading analysis tools, Intel Inspector XE never requires any special recompiles for analysis. Just use your normal
debug or production build. (Include symbols so we can map to the source.) This not only makes your workflow faster and easier, it increases
reliability and accuracy. Competitive products that use static compilation based instrumentation techniques struggle with dynamically
generated or linked code. Intel Inspector XE inspects all code including third party libraries where the source is not available.
Multi-OS (Windows* & Linux*) – Same User Interface
Are you developing for both Windows* and Linux*? Wouldn’t it be easier to use the same analysis tools for both OSs? Intel Inspector XE has
the same user interface on both Windows and Linux. On Windows it can be used stand alone or integrated with Microsoft Visual Studio*.
Analyze MPI Applications for Memory and Threading Errors
With the advent of multicore and hyperthreading, some MPI applications are adding thread parallelism. Intel Inspector XE can be used to find
both memory and threading errors on MPI applications. Performing an initial analysis on a single shared memory system will identify many
errors, and additional analysis can also be run on a cluster. Results are sorted by rank.
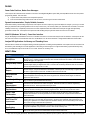
What’s New
Feature
Benefit
Debugger
Breakpoints
Debugger breakpoints make it easier to diagnose difficult errors by breaking into the debugger just before
the error occurs. Examine variables and look at other threads to diagnose the problem. Visual Studio, GDB
and IDB debuggers are supported.
Puzzled about what is causing your memory use to grow and grow as your app continues to run? Heap
growth analysis helps you diagnose the cause. It creates a list of memory allocations that are not freed in
an interval specified with the GUI or an API.
Ask for a leak report any time during the run of the program and get it immediately. Set/reset a baseline
for leak analysis – see just the leaks since the baseline. This lets you focus on leaks only in a given section
of time or a given section of the code. Available via GUI buttons or API calls.
Speed-up analysis by limiting its scope. Use an API to turn on analysis only during the execution of the
suspected problem. Used carefully, this can be very powerful in situations where longer run times are
required to reach the error.
Eliminate false errors and speed up analysis by using an API to mark memory that should not be analyzed
(e.g., it contains a synchronization data structure)
Analyze Heap Growth
On-Demand Leak
Report
Pause/Resume
Analysis
Limit Analysis Range
Precision
Suppressions
Compatible
Suppressions
Better Team
Collaboration
Inspect Software for
Intel® Xeon Phi™
coprocessor
Analyze MPI
Applications
OpenMP 4.0
Choose the exact stack frame or frames to suppress. Eliminate the false error without suppressing
potential real errors. Share suppressions with your team.
Import suppression lists from other popular memory debuggers like Purify* and Valgrind*. Use Intel
Inspector XE without wasting time recreating suppression lists. Now in an easy to edit text format.
State information for the errors (confirmed, not a problem, fixed, not fixed, etc.) that is changed by
multiple team members can be merged and shared. Team communication is improved with comments on
state information.
Intel Inspector XE can be used to analyze software for Intel® Xeon Phi™ coprocessor even though the
analysis does not run on Intel Xeon Phi coprocessor. Inspecting your application with Intel Inspector XE
running your application on a multicore processor will detect memory errors and threading errors that will
occur when running on Intel Xeon Phi coprocessor.
Find memory errors on MPI applications. Find memory and threading errors on hybrid applications written
using MPI and OpenMP. Easy install on a cluster. View results sorted by rank.
Inspector XE understands the semantics of OpenMP so it can report errors in familiar terms from the
source, not with cryptic internal runtime labels and reports fewer false errors.
– New since the original gold release. New features are continuously released in product updates, free with a current support subscription
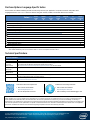
Purchase Options: Language Specific Suites
Several suites are available combining the tools to build, verify and tune your application. The product covered in this product brief
is highlighted in blue. Named-user or multi-user licenses along with volume, academic, and student discounts are available.
Intel® C / C++ Compiler
Intel®
Cluster
Studio
XE
Intel®
Parallel
Studio
XE
Intel® Fortran Compiler
Intel® Integrated Performance Primitives3
Intel® Math Kernel Library3
Intel® Cilk™ Plus
Intel® Threading Building Blocks
Intel® Inspector XE
Intel® VTune™ Amplifier XE
Intel® Advisor XE
Static Analysis
Intel® MPI Library
W, L
W, L
W, L
Components
Suites >>
Intel® Trace Analyzer & Collector
Rogue Wave IMSL*
Intel®
Fortran
Studio
XE
Intel®
Composer
XE
Intel®
C++
Composer
XE
Intel®
Fortran
Composer
XE
W, L
W, L, O
Library2
Operating System1
Note:
Intel®
C++
Studio
XE
W, L
W, L, O
1 Operating
3
System: W=Windows, L= Linux, M= OS X*. 2 Available in Intel® Visual Fortran Composer XE for Windows with IMSL*
Not available individually on OS X, it is included in Intel® C++ & Fortran Composer XE suites for OS X
Technical Specifications
Specs at a Glance
Processor Support
Intel® processors and compatible processors when analyzing applications containing Intel® instructions.
Operating Systems
Windows* and Linux*
Development
Tools and
Environments
Compatible with compilers from vendors that follow platform standards (e.g., Microsoft*, GCC, Intel compilers).
Can be integrated with Microsoft Visual Studio* 2008, 2010 and 2012.
See http://www.intel.com/software/products/systemrequirements for the latest details.
Programming
Languages
C, C++, C#, Fortran.
System
Requirements
See http://www.intel.com/software/products/systemrequirements for details
Support
All product updates, Intel® Premier Support services and Intel® Support Forums are included for one year. Intel Premier Support gives
you secure, web-based, engineer-to-engineer support.
Community
Join the Intel® Support Forums community to learn, contribute, or just browse!
http://software.intel.com/en-us/forums
Learn more about Intel Inspector XE
Download a free 30-day evaluation
Click or enter the link below:
http://intel.ly/inspector-xe
Click or enter the link below:
http://intel.ly/sw-tools-eval
Or scan the QR code on the left
Click on ‘Memory and Thread Debuggers’ link
Optimization Notice
Notice revision #20110804
Intel’s compilers may or may not optimize to the same degree for non-Intel microprocessors for optimizations that are not unique to Intel microprocessors.
These optimizations include SSE2, SSE3, and SSSE3 instruction sets and other optimizations. Intel does not guarantee the availability, functionality, or
effectiveness of any optimization on microprocessors not manufactured by Intel. Microprocessor-dependent optimizations in this product are intended for use
with Intel microprocessors. Certain optimizations not specific to Intel microarchitecture are reserved for Intel microprocessors. Please refer to the applicable
product User and Reference Guides for more information regarding the specific instruction sets covered by this notice.
© 2013, Intel Corporation. All rights reserved. Intel, the Intel logo, VTune, Cilk, Xeon Phi and Xeon are trademarks of Intel
Corporation in the U.S. and other countries. *Other names and brands may be claimed as the property of others.
Intel_Inspector_XE_2013_PB/Rev082213