1
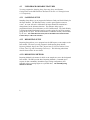
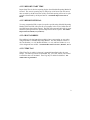
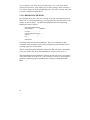
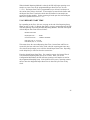
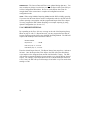
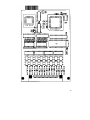
OWNER'S MANUAL
________________
MODEL V79 PDI-1 AND V80 PDI-2
SWITCH INPUT AND OPTICALLY
ISOLATED INPUT MODULES
BayTech Publication #U140E105
Thank you for selecting a BayTech Model V79 PDI-1 Switch Input Module or
Model V80 PDI-2 Optically Isolated Input Module.
The data provided in this Owner's Manual explains the various ways you can
operate the V79 PDI-1 or V80 PDI-2, and how to configure your unit. We
suggest that you read this manual carefully before attempting to install a PDI, and
that you place special emphasis on correct cabling and configuration. If you have
any problems with your installation, please contact a BayTech applications
engineer for assistance.
BayTech also manufactures other data communications devices that provide port
sharing and expansion, networking, port contention, buffered and non-buffered
printer sharing, network print servers, and statistical multiplexing. If you would
like information on any of these models, please contact BayTech Customer
Service.
We welcome any comments you may have about our products. And we hope that
you will continue to look to BayTech for your data collection and communications
needs.
NOTE: The information contained in this document is subject to change without
notice.
Copyright 1994 by Bay Technical Associates, Inc.
IBM, IBM PC, IBM PC/AT, IBM PC/XT are products and registered trademarks
of International Business Machines Corporation.
Hewlett-Packard LaserJet and Draftmaster I Plotter are products and registered
trademarks of the Hewlett-Packard Company.
TABLE OF CONTENTS
1
GENERAL............................................................................................................................................................................................ 1
1.1
1.2
2
SPECIFICATIONS............................................................................................................................................................................... 3
2.1
2.2
3
V79 PDI-1 SWITCH INPUT STATUS MODULE.................................................................................................... 3
V80 PDI-2 OPTICALLY ISOLATED INPUT MODULE ....................................................................................... 4
INSTALLATION................................................................................................................................................................................. 5
3.1
3.2
4
V79 PDI-1 MODULE.................................................................................................................................................. 2
V80 PDI-2 MODULE.................................................................................................................................................. 2
CABLING..................................................................................................................................................................... 5
PDI-2 AC INPUT SETUP........................................................................................................................................... 6
OPERATION ....................................................................................................................................................................................... 7
4.1
4.2
GENERAL.................................................................................................................................................................... 7
USER-PROGRAMMABLE FEATURES.................................................................................................................... 8
4.2.1
4.2.2
SAMPLING SETUP ............................................................................................................................ 8
REPORTING SETUP .......................................................................................................................... 8
4.2.2.1
4.2.2.2
4.2.2.3
4.2.2.4
4.2.2.5
4.2.2.6
4.2.3
4.3
DYNAMIC CONFIGURATION....................................................................................................... 10
DATA COMMANDS................................................................................................................................................. 10
4.3.1
4.3.2
4.3.3
4.3.4
4.3.5
4.3.6
4.3.7
4.3.8
4.3.9
4.3.10
4.4
4.5
REPORTING METHOD ............................................................................................. 8
REPORT START TIME............................................................................................... 9
REPORT INTERVAL.................................................................................................. 9
HOST ADDRESS ......................................................................................................... 9
TIME TAG ................................................................................................................... 9
TERMINATING CHARACTER(S) .......................................................................... 10
CLEAR EVENT BUFFER COMMAND ...........................................................................................
CLEAR EVENT COUNTER COMMAND.......................................................................................
CLEAR EVENT LATCH DATA ......................................................................................................
REPORT ALL BUFFERED EVENTS COMMAND ........................................................................
REPORT EVENT COUNTER COMMAND ....................................................................................
REPORT EVENT DURATION COMMAND..................................................................................
REPORT EVENT LATCH DATA COMMAND .............................................................................
REPORT EVENT COUNTER AND RESET COMMAND .............................................................
REPORT EVENT LATCH DATA AND RESET COMMAND ......................................................
REPORT A SINGLE BUFFERED EVENT COMMAND................................................................
12
12
12
13
13
13
14
14
14
15
EVENT SAMPLE REPORTING .............................................................................................................................. 15
EVENT SAMPLE PRESENTATION....................................................................................................................... 17
5
CONFIGURATION ........................................................................................................................................................................... 19
5.1
MENU-DRIVEN CONFIGURATION ..................................................................................................................... 19
5.1.1
5.1.2
5.1.3
5.1.4
5.1.5
5.1.6
5.2
21
22
22
23
5.1.4.1
5.1.4.2
5.1.4.3
5.1.4.4
5.1.4.5
5.1.4.6
24
25
26
27
27
28
REPORTING METHOD ...........................................................................................
REPORT START TIME.............................................................................................
REPORT INTERVAL................................................................................................
HOST ADDRESS .......................................................................................................
TIME TAG .................................................................................................................
TERMINATING CHARACTER(S) ..........................................................................
DYNAMIC CONFIGURATION....................................................................................................... 28
EXIT ................................................................................................................................................... 29
DYNAMIC CONFIGURATION PROCEDURE AND COMMANDS................................................................... 30
5.2.1
5.2.2
5.2.3
5.3
CONFIGURATION MAIN MENU ..................................................................................................
MODULE STATUS...........................................................................................................................
SAMPLING SETUP ..........................................................................................................................
REPORTING SETUP ........................................................................................................................
DEBOUNCE DELAY COMMAND ................................................................................................. 31
REPORTING METHOD COMMAND............................................................................................. 31
TIME TAG COMMAND................................................................................................................... 31
FRONT PANEL CONFIGURATION....................................................................................................................... 32
APPENDIX A
DATA/CONFIGURATION COMMAND SUMMARY ........................................................................................................................................... 33
APPENDIX B
EPROM UPGRADE .................................................................................................................................................................................................. 34
APPENDIX C
V79 PDI-1 MECHANICAL LAYOUT .................................................................................................................................................................... 35
APPENDIX D
V80 PDI-2 MECHANICAL LAYOUT .................................................................................................................................................................... 36
APPENDIX E
INDEX........................................................................................................................................................................................................................ 37
1
GENERAL
BayTech's PDI modules are designed for use with the M16 and M8 (DAC) Data
Acquisition Controllers. Both modules are used to detect events where an event is
defined as a change-in-state of an input and return to the original state. The V79
PDI-1 module is used for the detection of switch closure in applications requiring
notification of device status such as burglar alarms, fire alarms, event counters
and timers, process control, etc.. The V80 PDI-2 is used for the detection of
optically isolated voltage inputs in applications requiring industrial control of
motors, process monitoring, limit switch status, and the monitoring of relay status.
All events detected by either module are recorded as an event sample and sent to a
host computer/controller connected to a V71 host module. The current status of
input channels may be provided to the host computer/controller upon request.
Event samples or input channel status may be provided with a "time stamp" or
"Time Tag" which is available through the use of a "time-of-day" clock located in
the M16/M8 base unit. A time tag includes the month, day, year, hour, minute and
second the event occurred or the input channel status was taken.
Event status is supplied to the host computer/controller in one of the following
modes:
1)
2)
3)
Upon user request (COMMAND).
At a specific date/time (SCHEDULE).
Real time reporting of events (i.e., as events occur IMMEDIATE).
1
1.1
V79 PDI-1 MODULE
The main features of the V79 PDI-1 module are sixteen microprocessor-controlled
input channels that can be connected with individual ground returns, or a common
single-point ground. The input channels provide a flexible, reliable method to detect
and report the change-in-state of a circuit. The change can be from infinite
resistance (open) to continuity (closed), and vice versa. For example, the changein-state could be for a set of form C (dry) relays or switch contacts. Any change
in the status of individual or multiple inputs may be observed, recorded, reported,
analyzed, and acted upon. The level and type of actions desired or required are
easily selectable through the PDI-1's configuration menu.
Individual or multiple inputs may be polled for present status or configured to
automatically provide an alert message when a change-in-state is observed.
Momentary changes in an input's condition can be monitored and "latched" into
memory for post-action analysis. The reporting of false, or transient events can
be prevented by selection of programmable "debounce times". Input connections
to the PDI-1 are made through a standard DC-37F connector.
1.2
V80 PDI-2 MODULE
The primary feature of the PDI-2 series is sixteen microprocessor controlled,
optically isolated voltage inputs. The PDI-2A is designed for an input "on" voltage
range of 5 to 24 AC or DC volts and the PDI-2B for 100 to 130 AC or DC volts.
All inputs have 500V AC or DC electrical isolation from ground. Inputs are not
polarity sensitive. Therefore, paired signal inputs can be made using the "return"
or "input" terminal as the positive connection.
A mixture of AC and DC inputs can be selected by individual channels. For
example, Channel 1 could be a DC input, Channels 2 and 3 AC inputs, Channel 4 a
DC input, etc.. Dip switches are provided for selection of low-pass filtering
during AC input operation.
2
These optically isolated inputs provide an efficient means for the monitoring of
external process and control functions. All functions provided by the board are
programmable through a series of detailed configuration menus. Additional
functionality is made available through the use of BayTech or user provided
application software. Input connections to the PDI-2 are made through a standard
DC-37F connector.
2
SPECIFICATIONS
2.1
V79 PDI-1 SWITCH INPUT STATUS MODULE
(typical for 25o C unless otherwise noted)
INPUTS:
16 with individual ground returns or common (single-point)
ground.
DRIVE DISTANCE: Up to 1000 Ohms cable resistance, for
example: AWG 36 - 2400 ft., AWG 24 - 15000 ft., AWG 22 62000 ft.
POWER REQUIREMENTS: +5VDC, 40 ma typical (provided by
M16/M8 pwr supply).
DEBOUNCE: 0 to 60000 ms (software selectable).
ENVIRONMENTAL:
o
o
Operating temperature range: 0 to 70 C
o
o
Storage temperature range: -40 to 85 C
Humidity: 5% to 95% non-condensing
3
2.2
V80 PDI-2 OPTICALLY ISOLATED INPUT MODULE
MODULE TYPE
PDI-2A PDI-2B
NUMBER OF INPUTS:
16
16
INPUT VOLTAGE RANGE:
5-24
100-130
MAXIMUM INPUT CURRENT:
50ma
20ma
MINIMUM TURN ON CURRENT:8ma
8ma
MAX TURN ON TIME:
1ms
1ms
MAX TURN OFF TIME:
1ms
1ms
VOLTAGE ISOLATION:
AC/DC
500V
500V
(Input to Input and Input to ground)
POWER REQUIREMENTS: +5VDC, 40 ma typical (provided by
M16/M8 pwr supply)
DEBOUNCE TIME: 0 to 60000 ms (software selectable)
ENVIRONMENTAL:
o
o
Operating temperature range: 0 to 70 C
o
o
Storage temperature range: -40 to 85 C
Humidity: 5% to 95% non-condensing
4
3
INSTALLATION
The PDI-1 and PDI-2 are installed in the M Series chassis as described in Section
3.5 of the base unit operator's manual.
NOTE: The PDI-1 or PDI-2 cannot be installed as Module 1. If an PDI-1 or PDI-
2 is removed from a module slot and a different PDI-1 or PDI-2 is installed in that
location, the newly installed module acquires the previous module's configuration.
Moving an PDI-1 or PDI-2 to a different module location requires reconfiguration
because the configuration parameters are stored as a function of slot location and
module type. The configuration information does not stay with a relocated
module.
3.1
CABLING
The V79 PDI-1 and V80 PDI-2 modules each have a DC-37F connector.
Equipment connections for each module is similar. Each input of the V79 module
has a ground connection and each input of the V80 module has a return
connection. Figure 1 and Figure 2 below show the V79 and V80 connections
respectively.
Circuit Pin #
Connection
Circuit
Connection
Input #1 1 20 Ground #10
Ground #1 2 21 Input #11
Input #2 3 22 Ground #11
Ground #2 4 23 Input #12
Input #3 5 24 Ground #12
Ground #3 6 25 Input #13
Input #4 7 26 Ground #13
Ground #4 8 27 Input #14
Input #5 9 28 Ground #14
Ground #5 10 29 Input #15
Input #6 11 30 Ground #15
Ground #6 12 31 Input #16
Input #7 13 32 Ground #16
Ground #7 14 33 N.C.
Input #8 15 34 N.C.
Ground #8 16 35 N.C.
Input #9 17 36 N.C.
Ground #9 18 37 N.C.
Input #10 19
Circuit
Connection
Pin # Circuit
Connection
Input #1 1 20 Return #10
Return #1 2 21 Input #11
Input #2 3 22 Return #11
Return #2 4 23 Input #12
Input #3 5 24 Return #12
Return #3 6 25 Input #13
Input #4 7 26 Return #13
Return #4 8 27 Input #14
Input #5 9 28 Return #14
Return #5 10 29 Input #15
Input #6 11 30 Return #15
Return #6 12 31 Input #16
Input #7 13 32 Return #16
Return #7 14 33 N.C.
Input #8 15 34 N.C.
Return #8 16 35 N.C.
Input #9 17 36 N.C.
Return #9 18 37 N.C.
Input #10 19
Figure 1 : V 7 9 I n p u t C o n n e c t i o n s Figure 2 : V 8 0 I n p u t C o n n e c t i o n s
5
3.2
PDI-2 AC INPUT SETUP
The PDI-2 module has two banks of dip switches which are used to add ripple
filtering for AC inputs. AC input is selected by individual channel. Location of the
dip switches is shown in Figure 3.
CHANNEL
SW1
1
2
3
4
5
6
7
8
9
10
11
12
13
14
15
16
1
2
3
4
5
6
7
8
SW2
Figure 3
1
2
3
4
5
6
7
8
Table 1
Dip switch SW1 1-8 provides filtering control for channels 1-8 while SW2 1-8
controls channels 9-16. Refer to Table 1 to determine which switch corresponds
to a particular channel. A port is configured for AC operation by positioning the
corresponding switch to ON position.
NOTE: The default setting for SW 1-8 and SW2 1-8 is "OFF" (AC filtering
disabled).
6
4
OPERATION
This section discusses the general PDI operation (Section 4.1), user-programmable
features (Section 4.2), data commands (Section 4.3), event sample reporting
(Section 4.4), and presentation (Section 4.5).
4.1
GENERAL
The V79 PDI-1 and V80 PDI-2 modules are used in applications requiring
notification of device status (e.g., burglar and fire alarms, event counters/timers,
process control, etc.). The PDI-1 module has 16 channel switch inputs providing
a reliable method to detect and report a state change from high resistance (open) to
continuity (closed) or vice versa. The V80 is a 16 channel optically-isolated
voltage input module that is non-polarity sensitive and can be individually set to
detect the presence or the change of state of AC or DC inputs. We will refer to a
change in state of a switch closure (PDI-1) or a voltage change (PDI-2) as an
event. An event sample is the actual data associated with an event which is
calculated by the PDI module and sent to the host computer/controller.
Individual PDI channels can be programmed to report event samples upon request
via data commands (Command Reporting Method), at a specific date/time
(Schedule Reporting Method), or as the event occurs (Immediate Reporting
Method). Multiple events may be stored for later retrieval and analysis. The PDI
features a latch mode where the time and state of the initial event is latched and
held until user reset. False reporting of events is prevented by programming
variable debounce times. Event samples are preceded by the appropriate unit,
module, and channel number and may be appended with a "real time" Time Tag
showing the date and time the status was recorded.
You have the choice of programming the PDI via verbose (menu-driven) or nonverbose (dynamic) configuration mode. When using verbose mode, a series of
menus will prompt you to enter the desired parameters. Non-verbose mode allows
you to program the PDI by downloading configuration commands (see Section
5.2).
7
4.2
USER-PROGRAMMABLE FEATURES
You may program the Sampling Setup, Reporting Setup, and Dynamic
Configuration on the PDI which are discussed in Section 4.2.1 through Section
4.2.3 respectively.
4.2.1
SAMPLING SETUP
Sampling Setup allows you to program the Debounce Delay and Latch Polarity for
the input channels. The Debounce Delay is used to guard against erroneous
events. An event will not be valid unless the input channel has remained at a
changed state for the debounce duration. The debounce delay may be
programmed from 0 (for no debounce) to 65535 milliseconds. The Latch Polarity
is used to latch individual inputs based on a positive going (LO to HI) or negative
going (HI to LO) input. The latch information is retained in memory until recalled
by the user. The default Debounce Delay time is 100 milliseconds and the default
Latch Polarity is a HI to LO transition.
4.2.2
REPORTING SETUP
Reporting Setup allows you to program how the PDI reports event samples to the
host module. The items you may program in the Reporting Setup include
Reporting Method, Report Start Time, Report Interval, Set Host Address, Data
Format, Time Tag, and Terminating Character(s). The following subsections
describe these features in more detail.
4.2.2.1 REPORTING METHOD
Reporting Method is the manner in which event samples are sent to the designated
host module. The PDI provides three Reporting Methods: Command (upon
request via data commands), Immediate (upon exiting configuration), and
Schedule (where reporting begins at a specified time). The default Reporting
Method is Command.
8
4.2.2.2 REPORT START TIME
Report Start Time is the time reporting begins when Schedule Reporting Method is
selected. The start of reporting may be delayed up to 24 hours from the current
time recorded by the M Series time-of-day clock and reporting will occur in cyclic
periods as determined by the Report Interval. The default Report Start Time is
00:00.
4.2.2.3 REPORT INTERVAL
You may program the PDI to report in repetitive periods using Schedule Reporting
Method, where the PDI will report all event samples in the receive buffer after the
specified Report Interval has elapsed. The PDI will report until the buffer is empty
and then report again after the specified Report Interval has expired. The default
Report Interval is 00:00 (every 24 hours).
4.2.2.4 HOST ADDRESS
Host Address is the designated host module where event samples are sent when
using Immediate or Schedule Reporting Method. The Host Address consists of
the Unit Number (1 to 32), Module Number (1 to 16), and Port Number (1 to 4)
of the designated host module. The default Host Address is Unit 1, Module 1, Port 1.
4.2.2.5 TIME TAG
When Time Tag is enabled, a time tag is appended immediately after the event
sample. The time tag consists of the month, day, year, hour, minute, and second
at which the data was calculated. Time Tag may be enabled or disabled. The
default Time Tag is disabled.
9
4.2.2.6 TERMINATING CHARACTER(S)
The Terminating Character(s) is added at the end of an event sample to match the
requirements of the host terminal or application software. The Terminating
Character(s) consists of one or two hexadecimal characters. The default
Terminating Characters are 0D Hex (Carriage Return) followed by 0A Hex (Line
Feed).
4.2.3
DYNAMIC CONFIGURATION
You may enable or disable Dynamic Configuration for the PDI. Dynamic
configuration mode allows non-verbose or "on-the-fly" configuration commands to
be issued to the PDI which are summarized in Section 5.2. The default Dynamic
Configuration setting is disabled.
4.3
DATA COMMANDS
You may issue PDI data commands through a host module to perform single
operations while temporarily overriding the module's current operating
configuration. Some data commands apply to all types of DAC modules, while
others apply to specific modules. Data commands may be entered repeatedly to
get specific event samples. You may issue a single data command to obtain event
samples from multiple channels. Data commands must be used to obtain event
samples when using Command Reporting Method.
PDI data commands are sent through a host module using the following
procedure:
1.
10
Select the PDI from the host module by sending a select sequence which
consists of the port select code ($BT - default), the desired module
number (2 to 16), and a terminating character of Carriage Return (0D
Hex) or Line Feed (0A Hex). For example, to select an PDI Module
located in slot 15 using the default port select code, send $BT15<cr>.
2.
Once the PDI is selected, it will go into Command Mode and allow you to
send data commands. The PDI data commands begin with two capital
letters designating the specific command and are terminated with a
Carriage Return. Most data commands also require a number between
the command letters and Carriage Return. This number is typically the
desired channel(s) for the data command. If you have a requirement to
send the data command to multiple channels simultaneously, you may use
one of the following formats as shown for the SA (sample) command:
SA1,2,3,4,5,6,7,8<cr>
SA1-8<cr>
SA/0 <cr>
SA1,2,4-8<cr>
3.
Take a single sample for Ports 1-8
Take a single sample for Ports 1-8
Take a single sample for Ports 1-8
Take a single sample for Ports 1, 3, 4, 5, 6, 7,
and 8
After you have sent the desired data commands to the PDI module, you
may disconnect from the PDI by sending $BT<cr>. You may disconnect
from the PDI and select a different module or the base unit by sending
$BTX<cr>, where X is the desired module number or 0 for the base unit.
IMPORTANT: If the PDI is operating in self reporting mode (i.e.,
Immediate or Schedule Reporting Method) and a host device issues a data
command, the host device must disconnect by sending the Port Select
Code and Carriage Return or Line Feed before the PDI will resume
sending event samples to the designated host module.
Section 4.3.1 through Section 4.3.10 provide detailed information on the
functionality of each data command supported by the PDI. Appendix A provides
these same commands in a condensed version for quick reference.
11
4.3.1
CLEAR EVENT BUFFER COMMAND
The Clear Event Buffer (CB) command is used to clear all stored event samples
from the buffer of the selected channel(s). The Clear Event Buffer command has
the following format:
CB n<cr>
where c = Channel# (1 to 16 or 0 for all).
4.3.2
CLEAR EVENT COUNTER COMMAND
The Clear Event Counter (CC) command is used to reset the event counter for one
or more channels to zero without reading the value of the event counter. The
function of the event counters is discussed in Section 4.4. The Clear Event
Counter command has the following format:
CCc<cr>
where c = Channel# (1 to 16 or 0 for all).
4.3.3
CLEAR EVENT LATCH DATA
The Clear Event Counter (CR) command is used to clear the event latch buffer.
Latched data is discussed more in Section 4.4. The Clear Event Counter command
has the following format:
CRc<cr>
where c = Channel# (1 to 16 or 0 for all).
12
4.3.4
REPORT ALL BUFFERED EVENTS COMMAND
The Report All Buffered Events (RA) command instructs the PDI to report all
event samples currently stored in the buffer of the selected channel(s). The
Report All Buffered Events command has the following format:
RAn<cr>
where c = Channel# (1 to 16 or 0 for all).
4.3.5
REPORT EVENT COUNTER COMMAND
The Report Event Counter (RC) command instructs the PDI to report how many
times an event has occurred for one or more channels since the last time a counter
reset command was issued. This command does not reset the event counter.
The Report Event Counter command has the following format:
RCc<cr>
where c = Channel# (1 to 16 or 0 for all).
4.3.6
REPORT EVENT DURATION COMMAND
The Report Event Duration (RD) command instructs the PDI to report how long
the most recent recorded event for the selected channel(s) lasted. Event duration
is discussed more in Section 4.4. The Report Event Duration command has the
following format:
RDc<cr>
where c = Channel# (1 to 16 or 0 for all).
13
4.3.7
REPORT EVENT LATCH DATA COMMAND
The Report Event Latch Data (RL) command instructs the PDI to report the active
state of the initial event and the time the initial event occurred (if time tagging is
enabled). This command does not reset the latch buffer. The Report Event Latch
Data has the following format:
RLc<cr>
where c = Channel# (1 to 16 or 0 for all).
4.3.8
REPORT EVENT COUNTER AND RESET COMMAND
The Report Event Counter and Reset (RO) command instructs the PDI to report
how many times an event has occurred for one or more channels and then reset
the event counter to zero. The Report Event Counter and Reset command has the
following format:
ROc<cr>
where c = Channel# (1 to 16 or 0 for all).
4.3.9
REPORT EVENT LATCH DATA AND RESET COMMAND
The Report Event Latch Data and Reset (RR) command instructs the PDI to
report the active state of the initial event, the time the initial event occurred (if time
tagging is enabled), and then reset the latch buffer. The Report Event Latch Data
and Reset command has the following format:
RRc<cr>
where c = Channel# (1 to 16 or 0 for all).
14
4.3.10 REPORT A SINGLE BUFFERED EVENT COMMAND
The Report A Single Buffered Event (RS) command instructs the PDI to report the
first event sample stored in the buffer of the selected channel(s). The Report A
Single Buffer Sample command has the following format:
RS c<cr>
where c = Channel# (1 to 16 or 0 for all).
4.4
EVENT SAMPLE REPORTING
An event is defined as a change-in-state of an input channel and return to the
original state. An event may be started on a rising edge (LO to HI) or a falling
edge (HI to LO) as determined by the Latch Polarity (see Section 5.1.3). On the
PDI-1 switch closure module, an input is considered to be at a "HI" or "1" state
when it is closed (continuity) and a "LO" or "0" state when it is open (infinite
resistance). On the PDI-2A and PDI-2B optically isolated modules, an input is
considered to be at a "HI" or "1" state when there is voltage detected and a "LO" or
"0" state whenever there is no voltage detected. An event sample is the actual data
associated with an event which is calculated by the PDI module and sent to the
host computer/controller. The way an event sample is presented to the host
computer/controller is described in Section 4.5.
PDI event sample reporting depends on the Reporting Method used. When using
Immediate Reporting Method, the PDI will report an event sample whenever an
event occurs. When using Schedule Reporting Method, the PDI will report an
event sample whenever a event occurs after the Report Start Time has elapsed
(see Section 4.2.2.2). When using Command Reporting Method, the PDI will
report an event sample or multiple samples on command only.
15
The PDI module can observe, record, and report when an event happened, how
long the event lasted, and how many events occurred for each individual channel.
The initial occurrence of an event will set the event latch bit and store the
associated time in the latch buffer. You may read the state of the initial event and
the time it was recorded (if time tagging is enabled) by issuing the RL or RR
commands.
Each occurrence of an event starts the duration counter and increments the event
counter. The duration counter measures event duration time in milliseconds with a
maximum time of 65,535 stored. You may read the duration of the last recorded
event by issuing the RD command.
NOTE: Duration measurements are not de-bounced. If the input circuit cycles
between active and inactive before settling, only the settled value is reported.
Therefore, if a PDI module is connected to a relay or switch that has "dirty"
contacts, the total measurement will be less than the actual activation duration of
the circuit by the amount of time spent settling.
The event counter reflects the total number of events that have occurred since the
event counter was last cleared using the CC or RO command. You may read the
current event counter value by sending the RC or RO command. The event
counter will trigger on the rising edge of an event when LO to HI Latch Polarity is
selected or on the falling edge of an event when HI to LO Latch Polarity is
selected. Examples of using the event counter would include counting items
moving on a conveyor belt and process control where a pre-determined number of
events must take place before a defined action may take place.
NOTE: An event must have a duration greater than one millisecond plus the
current debounce delay time to increment the event counter.
16
4.5
EVENT SAMPLE PRESENTATION
Event Sample presentation varies slightly in format depending on module
configuration. Entries such as, time tag, data format, number of active channels,
etc. all change how event samples appear to a host-controller. However, all event
samples are presented in the same basic order of fields as follows:
UU:MM,CC 1 or 0 MM/DD/YY HH:MM:SS
where, UU is the M Series Unit Number
MM is the PDI Module Number
CC is the PDI Channel Number
1 channel status is "closed" (PDI-1) or has voltage applied
(PDI-2)
0 channel status is "open" (PDI-2) or has no voltage applied
(PDI-2)
MM is the month (if Time Tag enabled)
DD is the day (if Time Tag enabled)
YY is the year (if Time Tag enabled)
HH is the hour (if Time Tag enabled)
MM is the minute (if Time Tag enabled)
SS is the second (if Time Tag enabled)
The following example shows event samples received using immediate or schedule
reporting where the PDI is installed in Unit 1 Module 15 with Time Tagging
enabled:
UNIT#
MODULE#
CHANNEL#
CHANNEL STATUS
DATE
TIME
1:15,1 1 11/18/93 09:12:22<cr><lf>
1:15,2 1 11/18/93 09:12:22<cr><lf>
17
The following examples show the messages received using data commands where
the PDI is installed in Unit 1 Module 15 with time tagging enabled. If you select
the module and issue the RD1<cr> command (Report Event Duration for Channel
1), the module will respond with a single message showing the Event Duration for
Channel 1 similar to the following:
1:15,1 1320 11/18/93 09:12:22
where 1:15,1 represents Unit 1/Module 15/Channel 1, 1320 indicates the event
duration is 1320 milliseconds, and 11/18/93 09:12:22 is the time tag.
If you issue the RC1<cr> command (Report Event Counter for Channel 1), the
module will respond with a message showing the Event Counter similar to the
following:
1:15,1 823 11/18/93 09:12:22
where 1:15,1 represents Unit 1/Module 15/Channel 1, 823 indicates the number of
recorded events is 823 times, and 11/18/93 09:12:22 is the time tag.
If you issue the RS1<cr> command (Report Single Buffered Event for Channel 1),
the module will respond with a message showing the input status for Channel 1
similar to the following:
1:15,1 1 11/18/93 09:12:22
where 1:15,1 represents Unit 1/Module 15/Channel 1, 1 indicates the first buffered
sample for Channel 1 is closed (PDI-1) or has voltage applied (PDI-2), and
11/18/93 09:12:22 is the time tag.
18
If you issue the RL1<cr> command (Report Event Latch Data for Channel 1), the
module will respond with a message showing the state of the input that started the
initial event. This will be "1" (closed) for LO to HI Latch Polarity or "0" (open) for
HI to LO Latch Polarity if using the PDI-1. This will be "1" (voltage detected) for
LO to HI Latch Polartiy or "0" (no voltage detected) for HI to LO Latch Polarity if
using the PDI-2. If time tagging is enabled, the time the initial event occurred will
be appended to the event sample.
5
CONFIGURATION
You may program the PDI-1 or PDI-2 using a menu-driven configuration
procedure from a host module or the M Series service port as described in Section
5.1 or by sending dynamic configuration commands from a host module as
described in Section 5.2. You may view the current configuration from the front
panel (see Section 5.3).
5.1
MENU-DRIVEN CONFIGURATION
To access the menu-driven configuration mode of the PDI-1 or PDI-2 from any
host module, use the following procedure:
1.
Configure the host terminal's serial parameters to match those of
the host module. From the factory, the host module is set at
9600 baud, 8 bit word size, 1 stop bit, no parity, and XON/XOFF
disabled. If you do not have a dumb terminal or a terminal
emulation program, BayTech supplies a utility diskette which
includes software to put an IBM PC or compatible into a terminal
mode (TERM.EXE).
2.
Connect to the PDI by sending the port select code, the
appropriate Unit Number followed by a colon (1: to 30: - only if
using cascaded units), the desired module number (2 to 16), and
Carriage Return or Line Feed.
3.
Access configuration mode by sending $CONFIG<cr>.
19
For example, if the PDI is installed in a non-cascaded unit as Module 2 and you are
using the default port select code ($BT), send $BT2<cr>$CONFIG<cr> to enter
into configuration mode. No characters should be typed between $BT2<cr> and
$CONFIG<cr>. If this happens, the entire configuration sequence will be
discarded and you will have to send the configuration sequence again.
NOTE: All commands must be in uppercase.
To access the menu-driven configuration mode of the PDI from the service port,
use the following procedure:
1.
Connect a terminal to the EIA-232 service port and configure the
terminal's serial parameters to 9600 baud rate, 8 word size, 1 stop bit, and
no parity.
2.
Connect to the PDI by sending $BAYTECH, the desired module number (2
to 16), and Carriage Return or Line Feed.
3.
Access configuration mode by sending $CONFIG<cr>. Following the
example on the previous page, you would send
$BAYTECH2<cr>$CONFIG<cr> to configure Module 2.
NOTE: All commands must be in uppercase.
20
5.1.1
CONFIGURATION MAIN MENU
A PDI-1 module installed as Module X will respond to the receiving of
$CONFIG<cr> with an identification block and a menu of the available
configuration options similar to the following:
Copyright (c) Bay Technical Associates,1993
DAC V79 PDI-1 Rev. 1.XX
This Module is X
CONFIGURATION MAIN MENU
Module Status......................1
Sampling Setup.....................2
Reporting Setup....................3
Dynamic Configuration..............4
Exit...............................X
Enter Selection:
NOTE: The only difference in the configuration main menu for the PDI-1 or PDI-
2 modules is the second line in the header showing the module type. All
subsequent menus are the same for both modules. The configuration menus
shown in the following sections are depicted with factory default settings and may
vary slightly in presentation.
Enter the number corresponding to your desired choice. Each choice will invoke a
sub-menu. Each sub-menu is described in the following sections. When you exit
a sub-menu, you will be returned to the configuration main menu. When "Exit" is
selected from the main menu, the PDI will exit from configuration mode and go
into an active data collection mode.
21
5.1.2
MODULE STATUS
By responding to the Enter Selection: message at the end of the Configuration
Main Menu (see Section 5.1.1) with "1" (Module Status), you may review the
current configuration status. The PDI will respond with a menu similar to the
following:
MODULE STATUS
Debounce Delay (Milliseconds)......100
Latch Polarity.....................LO to HI
Reporting Method...................COMMAND
Reporting Start Time...............24:00
Reporting Period...................24:00
Host Address.......................1:1,1
Data Format........................HEX
Time Tagging.......................DISABLED
Terminating Character(s)...........0D0A
Dynamic Configuration..............DISABLED
Press a key to continue or X to Exit.
5.1.3
SAMPLING SETUP
By responding to the Enter Selection: message at the end of the Configuration
Main Menu (see Section 5.1.1) with "2" (Sampling Setup), you may program the
Debounce Delay and Latch Polarity. The PDI will respond with the following
menu:
SAMPLING SETUP
Debounce Delay..................1
Latch Polarity..................2
Exit............................X
Enter Selection:
You may program the Debounce Delay the Latch Polarity from this menu. The
Exit selection will return you to the configuration main menu. For example, if you
type "1" (Debounce Delay), the PDI will respond with the following:
SET DEBOUNCE DELAY
(0-65535 Milliseconds)
Debounce Delay.................100
Exit...........................X
Enter Value<CR>, or X to EXIT:
22
Type the desired debounce delay time followed by <ENTER>. The debounce
delay is used to guard against erroneous events. An event will not be valid unless
the input channel has remained at a changed state for the debounce duration.
If you type "2" from the "Sampling Setup" menu shown on the previous page
(Latch Polarity), the PDI will respond with the following:
SET LATCH POLARITY
Latch Polarity..................HI TO LO
Low to Hi Transitions only......1
Hi to Low Transitions only......2
Exit............................X
Enter Selection:
Enter the desired Latch Polarity. The Latch Polarity is used to latch initial events
for individual inputs based on a positive going (LO to HI) or negative going (HI to
LO) input.
5.1.4
REPORTING SETUP
By responding to the Enter Selection: message at the end of the Configuration
Main Menu (see Section 5.1.1) with "3" (Reporting Setup), you may program how
the PDI reports event samples to the host device. The items you may program are
Reporting Method, Report Start Time, Report Interval, Host Address, Data
Format, Time Tag, and Terminating Character(s). The operational functionality of
these items is discussed in Section 4.2.2. The PDI will respond with the Reporting
Setup menu as follows:
REPORTING SETUP
Reporting Method...................1
Report Start Time..................2
Report Interval....................3
Host Address.......................4
Time Tag...........................5
Terminating Character(s)...........6
Exit...............................X
Enter Selection:
23
If you respond to one of the above selections with 1 to 6, a sub-menu will be
presented for that item. After making any necessary changes under sub-menus 1
to 6, you be returned to the Reporting Setup menu. The "Exit" selection will return
you to the Configuration Main Menu.
5.1.4.1 REPORTING METHOD
By responding to the Enter Selection: message at the end of the Reporting Setup
Menu with "1" (Reporting Method), you may program how the PDI reports event
samples to the host device. The PDI will respond with the Select Reporting
Method sub-menu as follows:
SELECT REPORTING METHOD
Reporting Method....................COMMAND
Command............................1
Immediate (When Event Occurs)......2
Schedule...........................3
Exit...............................X
Enter Selection:
The PDI provides three Reporting Methods. These are Command (via data
commands only), Immediate (upon exiting configuration), and Schedule (where
reporting begins at a specified time).
When Command Reporting Method is selected, the PDI will report event samples
to the host module only when data commands are issued (see Section 4.3.).
When Immediate Reporting Method is selected, the PDI will report event samples
to the host module as events occur. If no event has occurred, no event sample is
generated. Reporting begins immediately after exiting the Configuration Main
Menu
24
When Schedule Reporting Method is selected, the PDI will begin reporting event
samples as events occur at the programmed Report Start Time (see Section
5.1.4.2). The Report Start Time is programmable up to 24 hours in advance of
the current (time-of-day) clock time. Event samples are stored in the buffer until
the Report Start Time is reached at which time all buffered event samples are
reported to the host module. Further reporting is based upon the selected Report
Interval as explained in Section 5.1.4.3.
5.1.4.2 REPORT START TIME
By responding to the Enter Selection: message at the end of the Reporting Setup
Menu on page 23 with "2" (Report Start Time), you may program the time the PDI
will start reporting when using Schedule Reporting Method. The PDI will respond
with the Report Start Time menu as follows:
REPORT START TIME
Reporting Start Time...............HH:MM
Current Date and Time..............MM/DD/YY HH:MM:SS
Enter Hours (0-24) <cr>, or X to Exit:
Enter Minutes (0-59) <cr>, or X to Exit:
This menu shows the current Reporting Start Time, Current Date and Time as
reported by the base unit's time-of day clock when the reporting start time entry
was selected, and prompts you to enter the desired Report Start Time. Reporting
can be delayed up to 24 hours from the current time.
Enter the desired Report Start Time. For example, suppose the Current Time is
9:20:30 and the Reporting Start Time is set to 10:45. After you exit the
Configuration Main Menu, the PDI will start reporting event samples at 10:45 at
the programmed Sampling Setup. If the M Series loses power, reporting resumes
the next time the designated Report Start Time is observed by the time-of day
clock.
25
IMPORTANT: The Current Date and Time is not updated during data entry. You
must consider any delays from the time you enter the Report Start Time until you
exit the Configuration Main Menu. Be sure to set the Report Start Time far
enough ahead of the current time to complete all configurations and exit
configuration mode.
NOTE: When using Schedule Reporting Method and the PDI is initially reporting,
if you enter into the menu-driven mode of configuration and exit, the PDI will not
resume reporting event samples until the programmed Report Start Time elapses.
You may program the PDI without disrupting event sample reporting by using
dynamic configuration (see Section 5.2).
5.1.4.3 REPORT INTERVAL
By responding to the Enter Selection: message at the end of the Reporting Setup
Menu on page 23 with "3" (Report Interval), you may program the time interval
between reporting periods when using Schedule Reporting Method. The PDI will
respond with the Report Interval menu as follows:
REPORT INTERVAL
Report Interval......................HH:MM
Enter Hours (0-24) <cr>, or X to Exit:
Enter Minutes (0-59) <cr>, or X to Exit:
Enter the desired Report Interval. The Report Interval can range from 1 minute to
24 hours. Once the Report Start Time elapses, the PDI will report all buffered
event samples to the designated host module until the buffer is empty. The PDI
will continue to transmit all buffered event samples every time the Report Interval
expires. For example, if the Report Start Time is 12:00 and the Report Interval is
1:00 (1 hour), the PDI will report all messages in its buffer every hour on the hour
starting at 12:00.
26
5.1.4.4 HOST ADDRESS
By responding to the Enter Selection: message at the end of the Reporting Setup
Menu on page 23 with "4" (Host Address), you may program the address of the
designated host module. The designated host module is where event samples are
sent when using Immediate or Schedule Reporting Method. The PDI will respond
with the Host Address menu as follows:
HOST ADDRESS
Host Address.......................1:1,1
Enter Unit Number (1-32) <cr>, or X to EXIT:
Enter Module Number (1-16) <cr>, or X to EXIT:
Enter Port Number (1-4) <cr>, or X to EXIT:
Enter the appropriate Host Address. This consists of the Unit Number (1 to 32),
Module Number (1 to 16), and Port Number (1 to 4) where the designated host
module is located. Each entry should be followed by <ENTER>. If there is a
single M Series unit in service, the Host Address would typically be Unit 1, Module
1, Port 1.
NOTE: The Host Address must be supplied to direct self-reporting event samples
to the desired destination. If the Host Address is incorrect, self-reporting event
samples will be misdirected or lost.
5.1.4.5 TIME TAG
By responding to the Enter Selection: message at the end of the Reporting Setup
Menu on page 23 with "6" (Time Tag), you may program the PDI to append a
time tag to the end of event samples automatically. The PDI will respond with the
Enable/Disable Time Tagging menu as follows:
ENABLE / DISABLE TIME TAGGING
Time Tagging.......................DISABLED
Enable.............................1
Disable............................2
Exit...............................X
Enter Selection:
27
With time tag enabled, a MM/DD/YY HH/MM/SS entry is appended to all samples,
where MM is the month, DD is the day, YY is the year, HH is the hour, MM is the
minute, and SS is the second according to the base unit's time-of-day clock.
5.1.4.6 TERMINATING CHARACTER(S)
By responding to the Enter Selection: message at the end of the Reporting Setup
Menu on page 26 with "7" (Terminating Character(s)), you may program one or
two characters to be appended at the end of each event sample. This option
allows a user to match the host terminal and/or requirements of their application
software. The PDI will respond with the Enter Terminating Character menu as
follows:
ENTER TERMINATING CHARACTER
Terminating Character(s)...........0D0A
Enter 1 or 2 Terminating Characters in Hex Format
(i.e. 0D0A for CR+LF) <cr>, or X to Exit:
Type the hexadecimal representation of the desired terminating character(s). For
example, Carriage Return would be represented by 0D Hex and Line Feed would
be represented by 0A Hex.
NOTE: Only ASCII characters A-F and 0-9 are acceptable.
5.1.5
DYNAMIC CONFIGURATION
By responding to the Enter Selection: message at the end of the Configuration
Main Menu (see Section 5.1.1) with "5" (Dynamic Configuration), you may
program the PDI to respond to dynamic configuration (non-verbose) commands.
The PDI will respond with the Dynamic Configuration Commands menu as
follows:
DYNAMIC CONFIGURATION COMMANDS
Dynamic Configuration Commands.....DISABLED
Enable.............................1
Disable............................2
Exit...............................X
Enter Selection:
28
Dynamic configuration mode allows the PDI to be programmed by downloading
dynamic (on-the-fly) commands. See Section 5.2 for the procedure to program
the PDI via dynamic configuration and a description of the available configuration
commands.
5.1.6
EXIT
By responding to the Enter Selection: message at the end of the Configuration
Main Menu (see Section 5.1.1) with "X" (Exit), the PDI will exit the menu-driven
configuration mode. If changes are made to any configuration parameter, the PDI
will respond with:
Save Changes as Defaults? (Y/N)
If you reply in the affirmative (Y), the settings are saved as the permanent powerup defaults. That is, if the M16/M8 loses power for any reason, the settings saved
as defaults become the power-up settings. If you reply in the negative (N), your
selections are saved as current (temporary) operating settings, but are lost upon
power-down. The most recent menu selections saved as Defaults are restored as
the current operating parameters when power is re-applied. If you respond with
"Y", the PDI will respond with:
Saving Configuration as Defaults...
Configuration complete
29
5.2
DYNAMIC CONFIGURATION PROCEDURE AND
COMMANDS
PDI-1 or PDI-2 dynamic configuration commands are issued through a host
module. Some configuration commands apply to all types of DAC modules, while
others apply to specific modules. The PDI will recognize dynamic configuration
commands only when Dynamic Configuration is enabled (see Section 5.1.5). Use
the following procedure to send dynamic configuration commands to the PDI
from a host module:
1.
Select the PDI from the host module by sending a select sequence which
consists of the port select code ($BT - default), the appropriate unit
number followed by a colon (01: to 30: - only if using cascaded units), the
desired module number (2 to 16), and a terminating character of Carriage
Return (0D Hex) or Line Feed (0A Hex). For example, to select an PDI
Module located in slot 15 of a non-cascaded unit using the default port
select code, send $BT15<cr>.
2.
Once the PDI is selected, it will go into Command Mode and allow you to
send dynamic configuration commands. The PDI configuration
commands begin with two capital letters designating the specific
command and are terminated with a Carriage Return. Most configuration
commands require a number between the command letters and Carriage
Return. This number represents the desired configuration parameter.
3.
After you have sent the desired configuration command(s) to the PDI
module, you may disconnect from the PDI, by sending $BT<cr>. You
may disconnect from the PDI and select a different module or the base
unit by sending $BTX<cr>, where X is the desired module number or 0
for the base unit.
Section 5.2.1 and Section 5.2.3 provides detailed information on the functionality
of each configuration command supported by the PDI. Appendix A provides these
commands as a quick reference.
30
NOTE: Multiple configuration commands may be sent while the PDI is in
command mode. Each command should be terminated with a Carriage Return.
5.2.1
DEBOUNCE DELAY COMMAND
The Debounce Delay (DB) command programs the PDI Debounce Delay time (see
Section 4.2.2 and Section 5.1.3). The Debounce Delay command has the
following format:
DB n<cr>
where n = 0 to 65535 milliseconds.
5.2.2
REPORTING METHOD COMMAND
The Reporting Method (RM) command programs the PDI Reporting Method (see
Section 4.2.2.1 and Section 5.1.4.1). The Reporting Method command has the
following format:
RMn<cr>
where n = 1 to 3. 1 = Command, 2 = Immediate and 3 = Schedule.
5.2.3
TIME TAG COMMAND
The Time Tag (TT) command is used to enable or disable time tagging as
described in Section 4.2.2.5 and Section 5.1.4.5. The Time Tag command has the
following format:
TTn
where n = 1 or 2. 1 = enable and 2 = disable.
31
5.3
FRONT PANEL CONFIGURATION
The LCD display and associated front panel controls can provide the configuration
status of the PDI. All the parameters shown in the LCD status message are fully
described in Section 5.1.
When the M8/M16 DAC has completed its power-up self-test, the following menu
will be displayed on the LCD:
Bay Technical Assoc
Select Module
00
NOTE: The following LCD screens are examples and will vary depending upon
current configuration status.
To review the configuration status of the PDI installed as Module XX (XX = 02 to
16), use the > or ? keys to highlight "Module XX" from the M Series main menu
screen and press the SELECT key. The LCD will respond with a menu similar to
the following for the PDI-1:
V78 PDI-1 MODULE XX
Display Status
Exit Module Menus
Select "Display Status" the LCD will respond with:
Debounce Delay 10
Latch Polarity HI/LO
Report Method COMMAND
76-PAGE SELECT-EXIT
Pressing the > or ? keys scrolls through the following entries:
Report Interval HH:MM
Host Address 1:1,1
Time Tagging ENABLE
Term Characters 0D0A
Dyna Cfg Cmd ENABLE
To exit the configuration status mode, press the SELECT key at any time. You
are returned to the PDI's LCD main menu. Next, press either arrow key until the
cursor is located on the "Exit Module Menus." Pressing the SELECT button
returns you to the main M Series LCD menu.
32
APPENDIX A
DATA/CONFIGURATION COMMAND
SUMMARY
The tables below summarize the data and configuration commands supported by
the V79 PDI-1 and V80 PDI-2 I/O modules:
V79 PDI-1 & V80 PDI-2 COMMAND SUMMARY
Command
Description
CBc<cr> ( c=Ch# 1 to 16, 0=all)
Clear Event Buffer. Clear all buffered event samples.
CCc<cr> ( c=Ch# 1 to 16, 0=all)
Clear Event Counter(s)
CRc<cr> ( c=Ch# 1 to 16, 0=all)
Clear Event Latch Data
RAc<cr> ( c=Ch# 1 to 16, 0=all)
Report All Buffered Events
RCc<cr> ( c=Ch# 1 to 16, 0=all)
Report Event Counter(s)
RDc<cr> ( c=Ch# 1 to 16, 0=all)
Report Event Duration(s)
RLc<cr> ( c=Ch# 1 to 16, 0=all)
Report Event Latch Data
ROc<cr> ( c=Ch# 1 to 16, 0=all)
Report Event Counter and Reset
RRc<cr> ( c=Ch# 1 to 16, 0=all)
Report Event Latch Data
RSc<cr> ( c=Ch# 1 to 16, 0=all)
Report Single Buffered Event (first in, first out)
SAc<cr> ( c=Ch# 1 to 16, 0=all)
Read and report the current state of the selected input(s).
SLc<cr> ( c=Ch# 1 to 16, 0=all)
Report Latest Event
* Multiple channels are selected using 4 formats.
Examples: SA1,2,3,4,5,6,7,8<cr>, SA1-8<cr>, SA0<cr>, SA1,2,4-8<cr>
V79 PDI-1 & V80 PDI-2 DYNAMIC CONFIGURATION COMMAND SUMMARY
Command
Description
DBn<cr> ( n =0-65535ms)
Debounce Delay
DFn<cr> ( n =1 or 2)
Data Format. 1=Hexadecimal and 2=Decimal.
RMn <cr> ( n =1 to 3)
Reporting Method. 1=Command, 2=Immediate, and 3=Schedule.
TTn<cr> ( n =1 or 2)
Time Tag. 1=Enable and 2=Disable.
33
APPENDIX B
EPROM UPGRADE
You will receive one EPROM (chip with label) for each PDI module to be
upgraded. The materials you will need to supply are:
Phillips-head screwdriver
IC DIP extractor or a pair of curved needle-nose pliers
1.
IMPORTANT: Remove power from the unit by depressing the power
switch on the front of the unit to OFF. Also remove power cord from the
AC outlet.
2.
Remove the appropriate module by loosening the 2 straight slot screws
that attach the connector board I/O module to the chassis and then pulling
the module out.
3.
Refer to the appropriate mechanical layout (see Appendix C or Appendix
D). Locate socket U8 for the PDI-1 or U5 for the PDI-2. Remove
existing EPROM from the appropriate socket with IC extractor or
needle-nose pliers. Gradually loosen each side of the chip, alternating
pliers from side to side, so as not to bend chip pins. Pull loosened EPROM
all the way out.
4.
Install new EPROM into the appropriate socket. (Make certain you are
installing the correct EPROM into the correct module by referring to the
label on the EPROM). The EPROM is notched; the notch on the EPROM
should line up with the notch on the socket. When installing the new
chips, be careful not to bend any of the pins.
5.
Re-install the module(s) and apply power to the unit. The upgrade is now
complete.
Before you begin operations, check the configuration status to make certain it
matches your application. If configuration changes (baud rates, handshaking, etc.)
are required, you must make these changes in the configuration mode. See
Section 5 for complete instructions.
34
APPENDIX C
V79 PDI-1 MECHANICAL LAYOUT
35
36
2
37
APPENDIX D
V80 PDI-2 MECHANICAL LAYOUT
38
39
3
40
APPENDIX E
INDEX
A
AC input 2, 6
Active channels 17
Arrow key 32
ASCII 28
B
Baud rate 20
BayTech 1, 2, 1, 3, 19, 20
Buffer 9, 12-16, 25, 26, 33
C
Cabling 2, 5
Channel 2, 6-8, 12-19, 23
Clear 12, 16, 33
Commands 1, 7, 8, 10, 11, 19, 20, 24, 28-31, 33
Configuration 2, 1-3, 5, 7, 8, 10, 17, 19-26, 28-33
Contact 2
41
D
DAC 1, 10, 21, 30, 32
Data commands 1, 7, 8, 10, 11, 24
Data format 8, 17, 22, 23, 33
Date 1, 7, 25, 26
DC-37F 2, 3, 5
Debounce delay 8, 16, 22, 23, 31, 33
Decimal 33
Default 8-10, 19-21, 30
Designated host 8, 9, 11, 26, 27
Disconnect 11, 30
Diskette 19
Dumb Terminal 19
Dynamic configuration 8, 10, 19, 21, 22, 26, 28-30, 33
E
EIA-232 20
Emulation 19
Enter 7, 20-29
Event Duration time 16
F
Factory default 21
FIFO 12
Format 8, 12-15, 17, 22, 23, 28, 31, 33
Front panel 19, 32
42
G,H
Hex 10, 22, 28, 30
Host device 11, 23, 24
Host module 8-11, 19, 24-27, 30
Humidity 3, 4
I
IBM 2, 19
Identification block 21
Installation 2, 5
Isolated input 1, 2, 4
J,K,L
Laserjet 2
Latch buffer 12, 14, 16
Latch mode 7
Latch polarity 8, 15, 19, 22, 23
LCD display 32
M
M Series 5, 9, 17, 19, 25, 27, 32
Menu 2, 7, 19-29, 32
Mode 7, 10, 11, 19-21, 26, 29-32
Module number 9-11, 17, 19, 20, 27, 30
Multiplexing 2
43
N,O,P
Non-verbose mode 7
Operation 2, 6, 7
Parameter 29, 30
Parity 19, 20
PDI-1 1, 2, 1-3, 5, 7-10, 19, 21, 23, 30, 32, 33
PDI-2 1, 2, 1-10, 19, 21, 23, 30, 33
Period 22
Port select code 10, 11, 19, 20, 30
Q,R
Receive buffer 9
Relay status 1
Report interval 8, 9, 23, 25, 26, 32
Report start time 8, 9, 15, 23, 25, 26
Reporting method 7-11, 15, 22-27, 31, 33
Reporting setup 8, 21, 23-28
Reset 7, 12-14, 16, 33
S
Sampling setup 8, 21-23, 25
Schedule 1, 7-9, 11, 15, 17, 22, 24-27, 31, 33
SELECT button 32
Select code 10, 11, 19, 20, 30
SELECT key 32
Select sequence 10, 30
Service port 19, 20
Set host address 8
Setup 6, 8, 21-28
Specifications 3
Start 8, 9, 15, 22, 23, 25, 26, 32
Status 1-3, 7, 17, 18, 21, 22, 32
Storage 3, 4
Switch 1, 2, 1-3, 6, 7, 16
44
T
Temperature 3, 4
Term 19, 32
Terminal 2, 10, 19, 20, 28
Terminal emulation program 19
Terminating character 8, 10, 22, 23, 28, 30
Time tag 1, 7-9, 17, 18, 23, 27, 28, 31, 33
U,V
Unit number 9, 17, 27
User-programmable 7, 8
Verbose mode 7
Voltage 1, 2, 4, 7
Voltage range 2, 4
Volts 2
W
Word size 19, 20
45