1
Agilent N9320A
Spectrum Analyzer
User’s Guide
Notices
© Agilent Technologies, Inc. 2006
Warranty
No part of this manual may be reproduced
in any form or by any means (including
electronic storage and retrieval or translation into a foreign language) without prior
agreement and written consent from Agilent Technologies, Inc. as governed by
United States and international copyright
laws.
The material contained in this document is provided “as is,” and is subject to being changed, without notice,
in future editions. Further, to the maximum extent permitted by applicable
law, Agilent disclaims all warranties,
either express or implied, with regard
to this manual and any information
contained herein, including but not
limited to the implied warranties of
merchantability and fitness for a particular purpose. Agilent shall not be
liable for errors or for incidental or
consequential damages in connection
with the furnishing, use, or performance of this document or of any
information contained herein. Should
Agilent and the user have a separate
written agreement with warranty
terms covering the material in this
document that conflict with these
terms, the warranty terms in the separate agreement shall control.
Manual Part Number
N9320-90001
Edition
Second Edition, March, 2008
Printed in China
Agilent Technologies, Inc.
Hi-Tech Industrial Development Zone (West
District)
Chengdu 611731, P.R.C
Software Revision
This guide is valid for A.02.00 revisions of
the Agilent N9320A Spectrum Analyzer
software.
Technology Licenses
The hardware and/or software described in
this document are furnished under a
license and may be used or copied only in
accordance with the terms of such license.
Restricted Rights Legend
U.S. Government Restricted Rights. Software and technical data rights granted to
the federal government include only those
rights customarily provided to end user customers. Agilent provides this customary
commercial license in Software and technical data pursuant to FAR 12.211 (Technical
Data) and 12.212 (Computer Software) and,
for the Department of Defense, DFARS
252.227-7015 (Technical Data - Commercial
Items) and DFARS 227.7202-3 (Rights in
Commercial Computer Software or Computer Software Documentation).
Safety Notices
CAUTION
A CAUTION notice denotes a hazard. It calls attention to an operating procedure, practice, or the like
that, if not correctly performed or
adhered to, could result in damage
to the product or loss of important
data. Do not proceed beyond a
CAUTION notice until the indicated conditions are fully understood and met.
WA RNING
A WARNING notice denotes a
hazard. It calls attention to an
operating procedure, practice, or
the like that, if not correctly performed or adhered to, could result
in personal injury or death. Do not
proceed beyond a WARNING
notice until the indicated conditions are fully understood and
met.
N9320A Spectrum Analyzer
In This User’s Guide…
This guide contains operation information for the N9320A
Spectrum Analyzer. The following are descriptions of the
chapters within this book.
1
Overview
A description of the front and rear panels.
2
Getting Started
Unpacking and setting up the analyzer.
3
Functions and Measurements
How to use the basic applications of the analyzer.
4
Key Reference
Front- panel hardkey descriptions and the related softkeys menu
functions.
5
One-Button Measurements
Key definition of one- button measurements.
6
Instrument Messages
Descriptions of the instrument messages of the analyzer.
7
In Case of Difficulty
Information and tips on what to do when instrument difficulties
are encountered.
8
Menu Maps
Menu maps, the structure of the menus and what the user will
see when making instrument parameter selections.
For more information about N9320A Spectrum Analyzer, see
www.agilent.com/find/n9320a.
N9320A Spectrum Analyzer
N9320A Spectrum Analyzer
Contents
1
Overview
1
Agilent N9320A at a Glance
Front Panel Overview
4
Rear Panel Overview
9
2
Front and rear panel safety and compliance symbols
2
Getting Started
11
Check the Shipment and Order List
Power Requirements
13
Environmental Requirements
Safety Notice
12
15
18
Electrostatic Discharge Protection
Power on and Check
20
Some helpful Tips
22
Running Internal Alignments
Enable the Options
22
Using an External Reference
Firmware Revision
23
Remote Control
3
22
23
24
Functions and Measurements
25
Making a Basic Measurement
26
Measuring Multiple Signals
N9320A User’s Guide
19
30
10
Contents
Measuring a Low-Level Signal
39
Improving Frequency Resolution and Accuracy
Tracking Drifting Signals
46
Making Distortion Measurements
Measuring Phase Noise
44
48
54
Stimulus Response Transmission
55
Measuring Stop Band Attenuation of a Lowpass Filter
Making a Reflection Calibration Measurement
58
61
Measuring Return Loss Using the Reflection Calibration
Routine
64
Viewing Catalogs and Saving Files
4
Key Reference
71
Amplitude
72
Auto Tune
75
Back <-
76
BW/Avg
77
Det/Display
Enter
81
87
File/Print
88
Frequency
Marker
95
97
Marker->
Meas
MODE
65
101
102
103
Peak Search
107
N9320A User’s Guide
Contents
Preset/System
SPAN
5
111
117
Sweep/Trig
118
View/Trace
120
One-Button Measurements
Channel Power
122
Occupied BW
ACP
124
127
Intermod (TOI)
130
Spectrum Emission Mask
6
132
Instrument Messages
Overview
139
140
Command Errors
141
Execution Conflict
143
Device-Specific Errors
7
145
In Case of Difficulty
Check the Basics
149
150
Read the Warranty
151
Contact Agilent Technologies
8
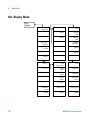
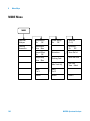
Menu Maps
153
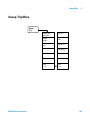
Amplitude Menu
BW/Avg Menu
Det/Display Menu
File Menu (1 of 2)
N9320A User’s Guide
121
154
155
156
157
152
Contents
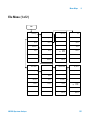
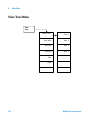
File Menu (2 of 2)
158
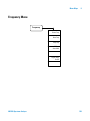
Frequency Menu
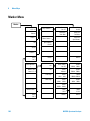
Marker Menu
159
160
Marker-> Menu
161
Measure Menu (1 of 2)
162
Measure Menu (2 of 2)
163
MODE Menu
164
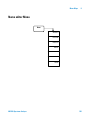
Name editor Menu
165
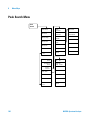
Peak Search Menu
166
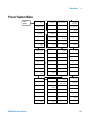
Preset/System Menu
SPAN Menu
167
168
Sweep/Trig Menu
169
View/Trace Menu
170
Index
171
N9320A User’s Guide
Agilent N9320A Spectrum Analyzer
User’s Guide
1
Overview
Agilent N9320A at a Glance
Front Panel Overview
3
Rear Panel Overview
8
2
Front and rear panel safety and compliance symbols
9
This chapter provides a description of the Agilent N9320A
spectrum analyzer and an introduction to the buttons,
features, and functions of the front and rear instrument
panels.
s
1
1
Overview
Agilent N9320A at a Glance
The Agilent N9320A spectrum analyzer is a portable, swept
spectrum analyzer with a frequency range of 9 kHz to
3.0 GHz. It can be a fundamental component of an
automated system. It can also be widely used in an
electronic manufacturing environment and in
functional/final/QA test systems.
The Agilent N9320A spectrum analyzer primary features and
functions are described below:
• High sensitive measurement
The spectrum analyzer includes a pre- amplifier for signals in
the frequency range up to 3 GHz, enabling more sensitive
measurements. This feature is a great help in analysis of
weaker signals.
• Pass/fail limits
Upper and lower limits can be set on the screen, thereby
enable the user to make fast, accurate, automated
PASS/FAIL judgments on trace data.
• Four-trace detection display
The spectrum analyzer will display up to four independent
traces simultaneously.
• SSB Phase Noise Measurement
The analyzer provides automated, single- sideband phase
noise measurement capability (dBc/Hz). The display includes
frequency offset and the noise value data.
• Frequency counter with 0.1 Hz resolution
A built- in frequency counter allows the user to measure the
signal frequency with 0.1 Hz resolution.
• USB interface
USB data interface ports allow the user to save and transfer
a screen shot (in JPG format) to a USB storage device.
2
N9320A Spectrum Analyzer
Overview
1
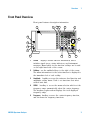
Front Panel Overview
Front panel features description information.
2
1
N9320A
16
SPECTRUM ANALYZER
3
4
9 kHz - 3.0 GHz
Frequency
Auto
Tune
BW/
Avg
Sw eep/
Trig
Preset/
System
SPAN
View /
Trace
Det/
Display
M arker
Local
File/
Print
M ODE
M eas
M arker
Save
Peak
Search
Amplitude
15
Remote
14
Standby
On
7
8
9
4
5
6
1
2
3
0
·
TG SOURCE
13
11
7
Back
Enter
50VDC M AX
30dBm 1W M AX
RF IN 50
CAL OUT
50MHz 10dBm
12
N9320A Spectrum Analyzer
6
5
PROBE POWER
10
CAT Ⅱ
8
9
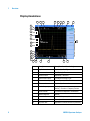
1
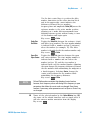
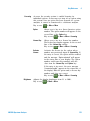
Screen displays current function information, which
includes signal traces, status indicators, and instrument
messages. Menu labels for the function softkeys are located
on the right- hand side of the screen.
2
Softkeys are the unlabeled keys to the right of the screen.
The menu information for the active function is displayed to
the immediate left of each softkey.
3
Amplitude hardkey accesses the reference level function and
amplitude softkey menu. Used to set functions that affect
vertical axis data.
4
SPAN hardkey to access the menu selection which set the
frequency range symmetrically about the center frequency.
The frequency- span readout displays the total displayed
frequency range.
5
Frequency hardkey accesses the center- frequency function,
and the menu for frequency functions.
3
1
Overview
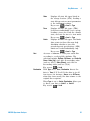
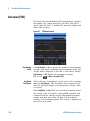
6
Function keys hardkeys that are grouped in the upper right
corner of the front panel. Their functions are defined below:
• Preset/System (Local) hardkey accesses the softkeys to
reset the analyzer to a known state, if the analyzer is in
the remote mode, pressing this key returns the analyzer
to the local mode and enables front- panel control.
• Auto Tune hardkey searches the signal automatically and
locates the signal to the center of the graticule. see “Auto
Tune” on page 75.
• BW/Avg hardkey activates the resolution bandwidth
function and accesses the softkey menus that control the
bandwidth functions and averaging.
• Sweep/Trig hardkey accesses the softkey menus to set the
sweep time, select the sweep and trigger mode.
• View/Trace hardkey accesses the softkeys that allow you
to store and manipulate trace information.
• Det/Display hardkey accesses the softkey menus to
configure detector functions and control the display
settings on the analyzer. These include the display line
value, and limit lines used in testing of trace data against
the entered limit values.
• MODE hardkey to select the measurement mode of the
analyzer.
• Meas hardkey accesses the softkey menu selections for
transmitter power measurements such as adjacent channel
power, occupied bandwidth, and harmonic distortion, etc.
Refer to “One- Button Measurements” on page 121.
• Marker hardkey accesses the marker control keys that
select the type and number of markers and their on and
off control.
• Marker-> hardkey accesses the marker function softkeys
that assist with measurements.
• Peak Search hardkey places a marker on the highest peak.
• File/Print hardkey accesses the softkey menus to
configure the file type, save, and recall, and save location
for the file.
4
N9320A Spectrum Analyzer
Overview
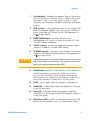
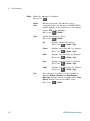
7
Data Control Keys including the numeric keypad, arrow keys,
back key, Enter key and knob. Used to change and control
the numeric value of an active function such as center
frequency, start frequency, resolution bandwidth, and marker
position.
8
RF IN connector is the signal input port for the analyzer. The
limit for maximum damage level is an average continuous
power of 40 dBm, DC voltage 50 VDC. The impedance is
50 W. (N- type female).
9
PROBE POWER connector provides DC power for
high- impedance AC probes or other accessories (+15 VDC,
–12 VDC, 150 mA maximum).
10
CAL OUT connector provides an amplitude reference signal
output of 50 MHz at –10 dBm (BNC female).
11
TG SOURCE connector (optional) N- type female, is the source
output for the built- in tracking generator. The impedance is
50 W. (for Option TG3)
CAUTION
N9320A Spectrum Analyzer
1
If the tracking generator output power is higher than the maximum power
that the device under test can tolerate, it may damage the device under
test. Do not exceed the maximum power of DUT.
12
Standby Switch switches on all functions of the analyzer. To
switch the analyzer off, press the switch for at least 2
seconds. This deactivates all the analyzer functions but
allows power to be supplied to the internal circuits for as
long as the analyzer is connected to AC line power.
13
On LED (green) lights when the analyzer is switched on.
14
Standby LED (orange) lights when the analyzer is connected
to the AC line power.
15
Remote LED (red) lights when the analyzer is remotely
controlled by a PC through the USB host interface connector
on the rear panel.
16
USB connector (DEV) provides a connection between the USB
devices and the analyzer, such as a USB memory device.
5
1
Overview
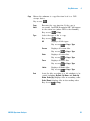
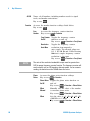
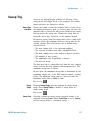
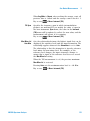
Display Annotations
4
5
7
6
8
9
10
11
12
3
2
1
27
OPT
26
Span
1.000000 MHz
25
13
24
23
22
21
20
6
19
18
17
15
16
14
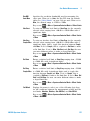
Item
Description
Notes (Associated function key)
1
Amplitude scale
[Amplitude] > Scale Type
2
Detector mode
[Det/Display] > Detector
3
Reference level
[Amplitude] > Rel Level
4
Active function block
The function currently in use
5
Time and date display
[Preset/System] > Time/Date
6
RF attenuation
[Amplitude] > Attenuation
7
Marker frequency
[Marker] or
[Marker] > Function > Frequency Counter
8
Uncal indicator
The readout of amplitude is uncalibrated.
9
Marker amplitude
[Marker]
10
External reference
An external frequency reference is in use.
11
Remote mode
The analyzer is in remote mode
12
Key menu title
Dependent on current function key selection.
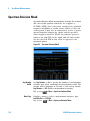
N9320A Spectrum Analyzer
Overview
1
13
Softkey menu
Refer to “Key Reference” for details.
Dependent on current function key selection.
14
Frequency span
[SPAN]
15
Sweep time
[Sweep/Trig] > Sweep Time
16
Video bandwidth
[BW/Avg] > Video BW
17
Display status line
Display status and instrument messages.
18
Resolution bandwidth
[BW/Avg] > Res BW
19
Center frequency
[Frequency] > Center frequency
20
Continuous peak
[Peak Search] > Continuous Pk
21
Signal track
[Frequency] > Signal Track
22
Internal preamplifier
[Amplitude] > Int Preamp
23
Trigger/Sweep
F - free run trigger
V - video trigger
E - external trigger
C - continuous sweep
S - single sweep
[Sweep/Trig]
example:
FC = free run trigger, continuous sweep mode
24
Trace mode
W - clear write
M - maximum hold
m - minimum hold
V - view
S - store blank
[Trace]
examples:
W1 = trace 1, clear write mode
M2 = trace 2, max hold mode
S3 = trace 3, store blank mode (not active)
traces are color coded for differentiation.
25
Average
VAvg - video average
PAvg - power average
[BW/Avg] > Average On Off
26
Display line
[Det/Display] > display Line On Off
27
Optimized Phase
a
[Marker] > Function > Optimize Phase Noise
a. Optimized Phase is only available when SPAN doesn’t exceed 50 kHz.
N9320A Spectrum Analyzer
7
1
Overview
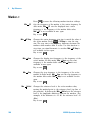
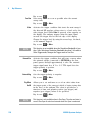
Rear Panel Overview
9
8
SERIAL LABEL
ATTACH HERE
VGA OUT
7
USB
1
REF OUT
LAN
10MHz
K LOCK
REF IN
~100-240 V
50-60 Hz
100 W MAX
EXT TRIG IN
10MHz
HIPOT LABEL
ATTACH HERE
TTL
6
2
3
8
4
5
1
REF OUT connector provides a frequency of 10 MHz, amplitude
of –10 dBm reference output. (BNC female)
2
REF IN connector accepts an external timebase with a
frequency of 10 MHz, amplitude of –5 to +10 dBm (BNC
female).
3
Kensington Lock
4
LAN port is reserved for future expansion.
5
EXT TRG IN (TTL) connector accepts an external voltage input,
the positive edge of which triggers the analyzer sweep
function (BNC female).
6
Power switch isolates the analyzer from the AC line power.
After switch on, the analyzer enters into standby mode and
the orange standby LED on the front panel lights.
7
AC power receptacle accepts a three- pin line power plug.
8
VGA connector provides the video output signal to an
external monitor or projector (D- sub 15- pin female).
9
USB Host connector provides a connection between the
analyzer and an PC for remote control.
lock the instrument for safety.
N9320A Spectrum Analyzer
Overview
1
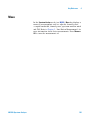
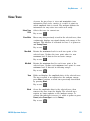
Front and rear panel safety and compliance symbols
The instruction manual symbol: indicates that the user must refer to specific instructions in the manual.
The CE mark: a registered trademark of the European Community.
ISM1-A
C
US
ICES/NMB-001
N10149
Shows that this is an Industrial Scientific and Medical Group 1 Class
A product. (CISPR 11, Clause 4)
The CSA mark: a registered trademark of the Canadian Standards
Association International.
The ISM device complies with Canadian Interference- Causing
Equipment Standard- 001.
Cet appareil ISM est conforme à la norme NMB- 001 du Canada.
The C-Tick mark: a trademark registered to the Australian
Communication Media Authority. It indicates compliance with all
Australian EMC regulatory information.
marks the “on/standby” position of the switch.
indicates that the instrument requires AC power input.
indicates this product complies with the WEEE Directive(2002/96/EC)
marking requirements and you must not discard this equipment in
domestic household waste. Do not dispose in domestic household
waste. To return unwanted products, contact your local Agilent office,
or refer to http://www.agilent.com/environment/product/
N9320A Spectrum Analyzer
9
1
10
Overview
N9320A Spectrum Analyzer
Agilent N9320A Spectrum Analyzer
User’s Guide
2
Getting Started
Check the Shipment and Order List
Power Requirements
13
Environmental Requirements
Safety Notice
12
15
18
Electrostatic Discharge Protection
Power on and Check
Some helpful Tips
Remote Control
19
20
22
24
This chapter gives you the information to start using the
spectrum analyzer correctly.
s
11
2
Getting Started
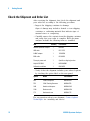
Check the Shipment and Order List
After receiving the shipment, first check the shipment and
your order list according to the following procedure.
• Inspect the shipping container for damage.
Signs of damage may include a dented or torn shipping
container or cushioning material that indicate signs of
unusual stress or compacting.
• Carefully remove the contents from the shipping container
and verify that your order is complete. Each spectrum
analyzer includes the following items as standard:
Item
Quantity
Part number
N9320A Spectrum Analyzer
1
N9320A
USB cable
1
8121-1515
N-BNC adapter
1
1250-0780
BNC cable
1
8120-2682
Three-pin power cord
1
Specific to shipping location
Help kit CD-ROM
1
N9320-84500
Calibration certificate
1
5962-0476
• Verify if that the shipment includes your ordered options
by checking the option label on the rear panel:
Option
Name
Part number
PA3
3 GHz Preamplifier
N9320A-PA3
TG3
3 GHz Tracking Generator
N9320A-TG3
1HB
Handle and bumpers
N9320A-1HB
1CM
Rackmount kit
N9320A-1CM
1TC
Hard transit case
N9320A-1TC
For any questions about your shipment, Contact Agilent
Technologies for consulting and service.
12
N9320A Spectrum Analyzer
Getting Started
2
Power Requirements
The spectrum analyzer has an auto- ranging line voltage
input. The AC power supply must meet the following
requirements:
Voltage:
100 to 240 VAC (90 to 264 VAC)
Frequency:
50 to 60 Hz
Power:
Maximum 100 W
AC Power Cord
The analyzer is equipped with a three- wire power cord, in
accordance with international safety standards. This cable
grounds the analyzer cabinet when connected to an
appropriate power line outlet. The cable appropriate to the
original shipping location is included with the analyzer.
Various AC power cables are available that are unique to
specific geographic areas. You can order additional AC power
cables for use in different areas. The table AC Power Cords
lists the available AC power cables, the plug configurations,
and identifies the geographic area in which each cable is
appropriate.
The detachable power cord is the product disconnecting
device. It disconnects the mains circuits from the mains
supply before other parts of the product. The front panel
switch is only a standby switch and do not disconnect
instrument from LINE power.
N9320A Spectrum Analyzer
13
2
Getting Started
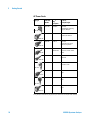
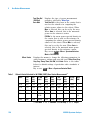
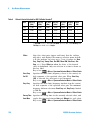
AC Power Cords
Plug Type
Cable Part
Number
Plug a
Description
8121-1703
BS 1363/A
For use in
Country & Region
Option 900
United Kingdom, Hong Kong,
Singapore, Malaysia
250V 10A
8120-0696
AS 3112:2000
Option 901
Australia, New Zealand
250V 10A
8120-1692
IEC 83 C4
Option 902
Continental Europe, Korea,
Indonesia, Italy, Russia
250V 16A
8120-1521
CNS 10917-2
/NEMA 5-15P
125V 10A
8120-2296
SEV 1011
Option 903
Unite States, Canada, Taiwan,
Mexico
Option 906
Switzerland
250V 10A
8120-4600
SABS 164-1
Option 917
South Africa, India
230V 15A
8120-4754
JIS C8303
Option 918
Japan
125V 15A
8120-5181
SI 32
Option 919
Israel
250V 16A
8120-8377
GB 1002
Option 922
China
250V 10A
a. Plug description describes the plug only. The part number is for the complete cable assembly.
14
N9320A Spectrum Analyzer
Getting Started
2
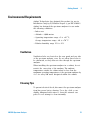
Environmental Requirements
Agilent Technologies has designed this product for use in
Installation Category II, Pollution Degree 2, per IEC 61010- 1.
Agilent has designed the spectrum analyzer for use under
the following conditions:
• Indoor use
• Altitude < 3,000 meters
• Operating temperature range: +5 to +45 oC;
Storage temperature range: –20 to +70 oC
• Relative humidity range 15% to 95 %
Ventilation
Ventilation holes are located on the rear panel and one side
of the spectrum analyzer cover. Do not allow these holes to
be obstructed, as they allow air flow through the spectrum
analyzer.
When installing the spectrum analyzer in a cabinet, do not
restrict the convection of the analyzer. The ambient
temperature outside the cabinet must be less than the
maximum operating temperature of the spectrum analyzer by
4 oC for every 100 watts dissipated within the cabinet.
Cleaning Tips
To prevent electrical shock, disconnect the spectrum analyzer
from line power before cleaning. Use a dry cloth or one
slightly dampened with water to clean the external case
parts. Do not attempt to clean internally.
N9320A Spectrum Analyzer
15
2
Getting Started
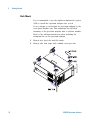
Rack Mount
It is recommended to use the Agilent rackmount kit (option
1CM) to install the spectrum analyzer into a rack.
Do not attempt to rack mount the spectrum analyzer by the
front panel handles only. This rackmount kit will allow
mounting of the spectrum analyzer with or without handles.
Refer to the following instructions when installing the
rackmount kit on the spectrum analyzer.
16
1
Remove feet, key- locks and tilt stands.
2
Remove side trim strips and a middle screw per side.
N9320A Spectrum Analyzer
Getting Started
CAUTION
2
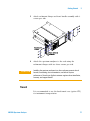
3
Attach rackmount flange and front handle assembly with 3
screws per side.
4
Attach the spectrum analyzer to the rack using the
rackmount flanges with two dress screws per side.
Installing the spectrum analyzers into other racks may promote shock
hazards, overheating, dust contamination, and inferior system
performance. Consult your Agilent customer engineer about installation,
warranty, and support details.
Transit
It is recommended to use the hard transit case (option 1TC)
for instrument transportation.
N9320A Spectrum Analyzer
17
2
Getting Started
Safety Notice
Read the following warnings and cautions carefully before
powering on the spectrum analyzer to ensure personal and
instrument safety.
18
WAR N ING
Always use a well-grounded, three-pin AC power cord to connect to
power source. Personal injury may occur if there is any interruption of
the AC power cord. Intentional interruption is prohibited. If this product
is to be energized via an external auto transformer for voltage
reduction, make sure that its common terminal is connected to a
neutral (earthed pole) of the power supply.
WAR N ING
Personal injury may result if the spectrum analyzer covers are removed.
There are no operator serviceable parts inside. To avoid electrical
shock, refer servicing to qualified personnel.
WAR N ING
Electrical shock may result if the spectrum analyzer is connected from
the power supply while cleaning. Do not attempt to clean internally.
CAUTION
Prevent damage to the instrument and ensure protection of the input
mixer by limiting average continuous power input to +30 dBm, DC voltage
to 50 VDC, maximum pulse voltage to 125 V. Instrument damage may
result if these precautions are not followed.
N9320A Spectrum Analyzer
Getting Started
2
Electrostatic Discharge Protection
Electrostatic discharge (ESD) damages or destroys electronic
components (the possibility of unseen damage caused by
ESD is present whenever transported, stored, or while the
instrument is in use).
This product contains components that are easily damaged
by electrostatic discharge. To help reduce the possibility of
ESD damage that can occur while using test equipment,
follow these guidelines:
1
Before connecting any coaxial cable to the spectrum analyzer
connector for the first time each day, momentarily short the
center and outer conductors of the cable together to
eliminate any potential electrostatic charges that may exist.
2
Personnel should be grounded with an approved type, 1 MW
resistor- isolated ESD wrist- strap before touching the center
pin of any connector, and before removing any assembly
from the spectrum analyzer.
3
Be sure that all instruments are properly earth grounded to
prevent build- up of static charges.
For more information about ESD and how to prevent ESD
damage, contact the Electrostatic Discharge Association
(http://www.esda.org). The ESD standards developed by this
agency are sanctioned by the American National Standards
Institute (ANSI).
N9320A Spectrum Analyzer
19
2
Getting Started
Power on and Check
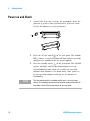
1
Connect the AC power cord into the instrument. Insert the
plug into a power socket provided with a protective earth.
Set the tilt adjustors for your preference.
2
Press the AC line switch
on the rear panel. The standby
LED (orange) on the front panel will light and the spectrum
analyzer is in standby mode (AC power applied).
3
Press the standby switch
on the front panel. The On LED
(green) will light, and the spectrum analyzer boots up.
Self- initialization takes about 25 seconds; the spectrum
analyzer then defaults to the menu mode. After power on,
let the spectrum analyzer warm up for 45 minutes for
stabilization.
NOTE
20
The front panel switch is a standby switch only; it is not a power
switch. To completely disconnect the spectrum analyzer from the AC
line power, shut off the power switch on the rear panel.
N9320A Spectrum Analyzer
Getting Started
2
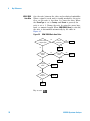
Check for Instrument Messages
The spectrum analyzer has two categories of instrument
messages: error and warning messages. A error message is
triggered by operation errors, for example, parameter setting
conflicts or data input that is out of the range of a
parameter. An warning message may be triggered by
hardware defects which could result in damage to
instrument.
Here are some tips to check the instrument messages.
N9320A Spectrum Analyzer
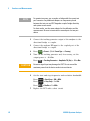
1
Check the display to see if any messages display in the
status bar. Press Preset/
System > More > Show Errors to review each
messages. Refer to Chapter 6, “Instrument Messages” for
detailed system messages descriptions.
2
When you have reviewed and resolved all of the error
messages, press Preset/
System > More > Show Errors > Clear error queue to
delete the messages.
3
Cycle the power to the analyzer and re- check to see if the
Instrument messages is still there.
4
If the error messages cannot be resolved, contact the
Agilent Customer Contact Center for assistance or service.
21
2
Getting Started
Some helpful Tips
The following contains information to help in using and
maintaining the instrument for optimum operation, including
alignment, external reference, firmware update and option
activation.
Running Internal Alignments
To meet the instrument performance specifications, the
analyzer must periodically be manually aligned.
When an alignment is being run, there will be an audible clicking
sound as the attenuator settings are changed. This sound is not an
indication of a problem.
NOTE
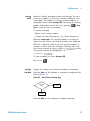
1
Connect a BNC cable with a correct type N- BNC adapter
between the CAL OUT and RF IN front panel connectors.
2
After instrument warm- up, press
All.
Preset/
System
> Alignment > Align >
Refer to “Alignment” on page 112 for details.
Enable the Options
Option license key information is required to enable product
options. Contact your nearest Agilent Office for purchasing a
license. Refer to the procedures below to activate the options
you have purchased. (option TG3 and option PA3)
22
1
Press
2
Enter the option number to be enabled. Press [Enter] to
confirm your input.
3
Press
4
Enter the license key information. Press [Enter] to confirm
your input and terminate the license key input. The option
will be enabled immediately.
Preset/
System
Preset/
System
> More > More > Licensing > Option
> More > More > Licensing > License key
N9320A Spectrum Analyzer
Getting Started
2
Using an External Reference
To use an external 10 MHz source as the reference
frequency, connect the external reference source to the REF
IN connector on the rear panel. An EXT REF indicator will
display in the upper bar of the display. The signal level must
be in the range of –5 to +10 dBm.
Firmware Revision
Press Preset/
System > More > Show software to view the firmware
revision of your analyzer. If you call Agilent Technologies
regarding your analyzer, it is helpful to have this revision
and the analyzer serial number available. To update the
firmware, refer to:
http://www.agilent.com/find/n9320a
Follow this procedure to finish the firmware update:
CAUTION
N9320A Spectrum Analyzer
1
Download the firmware package from web. Extract and copy
the file version and folder “n9320a” into the root directory
of a USB stick.
2
Turn the N9320A off. Then insert the USB stick into the
USB connector.
3
Power on your spectrum analyzer, the instrument will
perform the update process automatically. The upgrade
procedure will take about 10 minutes.
Any interruption during the update process will result in update failure
and system data lost. Do not remove the USB storage device until the
update is finished.
23
2
Getting Started
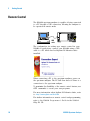
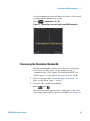
Remote Control
The N9320A spectrum analyzer is capable of being connected
to a PC through a USB connection, allowing the analyzer to
be operated in remote mode.
N9320A
SPECTRUM ANALYZER 9 kHz - 3.0 GHz
Auto
Tune
MODE
4
Remote
USB
cable
Standby
On
8
5
1
2
0
·
TG SOURCE
Sweep/
Trig
BW/
Avg
View/
Trace
7
Det/
Display
Marker
Local
File/
Print
Meas
M arker
Save
Peak
Search
9
6
3
Back
Enter
50VDC M AX
30dBm 1W MAX
RF IN 50
CAL OUT
50M Hz 10dBm
PROBE POWER
CAT Ⅱ
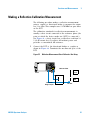
The configuration for setting up a remote control for your
N9320A is easily done: connect your N9320A using a USB
cable to a PC which has had Agilent IO Libraries Suite
installed.
When connecting a PC to the spectrum analyzer, power on
the spectrum analyzer. The PC will then detect if there is a
connection to the spectrum analyzer.
To maximize the flexibility of the remote control feature, use
SCPI commands to create your own programs.
For more information about Agilent IO Libraries Suite, refer
to: http://www.agilent.com/find/iolib
For further information on remote control and programming,
refer to the N9320A Programmer’s Guide in the N9320A
Help Kit CD.
24
N9320A Spectrum Analyzer
Agilent N9320A Spectrum Analyzer
User’s Guide
3
Functions and Measurements
Making a Basic Measurement
Measuring Multiple Signals
26
30
Measuring a Low-Level Signal
39
Improving Frequency Resolution and Accuracy
Tracking Drifting Signals
45
Making Distortion Measurements
Measuring Phase Noise
43
47
53
Stimulus Response Transmission
54
Measuring Stop Band Attenuation of a Lowpass Filter
Making a Reflection Calibration Measurement
57
60
Measuring Return Loss Using the Reflection Calibration Routine
Viewing Catalogs and Saving Files
63
64
This chapter provides information on the analyzer functions
and specific measurements capabilities of the spectrum
analyzer.
It is assumed that the operator has an understanding of the
front and rear panel layout, and display annotations of the
analyzer. For information on the front panel and display
details, refer to “Agilent N9320A at a Glance” on page 2.
s
25
3
Functions and Measurements
Making a Basic Measurement
In this guide, the keys labeled with [ ], for example,
[Preset/System] refer to front- panel hardkeys. Pressing many
of the hardkeys accesses softkey menus that are displayed
along the right side of the screen. The softkey menu labels
are aligned so that they are located next to the softkeys at
the right side of the display screen. For example, Preset is a
softkey menu selection when first pressing [Preset/System].
Using the Front Panel
This section provides you with the information on using the
front panel of the spectrum analyzer.
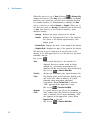
Entering Data
When setting the measurement parameters, there are several
ways to enter or modify the value of the active function:
Knob
Arrow Keys
Increments or decrements the current value.
Increments or decrements the current value by a step unit.
Numeric Keys
Enters a specific value. Then press the desired terminator
(either a unit softkey, or [Enter] hardkey).
Unit Softkeys
Terminate (enter) a value with a unit softkey from the menu.
Enter Key
Terminates an entry when no unit of measure is required, or
the instrument uses the default unit.
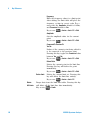
Back Key
To delete the current input digit prior to entering the value.
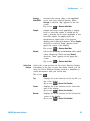
Using Softkeys
Softkeys are used to modify the analyzer function parameter
settings. Some examples of softkey types are:
Toggle
Submenu
26
Turn on or off an instrument state.
Displays a secondary menu of softkeys, {More}.
Choice
Selecting from a list of standard values or filenames.
Adjust
Highlights the softkey and sets the active function.
N9320A Spectrum Analyzer
Functions and Measurements
3
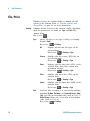
Presetting the Spectrum Analyzer
Preset function provides a known instrument status for
making measurements. There are two types of presets,
factory and user:
Factory Preset
When this preset type is selected, it restores the analyzer to
its factory- defined state. A set of known instrument
parameter settings defined by the factory. Refer to “Factory
Preset State” on page 111 for details.
User Preset
Restores the analyzer to a user- defined state. A set of user
defined instrument parameter settings saved for assisting the
user in quickly returning to known a instrument
measurement setup.
Press
type.
Preset/
System
> Pwr on/Preset > Preset Type to select the preset
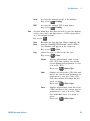
When Preset Type is set to Factory, pressing Preset/
System > Preset
triggers a factory preset condition. The instrument will
immediately return to the factory default instrument
parameter setting.
When Preset Type is set to User, pressing Preset/
System > Preset
displays both User Preset and Factory Preset softkeys. The user
may then select the preset desired from the softkey menu
selections.
Setting up a User Preset
To quickly return to instrument settings that are user
defined, perform the following steps to save the instrument
state as the user- defined preset:
N9320A Spectrum Analyzer
1
Set the instrument parameters to the values and settings
necessary for the user preset state. This would include the
frequency, span, amplitude, BW, and measurement type and
any other setup details desired.
2
Press Preset/
System > Pwr on/Preset > Save User Preset, to save the
current instrument settings as the ‘user preset’ state. The
user preset will not affect the default factory preset settings.
User preset settings can be changed and saved at any time.
27
3
Functions and Measurements
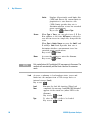
Viewing a Signal
Refer to the procedures below to view a signal.
1
Press Preset/
System > Pow on/Preset > Preset Type > Factory to enable
the factory- defined preset state.
2
Press Preset/
System > Preset to restore the analyzer to its
factory- defined state.
3
Connect the 10 MHz REF OUT on the rear panel to the
front- panel RF IN.
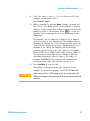
Setting the Reference Level and Center Frequency
1
Press
Amplitude
> 10 > dBm to set 10 dBm reference level.
2
Press
Frequency
> 30 > MHz to set 30 MHz to center frequency.
Setting Frequency Span
Press
SPAN
> 50 > MHz to set 50 MHz frequency span.
Changing the reference level changes the amplitude value of the top
graticule line. Changing the center frequency changes the horizontal
placement of the signal on the display. Increasing the span will
increase the frequency range that appears horizontally across the
display.
NOTE
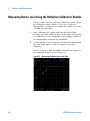
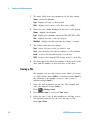
Reading Frequency and Amplitude
1
28
Press
peak.
Peak
Search
to place a marker (labeled 1) on the 10 MHz
N9320A Spectrum Analyzer
Functions and Measurements
3
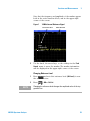
Note that the frequency and amplitude of the marker appear
both in the active function block, and in the upper- right
corner of the screen.
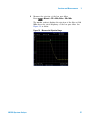
Figure 1
10 MHz Internal Reference Signal
Active function block
Marker Annotation
Marker
10.000000 MHz
0.43 dBm
2
Use the knob, the arrow keys, or the softkeys in the Peak
Search menu to move the marker. The marker information
will be displayed in the upper- right corner of the screen.
Changing Reference Level
NOTE
N9320A Spectrum Analyzer
1
Press Amplitude and note that reference level (Ref Level) is now
the active function.
2
Press
Marker
> Mkr-> Ref Lvl.
Changing the reference level changes the amplitude value of the top
graticule line.
29
3
Functions and Measurements
Measuring Multiple Signals
This section provides the information on how to measure
multiple signals.
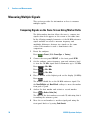
Comparing Signals on the Same Screen Using Marker Delta
The delta marker function allows the user to compare two
signals when both appear on the screen at the same time.
In the following example, harmonics of the 10 MHz reference
signal available are used to measure frequency and
amplitude differences between two signals on the same
screen. Delta marker is used to demonstrate this
comparison.
1
Preset the analyzer:
Press
Preset/
System
> Preset (With Preset Type of Factory)
2
Connect the rear panel REF OUT to the front panel RF IN.
3
Set the analyzer center frequency, span and reference level
to view the 10 MHz signal and its harmonics up to 50 MHz:
4
Press
Frequency
> 30 > MHz
Press
SPAN
> 50 > MHz
Press
Amplitude
> 10 > dBm
Place a marker at the highest peak on the display (10 MHz):
Press
Peak
Search
The marker should be on the 10 MHz reference signal. Use
the Next Pk Right and Next Pk Left softkeys to move the marker
from peak to peak.
5
Anchor the first marker and activate a second marker:
Press
Marker
> Delta > Delta (On)
The label on the first marker now reads 1R, indicating that it
is marking the reference point.
6
30
Move the second marker to another signal peak using the
front- panel knob or by using Peak Search.
N9320A Spectrum Analyzer
Functions and Measurements
Press
Peak
Search
3
> Next Peak or
Press Peak
Search > Next Pk Right or Next Pk Left. Continue pressing
the Next Pk softkeys until the marker is on the correct signal
peak.
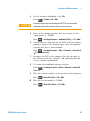
The amplitude and frequency differences between the
markers are displayed in the active function block.
Figure 2
NOTE
N9320A Spectrum Analyzer
Delta pair marker with signals on the same screen
To increase the resolution of the marker readings, turn on the
frequency count function. For more information, refer to “Improving
Frequency Resolution and Accuracy” on page 45.
31
3
Functions and Measurements
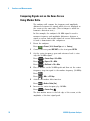
Comparing Signals not on the Same Screen
Using Marker Delta
The analyzer will compare the frequency and amplitude
differences between two signals which are not displayed on
the screen at the same time. (This technique is useful for
harmonic distortion tests.)
In this example, the analyzer’s 10 MHz signal is used to
measure frequency and amplitude differences between a
signal on screen, and another signal off screen. Delta marker
is used to demonstrate this comparison.
1
Preset the analyzer:
Press
Preset/
System
> Preset (With Preset Type set to Factory)
2
Connect the rear panel REF OUT to the front panel RF IN.
3
Set the center frequency, span and reference level to view
only the 50 MHz signal:
4
5
Press
Frequency
Press
SPAN
Press
Amplitude
> Span > 25 > MHz
> Ref Level > 10 > dBm
Place a marker on the 50 MHz peak and then set the center
frequency step size equal to the marker frequency (10 MHz):
Press
Peak
Search
Press
Marker
> Mkr -> CF Step
Activate the marker delta function:
Press
6
> Center Freq > 50 > MHz
Marker
> Delta > Delta (On)
Increase the center frequency by 10 MHz:
Press
Frequency
> Center Freq,
FM
The first marker moves to the left edge of the screen, at the
amplitude of the first signal peak.
32
N9320A Spectrum Analyzer
Functions and Measurements
3
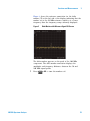
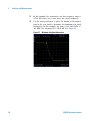
Figure 3 shows the reference annotation for the delta
marker (1R) at the left side of the display, indicating that the
marker set at the 50 MHz reference signal is at a lower
frequency than the frequency range currently displayed.
Figure 3
Delta Marker with Reference Signal Off-Screen
The delta marker appears on the peak of the 100 MHz
component. The delta marker annotation displays the
amplitude and frequency difference between the 50 and
100 MHz signal peaks.
7
N9320A Spectrum Analyzer
Press
Marker
> Off to turn the markers off.
33
3
Functions and Measurements
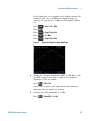
Resolving Signals of Equal Amplitude
In this example a decrease in the resolution bandwidth
(RBW) is used in combination with a decrease in video
bandwidth (VBW) to resolve two signals of equal amplitude
with a frequency separation of 100 kHz.
Figure 4
Setup for obtaining two signals
Signal Generator
N9310A
RF Signal Generator
N9310A
FUN CTIONS
9 kHz - 3.0 GHz
AM
Frequency
Amplitude
Remote
I/ Q
FM
M
Enter
Spectrum Analyzer
Signal Generator
7
8
9
4
5
6
1
2
3
0
·
Standby
On
Utility
Preset
Sw eep
File
Local
Pulse
Trigger
LF Out
RF Signal Generator
Frequency
AM
Amplitude
Remote
M
7
8
9
4
5
6
1
2
3
0
·
Standby
On
RF OUT 50
I/ Q
FM
Enter
RF
On/ Off
LF OUT
N 9320A
FUNCTION S
9 kHz - 3.0 GHz
M OD
On/ Off
Utility
Preset
Sw eep
File
Local
Pulse
Trigger
LF Out
SPECTRUM AN ALYZER
9 kHz - 3.0 GHz
Auto
Tune
View /
Trace
MODE
M OD
On/ Off
RF
On/ Off
LF OUT
Rem ote
RF OUT 50
Standby
On
RF OUT
8
9
4
5
6
1
2
0
·
3
BW /
Avg
Sw eep/
Trig
Det/
Display
M arker
Local
File/
Print
Meas
M arker
Save
Peak
Search
Back
Enter
50VDC M AX
30dBm 1W M AX
TG SOURCE
REV ERSE PWR
4W MAX 30VDC
REV ERSE PWR
4W M AX 30VDC
7
RF IN 50
CAL OU T
50M Hz 10dBm
PROBE POWER
CAT Ⅱ
RF IN
RF OUT
Directional Coupler
Notice that the final RBW selection to resolve the signals is
the same width as the signal separation while the VBW is
slightly narrower than the RBW.
1
Connect two sources to the analyzer input as shown above.
2
Set one source to 300 MHz. Set the frequency of the other
source to 300.1 MHz. Set both source amplitudes to –20 dBm.
3
Setup the analyzer to view the signals:
Press
Press
Press
Press
Preset/
System
> Preset (With Preset Type of Factory)
Frequency
BW/
Avg
SPAN
> 300 > MHz
> 300 > kHz
> 2 > MHz
A single signal peak is visible. See Figure 5 for example.
34
N9320A Spectrum Analyzer
Functions and Measurements
3
If the signal peak is not present on the display, increase the
frequency span out to 20 MHz, turn signal tracking on,
decrease the span back to 2 MHz and turn signal tracking
off:
Press
Peak
Search
Press
Frequency
Press
SPAN
Press
Frequency
Figure 5
4
> Span > 20 > MHz
SPAN
Press
> Signal Track (On)
> 2 > MHz
> Signal Track (Off)
Unresolved Signals of Equal Amplitude
Change the resolution bandwidth (RBW) to 100 kHz so that
the RBW setting is less than or equal to the frequency
separation of the two signals:
Press
BW/
Avg
> 100 > kHz
Notice that the peak of the signal has become flattened
indicating that two signals are present.
5
Decrease the video bandwidth to 3 kHz:
Press
N9320A Spectrum Analyzer
BW/
Avg
> Video BW > 3 > kHz
35
3
Functions and Measurements
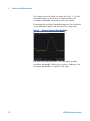
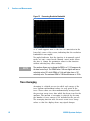
Two signals are now visible as shown in Figure 6. Use the
front- panel knob or arrow keys to further reduce the
resolution bandwidth and better resolve the signals.
Decreasing the resolution bandwidth improves the resolution
of the individual signals and increases the sweep time.
Figure 6
Resolving Signals of Equal Amplitude
For fastest measurement times, use the widest possible
resolution bandwidth. Under factory preset conditions, the
resolution bandwidth is coupled to the span.
36
N9320A Spectrum Analyzer
Functions and Measurements
3
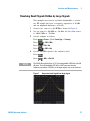
Resolving Small Signals Hidden by Large Signals
This example uses narrow resolution bandwidths to resolve
two RF signals that have a frequency separation of 50 kHz
and an amplitude difference of 60 dB.
1
Connect two sources to the RF IN as shown in Figure 4.
2
Set one source to 300 MHz at –10 dBm. Set the other source
to 300.05 MHz at –70 dBm.
3
Set the analyzer as follows:
Press
Press
Press
Preset/
System
Frequency
BW/
Avg
SPAN
Press
4
NOTE
> 300 > MHz
> 30 > kHz
> 500 > kHz
Set the 300 MHz signal to the reference level:
Press
Peak
Search
Press
Marker
> Mkr -> Ref Lel
The 30 kHz filter shape factor of 15:1 has a bandwidth of 450 kHz at the 60
dB point. The half-bandwidth (225 kHz) is NOT narrower than the
frequency separation of 50 kHz, so the input signals can not be resolved.
Figure 7
N9320A Spectrum Analyzer
> Preset. (With Preset Type of Factory)
Unresolved small signal from large signal
37
3
Functions and Measurements
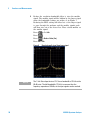
5
Reduce the resolution bandwidth filter to view the smaller
signal. The smaller signal will be hidden by the larger signal
when the bandwidth settings are wider, as in Figure 7.
Reducing the RBW setting will allow less of the larger signal
to pass through the analyzer and the smaller signals peak
will then rise out of the noise floor. Place a delta marker on
the smaller signal:
Press
BW/
Avg
Press
Peak
Search
Press
Marker
> 1 > kHz
> Delta > Delta (On)
Press 50 > kHz
Figure 8
NOTE
38
Resolved small signal from large signal
The 1 kHz filter shape factor of 15:1 has a bandwidth of 15 kHz at the
60 dB point. The half-bandwidth (7.5 kHz) is narrower than the
frequency separation of 50 kHz, so the input signals can be resolved.
N9320A Spectrum Analyzer
Functions and Measurements
3
Measuring a Low-Level Signal
This section provides information on measuring low- level
signals and distinguishing them from spectrum noise.
Reducing Input Attenuation
The ability to measure a low- level signal is limited by
internally generated noise of the spectrum analyzer. The
analyzers input attenuator affects the level of a signal
passing through the analyzer. If a signal power level is close
to the noise floor, reducing the analyzer input attenuation
will help raise the signal so that it can be seen rising out of
the noise.
Ensure that the total power of all input signals at the analyzer RF input
does not exceed +30 dBm (1 Watt).
CAUTION
1
Preset the analyzer
Press
2
Preset/
System
> Preset (With Preset Type of Factory)
Set the source frequency to 300 MHz, amplitude to –70 dBm.
Connect the source RF OUT to the analyzer RF IN.
Figure 9
Setup for obtaining one signal
Spectrum Analyzer
Signal Generator
N9310A
RF Signal Generator
Frequency
AM
Amplitude
FM
M
Enter
Remote
N 9320A
FUN CTIONS
9 kHz - 3.0 GHz
7
8
9
4
5
6
1
2
3
0
·
I/ Q
Utility
Preset
Sw eep
File
Local
Pulse
Trigger
LF Out
Standby
On
Auto
Tune
V iew /
Trace
M ODE
8
4
RF
On/ Off
Remote
RF OUT 50
REVERSE PWR
4W M AX 30VDC
N9320A Spectrum Analyzer
9 kHz - 3.0 GHz
7
M OD
On/ Off
LF OUT
RF OUT
SPECTRUM ANALYZER
Standby
On
5
1
2
0
·
BW/
Avg
Sw eep/
Trig
Det/
Display
M arker
Local
File/
Print
M eas
Marker
Save
Peak
Search
9
6
3
Back
Enter
50VDC M AX
30dBm 1W M AX
TG SOURCE
RF IN 50
CAL OUT
50M Hz 10dBm
PROBE POW ER
CAT Ⅱ
RF IN
39
3
Functions and Measurements
3
4
5
Set the center frequency, span and reference level:
Press
Frequency
Press
SPAN
Press
Amplitude
> Span > 2 > MHz
> Ref Level > 40 > –dBm.
Move the desired peak to the center of the display:
Press
Peak
Search
Press
Marker
> Mkr -> CF
Reduce the span to 500 kHz, if necessary re- center the peak:
Press
6
> Center Freq > 300 > MHz
> 500 > kHz
SPAN
Set the attenuation to 20 dB:
Press
Amplitude
Figure 10
> Attenuation > 20 > dB
A signal closer to the noise level
Note that increasing the attenuation moves the noise floor
closer to the signal level.
7
40
To allow more of the signal power to pass through the
analyzer, decrease the attenuation to 0 dB.
N9320A Spectrum Analyzer
Functions and Measurements
3
A lower attenuation value will mean that more of the signal
strength will be displayed on screen:
Press
Amplitude
Figure 11
> Attenuation > 0 > dB
Measuring a low-level signal using 0 dB Attenuation
Decreasing the Resolution Bandwidth
Resolution bandwidth settings affect the level of internal
noise but have little affect on the displayed level of
continuous wave (CW) signals. Decreasing the RBW by a
decade (factor of ten) reduces the noise floor by 10 dB.
1
Refer to the procedure “Reducing Input Attenuation” on
page 39 and follow steps 1, 2 and 3.
2
Decrease the resolution bandwidth:
Press
BW/
Avg
and
FM
The low- level signal appears more clearly due to the noise
level being reduced by the decrease in RBW (see Figure 12).
N9320A Spectrum Analyzer
41
3
Functions and Measurements
Figure 12
Decreasing Resolution Bandwidth
A “#” mark appears next to the Res BW annotation in the
lower left corner of the screen, indicating that the resolution
bandwidth is uncoupled.
Uncoupled indicates that the function is in manual control
mode, not auto control mode. Manual control mode allows
the user to change the parameter value for that function
without affecting any other settings.
NOTE
The analyzer allows you to change the RBW in a 1-3-10 sequence by
the data control keys. The RBWs below 1 kHz are digital and have a
selectivity ratio of 5:1 while RBWs at 1 kHz and higher have a 15:1
selectivity ratio. The maximum RBW is 3 MHz and minimum is 10 Hz.
Trace Averaging
Averaging is a digital process in which each sweep of the
trace returns measurement values for each point in the
trace. These values are then mathematically averaged with
the previous sweep trace data which has been stored in the
analyzer. The amount of averaging is selected by choosing
the number of trace sweeps to be included in the process.
The averaging function uses the most recent trace sweep
values so that the display shows any signal changes.
42
N9320A Spectrum Analyzer
Functions and Measurements
3
Selecting averaging, when the analyzer is auto- coupled,
changes the detection mode to Sample, smoothing the
displayed noise level.
This is a trace processing function and is not the same as using the
average detector (as described on page 42).
NOTE
1
Refer to the procedure “Reducing Input Attenuation” on
page 39 of this chapter and follow steps 1, 2 and 3.
2
To turn averaging on, toggle the softkey menu labeled
Average:
Press
3
BW/
Avg
> Average (On)
Set the number of averages to 20, using the number keypad,
up and down arrows, or the knob:
Press 20,
Enter
The averaging process smooths the viewed trace, low level
signals become more visible (see Figure 13). Changes to the
average number will restart the averaging process.
Figure 13
N9320A Spectrum Analyzer
Trace Averaging
43
3
Functions and Measurements
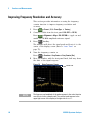
Improving Frequency Resolution and Accuracy
This section provides information on using the frequency
counter function to improve frequency resolution and
accuracy.
1
Press
2
Connect a cable from the front panel CAL OUT to RF IN;
Preset/
System
> Preset (With Preset Type of Factory)
Press Preset/
System > Alignment > Align > CAL OUT ON to toggle on and
enable the 50 MHz amplitude reference signal.
3
Press
Auto
Tune
hardkey.
The analyzer will detect the signal peak and locate it to the
center of the display screen (Refer to “Auto Tune” on
page 75).
4
Turn the frequency counter on:
Press
5
Marker
> Function > Freq Counter > Freq Counter (On).
Move the marker, with the front- panel knob, half- way down
the skirt of the signal response.
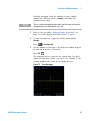
Figure 14
Using Frequency Counter
Counted result
Marker
50.032500 MHz
– 49.30 dBm
NOTE
44
The frequency and amplitude of the marker appears in the active function
area (this is not the counted result). The counted result appears in the
upper-right corner of the display to the right-side of Cntr1.
N9320A Spectrum Analyzer
Functions and Measurements
3
The marker readout in the active frequency function changes
while the counted frequency result (upper- right corner of
display) does not. For an accurate count, the marker need
not be placed at the exact peak of the signal response.
The Frequency counter properly functions only on stable, CW signals
or discrete spectral components. The marker power level must be
greater than 40 dB above the displayed noise level.
NOTE
6
To change the counter resolution:
Press
Marker
> Function > Freq Counter > Resolution
The frequency- counter resolution range is from 1 Hz to 1
kHz, and may be set to Auto or Manual.
7
To turn off the marker counter:
Press
NOTE
N9320A Spectrum Analyzer
Marker
> Function > Freq Counter > Freq Counter (Off).
When using the frequency counter function, the ratio of the resolution
bandwidth to the span must be greater than 0.02.
45
3
Functions and Measurements
Tracking Drifting Signals
This section provides information on measuring and tracking
signals that drift in frequency.
Measuring a Source’s Frequency Drift
The analyzer will measure source stability. The maximum
amplitude level and the frequency drift of an input signal
trace can be displayed and held by using the maximum hold
function. Using the maximum hold function you can measure
and determine how much of the frequency spectrum a signal
occupies. For more information, refer to “Max Hold” on
page 119.
Use signal tracking to return a signal drifting in frequency
to the center of the display. The drifting is captured by the
analyzer using the maximum hold function.
1
Connect the signal generator to the analyzer RF IN.
2
Output a signal with the frequency of 300 MHz and
amplitude of –20 dBm.
3
Set the analyzer center frequency, span and reference level.
Press
4
Preset/
System
> Preset. (With Preset Type of Factory)
Press
Frequency
Press
SPAN
Press
Amplitude
> Center Freq > 300 > MHz
> Span > 10 > MHz
> Ref Level > –10 > dBm
Place a marker on the peak of the signal and turn signal
tracking on:
Press
Peak
Search
Press
Frequency
Press
SPAN
> Signal Track (On)
> 1 > MHz
Notice that this holds the signal in the center of the display.
46
N9320A Spectrum Analyzer
Functions and Measurements
5
Turn off the signal track function:
Press
6
3
Frequency
> Signal Track (Off)
Measure the excursion of the signal with maximum hold:
Press
View/
Trace
> Max Hold
As the signal varies, maximum hold maintains the maximum
responses of the input signal. Annotation on the left side of
the screen indicates the trace mode. For example, M1 S2 S3
S4, indicates trace 1 is in maximum- hold mode, trace 2, trace
3, and trace 4 are in store- blank mode.
7
Activate trace 2 and change the mode to continuous sweep:
Press
View/
Trace
> Select Trace > Trace 2
Press Clear Write
Trace 1 remains in maximum hold mode to show any drift
in the signal.
8
Slowly increase the frequency of the signal generator. Your
analyzer display should look similar to Figure 15.
Figure 15
N9320A Spectrum Analyzer
Viewing a Drifting Signal With Max Hold and Clear Write
47
3
Functions and Measurements
Making Distortion Measurements
This section provides information on measuring and
identifying signal distortion.
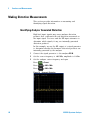
Identifying Analyzer Generated Distortion
High- level input signals may cause analyzer distortion
products that could mask the real distortion measured on
the input signal. Use trace and the RF input attenuator to
determine which signals, if any, are internally generated
distortion products.
In this example, we use the RF output of a signal generator
to determine whether the harmonic distortion products are
internally generated by the analyzer.
1
Connect the signal generator to the analyzer RF IN.
2
Set the source frequency to 200 MHz, amplitude to 0 dBm.
3
Set the analyzer center frequency and span:
Press
Preset/
System
Press
Frequency
> 400 > MHz
Press
SPAN
> 500 > MHz
Figure 16
48
> Preset
Harmonic Distortion
N9320A Spectrum Analyzer
Functions and Measurements
3
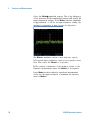
The signal produces harmonic products (spaced 200 MHz
from the original 200 MHz signal) in the analyzer input
mixer as shown in Figure 16.
4
5
Change the center frequency to the value of the first
harmonic:
Press
Peak
Search
> Next Peak
Press
Marker
> Mkr -> CF
Change the span to 50 MHz and re- center the signal:
Press
6
Press
Peak
Search
Press
Marker
> Mkr -> CF
Set the attenuation to 0 dB:
Press
7
> 50 > MHz
SPAN
Amplitude
> Attenuation > 0 > dB
To determine whether the analyzer generates harmonic
distortion products, first display the trace data in trace 2 as
follows:
Press
View/
Trace
> Select Trace > Trace 2
Press Clear Write
8
Allow trace 2 to update (minimum two sweeps), then store
the data from trace 2 and place a delta marker on the
harmonic of trace 2:
Press
View/
Trace
Press
Peak
Search
Press
Marker
> View
> Delta > Delta (On)
The analyzer display shows the stored data in trace 2 and
the measured data in trace 1. The MarkerΔ indicator reads
the difference in amplitude between the reference and active
markers.
9
Increase the RF attenuation to 10 dB:
Press
N9320A Spectrum Analyzer
Amplitude
> Attenuation > 10 > dB
49
3
Functions and Measurements
Notice the MarkerD amplitude readout. This is the difference
of the distortion product amplitude between 0 dB and 10 dB
input attenuation settings. If the MarkerΔ absolute amplitude
is approximately ≥ 1 dB for an input attenuator change, the
analyzer is generating, at least in part, the distortion.
The MarkerΔ amplitude readout comes from two sources:
1) Increased input attenuation causes poorer signal- to- noise
ratio. This causes the MarkerΔ to be positive.
2) The reduced contribution of the analyzer circuits to the
harmonic measurement causes the MarkerΔ to be negative.
Large MarkerΔ readout indicates significant measurement
errors. Set the input attenuator to minimize the absolute
value of MarkerΔ.
50
N9320A Spectrum Analyzer
Functions and Measurements
3
Third-Order Intermodulation Distortion
Two- tone, third- order intermodulation distortion is a
common specification in communication systems. When two
signals are present in a non- linear system, they may interact
and create third- order intermodulation distortion (TOI)
products that are located close to the original signals.
System components such as amplifiers and mixers contribute
to the generation of these distortion products.
For an example of the quick setup of TOI measurement,
refer to “Intermod (TOI)” on page 130.
This example will test a device for third- order
intermodulation through the use of markers. Two sources
are used, one set to 300 MHz and the other to 301 MHz.
1
Connect the equipment as shown in figure below. This
combination of signal generators, low pass filters, and
directional coupler (used as a combiner) results in a
two- tone source with very low intermodulation distortion.
Although the distortion from this setup may be better than
the specified performance of the analyzer, it is useful for
determining the TOI performance of the source/analyzer
combination. After the performance of the source/analyzer
combination has been verified, the device- under- test (DUT)
(for example, an amplifier) would be inserted between the
directional coupler output and the analyzer input.
N9310A
FUNCTIONS
RF Signal Generator 9 kHz - 3.0 GHz
AM
Frequency
Amplitude
Remote
Standby
On
I/ Q
FM
M
Enter
Spectrum Analyzer
Signal Generator
Signal Generator
7
8
9
4
5
6
1
2
3
0
·
N9310A
Utility
Preset
Sweep
File
Local
Pulse
Trigger
LF Out
RF
On/ Off
LF OUT
Remote
RF OUT 50
FUNCTIONS
RF Signal Generator 9 kHz - 3.0 GHz
Frequency
AM
I/ Q
Utility
Preset
Amplitude
FM
Sweep
File
Local
Pulse
Trigger
LF Out
M
Enter
MOD
On/ Off
7
8
9
4
5
6
1
2
3
0
·
Standby
On
N 9320A
SPECTRUM AN ALYZER
9 kHz - 3.0 GHz
Auto
Tune
View /
Trace
MODE
MOD
On/ Off
7
8
4
RF
On/ Off
LF OUT
Rem ote
RF OUT 50
Standby
On
5
1
2
0
·
Sw eep/
Trig
M arker
Local
File/
Print
Meas
M arker
Save
Peak
Search
6
3
Back
Enter
50VDC M AX
30dBm 1W M AX
TG SOURCE
RF IN 50
CAL OU T
50M Hz 10dBm
REVERSE PWR
4W MAX 30VDC
BW /
Avg
Det/
Display
9
PROBE POWER
CAT Ⅱ
REVERSE PWR
4W MAX 30VDC
RF OUT
RF IN
300 MHz LOW
PASS FILTER
300 MHz LOW
PASS FILTER
N9320A Spectrum Analyzer
Directional Coupler
51
3
Functions and Measurements
The coupler should have a high degree of isolation between the two
input ports so the sources do not intermodulate.
NOTE
2
Set one source (signal generator) to 300 MHz and the other
source to 301 MHz, for a frequency separation of 1 MHz. Set
the sources equal in amplitude as measured by the analyzer
(in this example, they are set to –5 dBm).
3
Set the analyzer center frequency and span:
Press
4
6
Frequency
Press
SPAN
8
52
> Center Freq > 300.5 > MHz
> Span > 5 > MHz
Reduce the RBW until the distortion products are visible:
BW/
Avg
and
FM
Move the signal to the reference level:
Press
Peak
Search
Press
Marker
> Mkr -> Ref Lvl
Reduce the RBW until the distortion products are visible:
Press
7
> Preset (With Preset Type of Factory)
Press
Press
5
Preset/
System
BW/
Avg
and
FM
Activate the second marker and place it on the peak of the
distortion product (beside the test signal) using the Next
PeaK:
Press
Marker
> Delta > Delta (On)
Press
Peak
Search
> Next Peak
Measure the other distortion product:
Press
Marker
> Normal
Press
Peak
Search
> Next Peak
N9320A Spectrum Analyzer
Functions and Measurements
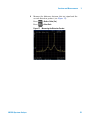
9
Measure the difference between this test signal and the
second distortion product (see Figure 17):
Press
Marker
> Delta > Delta (On)
Press
Peak
Search
> Next Peak
Figure 17
N9320A Spectrum Analyzer
3
Measuring the Distortion Product
53
3
Functions and Measurements
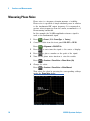
Measuring Phase Noise
Phase noise is a frequency domain measure of stability.
Phase noise is specified as single- sideband power in relation
to the fundamental RF output frequency. It is measured at
various offset frequencies from the carrier, normalized to a 1
Hz measuring bandwidth.
In this example the 50 MHz amplitude reference signal is
used as the fundamental signal.
1
Press
2
Connect a cable from the front panel CAL OUT to RF IN.
Preset/
System
> Preset (With Preset Type of Factory)
Press
Preset/
System
> Alignment > CAL OUT On
3
Press
Auto
Tune
to auto- tune the signal to the center of display.
4
Press
Peak
Search
5
Turn on the phase noise function to view the results:
Press
6
Marker
to place a marker on the peak of the signal.
> Function > Phase Noise > Phase Noise (On)
Change the offset:
Press
Marker
> Function > Phase Noise > Offset Manual
Then select the offset by pressing the corresponding softkeys
under the Phase Noise menu.
Marker D
20.000 kHz
Noise -97.91 dBc/Hz
54
N9320A Spectrum Analyzer
Functions and Measurements
3
Stimulus Response Transmission
The procedure below describes using the built- in tracking
generator of the analyzer to measure the rejection of a low
pass filter. A type of transmission measurement.
1
To measure the rejection of a low pass filter, connect the
equipment as shown in Figure 18. A 370 MHz low pass filter
as the DUT.
Figure 18
Transmission Measurement Test Setup
N9320A
SPECTRUM ANALYZER
9 kHz - 3.0 GHz
7
4
Remote
Standby
On
8
5
1
2
0
·
TG SOURCE
Auto
Tune
BW/
Avg
View/
Trace
Det/
Display
M arker
Local
File/
Print
M ODE
M eas
Sw eep/
Trig
M arker
Save
Peak
Search
9
6
3
Back
Enter
50V DC M AX
30dBm 1W M AX
RF IN 50
CAL OUT
50M Hz 10dBm
PROBE POWER
CAT Ⅱ
DUT
CAUTION
N9320A Spectrum Analyzer
2
Press
3
Set the start and stop frequencies and resolution bandwidth:
Press Frequency > Start Freq > 100 > MHz
Press Frequency > Stop Freq > 1 > GHz
Press BW/
> Res Bw > 3 > MHz
Avg
4
Turn on the tracking generator and if necessary, set the
output power to - 10 dBm:
Press MODE > Tracking Generator > Amplitude TG(On) > -10 > dBm
Preset/
System
> Preset. (With Preset Type of Factory)
Excessive signal input may damage the DUT. Do not exceed the
maximum power that the device under test can tolerate.
55
3
Functions and Measurements
To reduce ripples caused by source return loss, use 6 dB or greater
output attenuation. Tracking generator output attenuation is normally
a function of the source power selected. However, the output
attenuation may be controlled in the Tracking Generator menu.
NOTE
5
To increase measurement sensitivity and smooth the noise:
Press
BW/
Avg
> Res Bw > 30 > KHz
Press
BW/
Avg
> Video Bw > 300 > KHz
A decrease in displayed amplitude is caused by tracking
error.
6
Use peak tracking to correct the frequency offset:
Press
MODE
> Tracking Generator > More > Tracking Peak
Tracking error occurs when the output frequency of the
tracking generator is not matched to the input frequency of
the analyzer. The amplitude should return to the value that
was displayed prior to the decrease in resolution bandwidth.
7
Connect the cable from the tracking generator output to the
analyzer input. Store the frequency response in trace 3 and
normalize:
Press MODE > Tracking Generator > More > Normalize > Store Ref (1
→ 3) > Normalize (On)
8
Reconnect the DUT to the analyzer and change the
normalized reference position:
Press MODE > Tracking Generator > More > Normalize > Norm Ref
Posn > 8
56
N9320A Spectrum Analyzer
Functions and Measurements
9
3
Measure the rejection of the low pass filter:
Press Marker > Normal > 370 > MHz, Delta > 160> MHz
The marker readout displays the rejection of the filter at 160
MHz above the cutoff frequency of the low pass filter. See
Figure 19 as below.
Figure 19
N9320A Spectrum Analyzer
Measure the Rejection Range
57
3
Functions and Measurements
Measuring Stop Band Attenuation of a Lowpass Filter
When measuring filter performance, it is useful to look at
the stimulus response over a wide frequency range. Setting
the analyzer y- axis (amplitude) to Log scale type presents
the measurement data in a usable format for determining
filter characteristics.
The following example uses the tracking generator to
measure the stop band attenuation of a 370 MHz low pass
filter.
1
To measure the response of a low pass filter, connect the
equipment as shown in Figure 20. This example uses a
370 MHz low pass filter.
Figure 20
Transmission Measurement Test Setup
N9320A
Remote
Standby
On
SPECTRUM ANALYZER 9 kHz - 3.0 GHz
Auto
Tune
BW/
Avg
Sweep/
Trig
View/
Trace
Det/
Display
Marker
Local
File/
Print
MODE
Meas
Marker
Save
Peak
Search
7
8
9
4
5
6
1
2
0
·
TG SOURCE
3
Back
Enter
50VDC MAX
30dBm 1W MAX
RF IN 50
CAL OUT
50MHz 10dBm
PROBE POWER
CAT Ⅱ
DUT
58
2
Press
3
Set the start and stop frequencies and resolution bandwidth:
Preset/
System
> Preset. (With Preset Type of Factory)
Press
Frequency
> Start Freq > 100 > MHz
Press
Frequency
> Stop Freq > 1 > GHz
Press
Amplitude
> Scale Type > Log
N9320A Spectrum Analyzer
Functions and Measurements
4
3
Set the resolution bandwidth to 10 kHz:
Press
BW/
Avg
> Res Bw > 10 > KHz
Excessive signal input may damage the DUT. Do not exceed the
maximum power that the device under test can tolerate.
CAUTION
5
Turn on the tracking generator and, if necessary, set the
output power to - 10 dBm:
Press
6
MODE
> Tracking Generator > Amplitude TG(On) > -10 > dBm
Connect the test cable (but not the DUT) from the tracking
generator output to the analyzer input. Store the frequency
response into trace 3 and normalize:
Press MODE > Tracking Generator > More > Normalize > Store Ref (1
→ 3) > Normalize (On)
7
Reconnect the DUT to the analyzer. Note that the units of
the reference level have changed to dB, indicating that this
is now a relative measurement.
8
To change the normalized reference position:
Press MODE > Tracking Generator > More > Normalize > Norm Ref
Posn > 8
9
Place the reference marker at the specified cutoff frequency:
Press
10
> Delta Pair (Ref) > 370 > MHz
Place the second marker at 37 MHz:
Press
N9320A Spectrum Analyzer
Marker
Marker
> Delta Pair (Delta) > 37 > MHz
59
3
Functions and Measurements
11
In this example, the attenuation over this frequency range is
- 17.98 dB/octave (one octave above the cutoff frequency).
12
Use the front- panel knob to place the marker at the highest
peak in the stop band to determine the minimum stop band
attenuation. In this example, the peak occurs with Delta of
563 MHz. The attenuation is - 60.93 dB. See Figure 21.
Figure 21
60
Minimum Stop Band Attenuation
N9320A Spectrum Analyzer
Functions and Measurements
3
Making a Reflection Calibration Measurement
The following procedure makes a reflection measurement
using a coupler or directional bridge to measure the return
loss of a filter. This example uses a 370 MHz low pass filter
as the DUT.
The calibration standard for reflection measurements is
usually a short circuit connected at the reference plane (the
point at which the device under test (DUT) is connected.)
See Figure 22, a short circuit has a reflection coefficient of
1 (0 dB return loss). It reflects all incident power and
provides a convenient 0 dB reference.
1
Connect the DUT to the directional bridge or coupler as
shown in Figure 22. Terminate the unconnected port of the
DUT.
Figure 22
N9320A
Remote
Standby
On
SPECTRUM ANALYZER
Reflection Measurement Short Calibration Test Setup
9 kHz - 3.0 GHz
Auto
Tune
BW/
Avg
Sweep/
Trig
View /
Trace
Det/
Display
Marker
Local
File/
Print
MODE
Meas
Marker
Save
Peak
Search
7
8
9
4
5
6
1
2
0
·
TG SOURCE
3
Back
Enter
50VDC M AX
30dBm 1W MAX
50M Hz 10dBm
Reference Plane
RF IN 50
CAL OUT
PROBE POWER
Short
Circuit
CAT Ⅱ
or
Coupled Port
DUT
Directional
Bridge/Coupler
N9320A Spectrum Analyzer
Test Port
61
3
Functions and Measurements
For greatest accuracy, use a coupler or bridge with the correct test
port connector. Any additional adapters or components placed
between the test port and DUT degrades coupler/bridge directivity
and system source match.
For best results, use the same adapter for the calibration and the
measurement. Be sure to terminate the second port of a two port
device.
NOTE
2
Connect the tracking generator output of the analyzer to the
directional bridge or coupler.
3
Connect the analyzer RF input to the coupled port of the
directional bridge or coupler.
4
Press
5
Turn on the tracking generator and, if necessary, set the
output power to - 10 dBm:
Press
MODE
> Preset. (With Preset Type of Factory)
> Tracking Generator > Amplitude TG (On) > -10 > dBm
Excessive signal input may damage the DUT. Do not exceed the
maximum power that the device under test can tolerate.
CAUTION
6
Set the start and stop frequencies and resolution bandwidth:
Press
Press
Press
7
62
Preset/
System
Frequency
Frequency
BW/
Avg
> Start Freq > 100 > MHz
> Stop Freq > 1 > GHz
> Res Bw > 3 > MHz
Replace the DUT with a short circuit.
N9320A Spectrum Analyzer
Functions and Measurements
8
3
Normalize the trace:
Press MODE > Tracking Generator > More > Normalize > Store Ref (1
3) > Normalize (On)
→
This activates the trace 1 minus trace 3 function and
displays the results in trace 1 (Figure 23). The normalized
trace or flat line represents 0 dB return loss. Normalization
occurs each sweep. Replace the short circuit with the DUT.
NOTE
The reference trace is stored in trace 3, changing trace 3 to Clear
Write will invalidate the normalization.
Figure 23
N9320A Spectrum Analyzer
Short Circuit Normalized
63
3
Functions and Measurements
Measuring Return Loss Using the Reflection Calibration Routine
This procedure uses the reflection calibration routine in the
proceeding procedure “Making a Reflection Calibration
Measurement” on page 62 to calculate the return loss of the
370 MHz low pass filter.
1
After calibrating the system with the above procedure,
reconnect the filter (DUT) in place of the short circuit used
for calibration. Do not change any of the analyzer settings or
the measurement setup may be invalidated.
2
Use the marker to read return loss. Position the marker with
the front- panel knob to read the return loss at that
frequency.
Rotate the knob to find the highest peak and the readout is
the maximum return loss. See Figure 24.
Figure 24
64
Measuring the Return Loss of the Filter
N9320A Spectrum Analyzer
Functions and Measurements
3
Viewing Catalogs and Saving Files
The analyzer will store and retrieve data files similar to
using a PC. The analyzer allows you to view and save files in
the internal storage of the analyzer or to a USB storage
device. This section provides information on how to locate
catalogs (file types) and to save files.
Locating and Viewing Files in the Catalog
The analyzer has four types of files:
State
stores analyzer settings (file extension: .STA).
Trace
stores trace information (file extension: .TRA).
Screen
Limits
NOTE
stores screen captures of the display (file extension: .JPG).
which stores data sets to determine whether a trace has
exceeded preset specifications (file extension: .LIM).
Trace files are not bitmap files. They cannot be imported into other
applications or converted. If you require the use of other applications,
be sure to save as .JPG formats using Screen for your file type.
Press
N9320A Spectrum Analyzer
File/
Print
> Catalog to bring up a screen display below.
65
3
Functions and Measurements
1
The entry fields show the parameters for the files viewed:
Name states the filename.
Type displays the type of files viewed.
Path
2
displays the location of the files (Local or USB).
There are four column headings in this area of the display:
Name displays the filename.
Type displays the filename extension (TRA, STA, TRC or JPG).
Size displays the size of the file in bytes.
Modified
3
displays the date and time the change occurred.
The softkey menu has four options:
Type selects the type of file you wish to view.
Sort
sorts and views the files according to a file attribute.
Local accesses the internal storage to view files.
USB
4
accesses the external USB storage device to view files.
The drive space line shows the number of bytes used on the
drive and the number of bytes still free on the drive.
Saving a File
The analyzer can save files (states, traces, limits or screens)
to a USB storage device (USB/), or internal storage (Local/).
The following is an example of how to save a trace to
internal storage (Local/).
1
Select the save destination for the file. This example will
select the internal storage (Local/):
Press
File/
Print
> Catalog > Local
2
Press Return > Save, to access the Save menu.
3
Select the type of file. In this example we will save a trace.
The filename extension for the trace file type is .TRA:
Press Type > Trace
66
N9320A Spectrum Analyzer
Functions and Measurements
4
3
Select the trace to save (1, 2, 3, 4 or all traces). For this
example, we will select trace 3:
Press Source > Trace 3
5
Enter a filename by pressing Name. Assume you name the
file “TEST1”. The alpha portion of the filename is selected
using the softkey menus. The numeric keypad is used for the
numeric portion of the filename. Press Enter to accept the
filename and to terminate this process and return to the
Save menu.
The filename can be composed of alpha (A- Z) or numeric
(0- 9) characters in any combination. The analyzer will not
overwrite an existing file. If the filename already exists, the
status bar will display the message: “File already exists”. If a
filename is not edited, the analyzer will automatically
generate a name based on the type of file you are saving
(State: STATE, Trace: TRACE, Limits: LIMIT, Screen: SCREN). It
also generates a three digit integer, starting at 000 and
extending through 999, which it adds to the name, for
example: TRACE056.TRC. The analyzer will remember the
previously saved value even through a power cycle.
6
Press Save Now to save the file
“Saving Now” is displayed during this operation. In this
example, the status bar displays “Local/TEST1.TRC file saved”.
CAUTION
N9320A Spectrum Analyzer
When saving a file to a USB storage device, do not disconnect the
USB device during the save operation. To do so may cause unexpected
data loss.
67
3
Functions and Measurements
Loading a File
This feature will recall (load) onto the displayed screen a
previously saved filename and type compatible with this
analyzer. The file types are described above.
1
Select the directory where your file is located. In this
example, select the internal storage (Local/):
Press
File/
Print
> Catalog > Local
2
Press Return > Load to access the Load menu
3
Select the type of file. Assume you need to load a trace file:
Press Type > Trace
4
Using the knob or arrow keys to highlight the file you need.
And then select the trace into which you wish to load the
file. Assume you need to load file TEST1.TRC into Trace 2:
Press Destination > Trace 2.
5
68
Press Load Now to load the specified file. The status bar
displays: “Local/TEST1.TRC file loaded”.
Screen files are in .jpg format and cannot be loaded or
recalled into the analyzer display, they can only be
downloaded and used in PC applications.
N9320A Spectrum Analyzer
Functions and Measurements
3
Copying a File
To copy a file from internal storage to a USB storage device,
follow this procedure:
1
Press
2
Connect a USB storage device to the USB connector (DEV).
3
Select the type of file. Assume you need to copy a trace file:
File/
Print
> Catalog > Local to select the path
Press Return > Copy > Type > Trace
4
Using the knob or arrow keys to highlight the file name you
need. In this example, highlight the file TEST1.TRC.
5
Press Copy Now to execute the operation. A “Copying file”
indicator displays. Then “/USB/TEST1.TRC file copied” appears
on the status bar. You have now copied the file TEST1.TRC
from the internal storage to the USB storage device.
Deleting a File
Perform the following process to delete a specific file. Note
that once a file is deleted from local memory, it cannot be
recovered.
N9320A Spectrum Analyzer
1
Press
2
Press Return > Delete to access the Delete menu
3
Select the type of file. Assume you need to delete a trace file
press Type > Trace
4
Using the knob or arrow keys to highlight the file name you
want to load. In this example, selecting the file TEST1.TRC.
5
Press Delete Now. “Deleting file” indicates the operation is in
process. Then, “Local/TEST1.TRC file deleted” shown on the
status bar indicates the file has been deleted.
File/
Print
> Catalog > Local to select the path
69
3
70
Functions and Measurements
N9320A Spectrum Analyzer
Agilent N9320A Spectrum Analyzer
User’s Guide
4
Key Reference
Amplitude
72
Auto Tune
75
Back <-
76
BW/Avg
77
Det/Display
Enter
81
87
File/Print
88
Frequency
Marker
95
97
Marker->
Meas
MODE
101
102
103
Peak Search
107
Preset/System
SPAN
111
117
Sweep/Trig
118
View/Trace
120
This chapter describes each front panel hardkey and their
associated softkeys (menus). The front panel key descriptions
are organized alphabetically. The lower level softkeys are
listed as they appear in the softkey menus.
s
71
4
Key Reference
Amplitude
Press Amplitude hardkey to activate the reference level function
and access the amplitude softkey menu.
The softkey menu selections are described as follows:
Ref Level
Softkey sets the reference level. This function is activated
when Amplitude is pressed. The reference level is the amplitude
power or voltage represented by the top line of the graticule
on the display. Setting the reference level changes the
absolute amplitude level (in the selected amplitude units) of
the top graticule line.
Key access:
Attenuation
Auto Man
Softkey toggles the input attenuation between Auto and Man.
The attenuation level can be set in as little as 1 dB
increments when Man is selected. The analyzer input
attenuator is normally coupled to the reference level control,
it reduces the power level of the input signal at the input
mixer. Selecting Auto re- couples the attenuator. Change the
attenuation by using the arrow keys, the knob, or the
numeric keypad.
Key access:
Scale/Div
Amplitude
Softkey scales the vertical graticule divisions in logarithmic
units when Log is selected. The valid logarithmic units are 1,
2, 5 and 10 dB per division. When Lin is underlined, the
vertical divisions are linearly scaled with default amplitude
units of volts. The top of the graticule represents the
reference- level value; the bottom of the graticule represents
zero volts. (Each division is one- tenth of the reference level.)
Key access:
72
Amplitude
Softkey sets the logarithmic units per vertical graticule
division on the display. The Scale/Div function is available
only when the Scale Type key is set to Log.
Key access:
Scale Type
Log Lin
Amplitude
Amplitude
N9320A Spectrum Analyzer
Key Reference
Int Preamp
On Off
(Option PA3) Softkey toggles the internal pre- amplifier
function between on and off. Pressing Int Preamp (On) results
in a correction being applied to compensate for the gain of
the preamp. Amplitude readings then represent the signal
value at the input connector. When the preamp is on, a “PA”
indication appears on the left side of the display. The
preamp operates over a range of 100 kHz to 3 GHz.
Key access:
Y Axis
Amplitude
> More 1 of 2 >
Softkey adds an offset value to the displayed reference level.
Reference- level offsets are only entered by using the numeric
keypad. Entering an offset does not affect the trace or the
attenuation value. Reference- level offsets are used when gain
or loss occurs between a device under test and the analyzer
input. Thus, the signal level measured by the analyzer may
be referred to as the level at the input of an external
amplitude- conversion device. When an amplitude offset is
entered, its value appears on the left side of the display
under Offst (as opposed to frequency offsets which appear
at the bottom of the display). To eliminate an offset, press
Ref Lvl Offst > 0 > dB.
Key access:
N9320A Spectrum Analyzer
Amplitude
Softkey accesses the softkeys that change the amplitude
units (logarithmic or linear). Change the amplitude units by
pressing dBm, dBmV, dBuV, dBuA, Watts, Volts, and Amps.
Key access:
Ref Lvl Offset
4
Amplitude
> More 1 of 2 >
73
4
Key Reference
Ext Amp Gain
Softkey adds a positive or negative preamplifier gain value,
which is subtracted from the displayed signal. (Use negative
values for gain and positive values for loss.) The function is
similar to the Ref Lvl Offset function, however with the Ext Amp
Gain function, the attenuation may be changed depending on
the preamplifier gain entered. A preamplifier gain offset is
used for measurements that require an external preamplifier
or long cables. The offset is subtracted from the amplitude
readout so that the displayed signal level represents the
signal level at the input of the preamplifier. The preamplifier
gain offset is displayed at the top of the screen and is
removed by entering zero. The preamplifier gain offset can
only be entered using the numeric keypad. The preamplifier
gain value is not affected by an instrument preset or a
power cycle.
Key access:
74
Amplitude
> More 1 of 2 >
N9320A Spectrum Analyzer
Key Reference
4
Auto Tune
Hardkey activates the autotune function to view the signal,
This hardkey performs the following functions automatically:
NOTE
1
Run Peak Search in full span
2
Run Mkr -> CF
3
Select the appropriate reference level according to the
amplitude of searching signal.
4
Set span to 1 MHz and all auto couple to view the signal.
The Auto Tune functions in the frequency range of 5 MHz to 3 GHz.
The minimum detectable amplitude is –65 dBm.
For more information about Peak Search, Mkr ->CF and
Mkr ->Ref Lvl softkeys, refer to “Peak Search” on page 109,
and “Marker- >” on page 103.
N9320A Spectrum Analyzer
75
4
Key Reference
Back <The backspace hardkey is located in the numeric keypad
area of the front panel and is used to change or correct an
active function entry, or to change a text entry before you
save data to a file.
76
N9320A Spectrum Analyzer
Key Reference
4
BW/Avg
Hardkey activates the resolution bandwidth function and
accesses the softkey menus that control the bandwidth and
averaging functions.
Res BW
Auto Man
Softkey controls the 3 dB resolution bandwidth of the
analyzer from 10 Hz to 3 MHz using the knob or arrow keys.
There are four available bandwidths less than 1 KHz are 10,
30, 100 Hz or 300 Hz. If an invalid bandwidth is entered
using the numeric keypad, the analyzer chooses the closest
acceptable bandwidth. As the resolution bandwidth is
decreased, the sweep time is modified in order to maintain
amplitude accuracy. Resolution bandwidth is also
coordinated with the frequency span. As the span is
decreased, the resolution bandwidth decreases. When the
VBW/RBW is set to AUTO, if the resolution bandwidth
changes, the video bandwidth changes to maintain the
VBW/RBW ratio.
A “#” mark appears next to “Res BW” on the display when it
is not coupled. To recouple the resolution bandwidth, press
Res BW (Auto).
Key access: BW/
Avg
Video BW
Auto Man
Softkey changes the analyzer post- detection filter from 1 Hz
to 3 MHz using the knob or arrow keys. If an invalid
bandwidth is entered, the analyzer chooses the closest
available bandwidth. As the video bandwidth decreases, the
sweep time will increase to maintain amplitude accuracy.
A “#” mark appears next to “VBW” on the bottom of the
analyzer display when it is not coupled. To couple the video
bandwidth, press Video BW (Auto).
Key access:
N9320A Spectrum Analyzer
BW/
Avg
77
4
Key Reference
VBW/RBW
Auto Man
Sets the ratio between the video and resolution bandwidths.
When a signal is weak and is visually masked by the noise
floor, set the ratio to less than 1 to lower the noise. When
the Preset Type is set to Factory and Preset is pressed, the
ratio is set to 1. Change the ratio by using the arrow keys,
knob, or numeric keypad. When VBW/RBW (Auto) is selected,
the ratio is determined automatically by the rules in
Figure 25.
Figure 25
VBW/RBW Ratio Auto Rules
Yes
Is Detector peak
or Negative peak?
Is Trace
Average On?
Yes
Ratio=10
No
No
Ratio=1
No
Is Detector
Sample?
Is Avg Type
Power?
Yes
Ratio=10
No
Yes
Ratio=1
Is Avg Type
Power?
No
Ratio=1
Yes
Is Trace
Average On?
Yes
Ratio=10
No
Ratio=1
Key access:
78
BW/
Avg
N9320A Spectrum Analyzer
Key Reference
Average
On Off
4
Initiates a digital averaging routine that averages the trace
points in a number of successive sweeps resulting in trace
“smoothing”. The number of sweeps (average number) is
changeable when setting Average (Off). Increasing the average
number will further smooth the trace. pressing BW/
> Avg
Avg
Type to select the type of averaging.
To restart averaging:
• Enter a new average number
• Change any related parameter (e.g., Center Frequency)
When in sweep single, the specified number of averages is
taken, then the sweep stops and an average trace displayed.
When in continuous sweep mode, the specified number of
averages is taken, then the averaging continues with each
1
- and the
new sweep averaged in with a weight of ----------------------------AverageNumber
old average reduced by multiplying it by
1
AverageNumber – ------------------------------ .
AverageNumber
To turn averaging off, press Average (Off).
Key access:
Avg Type
Auto Man
BW/
Avg
Toggles the average type between automatic and manual.
Selecting Auto sets the analyzer to automatic averaging by the
rules in Figure 26.
Figure 26
Auto Rules for Average Type
Is Detector
Average?
Yes
Type=Power
No
Type=Video
Selecting Man sets the analyzer to manual averaging.
N9320A Spectrum Analyzer
79
4
Key Reference
When trace average is on, the average type is shown on the
left side of the display. Selecting an average type manually
causes the analyzer to use that type without regard to other
analyzer settings and sets Avg Type to Man.
Key access:
Video Avg
BW/
Avg
Video averaging averages the data as appropriate
for the y- axis scale. When Avg Type > Video Avg is
selected, “VAvg” appears on the left side of the
analyzer display if Average is On.
Key access:
Pwr Avg
80
BW/
Avg
> Avg Type
Power averaging is performed by converting the
trace data from logarithmic to linear power units,
and then averaging the power trace data. When
Avg Type > Pwr Avg is selected, “PAvg” appears on
the left side of the screen if Average is On.
Key access: BW/
> Avg Type
Avg
N9320A Spectrum Analyzer
Key Reference
4
Det/Display
Press this hardkey to control detector and display functions.
Detector
(detector type)
Auto Man
Softkey presents a submenu to select a specific detector
type, or allows the analyzer to select the appropriate
detector (select Auto) for a particular measurement.
Regarding detectors, it is important to understand what is a
trace “bucket”. For every trace point displayed, there is a
finite time during which the data for that point is collected.
The analyzer looks at all of the data collected during that
time and present a single point of trace data based on the
detector mode. The interval during which the data for that
trace point is being collected, is called the “bucket”.
Figure 27
Detector (auto) Selection Flowchart Rules
Phase
Noise On?
Yes
Sample
Yes
Yes
Average
Sample
Yes
Any Trace in
MinHold?
Yes
Sample
No
Peak
No
Any Trace in
Min Hold?
Avg Type
Power?
No
No
Any Trace in
Max Hold?
Average
No
No
Trace
Average On?
Yes
Res BW
>300Hz?
Yes
Negative Peak
No
Peak
Thus a trace is more than a series of single points. It is
actually a series of trace “buckets”. The data may be sampled
many times within each bucket.
N9320A Spectrum Analyzer
81
4
Key Reference
When the detector is set to Auto, Pressing BW/
> Average (On)
Avg
changes the detector. The Auto choice will depend on marker
functions, trace functions, and the trace averaging function.
If a marker function or measurement is running, the Auto
choice of detector is either Average or Sample. When one of
the detectors (such as Average) is manually selected instead
of Auto, that detector is used without regard to other
analyzer settings.
• Average displays the power average in the bucket.
• Sample
displays the instantaneous level of the signal at
the center of the bucket represented by each
display point.
• Positive Peak displays the max. of the signal in the bucket.
• Negative Peak displays the min. of the signal in the bucket.
The detector in use is indicated on the left side of the
display. A “#” will appear next to it if the detector has been
manually selected.
Key access:
82
Det/
Display
Auto
Selects peak detection as the default. If a
different detection scheme would be better
utilized for a particular measurement, the
analyzer will use the alternate detection method.
Key access: Det/
Display > Detector Auto Man
Positive
Peak
Obtains the maximum video signal between the
last display point and the present display point
and stores this value in memory. It’s used
primarily when measuring sinusoidal
components. When Positive Peak is selected,
“Peak” appears in the upper- left corner.
Key access: Det/
Display > Detector Auto Man
Negative
Peak
Is a peak detector, but selects the minimum
video signal value. This detection should not be
used to measure the accurate amplitude. “NPk”
also appears in the upper- left corner, When
Negative Peak is selected.
Key access: Det/
Display > Detector Auto Man
N9320A Spectrum Analyzer
Key Reference
Active Fctn
Position
Average
Video RMS
measures the average value of the amplitude
across each trace interval (bucket). When
Average is selected, “Avg” appears on the left
corner.
Key access: Det/
Display > Detector Auto Man
Sample
Sample detection is used primarily to display
noise or noise- like signals. It should not be
used to measure the accurate amplitude of non
noise- like signals. In sample mode, the
instantaneous signal value of the present
display point is placed in memory. When Sample
detection is selected, “Samp” appears in the
upper- left corner of the display.
Key access: Det/
Display > Detector Auto Man
Normal
Selects the maximum and minimum video signal
values alternately. When selecting Normal
detection, “Norm” appears in the upper- left
corner.
Key access: Det/
Display > Detector Auto Man
Selects the screen position for the Active Function Display.
Depending on the type of trace data being viewed, you can
move the Active Function Display position to minimize its
visual interference with your screen data.
Key access:
Top
N9320A Spectrum Analyzer
4
Det/
Display
Displays the active function in the top- left corner of the display.
Key access: Det/
Display > Active Fctn Position
Center
Displays the active function in the center- left
side of the display.
Key access: Det/
Display > Active Fctn Position
Bottom
Displays the active function in the bottom- left
corner of the display
Key access: Det/
Display > Active Fctn Position
83
4
Key Reference
Display Line
On Off
Activates an adjustable horizontal line that is used as a
visual reference line. The line, which can be used for trace
arithmetic, has amplitude values that correspond to its
vertical position when compared to the reference level. The
value of the display line appears in the active function block
and on the left side of the display. Use the arrow keys,
knob, or numeric keypad to adjust the display line. Pressing
any digit, 0 through 9, on the numeric keypad brings up the
selected terminator submenu.
Key access:
Limits
Det/
Display
Accesses softkeys that allow you to control and define the
parameters of limit lines.
Key access:
Det/
Display
Limit 1 selects either of the available limits. The Limit 1 and
Limit 2 Limit 2 keys access softkeys to set parameters for the
selected limit.
Key access: Det/
Display > Limits
Type
defines the limit to be edited as an upper
Upper lower or lower limit. An upper limit will
indicate a fail if trace 1 exceeds this limit.
A lower limit will indicate a fail if trace 1
falls below the limit.
Key access: Det/
Display > Limits > Limit 1/2
Limit
On Off
84
Toggles the limit line function to on or
off. The limit points must exist before the
limit function can be turned on. Either
Limit or Margin, as well as Test, must be
turned on for a limit test. Limit points
must be defined before the Limit function
can be turned on.
Key access: Det/
Display > Limits > Limit 1/2
N9320A Spectrum Analyzer
Key Reference
4
Test
On Off
Toggles the testing of the limit lines
between on and off. If trace 1 is at or
within the bounds of the set limit or
margin, “Limit_# Pass” or “Margin_# Pass” is
displayed in the upper left corner of the
measurement area limit line. Only
positive/negative margins are allowed for
lower/upper limits. If the trace is out of
the limit or margin boundaries, “Limit_#
Failed” or “Margin_# Failed” is displayed.
Either Limit or Margin must be turned on
for test.
Key access: Det/
Display > Limits > Limit 1/2
Margin
On Off
Toggles the margin function to on or off.
Use Margin to set a limit line offset for
the selected limit line. Either Limit or
Margin as well as Test, must be turned on
for a limit test to work.
Key access: Det/
Display > Limits > Limit 1/2
Edit
Accesses the submenu to edit the limit
point, and also accesses the limits table.
Use arrow keys to move between the rows
in the limits table. New limit segments
will only be applied after close the editor.
Pressing Return, or any key not associated
with the editor, will close the editor.
Key access: Det/
Display > Limits > Limit 1/2
Point
Creates or edit a limit point. Up to 20
points can be defined for each limit line.
Enter the point number using the numeric
keypad, then Press [Enter], or use the
knob or arrow keys to move to an existing
point.
Key access: Det/
Display > Limits > Limit 1/2 > Edit
N9320A Spectrum Analyzer
85
4
Key Reference
Frequency
Edits the frequency value for a limit point.
After editing, the limit table will place the
frequency or time in correct order. For a
new point, the Amplitude default is 0 dBm,
and Connected default is Yes.
Key access: Det/
Display > Limits > Limit 1/2 > Edit
Amplitude
Sets the amplitude value for the current
point.
Key access: Det/
Display > Limits > Limit 1/2 > Edit
Connected To Previous Pt
Yes No
Defines if the current point being edited is
to be connected to the previous point.
Pressing this key toggles the Connected value
between Yes and No.
Key access: Det/
Display > Limits > Limit 1/2 > Edit
Delete Point
Deletes the current point in the limit line.
Pressing this key will delete the point
immediately.
Key access: Det/
Display > Limits > Limit 1/2 > Edit
Delete Limit
Delete
All Limits
86
Deletes the current limit set. Pressing this
key will delete the limit line entirely.
Key access: Det/
Display > Limits > Limit 1/2
Purges data from the limit- line tables. Pressing this key
will delete all the limit line data immediately.
Key access: Det/
Display > Limits
N9320A Spectrum Analyzer
Key Reference
4
Enter
Terminates a front- panel keypad numeric entry and enters
that value into the analyzer. (For most applications, it is
better to use the units softkeys to terminate value entry.)
When in File menu, the [Enter] key is used to terminate
filename entries.
N9320A Spectrum Analyzer
87
4
Key Reference
File/Print
Hardkey accesses the softkeys menus to manage the file
system of the analyzer. Refer to “Viewing Catalogs and
Saving Files” on page 66, for more information.
Catalog
Displays all files located on the selected catalog, depending
upon the preferences set under the Type and Sort keys
defined below.
Key access: File/
Print
Type
Sort
88
selects all types or one type of file(s) for viewing.
Default: State
Key access: File/
> Catalog
Print
All
Displays all files and file types on the
selected drive.
Key access: File/
> Catalog > Type
Print
Screen
Displays only the screen (.JPG) files on
the selected drive.
Key access: File/
> Catalog > Type
Print
State
Displays only the state files (.STA) on the
selected drive. State files contain most
instrument settings.
Key access: File/
> Catalog > Type
Print
Trace
Displays only trace files (.TRA) on the
selected drive.
Key access: File/
> Catalog > Type
Print
Limits
Displays only the limits files (.LIM) on the
selected drive.
Key access: File/
> Catalog > Type
Print
Sorts the files according to a selected file attribute,
including By Date, By Name, and Order Up Down. Order
(Up) sorts files in ascending order (such as A, B, C).
Order (Down) allows you to sort files in descending
order (such as C, B, A).
Key access: File/
> Catalog
Print
N9320A Spectrum Analyzer
Key Reference
Save
N9320A Spectrum Analyzer
Local
Accesses the internal storage of the analyzer.
Key access: File/
> Catalog
Print
USB
Accesses the external USB storage device.
Key access: File/
> Catalog
Print
4
Accesses menu keys that allow the user to save the analyzer
screen, state, trace, and limit data to a USB storage device
or to the internal storage.
Key access: File/
Print
Save
Now
Executes the save function. When completed, the
message “local(USB)/XXX file saved” (where XXX is
the filename) will appear in the status bar.
Key access: File/
> Save
Print
Type
Selects the type of data for the file save.
Key access: File/
> Save
Print
Screen
Displays all previously saved screen
files (.JPG) and captures the current
screen displayed in preparation to save
it in a file (.JPG).
Key access: File/
> Save > Type
Print
State
Displays all saved state (.STA) files and
detects the current state parameters in
preparation to save into a file (.STA).
State files include all settings but not
traces or limits.
Key access: File/
> Save > Type
Print
Trace
Displays all previously saved trace files
(.TRA) and detects the current trace in
preparation to save it in a file (.TRA).
Save individual traces or a group of
traces.
Key access: File/
> Save > Type
Print
89
4
Key Reference
Limits
Source
Displays all previously saved limits files
(.LIM) and detects the current limits in
preparation to save them in a file
(.LIM). Limits provide data sets to
determine whether a trace has exceeded
preset specifications.
Key access: File/
> Save > Type
Print
When Type is Trace, you can select trace 1, 2, 3 or
4 in addition to the state. All Traces is selected to
save all four traces in a single file, along with the
state.
When Type is Limits, Source accesses the Limit 1 and
2 softkeys. Limit 1 and 2 provide data sets to
determine whether a measurement trace has
exceeded preset specifications.
Key access: File/
> Save
Print
Name
NOTE
Load
Accesses the softkeys to enter the filename.
Key access: File/
> Save
Print
Only capital letters (A-Z) and digits (0-9) may appear in file names. The
analyzer will automatically add the three character file extension
name.
Accesses a submenu to load analyzer states, traces and
limits into the analyzer from a USB storage device or
internal storage (Local).
Key access:
90
File/
Print
Load
Now
Executes the load file function. When load
completed, the message “local(USB)/XXX file loaded”
appears in the status bar (where XXX is the
filename).
Key access: File/
> Load
Print
Type
To select the type of file to be loaded.
Key access: File/
> Load
Print
N9320A Spectrum Analyzer
Key Reference
State
Trace
Limits
Sort
Destination
N9320A Spectrum Analyzer
4
Displays all state file types listed in
the storage location (.STA). Loading a
state filetype restores most parameters
to the instrument settings.
Key access: File/
> Load > Type
Print
Displays all trace file types (.TRA).
Load traces individually or as a group.
Loading a trace also loads the current
state, and sets the trace to view mode.
Key access: File/
> Load > Type
Print
Displays all limits file types. The limits
data points in these files may help
determine whether a trace has
exceeded preset specifications (.LIM).
Limits are loaded individually only.
Key access: File/
> Load > Type
Print
Accesses a submenu to view your saved files
according to a selected file attribute. The
selections include, By Date, By Name, and Order Up
Down. Order (Up) sorts files in ascending order
(such as A,B,C). Order (Down) sorts files in
descending order (such as C,B,A).
Key access: File/
> Load
Print
With Type set to Trace, Destination directs the
data to Trace 1, 2, 3 or 4. If the data is for all
four traces (for instance, Source was All Traces
when they were saved), the data returns to the
original trace registers.
When Type is set to Limits, Destination allows you
to direct your data to Limit 1 or Limit 2.
Key access: File/
> Load
Print
91
4
Key Reference
Delete
Enter the submenu for deletion.
Key access: File/
Print
Delete
Now
Executes the delete file function. After a
successful delete, the message “local(USB)/XXX file
deleted” appears in the status bar on the display
(where XXX is the filename).
Key access: File/
> Delete
Print
Type
Selects the filetype to delete.
Key access: File/
> Delete
Print
Sort
92
All
Displays all files for deletion.
Key access: File/
> Delete > Type
Print
Screen
Displays only screen files for deletion.
Key access: File/
> Delete > Type
Print
State
Displays only state files for deletion.
Key access: File/
> Delete > Type
Print
Trace
Displays only trace files for deletion.
Key access: File/
> Delete > Type
Print
Limits
Displays only limits files for deletion.
Key access: File/
> Delete > Type
Print
Sorts the files according to a file attribute for
deletion: By Date, By Name and Order Up Down.
Order (Up) displays files in ascending order. Order
(Down) displays files in descending order.
Key access: File/
> Delete
Print
N9320A Spectrum Analyzer
Key Reference
Copy
Enters the submenu to copy files from local to a USB
storage device.
Key access: File/
Print
Copy
Now
Executes the copy function. If the copy is
successful, “local/XXX file copied to USB” will appear
in the status bar (where XXX is the filename).
Key access: File/
> Copy
Print
Type
Select the type of file to copy.
Key access:
All
File/
Print
> Copy
Displays all file types.
Key access:
Screen
State
> Copy > Type
File/
Print
> Copy > Type
File/
Print
> Copy > Type
Displays all limits files.
Key access:
Sort
File/
Print
Displays all trace files.
Key access:
Limits
> Copy > Type
Displays all state files.
Key access:
Trace
File/
Print
Displays all screen files.
Key access:
File/
Print
> Copy > Type
Sorts the files according to a file attribute to be
copied, including By Date, By Name and Order Up
Down. Order (Up) displays files in ascending order.
Order (Down) displays files in descending order.
Key access:
N9320A Spectrum Analyzer
4
File/
Print
> Copy
93
4
Key Reference
Frequency
Press Frequency to activate the center frequency function, and
access the menu softkeys for frequency functions. The center
frequency, or start and stop frequency values appear below
the graticule on the display.
94
NOTE
When changing both the center frequency and span, change the
frequency first. The frequency value may limit the span.
Center Freq
Softkey activates the center frequency function and sets the
horizontal center of the display to a specific frequency.
Key access: Frequency
Start Freq
Softkey sets the frequency starting at the left side of the
graticule. The left and right sides of the graticule correspond
to the start and stop frequencies.
Key access: Frequency
Stop Freq
Softkey sets the frequency at the right side of the graticule.
The left and right sides of the graticule correspond to the
start and stop frequencies.
Key access: Frequency
CF Step
Auto Man
Softkey changes the step size for the center frequency
function. On selecting a step size and activating the center
frequency function, the arrow keys change center the
frequency by the step- size value. The step size function is
useful for finding harmonics and sidebands beyond the
current frequency span of the analyzer. Selecting auto- couple
sets the center frequency step size to one division (10
percent of the span).
Key access: Frequency
N9320A Spectrum Analyzer
Key Reference
Signal Track
On Off
4
Softkey moves the signal nearest the active marker to the
center of the display and maintains the signal at the center
of the display. “ST” will appear in the lower- left corner of
the display.
Pressing Signal Track (Off); Preset/
System > Preset (Preset Type set to
Factory); or Marker > All Off will turn off the signal track
function.
Toggling signal track to on and reducing the span initiates
an automatic zoom and will reduce the span in steps, so
that the signal remains at the center of the display. Signal
track cannot be activated, if the span is set to zero.
Key access:
NOTE
N9320A Spectrum Analyzer
Frequency
If no marker is active, pressing Signal Track (On) activates a marker,
perform a peak search, and center the marker on the display.
Switching to zero span turns Signal Track (Off).
95
4
Key Reference
Marker
Hardkey accesses the marker control softkey menus to select
the type and number of markers. Markers are shown on the
display as diamond- shaped characters that identify points of
traces. Up to twelve pairs of markers (when using Delta Pair
markers) may appear on the display simultaneously; only
one pair can be controlled at a time.
Select Marker
Normal
Selects one of the twelve possible markers. If a marker has
already been selected it will become the active marker.
Key access: Marker
Activates a single frequency marker at the center of the
active trace if not already displayed.
Displaying a marker before enabling the Normal function
enables the marker at the position of the selected marker.
The marker number shows above the marker. The knob
and/or arrow keys move the marker left or right. Entering a
value from the numeric keypad moves the marker to the
trace point nearest to that value. Annotation in the active
function block and in the upper- right corner indicates the
frequency and amplitude of the marker (time and amplitude,
if in zero span.) Pressing Normal turns off the Delta function
and moves the active marker to the delta marker position.
Key access: Marker
Delta
Accesses the submenu to use the marker delta function.
Key access: Marker
Delta
On Off
96
Delta (On) activates a second marker at the
position of the first marker. If no marker is
present, two markers with the same
identification number will appear at the center
of the display. The marker number is indicated
above the delta marker, and the same number is
indicated with an R (for example, 1R) above the
reference marker. The amplitude and frequency
(or time) of the first marker is fixed.
N9320A Spectrum Analyzer
Key Reference
4
Use the data control keys to position the delta
marker. Annotation in the active function block
and in the upper- right corner indicates the
differences between the two markers,
frequency/time and amplitude. Delta (Off) moves the
reference marker to the active marker position,
allowing you to make delta measurement from
differing reference points without having to turn
off the markers and begin again.
Key access: Marker > Delta
Toggles the Delta Pair between the reference (start)
and delta (stop) markers. The start marker number
is indicated with a number and an R (reference)
above the marker (for example, 1R). The delta
marker is identified with the marker number only.
Key access: Marker > Delta
Span Pair
Span Center
Toggles the Span Pair function between the span
and center markers. The start marker number is
indicated with a number and an R above the
marker (such as 1R) and the stop marker is
indicated with only the marker number. Adjusting
the span changes the frequency difference between
the two markers while maintaining the midpoint at
a fixed frequency. Selecting Center changes the
center point between the two markers while
maintaining the frequency difference.
Key access: Marker > Delta
Ref and Delta markers maintain their displayed x-axis location,
however, their frequency values will change if the frequency or span
parameters that define the x-axis scale are changed. Reset these
markers, if necessary, when parameters such as Span or Center Freq
are changed.
NOTE
Off
N9320A Spectrum Analyzer
Delta Pair
Ref Delta
Turns off the selected marker by the Select Marker key. Off
also turns off the related functions such as signal track. It
will also removes marker annotation from the display.
Key access: Marker
97
4
Key Reference
All Off
Function
Turns off all markers, including markers used for signal
track, and marker annotations.
Key access: Marker
Accesses the marker function softkeys listed below.
Key access: Marker
Freq
Counter
NOTE
Freq Counter
On Off
Toggles the frequency counter
function on and off.
Key access: Marker > Function > Freq Count
Resolution
Auto Man
Toggles the frequency counter
resolution from manual to
auto- couple. The allowed values are
0.1, 1, 10, 100 Hz and 1 kHz. Pressing
Auto auto- couples frequency counter
resolution to the span.
Key access: Marker > Function > Freq Count
The ratio of the resolution bandwidth to span must be greater than
0.02 for proper frequency counter function. The frequency counter will
work correctly only on CW signals or discrete peaks. For an accurate
reading, the marker must be >40 dB above the noise.
Phase
Noise
98
Accesses the frequency counter function.
Key access: Marker > Function
Accesses the phase noise function softkeys.
Key access: Marker > Function
Phase Noise
On Off
Toggles the phase noise function on
and off.
Key access: Marker > Function > Phase Noise
Offset
Manual
Manually sets the offset of the marker
to measure phase noise.
Key access: Marker > Function > Phase Noise
Offset
Sets the offset to +1, +10, +20, +30, +50,
+100 kHz or +1 MHz.
Key access: Marker > Function > Phase Noise
N9320A Spectrum Analyzer
Key Reference
Optimize
Phase Noise
NOTE
4
This softkey is valid only when span fall in the
range of 100 Hz and 100 kHz. After enabling
this softkey, the 1st LO Loop filter bandwidth
will be changed from approx. 5 kHz to 120- 150
kHz automatically, which optimizes the phase
noise close in to the carrier.
Key access: Marker > Function > Phase Noise
Optimize Phase noise (On) will worsen phase noise accuracy far away
from the carrier. When testing phase noise far away from the carrier,
select Optimize Phase noise (Off).
For more details on how to measure the phase noise of a
signal, refer to “Measuring Phase Noise” on page 55.
Marker Trace
Auto 1 2 3 4
Places a marker on the selected trace, if no markers have
been previously turned on. If a marker is currently active,
press Marker Trace until 1, 2, 3, or 4 is underlined: the active
marker moves to the selected trace.
Selecting Auto mode moves the marker to the automatically
selected trace. The trace selection will search for the lowest
numbered trace in the following mode order: Clear-write,
Max-hold, Min-hold and View. If there are no traces in any of
these modes, it selects trace 1.
Key access:
Marker Table
N9320A Spectrum Analyzer
Marker
> More
Compresses the graticule and displays marker information in
a table. The information includes the marker number, trace
number, marker type, X axis value, and the amplitude.
Key access: Marker > More
On
Off
Activates/deactivates the marker table.
Key access: Marker > More > Maker Table
Prev Page
Next Page
displays the previous/next page of the marker
table.
Key access: Marker > More > Maker Table
99
4
Key Reference
Marker->
Press
Mkr
accesses the following marker function softkeys:
CF
Sets the frequency of the marker to the center frequency. In
delta mode, Mkr CF sets the displayed trace center
frequency to the frequency of the marker delta value.
Mkr CF is not available in zero span.
Key access: Marker
CF Step
Changes the center- frequency step size to match the value of
the active marker. Press Frequency > CF Step to view the step
size. The step size is the frequency difference between the
markers when marker delta is active. Use this function to
step from one signal harmonic to another. Mkr CF Step is
not available in zero span.
Key access: Marker
Mkr
Start
Changes the display start frequency to the frequency of the
active marker. In delta mode, Mkr Start sets the start
frequency to the marker delta value. Mkr Start is not
available in zero span.
Key access: Marker
Mkr
Stop
Changes the stop frequency to the frequency of the active
marker. In Delta mode, Mkr Stop sets the stop frequency to
the marker delta value. Mkr Stop is not available in zero
span.
Key access: Marker
Ref Lel
Changes the reference level to the active marker value,
moving the marked point to the reference level (top line of
the graticule). In delta mode, Mkr Ref Lel sets the reference
level to the amplitude difference between the markers. (For
example, if the difference is –15 dB, the reference level –15
dBm.)
Key access: Marker
Mkr
Mkr
100
Marker
N9320A Spectrum Analyzer
Key Reference
4
Meas
In the Spectrum Analyer mode (see MODE), Meas key displays a
menu for measurements such as adjacent channel power,
occupied bandwidth, channel power, spectrum emission mask
and TOI. Refer to Chapter 5, “One- Button Measurements” for
more information about these measurements. Press Measure
Off to turn the measurement off.
N9320A Spectrum Analyzer
101
4
Key Reference
MODE
Selects the measurement mode of your analyzer.
Spectrum Analyser mode is the default mode and is for general
purpose measurement use. .
Spectrum
Analyzer
Selects the spectrum analysis measurement mode for the
analyzer.
Key access:
Tracking
Generator
102
MODE
Accesses the tracking generator functions. (Option TG3)
Key access:
MODE
Amplitude TG
On Off
Activates (On) or deactivates (Off) the
tracking generator output. The power level
can then be adjusted using the numeric
keypad, arrow keys or knob. Pressing any
digit, 0 through 9, on the numeric keypad
brings up the selected terminator menu. The
output level range is –30 dBm to 0 dBm.
Key access: MODE > Tracking Generator
Attenuation
To set the output attenuation level of the
tracking generator using the tracking
generator output attenuator. The available
level is 0 to 30 dB in 6 dB steps.The default
setting is 18 dB.
Key access: MODE > Tracking Generator
Amptd Offset
On Off
Amptd Offset (On) allows you to offset the
displayed power of the tracking generator.
Using the amplitude offset capability of the
tracking generator allows you to take system
losses or gains into account, thereby
displaying the actual power delivered to the
device under test.
Key access: MODE > Tracking Generator
N9320A Spectrum Analyzer
Key Reference
4
Amptd Step To set the step size of the power level range of the
Auto Man tracking generator. The default setting is one vertical
scale division when in a logarithmic amplitude scale.
Key access: MODE > Tracking Generator
Power
Sweep
Sweep the output offset of the tracking generator.
The analyzer continues to sweep the linear change
between start and stop frequency when power sweep
is on. The input range is 0 dB to 10 dB.
Key access: MODE > Tracking Generator>More
Normalize
Accesses the following softkeys.
Store Ref
(1->3)
Copies trace 1 into trace 3. Softkey menu
Store Ref (1->3) must be pressed before
pressing Normalize (On).
Key access: MODE > Tracking Generator >
More > Normalize
Normalize
On Off
Activates the normalize function. On
each sweep, the normalized trace (Trace
3) is subtracted from Trace 1 and the
result is added to the normalized
reference level.
The trace data is normalized with
respect to the normalized reference level,
even if the value of the normalized
reference level is changed. This function
remains in effect on all subsequent
sweeps until it is turned off.
The normalize function is most useful for
applying correction data to a trace while
making a stimulus response measurement
NOTE
N9320A Spectrum Analyzer
Trace 1 should be in clear write mode prior to setting normalize to on.
103
4
Key Reference
with a tracking generator. For example,
connect the cables and a thru line, in place
of the device to be measured, between the
tracking generator and the analyzer input.
Notice that the frequency response is not
perfectly flat, showing the response of the
cables, as well as the flatness of both the
tracking generator and the analyzer. Now
press Store Ref (1->3), Normalize (On). Notice
that the displayed trace is now flat, or
normalized. The position of the normalized
trace can now be moved to a different
position on the display by changing the
normalized reference position. This may be
useful if the device to be tested has
positive gain, such as an amplifier. Now,
replace the thru line with the device under
test, and an accurate measurement of the
gain or loss can be made.
Key access: MODE > Tracking Generator > More
> Normalize
Norm Ref Lvl Sets the level (in dB) of the normalized
reference.
Key access: MODE > Tracking Generator > More
> Normalize
Norm Ref
Posn
104
Offsets the displayed trace without affecting
the instrument gain or attenuation settings.
This allows the displayed trace to be moved
without decreasing measurement accuracy.
The normalized reference position is
indicated with a (>) character on the left
side of the display and a (<) character on
the right side of the display.
Key access: MODE > Tracking Generator > More
> Normalize
N9320A Spectrum Analyzer
Key Reference
Ref Trace
View Blank
Tracking
Peak
4
Allows you to view or blank the reference
trace on the display.
Key access: MODE > Tracking Generator > More
> Normalize
Activates a routine that automatically adjusts fine
frequency tracking to obtain the peak response of the
tracking generator on the spectrum analyzer display.
Tracking Peak is performed in the current resolution
bandwidth.
Key access: MODE > Tracking Generator > More
Man Track Allows you to manually adjust the frequency of the
adj
tracking generator oscillator using the step keys, knob,
or numeric keypad. The tracking adjust is tuned to
maximize the amplitude of the trace.
Key access: MODE > Tracking Generator > More
NOTE
N9320A Spectrum Analyzer
When in the Tracking Generator mode, resolution bandwidths < 1 kHz
are not available.
105
4
Key Reference
Peak Search
Places a marker on the highest peak based on the settings of
the “Search Criteria” on page 110. Refer to “Peak Search
Type” on page 111, for more information on the effect of
settings.
NOTE
All peak search functions ignore the LO feed through signal. The process
for determining if the Peak is the LO feed through takes into account Start
Frequency, Span, Resolution Bandwidth, Resolution Bandwidth shape
factor, and Frequency Accuracy. If there is no point of inflection within the
LO feed through range, the point on the trace with maximum amplitude,
that is higher in frequency than the LO feed through, will be selected.
Peak Search
Performs peak search as described above.
Key access:
Next Peak
Places the marker on the next highest peak. The signal peak
must exceed the peak threshold value by the peak excursion
value. If there is no peak, the marker will not move.
Key access: Peak
Search
Next Pk Right
Moves the marker to the next peak to the right of the
current marker position. The signal peak must exceed the
peak threshold value by the peak excursion value. If there is
no peak to the right, the marker will not move and the “ No
Peak Found ” error message will appear on the display.
Key access: Peak
Search
Next Pk Left
Moves the marker to the next peak to the left of the current
marker position. The signal peak must exceed the peak
threshold value by the peak excursion value. If there is no
peak to the left, the marker will not move and the “No Peak
Found” error message will appear on the display.
Key access:
106
Peak
Search
Peak
Search
N9320A Spectrum Analyzer
Key Reference
Min Search
4
Moves the active marker to the minimum detected amplitude.
Key access: Peak
Search
Pk-Pk Search
Finds and displays the frequency (or time, if in zero span),
and amplitude differences between the highest and lowest
trace points.
Key access: Peak
Search
Continuous Pk
On Off
When Continuous Pk is on, the marker will remain on the peak
signal even if the frequency of that signal changes. The
marker will remain on that signal as long as the amplitude
of the signal does not change by more than 3 dB from one
sweep to another.
If the signal is lost, the marker will attempt to find it again
and maintain on the peak. If there are other signals on
screen near the same amplitude, one of them may be found
instead. Signals near 0 Hz cannot be maintained effectively.
This function is intended to maintain the marker on signals
with a frequency that is changing, and an amplitude that is
not changing.
Key access: Peak
Search > More
N dB Points
On Off
Activates the N dB function. Pressing N dB Points (On)
activates two arrows that are N dB down from the marker.
The frequency difference between the two arrows will be
displayed in the upper right- hand corner of the display.
Key access:
Search Criteria
> More
Accesses the submenu to set the criteria for peak search.
Key access:
N9320A Spectrum Analyzer
Peak
Search
Peak
Search
> More
107
4
Key Reference
Peak Excursion
NOTE
Sets the minimum amplitude variation of
signals that the marker identifies as a peak.
If a value of 10 dB is selected, the marker
moves only to peaks that rise and fall more
than 10 dB above the peak threshold value.
When the peak excursion is 6 dB or higher,
Two signal peaks, which are so close together that the amplitude drop
between them is less than the peak-excursion value, are not
recognized as two peaks. A signal peak is recognized only if it has a
peak excursion drop above the noise floor, on both sides of the signal.
the marker- peak does not recognize signals
less than peak- excursion value above the
noise floor. To correct this, when measuring
signals near the noise floor, reduce the
excursion value. To prevent the marker from
identifying noise as signals, reduce the noise
floor variance less than the peak- excursion
value by reducing the video bandwidth or by
using video averaging.
Key access: Peak
Search > More >Search Criteria
108
Peak
Threshold
Sets the minimum amplitude that the marker
can identify as a peak. For example, if set to
–90 dBm, the marker moves only to peaks
that rise and fall more than the peak
excursion above –90 dBm. Only functional
when in Excursion and Threshold marker
mode.
Key access: Peak
Search > More > Search Criteria
Threshold
Hidden
Hides the threshold line from being displayed
on the screen.
Key access: Peak
Search > More > Search Criteria
Peak Search
Type
Selects the peak search mode.
Key access: Peak
Search > More > Search Criteria
N9320A Spectrum Analyzer
Key Reference
4
Max Value A Peak search with Max Value type
places a marker on the highest
peak, excluding the LO
feedthrough peak.
Key access: Peak
Search > More > Search
Criteria > Peak Search Type
Excursion & When Peak Search Type is Excursion &
Threshold Threshold, a peak search places a
marker on a peak that meets the
Peak Excursion and Peak Threshold
parameters. If Peak Search Type is
Excursion & Threshold and no peak
satisfies the selected parameters, a
marker is placed at the center of
the trace, and the error message,
“No Peak Found” will appear.
Key access: Peak
Search > More > Search
Criteria > Peak Search Type
Peak Table
N9320A Spectrum Analyzer
Accesses the following Peak Table softkeys to set a peak table.
Key access: Peak
Search > More
Peak Table
On Off
Displays a list of up to 12 signal peaks that is
updated at the end of each sweep. The peak
table function works with trace 1 only.
Key access: Peak
Search > More > Peak Table
Peak Sort
Freq Amptd
Switches the peak table sorting routine
between listing the peaks in order by
descending amplitude or frequency.
Key access: Peak
Search > More > Peak Table
109
4
Key Reference
Preset/System
Accesses the Preset and System softkeys. When the analyzer
is in the remote mode, pressing Preset/
System returns the analyzer
to the local controlmode and enables front- panel inputs.
Preset
Provides a known state of the instrument for making
measurements. The analyzer allows you to select whether a
user preset, or factory preset is performed.
If Preset Type is set to Factory, pressing Preset/
System > Preset performs
a factory preset, which performs the following:
• Resets the analyzer to Spectrum Analyzer (SA) mode
• Brings up the Frequency menu
• Sets certain conditions to their default values
• Clears both the input and output buffers and clears all
trace data
• Sets the amplitude values of trace 2, 3 and 4 to the
bottom of the screen
• Turn amplitude- correction factors off, but remain in
analyzer memory
• Turn limit line testing off, but the limit line tables remain
in analyzer memory
See Table Factory Preset States as follows for the conditions
established by performing a factory preset.
When Preset Type is set to User, pressing Preset/
System > Preset
displays the softkeys User Preset and Factory Preset, you then
select the specific preset as you need.
Key access:
110
Preset/
System
N9320A Spectrum Analyzer
Key Reference
4
Factory Preset State
N9320A Spectrum Analyzer
Attenuation
20 dB(Auto)
Average Type
Video (Auto)
Center frequency
1.5 GHz
Averaging
1(Off)
CF step size
300 MHz
Peak Excursion
6 dB
Start Frequency
0 Hz
Peak Threshold
-90 dBm
Stop Frequency
3 GHz
Peak Search Type
Max Value
Signal Track
Off
Peak Table
Off
Span
3 GHz
Peak Sort
Amplitude
Reference level
0 dBm
Continuous Pk
Off
Log scale/Division
10 dB
Delta Pair
Delta
Int Preamp
Off
Span Pair
Center
Trace 1
Clear Write
Trigger
Free Run
Trace 2, 3, 4
Blank
Markers
Normal(Off)
Sweep Time
100.2 ms(Auto)
Marker Delta
Off
Sweep
Continuous
Marker Table
Off
Limit
Off
Measure
Meas Off
Limit line testing
Off
File Catalog
Local
Limit point
0
File Type
State
Detector
Peak(Auto)
File Sort
By Date
Display line
-25 dBm(Off)
Phase Noise
Off
Video bandwidth
3 MHz(Auto)
Optimize phase noise
Off
VBW/RBW ratio
1.000 (Auto)
Frequency Counter
Off
Resolution
bandwidth
3 MHz(Auto)
Frequency counter
resolution
1 kHz(Auto)
111
4
Key Reference
Pwr on/Preset
Accesses the following softkeys for the preset settings.
Key access: Preset/
System
Power on
Last Preset
Determines the state of the analyzer when the
analyzer is turned on. Power On set to Preset
recalls the analyzer settings previously with the
Preset function. Power On set to Last recalls the
analyzer settings when previously power off.
Key access: Preset/
System > Pwr on/Preset
Preset Type
Selects User or Factory preset settings.
Key access: Preset/
System > Pwr on/Preset
Save User
Preset
Alignment
User
Pressing Preset recalls the analyzer
settings defined by Save User Preset.
Key access: Preset/
System > Pwr on/Preset >
Preset Type
Factory
Pressing Preset recalls the analyzer
settings originally set at the factory.
Key access: Preset/
System > Pwr on/Preset >
Preset Type
Saves the active settings of the analyzer into
the User Preset register. To recall these settings,
select Preset Type to User.
Key access: Preset/
System > Pwr on/Preset
Accesses the following softkeys that align the internal
circuitry of the analyzer, load default values for the
alignment system, and adjust the 10 MHz reference.
Key access: Preset/
System
Align
Accesses the Align softkeys.
Key access: Preset/
System > Alignment
All
(Ext Cable)
112
Initiates the alignment of systems
with a cable connected from the CAL
OUT to RF IN (Except option TG3).
Key access: Preset/
System > Alignment > Align
N9320A Spectrum Analyzer
Key Reference
CAL OUT
On Off
Language
4
Turns the internal amplitude
reference signal on or off. When this
signal is on, the RF input is disabled.
Key access: Preset/
System > Alignment > Align
Timebase
verifies the 10 MHz reference signal setting may
be adjusted for changed operating conditions,
such as temperature.
Key access: Preset/
System > Alignment
Load Default
Loads the default values for the alignment
system, turns on the frequency corrections, and
resets the timebase to the factory values.
Key access: Preset/
System > Alignment
Accesses the softkeys for selecting the screen menu language.
Key access: Preset/
System
Diagnostics
Accesses the Front Panel Test softkey to verify the functionality
of each front- panel key. The number next to each key name
increments once each time the key is pressed. Rotating the
knobs causes the number of pulses to be counted. Press
Return will go back to the main menu.
Key access: Preset/
System
Show System
Displays the number and description of the options installed
in your analyzer. It also displays the instrument model
number, product number, serial number, the date of
production, etc.
Key access: Preset/
System > More
Show
Hardware
Provides detailed information about the hardware installed
on the analyzer, including the model number and firmware
revision.
Key access: Preset/
System > More
Show
Software
Provides detailed information about the software installed on
the analyzer.
Key access: Preset/
System > More
N9320A Spectrum Analyzer
113
4
Key Reference
Show Errors
Time/Date
114
Accesses a list of the 100 most recent errors reported. The
most recent error will appear at the bottom of the list. The
first error listed will be removed if the error list is longer
than 20 entries. If the same error occurs continuously, that
error message will not be added repeatedly to the list. Refer
to “Instrument Messages” on page 139 for details.
Key access: Preset/
System > More
Prev Page/
Next Page
Access the previous/next page of error
messages.
Key access: Preset/
System > More > Show Errors
Clear Error
Queue
Clears all the errors in the errors queue.
Key access: Preset/
System > More > Show Errors
Accesses the following Time/Date menu keys used to set and
display the real- time clock:
Key access: Preset/
System > More
Time/Date
On Off
Toggles the time/date display between on and
off.
Key access: Preset/
System > More >Time/Date
Date Format
MDY DMY
Changes the display format of date from
month- day- year to day- month- year.
Key access: Preset/
System > More > Time/Date
Set Time
sets the time of the real- time clock. Enter the
time in 24 hour HHMMSS format. Valid hour
(HH) values are from 00 to 23. Valid minute
(MM) and second (SS) values are from 00 to 59.
Key access: Preset/
System > More > Time/Date
Set Date
sets the date of the real- time clock. Enter the
date in the YYYYMMDD format. Valid year
(YYYY) values are 0000 through 9999. Valid
month (MM) values are from 01 to 12, and
valid day values are from 01 to 31.
Key access: Preset/
System > More > Time/Date
N9320A Spectrum Analyzer
Key Reference
Licensing
Brightness
N9320A Spectrum Analyzer
4
Accesses the security system to enable licensing for
individual options. A user may not turn off an option using
this system. Once an option has been licensed for a given
analyzer, it cannot be transferred to a different analyzer.
Key access: Preset/
System > More > More
Option
Allows you to key in a three- character option
number. The option number will appear on the
second line of the Option key.
Key access: Preset/
System > More > More > Licensing
License Key
Allows you to key in a license key number.
The license key number appears on the second
line of the License Key softkey.
Key access: Preset/
System > More > More > Licensing
Activate
License
Activates the license for the option whose
number was previously input in License Key. If
the entry is correct, the option will be enabled
and the message: “Option activated” will appear
in the status line of your display. The option
number and license key numbers will also
clear from the License Key and Option key.
If the entry is incorrect, the error message
“License key invalid” appears in the status line of
the display. Edit the option and/or license key
number until they are correct.
Key access: Preset/
System > More > More > Licensing
Adjusts the display brightness from 1% to 100%.
Key access: Preset/
System > More > More
115
4
Key Reference
SPAN
Accesses the span function and the submenu softkeys for
span functions. Pressing Span changes the frequency range
symmetrically about the center frequency. The
frequency- span readout describes the total displayed
frequency range. To determine frequency span per horizontal
graticule division (when the frequency scale type is set to
linear), divide the frequency span by 10.
Span
Enter the span frequency range value.
Key access:
Full Span
Changes the span to full span showing the full frequency
range of the analyzer. Full span sets Signal Track, Marker
function off.
Key access:
Zero Span
Span
Changes the span to the previous span setting.
Key access:
116
Span
Changes the frequency span to zero. In this mode, the
current center frequency is displayed in the time domain
(the x- axis is displayed in units of time), like a conventional
oscilloscope. Zero span sets Signal Track (Off).
Key access:
Last Span
Span
Span
N9320A Spectrum Analyzer
Key Reference
4
Sweep/Trig
Accesses the Sweep/Trigger softkeys for selection of the
sweep mode and trigger mode of the analyzer. The softkey
menu selections are defined as follows:
Sweep Time
Auto Man
Selects the length of time the analyzer takes to tune across
the displayed frequency span (or, in zero span, the time the
analyzer takes to sweep the full screen). Reducing the sweep
time increases the sweep rate. Change the sweep time by
using the arrow keys, the knob, or the numeric keypad.
In non- zero spans, when the sweep time is auto- coupled, the
analyzer selects the optimum (shortest) sweep time for the
current settings. This selection process is influenced by
several factors:
• The max. tuning rate of the spectrum analyzer
• The selected resolution and video bandwidth filters
• The max. sample rate of the analog- to- digital converter
• The number of trace points
• The amplitude scale (logarithmic or linear)
• The detector mode
The user may select a sweep time less than the auto- coupled
value; however this may generate measurement errors. The
minimum sweep time is 50 ms.
In zero span, the minimum sweep time is determined by the
maximum sample rate of the ADC and the number of sweep
points. The minimum sweep time is 2 microseconds. The
maximum sweep time is 4000 seconds.
Key access: Sweep/
Trig
Sweep
Single
Sweep Cont
N9320A Spectrum Analyzer
Pressing Sweep Single puts the analyzer in single- sweep
mode. Press Sweep Single to initiate a sweep when in
single- sweep mode.
Key access: Sweep/
Trig
Selecting continuous sweep causes repeated sweeps to be
triggered. Pressing Preset (When Preset Type is set to Factory)
sets the sweep mode to continuous sweep.
117
4
Key Reference
Free Run
Key access: Sweep/
Trig
New sweep starts as soon as possible after the current
sweep ends.
Key access:
Video
> More
Activates the trigger condition that starts the next sweep if
the detected RF envelope voltage rises to a level set by the
video trigger level. When Video is pressed, a line appears on
the display. The analyzer triggers when the input signal
exceeds the trigger level at the left edge of the display.
Change the trigger level by using the arrow keys, the knob,
or the numeric keypad.
Key access:
Sweep/
Trig
> More
NOTE
This function is not available when the Resolution Bandwidth is less
than 1 kHz. Selecting a Resolution Bandwidth less than 1 kHz while in
Video Trigger mode, changes the Trigger mode to Free Run.
External Pos
Activates the trigger condition that will start a sweep when
the external voltage (connected to EXT TRG IN on the rear
panel) passes through approximately 2 volts. The external
trigger signal must be a 0 V to +5 V TTL signal. Sets the
trigger polarity to positive.
Key access:
External Neg
Trig Offset
On Off
> More
Sweep/
Trig
> More
Allows you to set and turn on or off an offset value from
the trigger point of the sweep at which to begin storing data
in the trace of the analyzer. The offset is specified as a
function of time, and permits positive (pre trigger) and
negative (post trigger) values to be specified.
Key Access:
NOTE
Sweep/
Trig
Sets the trigger polarity to negative.
Key access:
118
Sweep/
Trig
Sweep/
Trig
> More
This function is only available when in Zero Span. The value and state is
saved if Zero Span is exited and restored when Zero Span is reselected.
N9320A Spectrum Analyzer
Key Reference
4
View/Trace
Accesses the trace keys to store and manipulate trace
information. Each trace consists of a series of points in
which amplitude data is stored. The analyzer updates the
information for any active trace with each sweep.
Select Trace
1234
Clear Write
Selects the trace for current use.
Key access:
Erases any data previously stored in the selected trace, then
continuously displays any signals during each sweep of the
analyzer. This function is activated for trace 1 at power- on
and Factory Preset.
Key access:
Max Hold
View/
Trace
Stores the amplitude data for the selected trace, then
removes the trace from the display. The selected trace
register no longer updates as the analyzer sweeps. To
activate this function for traces 2, 3 and 4 at power- on press
Preset (when Preset Type is set to Factory).
Key access:
N9320A Spectrum Analyzer
View/
Trace
Holds and displays the amplitude data of the selected trace.
The trace register is not updated as the analyzer sweeps.
press View to retrieve a stored trace previously deactivated
by pressing Blank.
Key access:
Blank
View/
Trace
Retains the minimum level for each trace point of the
selected trace. Updates each minimum trace point if a new
minimum level is detected in following sweeps.
Key access:
View
View/
Trace
Retains the maximum level for each trace point of the
selected trace. Updates the trace point value if a new
maximum level is detected in successive sweeps.
Key access:
Min Hold
View/
Trace
View/
Trace
119
4
120
Key Reference
N9320A Spectrum Analyzer
Agilent N9320A Spectrum Analyzer
User’s Guide
5
One-Button Measurements
Channel Power
Occupied BW
ACP
122
124
127
Intermod (TOI)
130
Spectrum Emission Mask
132
This chapter provides information on the functional
descriptions of all available measurements when you press
the front- panel Meas hardkey (Spectrum Analyzer is selected).
It is assumed that the user has an understanding of the
front and rear panel, layout, and the display annotations of
the analyzer. To learn more about this, refer to “Agilent
N9320A at a Glance” on page 2.
s
121
5
One-Button Measurements
Channel Power
Channel Power measures the power and power spectral
density in the specified channel bandwidth. A white frame
on the display indicates the edge limits of the channel
bandwidth. The user must specify the center frequency,
reference level, and channel bandwidth to be used for the
measurement.
The power calculation method used to determine the channel
power is a traditional method known as the integration
bandwidth (IBW) method. A swept spectrum is used as the
basis for this calculation. Therefore, it is important to set
the resolution bandwidth correctly before making this
measurement using the following formula:
( k ( span ) )
RBW = ---------------------------n
Where k is a value between 2 and 6 and n=461 is the
number of trace points.
Figure 28
Channel Power Measurement
Active Function
Area
Measurement
Result
122
N9320A Spectrum Analyzer
One-Button Measurements
5
Avg Number
On Off
Specifies the number of measurement averages used when
calculating the measurement result with Avg Number (On). The
range is 1 to 1000. Use the knob, the arrow keys or the
numeric keypad to set the number. The average will be
displayed at the end of each sweep. Selecting Off disables
measurement averaging.
Key access: Meas > Channel Power
Avg Mode
Exp Repeat
Toggles the average mode between Exp or Repeat. This
determines the averaging action after the specified number
of measurements (average count) is reached.
When selecting Exp, each successive data acquisition after
the average count is reached is exponentially weighted and
combined with the existing average. Exponential averaging
weights new data more than old data, which facilitates
tracking of slow- changing signals. The average will be
displayed at the end of each sweep.
When selecting Repeat, after reaching the average count, all
previous data is cleared and the average count is back to 1.
Key access: Meas > Channel Power
Integ BW
Specifies the range of integration used in calculating the
power in a channel. For example, set the main (center)
channel bandwidth. Note that the white frame indicates the
integration bandwidth. Be sure the span is set between 1
and 10 times the integration bandwidth. Change integration
bandwidth by using the knob and the arrow keys.
Key access: Meas > Channel Power
Chan Pwr Span
Specifies the frequency span used for the channel power
measurement by using the knob and the arrow keys. Be sure
the span is set between 1 and 10 times the integration
bandwidth.
Key access: Meas > Channel Power
N9320A Spectrum Analyzer
123
5
One-Button Measurements
Occupied BW
Occupied Bandwidth integrates the power of the displayed
spectrum. The power- bandwidth routine first computes all
signal power contained in the trace, then calculates the span
containing the power of the specified percentage. The
percentage value default is 99% of the occupied bandwidth
power.
For 99% occupied power bandwidth, Markers are placed at
the frequencies on either side of 99% of the power. 1% of the
power is evenly distributed outside the markers. The
difference between the marker frequencies is the 99% power
bandwidth.
This is the main menu of occupied bandwidth measurement
including all related parameters and measurement results.
Figure 29
Occupied Bandwidth Measurement
f1
f2
Measurement
Result
The occupied bandwidth function also indicates the
difference between the center frequency and the center
frequency of the channel. This “Transmit Freq Error”
124
N9320A Spectrum Analyzer
One-Button Measurements
5
is defined as the difference between the (f1 + f2)/2 and the
tuned center frequency of the signal.
NOTE
To get the correct measurement result, first set the center frequency,
reference level, and channel spacing.
Avg Number
On Off
Select On to specify the number of measurement averages
used when calculating the measurement result. The average
is displayed at the end of each sweep. Select Off to disable
measurement averaging. The range is from 1 to 1000.
Key access: Meas > Occupied BW
Avg Mode
Exp Repeat
Toggles the termination control type used for the averaging
function between Exp and Repeat. This determines the
averaging action after the specified number of measurements
(average count) is reached.
When you select Exp, each successive data acquisition after
the average count is reached is exponentially weighted and
combined with the existing average. Exponential averaging
weights new data more than old data, which facilitates
tracking of slow- changing signals. The average is displayed at
the end of each sweep.
When you select Repeat, after reaching the average count, all
previous data is cleared and the average count is reset to 1
and the averaging process is restarted.
Key access: Meas > Occupied BW
Max Hold
On Off
Toggles the maximum hold trace feature between On and Off.
Maximum hold displays and holds the maximum responses
of a signal.
Key access: Meas > Occupied BW
Occ BW% Pwr
N9320A Spectrum Analyzer
Edits the percentage of signal power used when determining
the occupied bandwidth.
Key access: Meas > Occupied BW
125
5
One-Button Measurements
OBW Span
Specifies the integration range used to calculate the total
power from which the percent occupied bandwidth is then
calculated. The analyzer span will be set to the same value
as the OBW Span for the measurement. OBW Span should
be set to an approximate multiple of 2 times the expected
occupied bandwidth result. The range is from 100 Hz to 3
GHz.
Key access: Meas > Occupied BW
x dB
Specifies the power level used to determine the emission
bandwidth as the number of dB down from the highest
signal point, within the occupied bandwidth span. This
function is an independent calculation from the OBW
calculation. The x dB Bandwidth result is also called the
emissions bandwidth, or EBW. Two arrows will be set to the
specified dB value below the maximum power level and the
total power between the arrows will be computed.
Frequencies f1 and f2 are determined as the furthest
frequencies x dB below and above maximum power level,
respectively. The emission bandwidth is then calculated as f2
– f1 as shown by the arrows indicated in Figure 29 (note
that the diamond markers are for the OBW function). The
range is from –100.0 to –0.1 dB.
Key access: Meas > Occupied BW
NOTE
126
The asterisk next to the x dB bandwidth value in Figure 29 indicates
the results may not have been determined with optimal analyzer
settings. If emission bandwidth is your primary interest, select Max
Hold. Then change detector mode to peak by pressing Det/
Display >
Detector > Positive Peak. Acquiring peak data ensures accuracy of
this measurement.
N9320A Spectrum Analyzer
One-Button Measurements
5
ACP
Adjacent Channel Power (ACP) measures the power present
in adjacent transmit channels. The span is automatically set
according to the six available offsets and their associated
integration bandwidths as defined by the user.
Figure 30
Adjacent Channel Power Measurement
Avg Number
On Off
Pressing On specifies the number of measurements that will
be averaged when calculating the measurement result. The
average will be displayed at the end of each sweep. Pressing
Off disables the measurement averaging.
Key access: Meas > ACP
Avg Mode
Exp Repeat
Enables the user to select the type of termination control
used for the averaging function (Exp or Repeat). This
determines the averaging action after the specified number
of measurements (average count) is reached.
When selecting Exp, each successive data acquisition after
the average count is reached is exponentially weighted and
combined with the existing average. Exponential averaging
N9320A Spectrum Analyzer
127
5
One-Button Measurements
weights new data more than old data, which facilitates
tracking of slow- changing signals. The average is displayed at
the end of each sweep.
When selecting Repeat, after reaching the average count, all
previous data is cleared and the average count is back to 1.
Key access: Meas > ACP
Chan Integ BW
Specifies the range of integration used in calculating the
power in the main channel. Use the knob and the arrow
keys to set the bandwidth.
Key access: Meas > ACP
Offset/Limits
Accesses softkeys that allow you to configure the offsets for
the ACP measurement.
Key access: Meas > ACP
128
Offset
ABCDEF
Selects the offset the softkeys will affect. Press
Offset until the letter of the desired offset is
underlined.
Key access: Meas > ACP > Offset/Limits
Offset Freq
On Off
Sets the frequency difference from the center
of the main channel to the center of the offset
for a maximum of 6 offsets (labeled A- F). It
also allows you to turn On/Off the offsets that
you want to measure.
Key access: Meas > ACP > Offset/Limits
Ref BW
Sets the reference bandwidth (integration
bandwidth) for each offset.
Key access: Meas > ACP > Offset/Limits
Pos Offset
Limit
Sets the upper limit for the upper segment of
the specified offset pair.
Key access: Meas > ACP > Offset/Limits
Neg Offset
Limit
Sets the upper limit for the lower segment of
the specified offset pair.
Key access: Meas > ACP > Offset/Limits
N9320A Spectrum Analyzer
One-Button Measurements
Meas Type
5
Specifies the reference for the measurement, either Total Pwr
Ref or PSD Ref. Relative values are displayed referenced to
either the total power (Total Pwr Ref) or the power spectral
density (PSD Ref) measured in the main channel.
Key access: Meas > ACP
Method
IBW RBW
Total Pwr Ref
(PSD Ref)
Auto Man
Enables you to select the measurement method. The
resolution bandwidth (RBW) method is most useful for
measuring cdmaOne signals; the integration bandwidth
method (IBW) is preferred for other signals.
Key access: Meas > ACP > More
Sets the adjacent channel power reference to automatic or
manual when Meas Type is set to Total Pwr Ref . When select
Auto, the carrier power result reflects the measured power
value in the carrier. When set to Man, the last measured
value is captured and held, or may be entered by the user.
Relative values are displayed, referenced to the total power
measured in the main channel.
When Meas Type is set to PSD Ref, pressing this key sets the
power spectral density in the carrier (main channel) that is
used to compute the relative power spectral density values
for the offsets.When the PSD Ref state is set to Auto, this
will be set to the measured carrier power spectral density.
Key access: Meas > ACP > More
Limits
On Off
Turns limits testing on or off. When select On, each offset is
compared to its upper and lower offset limit. In those cases
where the power exceeds the limit, the calculated result will
be displayed in red to indicate a failure. If there are any
failures, the pass/fail indicator area show “FAIL” in red; if
there are none, it shows “PASS” in green when using IBW
method. Neither “FAIL” nor “PASS” will be displayed when
using RBW method. Any offsets that are in the off state are
not measured and no results will be displayed.
Key access: Meas > ACP > More
N9320A Spectrum Analyzer
129
5
One-Button Measurements
Intermod (TOI)
The third order intermodulation (TOI) measurement computes
and displays the output intercept point (IP3), and places
arrows upon the trace to indicate the measured signals and
third- order products.
Figure 31
TOI Measurement
Avg Number
On Off
Set Avg Number to On to specify the number of measurement
averages used when calculating the measurement result. The
average will be displayed at the end of each sweep. Setting
Avg Number to Off disables measurement averaging.
Key access: Meas > More> Intermod (TOI)
Avg Mode
Exp Repeat
Selects the type of termination control used for the averaging
function (Exp/Repeat). This determines the averaging action
after the specified number of measurements (average count)
is reached.
When Avg Mode is Exp, Each successive data acquisition after
the average count is reached is exponentially weighted and
combined with the existing average. Exponential averaging
weights new data more than old data, which facilitates
tracking of slow- changing signals. The average is displayed at
the end of each sweep.
130
N9320A Spectrum Analyzer
One-Button Measurements
5
When Avg Mode is Repeat, after reaching the average count, all
previous data is cleared and the average count is back to 1.
Key access: Meas > More> Intermod (TOI)
TOI Span
Specifies the frequency span in which intermodulation
products are measured. If you modify the value of span in
the base instrument Span menu, the value in the Intermod
(TOI) menu will be updated to reflect the new value, and the
measurement will restart if it is running.
Key access: Meas > More> Intermod (TOI)
Max Mixer Lvl
Auto Man
Sets the relationship between the highest signal that can be
displayed (the reference level) and the input attenuation. The
relationship applies whenever the Attenuation is set to Auto.
The relationship is that the attenuation is given by reference
level minus the max mixer level. For example, as the
reference level changes, the input attenuator changes to
ensure that a signal at the reference level does not exceed
the Max Mixer Lvl setting.
When the TOI measurement is off, the previous maximum
Max Mixer Lvl is restored.
Pressing Auto sets the maximum mixer level to –30 dBm.
Key access: Meas > More> Intermod (TOI)
N9320A Spectrum Analyzer
131
5
One-Button Measurements
Spectrum Emission Mask
Spectrum Emission Mask measurement includes the in- band
and out- of- band spurious emissions. As it applies to
W- CDMA (3GPP), this is the power contained in a specified
frequency bandwidth at certain offsets relative to the total
carrier power. It may also be expressed as a ratio of power
spectral densities between the carrier and the specified
offset frequency band. For WLAN, the reference power is
taken as the peak PSD in the signal, and all offset results
are also the peak PSD in that offset as opposed to the
integrated power.
Figure 32
Avg Number
On Off
Meas Type
132
Spectrum Emission Mask
Set Avg Number to On to specify the number of measurement
averages used when calculating the measurement result. The
average will be displayed at the end of each sweep. Setting
Avg Number to Off disables measurement averaging.
Key access: Meas > More > Spectrum Emission Mask
Displays a menu to select a measurement reference type,
Total Pwr Ref or PSD Ref.
Key access: Meas > More > Spectrum Emission Mask
N9320A Spectrum Analyzer
One-Button Measurements
Ref Channel
5
Total Pwr Ref
When Total Pwr Ref is selected, the power in the
carrier is used as the reference in computing
the relative power values for the offsets.
Key access: Meas > More > Spectrum Emission
Mask > Meas Type
PSD Ref
When PSD Ref is selected, the mean power
spectral density of the carrier is used in
computing the relative power spectral density
values for the offsets.
Key access: Meas > More > Spectrum Emission
Mask > Meas Type
Accesses the softkeys to change the reference channel
settings.
Key access: Meas > More > Spectrum Emission Mask
Chan Integ BW Specifies the integration bandwidth used in
calculating the power in the main channel.
Key access: Meas > More > Spectrum Emission
Mask > Ref Channel
N9320A Spectrum Analyzer
Chan Span
Specifies the span used in measuring the
power in the main channel.
Key access: Meas > More > Spectrum Emission
Mask > Ref Channel
Sweep Time
Auto Man
Specifies the sweep time used in measuring
the power in the main channel.
Key access: Meas > More > Spectrum Emission
Mask > Ref Channel
Res BW
Auto Man
Specifies the resolution bandwidth used in
measuring and the power in the main channel.
Key access: Meas > More > Spectrum Emission
Mask > Ref Channel
133
5
One-Button Measurements
Total Pwr Ref
(PSD Ref)
Auto Man
Offset/Limits
Table 1
Displays the type of power measurement
reference selected by Meas Type.
Total Pwr Ref is the power in the carrier that is
used as the reference in computing the
relative power values for the offsets. When
Man is selected, this can be set by the user.
When Auto is selected, this is the measured
power in the reference carrier.
PSD Ref is the mean power spectral density in
the carrier that is used as the reference in
computing the relative power spectral density
values for the offsets. When Man is selected,
this can be set by the user. When Auto is
selected, this is the measured mean power
spectral density in the reference carrier.
Key access: Meas > More > Spectrum Emission
Mask > Ref Channel
Displays the menus to change the following parameters for
offset frequency settings and pass/fail tests: Offset, Start Freq,
Stop Freq, Sweep Time, Res BW, and Limits. Refer to the tables
below for default settings of particular radio standards of
interest.
Key access: Meas > More > Spectrum Emission Mask
Offsets & Limits Defaulted for W-CDMA (3GPP) Base Station Measurementsa
Offset
Start
Freq
(MHz)
Stop
Freq
(MHz)
Res BW
(kHz)
Abs
Start
(dBm)
Abs
Stop
(dBm)
Abs
Couple
Rel
Start
(dBc)
Rel Stop
(dBc)
Meas
BW
A. On
2.515
2.715
30.00
-14.00
-14.00
Couple
-30.00
-30.00
1
B. On
2.715
3.515
30.00
-14.00
-26.00
Man
-30.00
-30.00
1
C. On
3.515
4.000
30.00
-26.00
-26.00
Couple
-30.00
-30.00
1
D. On
4.000
8.000
1000.00
30.00
-13.00
-13.00
Couple
-30.00
-30.00
1
33
E. On
8.000
12.500
1000.00
-13.00
-13.00
Couple
-30.00
-30.00
1
a. Fail Mask is set to Absolute and Rel Stop is set to Couple.
134
N9320A Spectrum Analyzer
One-Button Measurements
Table 2
5
Offsets & Limits Defaulted for W-CDMA (3GPP) Mobile Station Measurementsa
Offset
Start
Freq
(MHz)
Stop
Freq
(MHz)
Res BW
(kHz)
Abs
Start
(dBm)
Abs
Stop
(dBm)
Rel
Couple
Rel
Start
(dBc)
Rel Stop
(dBc)
Meas
BW
A. On
2.515
3.485
30.00
-71.07
-71.07
Man
-35.23
-49.78
1
B. On
4.000
7.500
1000.0
-55.84
-55.84
Man
-35.50
-39.00
1
C. On
7.500
8.500
1000.00
-55.84
-55.84
Man
-39.00
-49.00
1
D. On
8.500
12.000
1000.00
-55.84
-55.84
Couple
-49.00
-49.00
1
E. Off
12.500
15.000
1000.00
-55.84
-55.84
Couple
-49.00
-49.00
1
a. Abs Stop is set to Couple and Fail Mask is set to Abs AND Rel.
Table 3
Offsets & Limits Defaulted for 802.11a and HiperLAN/2 Radio Standardsa
Offset
Start
Freq
(MHz)
Stop
Freq
(MHz)
Abs
Start
(dBm)
Abs
Stop
(dBm)
Abs
Couple
Rel
Start
(dBc)
Rel Stop
(dBc)
Rel
Couple
Meas
BW
A. On
9.00
11.00
16.00
-4.00
Man
0.00
-20.00
Man
1
B. On
11.00
20.00
-4.00
-12.00
Man
-20.00
-28.00
Man
1
C. On
20.00
30.00
-12.00
-24.00
Man
-28.00
-40.00
Man
1
D. On
30.00
50.00
-24.00
-24.00
Couple
-40.00
-40.00
Couple
1
E. Off
50.00
100.00
-24.00
-24.00
Couple
-40.00
-40.00
Couple
1
a. Res BW is set to 100 kHz and Fail Mask is set to Rel.
N9320A Spectrum Analyzer
135
5
One-Button Measurements
Table 4
Offsets & Limits Defaulted for 802.11b Radio Standarda
Offset
Start Freq
(MHz)
Stop Freq
(MHz)
Abs Start
(dBm)
Abs Stop
(dBm)
Rel Start
(dBc)
Rel Stop
(dBc)
Meas
BW
A. On
11.00
22.00
-10.00
-10.00
-30.00
-30.00
1
B. On
22.00
50.00
-30.00
-30.00
-50.00
-50.00
1
C. Off
50.00
70.00
-30.00
-30.00
-50.00
-50.00
1
D. Off
70.00
90.00
-30.00
-30.00
-50.00
-50.00
1
E. Off
90.00
100.00
-30.00
-30.00
-50.00
-50.00
1
a. Res BW is set to 100 kHz, Fail Mask is set to Rel, and Abs Stop and
Rel Stop are both set to Couple.
Offset
Select the offset pairs (upper and lower) that the softkeys
will affect, and displays the memory selection menu from A
to E (the analyzer can store up to 5 sets of values for Start
Freq, Stop Freq, Sweep Time, Res BW, Meas BW, Abs Start, Abs
Stop, etc.). Press Offset to select the letter of the desired
offset is underlined. Only one selection at a time is shown on
this key label.
Key access: Meas > More > Spectrum Emission Mask > Offset/Limits
Start Freq
On Off
Specifies the inner limit (frequency closest to the carrier) for
both segments of the specified offset pair. When Start Freq
(Off) is selected, the offset pair is not measured.
Key access: Meas > More > Spectrum Emission Mask > Offset/Limits
Stop Freq
Specifies the outer limit (frequency furthest from the carrier)
for both segments of the specified offset pair. The minimum
frequency difference between Start Freq and Stop Freq is limited
to 100 Hz.
Key access: Meas > More > Spectrum Emission Mask > Offset/Limits
Sweep Time Specifies the sweep time for the currently selected offset, and
Auto Man
toggles this function between Auto and Manual for each offset.
Key access: Meas > More > Spectrum Emission Mask > Offset/Limits
136
N9320A Spectrum Analyzer
One-Button Measurements
5
Res BW
Auto Man
Specifies the resolution bandwidth used in measuring the
offset pair. When set to Auto, the Res BW from the default
tables for “Offset/Limits” on page 134 are used. When set to
Man, the allowed range is 1 kHz to 1MHz.
Key access: Meas > More > Spectrum Emission Mask > Offset/Limits
Abs Start
To enter an absolute level limit at Start Freq for the currently
selected offset ranging from –200.00 to +50.00 dBm with 4
significant digits.
Key access: Meas > More > Spectrum Emission Mask > Offset/Limits
> More
Abs Stop
Couple Man
To enter an absolute level limit at Stop Freq for the currently
selected offset ranging from –200.00 to +50.00 dBm with 4
significant digits, and to toggle this function between Couple
and Man. If set to Couple, this is coupled to Abs Start to make
a flat limit line. If set to Man, Abs Start and Abs Stop the user
can enter different values to make a sloped limit line.
Key access: Meas > More > Spectrum Emission Mask > Offset/Limits
> More
Rel Start
Enters a relative level limit at Start Freq ranging from –150.00
to +50.00 dBc with 4 significant digits.
Key access: Meas > More > Spectrum Emission Mask > Offset/Limits
> More
Rel Stop
Couple Man
Enters a relative level limit at Stop Freq ranging from –150.00
to +50.00 dBc with 4 significant digits, and to toggle this
function between Couple and Man. If set to Couple, this is
coupled to Rel Start to make a flat limit line. If set to Man, Rel
Start and Rel Stop the user can enter different values to make
a sloped limit line.
Key access: Meas > More > Spectrum Emission Mask > Offset/Limits
> More
Fail Mask
Displays the menu to select one of the following logic keys
for fail conditions between the measurement results and the
test limits: Absolute, Relative, Abs AND Rel, and Abs OR Rel.
Key access: Meas > More> Spectrum Emission Mask > Offset/Limits
> More > More
N9320A Spectrum Analyzer
137
5
One-Button Measurements
Absolute
Sets the limit test to show Fail if one offset is
larger than the corresponding limit for Abs Start
and/or Abs Stop. This is the default selection for
each offset for BTS measurements.
Key access: Meas > More> Spectrum Emission Mask
> Offset/Limits > More > More > Fail Mask
Relative
Sets the limit test to show Fail if one offsets
spectrum emission mask measurement results is
larger than the corresponding limit for Rel Start
and/or Rel Stop.
Key access: Meas > More> Spectrum Emission Mask
> Offset/Limits > More > More > Fail Mask
Abs AND Rel Set the limit test to show Fail if one offset’s
spectrum emission mask measurement results is
larger than both the corresponding limit for Abs
Start and Abs Stop and the limit for Rel Start and
Rel Stop.
Key access: Meas > More > Spectrum Emission Mask
> Offset/Limits > More > More > Fail Mask
Abs OR Rel
Meas BW
138
Set the limit test to show Fail if one offset’s the
absolute spectrum emission mask measurement
results is larger than the corresponding limit
for Abs Start and Abs Stop or the limit for Rel
Start and Rel Stop.
Key access: Meas > More > Spectrum Emission Mask
> Offset/Limits > More > More > Fail Mask
Specifies the bandwidth to use when measuring the offset.
When using the front panel, only the currently selected
offset is affected. All the offsets are affected when remote
control. This is the multiplier applied to the resolution
bandwidth to determine the bandwidth to integrate when
calculating the power. Meas BW is now restricted to be 1
and not changeable.
Key access: Meas > More > Spectrum Emission Mask > Offset/Limits
> More > More
N9320A Spectrum Analyzer
Agilent N9320A Spectrum Analyzer
User’s Guide
6
Instrument Messages
Overview
140
Command Errors
141
Execution Conflict
Device-Specific Errors
s
143
145
139
6
Instrument Messages
Overview
If an improper operation occurs during the instrument
configuration, a message will appear on the status line
indicating the incident and the how the spectrum analyzer
corrected the setting automatically. press Preset/
System > More > Show
errors to read the specific descriptions of those messages.
Example
In this example, a failure explanation is generally included
with each error to further define its meaning. The
instrument messages in this guide are listed numerically.
<Code>
-330
Self-test failed
<Message>
A self- test failure occurred.
<Explanation in manual>
140
N9320A Spectrum Analyzer
Instrument Messages
6
Command Errors
The messages listed below are command errors, which are
saved into local registers.
-100
Command error
An unrecognized command or data type was encountered.
This message is used when the device cannot detect more
specifics described for errors - 101 to - 109.
-101
Invalid character
A syntactic element contains an invalid character.
-102
Syntax error
An unrecognized command or data type was encountered.
-103
Invalid separator
The parser was expecting a separator and encountered an
illegal character.
-104
Data type error
The parser recognized a data element that is not allowed.
-108
Parameter not allowed
More parameters were received than expected for the
header. For example, the *ESE common command only
accepts one parameter, so receiving *ESE 0,1 is not allowed.
N9320A Specturm Analyzer
-109
Missing parameter
Fewer parameters were received than required for the
header. For example, the *ESE common command requires
one parameter, so receiving *ESE is not allowed.
-110
Command header error
An error was detected in the header. This message is used
when the device cannot detect more specifics described for
errors - 111 to - 119.
141
6
142
Instrument Messages
-112
Program mnemonic too long
The header contains more than 12 characters.
-113
Undefined header
The header is correct in syntax, but it is undefined for this
device.
-128
Numeric data not allowed
A legal numeric data element was received, but the device
does not accept one in this position for the header.
-130
Suffix error
This error is generated when parsing a suffix. This message
is used when the device cannot detect more specifics
described for errors - 131 to - 139.
-131
Invalid suffix
The suffix does not follow the syntax described in IEEE
488.2, or the suffix is inappropriate for the device.
-134
Suffix too long
The suffix contained more than 12 characters.
-138
Suffix not allowed
A suffix was encountered after a numeric element which
does not allow suffixes.
-144
Character data too long
The character data element contains more than 12
characters.
-148
Character data not allowed
A legal character data element was encountered where
prohibited by the device.
N9320A Spectrum Analyzer
Instrument Messages
6
Execution Conflict
The system messages listed below are execution conflicts,
indicating settings conflict during your operation.
-200
Execution Error
This is the generic syntax error for devices that cannot
detect more specific errors.
-222
Data out of range
A legal program data element was parsed but could not be
executed because the interpreted value was outside the legal
range defined by the device. The displayed results may be
clipped.
-223
Too much data not all points entered
Indicates that a legal program data element of block,
expression, or string type was received that contained more
data than the device could handle due to memory or related
device- specific requirements.
-224
Illegal parameter value
An attempt was made to select a user file that contains 0
bits. Select another user file that contains at least 1 bit.
-241
Hardware missing
Missing device hardware. For example, the RF board is not
installed.
-253
Corrupt media
A source media (possibly EEPROM) for a data file is corrupt.
This error is usually seen in conjunction with errors concerning a certain file.
-300
Device-specific error
This is the device- specific error for devices that cannot
detect more specific errors.
N9320A Specturm Analyzer
143
6
144
Instrument Messages
-330
Self-test failed
A self- test failure occurred. Report this error to Agilent
Technologies.
-340
calibration failed
An expected file was not found while trying to load internal
calibration.
N9320A Spectrum Analyzer
Instrument Messages
6
Device-Specific Errors
102
Set 50 MHz signal < 0 dBm, do alignment again
The 50 MHz energy is too high at the RF port for alignments
to run. Reduce input power to less than 0 dBm and run
alignments again.
104
1st LO Unlock
The first LO on has lost phase lock. Report this error to the
nearest Agilent Technologies sales or service office.
105
2nd LO Unlock
The second LO has lost phase lock. Report this error to the
nearest Agilent Technologies sales or service office.
201
Option not installed
The desired operation cannot be performed because a
required option is not installed.
204
TG Frequency Limit
The tracking generator has reached the limit of its allowable
frequency range.
211
RBW limited to 1 kHz when Span > 1 MHz
In spans greater than 1 MHz, narrow (digital) resolution
bandwidths, below 1 kHz, are not available.
213
Span limited to 1 MHz when RBW < 1 kHz
In narrow (digital) resolution bandwidths, below 1 kHz,
spans greater than 1 MHz are not available.
214
TG start freq is less than 9 kHz
Tracking generator uncalibrated below 9 kHz.
N9320A Specturm Analyzer
145
6
Instrument Messages
215
TG start freq is less than 1/2 res bw
Tracking generator uncalibrated at start frequencies below
1/2 the current resolution bandwidth.
224
Option not licensed
The selected option requires a license. Refer to the
installation procedures in the user guide provided for this
particular option.
238
VBW filter or Average Detector cannot use both
501
RF over load
Either increase input attenuation or decrease the input
signal level.
502
IF over load
Either increase input attenuation or decrease the input
signal level.
604
File already exists
You attempted to save to a file that already exists. Either
delete or rename the existing file or select a new name, then
try again.
605
Media is protected
A save was attempted to a write- protected device.
610
File access is denied
The file is protected or hidden and cannot be accessed.
612
File not found
The analyzer could not find the specified file.
651
Connect TG OUT to RF IN
Attempt to align the tracking generator without its output
connected. Connect the TG SOURCE to RF IN.
146
N9320A Spectrum Analyzer
Instrument Messages
6
652
Connect CAL OUT to RF IN
you must connect the CAL OUT to RF IN with the appropriate
cable.
751
Instrument state set to initial values
While trying to load a trace or state, the state information
was found to be in error. This may be because the state had
been stored on a later revision of analyzer firmware. A
default set of state variables was loaded instead. There is
nothing wrong with the analyzer.
752
Unable to load state from file
Attempt to load a state from a file failed.
753
Unable to save state to file
Attempt to save a state to a file failed. See the associated
error messages for the cause.
757
Unable to load user state
A user preset failed, so the factory preset values were used.
Save a valid state into user preset and try again.
758
Unable to save user state
Attempt to save a user preset state failed.
760
Unable to query state
Query of state over the remote interface was unsuccessful.
762
Unable to load file
A failure occurred while loading a file.
764
Unable to save file
Attempt to save a file failed; the file was not saved.
N9320A Specturm Analyzer
147
6
Instrument Messages
767
Fatal LDS error
Attempt to initialize the instrument state has failed. Cycle
instrument power. If this fails to correct the problem,
contact your nearest Agilent Technologies service center.
768
Unable to load user state
Attempt to load a state failed, because the state was
saved with a measurement personality that is not currently
loaded. Load the appropriate personality and try again.
770
Incorrect filename
You sent a remote command to save a screen file but did not
specify a valid extension.
780
No Peak Found
No signal peak was found that meets the criteria under
Peak
Search
781
> Search Criteria.
Video Trigger cannot be active
You sent a remote command to do one of the following:
• Turn on video trigger while the Average Detector or a
Marker Function is active.
• Turn on the Average Detector or a Marker Function while
Video Trigger is active.
782
Video Trigger cannot be used with Mkr Func
Due to the Average Detector, the video Trigger cannot be
used with Maker function.
148
783
Allowable span for current CF exceeded
784
Allowable CF for current span exceeded
805
Doing Alignment
N9320A Spectrum Analyzer
Agilent N9320A Spectrum Analyzer
User’s Guide
7
In Case of Difficulty
Check the Basics
150
Read the Warranty
151
Contact Agilent Technologies
152
This chapter includes information on how to check for a
problem with your spectrum analyzer, and how to contact
Agilent Technologies for service.
s
149
7
In Case of Difficulty
Check the Basics
Before calling Agilent Technologies, or returning an analyzer
for service, perform the quick checks listed below. This
check may eliminate the problem.
• Is there power at the receptacle?
• Is the analyzer turned on? Listen for internal fan noise to
determine if the analyzer cooling fan is running. Feel the
rear side of the analyzer for air flow.
• If other equipment, cables, and connectors are being used
with your spectrum analyzer, make sure they are
connected properly and operating correctly.
• Review the measurement procedures being performed
when the problem first appeared. Make sure all of the
settings are correct.
• If the analyzer is not functioning as expected, return the
analyzer to a known state by pressing Preset/
System > Preset. For
details, refer to “Presetting the Spectrum Analyzer” on
page 27.
• Is the measurement being performed, and the results that
are expected, within the specifications and capabilities of
the analyzer? Refer to the Technical Overview for your
analyzer.
• Is the analyzer displaying an error message? If so, refer to
“Instrument Messages” on page 139.
• To meet specifications, the analyzer must be aligned. For
more information on how to align the analyzer, refer to
“Running Internal Alignments” on page 22.
WA RNING
150
There are no service components in the spectrum analyzer. To
prevent electrical shock, do not disassemble your spectrum
analyzer. Contact Agilent Technologies or professional service
provider for your service.
N9320A Spectrum Analyzer
In Case of Difficulty
7
Read the Warranty
Agilent Technologies provide one year warranty as standard
for your spectrum analyzer. The warranty information for
your spectrum analyzer is in the back of Technical Overview.
Please read it and be familiar with its terms.
If your spectrum analyzer is covered by a separate
maintenance agreement, please be familiar with its terms.
Agilent Technologies offers several optional maintenance
plans to service your spectrum analyzer after its warranty
has expired. Call the nearest Agilent Technologies sales
office for full details.
If you want to service the spectrum analyzer yourself after
the warranty expires, you can purchase the Service Guide
that provides all necessary test and maintenance
information.
N9320A Spectrum Analyzer
151
7
In Case of Difficulty
Contact Agilent Technologies
Agilent Technologies has offices around the world to provide
you with complete support for your source. To obtain
servicing information or to order replacement parts, contact
the Agilent Technologies customer contact center listed
below. In any correspondence or telephone conversations,
refer to your spectrum analyzer by its product number and
full serial number, press Preset/
System > More > Show System
Online help:
http://www.agilent.com/find/assist
United State
Canada
Europe
(tel) 800 829 4444
(fax) 800 829 4433
(tel) 877 894 4414
(fax) 800 746 4866
(tel) +31 20 547 2111
Korea
Japan
Latin America
(tel) 080 769 0800
(fax) 080 769 0900
(tel) +81 426 56 7832
(fax) +81 426 56 7840
(tel) +1 (305) 269 7500
China
Taiwan
Australia
(tel) 800 810 0189
(fax) 800 820 2816
(tel) 0800 047 866
(fax) 0800 286 331
(tel) 1 800 629 485
(fax) +61 (3) 9210 5947
Other Asia Pacific Countries
(tel) +65 6375 8100
(fax) +65 6755 0042
E-mail: [email protected]
152
N9320A Spectrum Analyzer
Agilent N9320A Spectrum Analyzer
User’s Guide
8
Menu Maps
This chapter provides a visual representation of the front
panel keys and their associated menu keys (in Spectrum
Analyzer mode). Refer to Chapter 4, “Key Reference” for key
function descriptions.
The name editor menu is shown separately, though it is
accessed when entering data for many keys. The front- panel
key menus appear in alphabetical order as follows.
s
153
8
Menu Maps
Amplitude Menu
Amplitude
Ref Level
Y Axis
Units >
Attenuation
Auto Man
dBmV
Scale/Div
dBuV
Scale Type
Log Lin
dBuA
>
Int Preamp
On Off
More
1 of 2
154
dBm
Watts
Volts
More
2 of 2
Amps
N9320A Spectrum Analyzer
Menu Maps
8
BW/Avg Menu
BW/
Avg
Res BW
Auto Man
Auto
Video BW
Auto Man
Video Avg
VBW/RBW
Auto Man
Pwr Avg
Average
On Off
Avg Type >
Auto Man
N9320A Spectrum Analyzer
155
8
Menu Maps
Det/Display Menu
Det/
Display
Detector >
Auto Man
Top
Auto
Center
Positive
Peak
Bottom
Negative
Peak
Active Fctn
Position>
Average
Video RMS
Display Line
On Off
Sample
Normal
Limits >
Limit 1 >
Type
Upper Lower
Point
Limit 2 >
Limit
On Off
Frequency
Test
On Off
Amplitude
Margin
On Off
Connected
Yes No
Edit >
156
Delete All
Limits
Delete Limit
Delete Point
Return
Return
Return
N9320A Spectrum Analyzer
Menu Maps
8
File Menu (1 of 2)
File
Catalog>
Save
Type>
Load
Sort>
By Date
All
By Name
Screen
State
Delete>
Copy
Trace
Local
Up
Order
Down
Limits
USB
Return
Save Now
Type>
Screen
Return
Delete Now
By Date
Type>
By Name
State
Source
Trace
Source>
Name
Limits
Name
Return
N9320A Spectrum Analyzer
Return
Up
Order
Down
Return
157
8
Menu Maps
File Menu (2 of 2)
File
Catalog
Load Now
By Date
Save>
Type>
By Name
Load>
Sort>
State
Delete>
Destination>
Trace
Copy>
Up
Return
Order
Down
Limits
Return
a.
Copy Now
By Date
All
Trace 1
Limit 1
Type>
By Name
Screen
Trace 2
Limit 2
State
Trace 3
Trace
Trace 4
Sort>
Up
Return
Order
Down
Limits
Return
a. The path is depend on the Type selection.
158
N9320A Spectrum Analyzer
Menu Maps
8
Frequency Menu
Frequency
Center Freq
Start Freq
Stop Freq
CF Step
Auto Man
Signal Track
On Off
N9320A Spectrum Analyzer
159
8
Menu Maps
Marker Menu
Marker
Select Marker >
1,2,3…12
Freq Counter >
Normal
Delta >
Phase Noise >
Off
Opti F Noise
On Off
Freq Counter
On Off
Delta
On Off
Resolution
Auto Man
Delta Pair
Ref Delta
Span Pair
Span Center
All Off
Funtion >
More
1 of 2
Return
Select Marker >
1
On
Phase Noise
On Off
-30KHz
Offset
30kHz
Marker Trace
Auto 1 2 3 4
Off
Offset
Manual
-50KHz
Offset
50kHz
Prev Page
Next Page
160
Return
Offset
1kHz
Offset
-100KHz 100kHz
-10KHz
Offset
10kHz
-1MHz
-20KHz
Offset
20kHz
-1KHz
Offset
1MHz
Marker Table >
More
1 Of 2
More
2 Of 2
More
2 of 2
Return
Return
N9320A Spectrum Analyzer
Menu Maps
8
Marker-> Menu
Marker ->
Mkr-> CF
Mkr-> CF Step
Mkr-> Start
Mkr-> Stop
Mkr-> Ref Lvl
N9320A Spectrum Analyzer
161
8
Menu Maps
Measure Menu (1 of 2)
Meas
X dB
Avg Number
On Off
Measure Off
Avg Number
On Off
Channel Power
Avg Mode
Exp Repeat
Avg Mode
Exp Repeat
Occupied BW >
Max Hold
On Off
Integ BW
ACP >
Occ BW% Pwr
Chan Pwr Span
>
OBW Span
More
1 of 2
More
More
Return
Return
Offset
ABCDEF
Avg Number
On Off
Intermod >
(TOI)
Avg Mode
Exp Repeat
Method
IBW RBW
Offset Freq
On Off
Chan Integ BW
Total Pwr/PSD
Auto Man
Ref BW
Limits
Off
Pos Offset Limits
Offset/Limits >
Spectrum
Emission Mask
On
Meas Type
Total Pwr PSD
More
More
2 of 2
Return
Return
Neg offset Limits
More
Return
a. Continued on sheet 2 of 2
162
N9320A Spectrum Analyzer
Menu Maps
8
Measure Menu (2 of 2)
Meas
Measure Off
Avg Number
On Off
Total Pwr Ref
Channel Power
Avg Mode
Exp Repeat
PSD Ref
>
Chan Integ BW
Absolute
Chan Span
Relative
Occupied BW >
TOI Span
Sweep Time
Auto Man
Abs AND Rel
ACP >
Max Mixer Lvl
Auto Man
Res BW
Auto Man
Abs OR Rel
Total
Ref
More
1 of 2
Intermod >
(TOI)
Return
Return
Avg Number
On Off
Offset
ABCDEF
Offset
ABCDEF
Offset
ABCDEF
Meas Type >
Start Freq
On Off
Abs Start
Fail Mask >
Ref Channel >
Stop Freq
Abs Stop
Couple Man
Meas BW
Offset/Limits >
Sweep Time
Auto Man
Rel Start
Res BW
Auto Man
Rel Stop
Couple Man
Spectrum
Emission Mask
More
2 of 2
Pwr/PSD
Return
More
1 of 3
More
2 of 3
More
3 of 3
Return
Return
Return
a. Links to Meas Menu (sheet 1 of 2)
N9320A Spectrum Analyzer
163
8
Menu Maps
MODE Menu
MODE
164
Spectrum
Analyzer
AmplitudeTG
On
Off
Tracking
Generator >
Attenuation
Auto Man
Power Sweep
On
Off
Store Ref
(1->3)
Normalize
On
Off
Amptd Offset
On
Off
Normalize >
Norm Ref Lvl
Amptd Step
Auto Man
Tracking Peak
Norm Ref Posn
Man Track Adj
Ref Trace
View Blank
More
1 of 2
More
2 of 2
Return
Return
Return
N9320A Spectrum Analyzer
Menu Maps
8
Name editor Menu
Name
ABCDEFG
HIJKLMN
OPQRSTU
VWXYZ
Return
N9320A Spectrum Analyzer
165
8
Menu Maps
Peak Search Menu
Peak
Search
Peak Search
Peak
Excursion
Max Value
Next Peak
Peak
Threshold
Excursion
& Threshold
Next Pk Right
Threshold
Hidden
Next Pk Left
Peak Search
Type >
Min Search
Pk-Pk Search
More
1 of 2
Return
Continuous Pk
On Off
N dB Points
On Off
Peak Table
On
Off
Peak Sort
Freq Amptd
Search
Criteria >
Peak Table >
More
2 of 2
166
Return
N9320A Spectrum Analyzer
Menu Maps
8
Preset/System Menu
Preset/
System
Preset
Alignment>
Align (Ext Cable)
Power On
Last Preset
Pwr on/Preset
>
Preset Type>
Alignment >
Save User
Preset
Language>
Timebase
Load defaults
CAL OUT
On Off
Return
Return
Return
English
User
Diagnostics>
More
1 of 3
Show System
Factory
Show Hardware
Show Software
Show Errors>
Front Panel Test
Time/Date>
More
2 of 3
Return
Licensing >
Option
Time/Date
On Off
Prev Page
License Key
Date Format
MDY DMY
Next Page
Activate
License
Set Time
Brightness
Set Date
Clear error
Queue
Sevice
More
3 of 3
N9320A Spectrum Analyzer
Return
Return
Return
167
8
Menu Maps
SPAN Menu
SPAN
Span
Full Span
Zero Span
Last Span
168
N9320A Spectrum Analyzer
Menu Maps
8
Sweep/Trig Menu
Sweep/
Trig
Sweep Time
Auto Man
Free Run
Sweep
Single
Video
Sweep
Cont
External Pos
External Neg
More
1 of 2
N9320A Spectrum Analyzer
More
2 of 2
169
8
Menu Maps
View/Trace Menu
View/
Trace
Select Trace >
1
Trace 1
Clear Write
Trace 2
Max Hold
Trace 3
Min Hold
Trace 4
View
Blank
170
N9320A Spectrum Analyzer
Index
Numerics
10 MHz REF OUT, 9
3GPP W-CDMA, 134
802.11a, 135
802.11b, 136
A
Abs Start, 137
Abs Stop, 137
AC power receptacle, 9
Active Fctn Position, 83
active function, 7
adjacent channel power, 127
Agilent Technologies, contact, 152
Alignment, 113
running, 22
Amplitude key, 4, 72
annotation, marker, 29
annotations, display, 7
Attenuation, 72
attenuation, reducing, 39
Auto Tune key, 5, 75
Average, 78
B
Back, 76
BW/Avg key, 5, 77
C
CAL OUT connector, 6
Catalog, 88
CE mark, 10
Center Freq, 95
CF Step, 95
N9320A User’s Guide
channel power, 122
comparing signals
off screen, 32
on the screen, 30
connector
CAL OUT, 6
EXT TRG IN, 9
PROBE POWER, 6
REF IN, 9
REF OUT, 9
RF IN, 6
TG SOURCE, 6
USB, 6, 9
VGA, 9
Continuous PK, 108
Copy, 93
CSA mark, 10
c-tick mark, 10
F
D
I
Data control keys, 6
Delete, 92
delta marker, 97
Det/Display key, 5, 81
Detector, 81
Display, 7
Display Line, 83
distortion, measuring, 48
E
Enter key, 87
error message, 21
ESD, 19
EXT TRG IN(TTL), 9
external reference, 22, 23
factory preset state, 112
Fail Mask, 137
File key, 88
File/Print key, 5
firmware revision, update, 23
frequency counter, 99
Frequency key, 4
front panel
display annotations, 7
overview, 4
symbols, 10
front panel, using, 26
H
harmonic distortion
measuring, 48
improving frequency resolution and
accuracy, 44
instruction manual, 10
instrument messages, 139
Int Preamp, 73
IO libraries suite, 24
ISM1-A, 10
L
LAN, 9
Licensing, 115
Limits, 84
Load, 91
Local, 5
lock, 9
171
Index
M
Marker key, 5, 97
Marker Table, 100
Marker-> key, 5, 101
Max Mixer lvl, 131
Meas key, 5, 102, 121
measuring
ACP, 127
channel power, 122
distortion, 48
low-level signal, 39
multiple signals, 30
occupied BW, 124
SEM, 132
source’s frequency drift, 46
TOI, 51, 130
measuring phase noise, 54
menu maps, 153
messages, 21
Min Search, 107
MODE key, 5, 103
N
N dB Points, 108
Next Peak, 107
O
occupied BW, 124
Offset/Limits, 128, 134
options, 12
enable, 22
licensing, 115
TG3, 6
order list, 12
P
Peak Search key, 5, 107
Peak Table, 110
Phase Noise, 99
phase noise, measuring, 54
power cord, 13
172
power receptacle, 9
power requirements, 13
power switch, 9
Preset, 111
preset
factory, 27
user, 27
Preset/System key, 5, 111
PROBE POWER, 6
Pwr on/Preset, 113
R
rack mount, 16
rear panel overview, 9
REF IN, 9
Ref level, 72
REF OUT, 9
Rel Start, 137
Rel Stop, 137
remote control, 24
requirements
ventilation, 15
Res BW, 77
resolving signals
equal amplitude, 34
hidden by large signals, 37
RF IN connector, 6
S
Save, 89
Scale/Div, 72
Search Criteria, 108
Show System, 114
Signal Track, 96
softkeys, 4
SPAN key, 4, 117
spectrum emission mask, 132
standby switch, 6
Start Freq, 95
Stop Freq, 95
Sweep/Trig key, 5, 118
switch
power, 9
standby, 6
symbols, 10
T
TG SOURCE connector, 6
Threshold Hidden, 109
TOI
Meas key, 130
measuring, 51
TOI Span, 131
tracking drifting signals, 46
U
Uncoupled, definition, 42
USB
DEV, 9
host, 9
using frequency counter, 44
V
VBW/RBW, 77
ventilation, 15
VGA, 9
Video BW, 77
View/Trace key, 5, 120
viewing signal, 28
W
WEEE, 10
N9320A User’s Guide
DECLARATION OF CONFORMITY
According to ISO/IEC Guide 22 and CEN/CENELEC EN 45014
Manufacturer’s Name:
Agilent-Qianfeng Electronic Technologies (Chengdu) Co., Ltd
Manufacturer’s Address:
Qianfeng Hi-Tech Industry Park,
Chengdu Hi-Tech Industrial Development Zone (West District),
Chengdu, 611731 P.R.C.
Declares under sole responsibility that the product as originally delivered
Product Name:
Model Number:
Product Options:
Spectrum Analyzer
N9320A
This declaration covers all options of the above product(s)
complies with the essential requirements of the following applicable European Directives, and
carries the CE marking accordingly:
Low Voltage Directive (73/23/EEC, amended by 93/68/EEC)
EMC Directive (89/336/EEC, amended by 93/68/EEC)
and conforms with the following product standards:
Standard
IEC 61326-1:1997+A1:1998 / EN 61326-1:1997+A1:1998
CISPR 11:1990 / EN 55011:1991
IEC 61000-4-2:1995+A1:1998 / EN 61000-4-2:1995
IEC 61000-4-3:1995 / EN 61000-4-3:1995
IEC 61000-4-4:1995 / EN 61000-4-4:1995
IEC 61000-4-5:1995 / EN 61000-4-5:1995
IEC 61000-4-6:1996 / EN 61000-4-6:1996
IEC 61000-4-11:1994 / EN 61000-4-11:1994
EMC
Limit
Class A Group 1
4 kV CD, 8 kV AD
3 V/m, 80-1000 MHz
0.5 kV signal lines, 1 kV power lines
0.5 kV line-line, 1 kV line-ground
3 V, 0.15-80 MHz
1 cycle/ 100%
Canada: ICES-001:1998
Australia/New Zealand: AS/NZS 2064.1
This product was tested in a typical configuration with Agilent Technologies test systems.
IEC 61010-1:2001 / EN 61010-1:2001
Canada: CSA C22.2 No. 61010-1:2004
USA: UL 61010-1: 2004
Safety
Supplementary Information:
This DoC applies to above-listed products placed on the EU market after:
Nov 16, 2006
Date
Shi Wen
Quality Manager
For further information, please contact your local Agilent Technologies sales office, agent or distributor, or
Agilent Technologies Deutschland GmbH, Herrenberger Straße 130, D 71034 Böblingen, Germany.
Template: A5971-5302-2, Rev. B.01
N9320A
Rev 1.0
www.agilent.com
© Agilent Technologies, Inc. 2006-2008
Printed in China
Second Edition, May 2008
*N9320-90001*
N9320-90001