1
JTAG-optimisation for CANoe
Anton Karlsson
Department of Automatic Control
Msc Thesis
ISRN LUTFD2/TFRT--5945--SE
ISSN 0280-5316
Department of Automatic Control
Lund University
Box 118
SE-221 00 LUND
Sweden
© 2014 by Anton Karlsson. All rights reserved.
Printed in Sweden by Media-Tryck
Lund 2014
Abstract
This master thesis investigates the possibilities to perform software validation tests
on ECUs with customer-identical software. Instead of using a ”test specific” software which sends ”test specific” information on the CAN-bus this data is to be
extracted from the target CPU by a JTAG debugger and integrated in the testing
software CANoe. The benefit of this method is that it eliminates the problems that
may be encountered during building of the ”test specific” software and that may
affect other parts of the software.
The work has been done at BorgWarner in Landskrona at the TTT-SW (software
test) department.
3
Acknowledgements
Individuals whom I would like to thank include - but are not limited to - my supervisor at BorgWarner TTT, Mattias Wozniak whom have been to a lot of help in
CANoe and test specific issues and Henrik Björk at BorgWarner TTE for a lot of
help and input in Lauterbach and target software related issues.
5
Contents
List of Figures
1.
2.
Introduction
1.1 BorgWarner and the product
1.2 Testing . . . . . . . . . . .
Software testing . . . . . . .
1.3 Problem formulation . . . .
1.4 Related work . . . . . . . .
1.5 Outline of the report . . . .
9
.
.
.
.
.
.
.
.
.
.
.
.
.
.
.
.
.
.
.
.
.
.
.
.
.
.
.
.
.
.
.
.
.
.
.
.
.
.
.
.
.
.
.
.
.
.
.
.
.
.
.
.
.
.
.
.
.
.
.
.
.
.
.
.
.
.
.
.
.
.
.
.
.
.
.
.
.
.
.
.
.
.
.
.
.
.
.
.
.
.
.
.
.
.
.
.
.
.
.
.
.
.
.
.
.
.
.
.
.
.
.
.
.
.
.
.
.
.
.
.
12
12
13
13
14
15
15
Background
2.1 CAN-bus . . . . . . . . . . .
Hardware . . . . . . . . . . .
CAN-message . . . . . . . . .
2.2 Software Test Rig . . . . . .
VT-system . . . . . . . . . . .
VN 8970 . . . . . . . . . . . .
2.3 CANoe . . . . . . . . . . . .
CANoe API . . . . . . . . . .
2.4 JTAG and Trace32 . . . . . .
Trace32 API . . . . . . . . . .
2.5 The ECU and ECU software .
.
.
.
.
.
.
.
.
.
.
.
.
.
.
.
.
.
.
.
.
.
.
.
.
.
.
.
.
.
.
.
.
.
.
.
.
.
.
.
.
.
.
.
.
.
.
.
.
.
.
.
.
.
.
.
.
.
.
.
.
.
.
.
.
.
.
.
.
.
.
.
.
.
.
.
.
.
.
.
.
.
.
.
.
.
.
.
.
.
.
.
.
.
.
.
.
.
.
.
.
.
.
.
.
.
.
.
.
.
.
.
.
.
.
.
.
.
.
.
.
.
.
.
.
.
.
.
.
.
.
.
.
.
.
.
.
.
.
.
.
.
.
.
.
.
.
.
.
.
.
.
.
.
.
.
.
.
.
.
.
.
.
.
.
.
.
.
.
.
.
.
.
.
.
.
.
.
.
.
.
.
.
.
.
.
.
.
.
.
.
.
.
.
.
.
.
.
.
.
.
.
.
.
.
.
.
.
.
.
16
16
16
16
18
18
18
20
21
21
22
23
3.
Equipment
26
4.
Performance
4.1 Procedure . . . . . . . . . . . . . . . . . . . . . . . . . . . . .
4.2 Result . . . . . . . . . . . . . . . . . . . . . . . . . . . . . . .
27
27
28
5.
Solution approach
5.1 RS232 approach . . . . . . . . . . . . . . . . . . . . . . . . . .
5.2 Integrated approach . . . . . . . . . . . . . . . . . . . . . . . .
30
30
31
6.
Implementation
6.1 Test rig . . . . . . . . . . . . . . . . . . . . . . . . . . . . . . .
33
33
7
Contents
6.2
User application . . . . . . . . . .
Background . . . . . . . . . . . . .
Usage . . . . . . . . . . . . . . . .
Visual Studio project details . . . .
Program Structure . . . . . . . . . .
6.3 Data extraction/integration dll . . .
Background . . . . . . . . . . . . .
Usage . . . . . . . . . . . . . . . .
Visual Studio project details . . . .
Program Structure . . . . . . . . . .
Overview . . . . . . . . . .
Initialisation . . . . . . . .
Debug Case . . . . . . . . .
KL15 KL30 . . . . . . . . .
Read/write loop . . . . . . .
Read . . . . . . . . . . . .
Process and Calculate . . .
Write . . . . . . . . . . . .
Stop . . . . . . . . . . . . .
6.4 CANoe configuration modifications
.
.
.
.
.
.
.
.
.
.
.
.
.
.
.
.
.
.
.
.
.
.
.
.
.
.
.
.
.
.
.
.
.
.
.
.
.
.
.
.
34
34
35
37
38
39
39
40
40
41
41
42
45
46
47
48
49
50
50
51
7.
Result and discussion
7.1 Concept . . . . . . . . . . . . . . . . . . . . . . . . . . . . . .
7.2 The test . . . . . . . . . . . . . . . . . . . . . . . . . . . . . . .
53
53
55
8.
Conclusion and Further Work
58
Bibliography
.
.
.
.
.
.
.
.
.
.
.
.
.
.
.
.
.
.
.
.
.
.
.
.
.
.
.
.
.
.
.
.
.
.
.
.
.
.
.
.
.
.
.
.
.
.
.
.
.
.
.
.
.
.
.
.
.
.
.
.
.
.
.
.
.
.
.
.
.
.
.
.
.
.
.
.
.
.
.
.
.
.
.
.
.
.
.
.
.
.
.
.
.
.
.
.
.
.
.
.
.
.
.
.
.
.
.
.
.
.
.
.
.
.
.
.
.
.
.
.
.
.
.
.
.
.
.
.
.
.
.
.
.
.
.
.
.
.
.
.
.
.
.
.
.
.
.
.
.
.
.
.
.
.
.
.
.
.
.
.
.
.
.
.
.
.
.
.
.
.
.
.
.
.
.
.
.
.
.
.
.
.
.
.
.
.
.
.
.
.
.
.
.
.
.
.
.
.
.
.
.
.
.
.
.
.
.
.
.
.
.
.
.
.
.
.
.
.
.
.
.
.
.
.
.
.
.
.
.
.
.
.
.
.
.
.
.
.
.
.
.
.
.
.
.
.
.
.
.
.
.
.
.
.
.
.
.
.
.
.
.
.
.
.
.
.
.
.
.
.
.
.
.
.
.
.
.
.
.
.
60
A.
Essentials of Visual Studio MFC project
62
B.
Selection from calculations.h
65
8
List of Figures
1.1
2.1
2.2
2.3
2.4
2.5
2.6
2.7
3.1
4.1
4.2
4.3
5.1
5.2
The clutch visualised in a car that is front wheel drive during normal
circumstances. . . . . . . . . . . . . . . . . . . . . . . . . . . . . . .
The standard identifier CAN frame with one byte of data. . . . . . . .
The VT-system with its modules mounted in a 19” rack cabinet. Realtime module to the far left. Power supply below the VT-system. . . . .
The VN8970 device. . . . . . . . . . . . . . . . . . . . . . . . . . .
Simulation Setup in CANoe. . . . . . . . . . . . . . . . . . . . . . .
Several TAPs connected through daisy-chain, TRST not shown. This
might illustrate separate devices/chips or different modules on one device/chip. . . . . . . . . . . . . . . . . . . . . . . . . . . . . . . . .
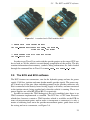
A standard and a JTAG-modified ECU. . . . . . . . . . . . . . . . . .
Example debug cases (241, 244 and 250) showing what case could contain what variable. . . . . . . . . . . . . . . . . . . . . . . . . . . . .
Equipment and set up overview. The different software run be the different devices are shown in red. . . . . . . . . . . . . . . . . . . . . .
The ECU during the test, regular traffic on the CAN bus specifying
driving scenario, status of the car, status of the ECU/AWD clutch, etc,
and the JTAG connection reading a part of the CPU’s memory. . . . .
Accumulated time by the operating schedule for different software and
JTAG data extraction loads. The blue bars represent how much time is
added to the thread by reading the memory. . . . . . . . . . . . . . .
Accumulated time by the suspended schedule for different software and
JTAG data extraction loads. The blue bars represent how much time is
added to the thread by reading the memory. . . . . . . . . . . . . . .
Overview of the ”RS-232 approach” . . . . . . . . . . . . . . . . . .
Software overview of the ’Integrated approach’. . . . . . . . . . . . .
12
17
19
19
21
22
23
25
26
27
29
29
31
32
9
List of Figures
6.1
6.2
6.3
6.4
6.5
6.6
7.1
10
Schematics for the light version test rig. . . . . . . . . . . . . . . . .
Syntax of the file to be loaded in the application. . . . . . . . . . . . .
The user interface of the application with variable-file loaded and all
available variables shown. . . . . . . . . . . . . . . . . . . . . . . .
Syntax of the file created by the application. . . . . . . . . . . . . . .
The flow of the data extraction/integration application. The dashed lines
represents interrupt-like events. . . . . . . . . . . . . . . . . . . . . .
Overview similar to Figure 6.5 where functions called in each block is
shown in red. . . . . . . . . . . . . . . . . . . . . . . . . . . . . . .
A part of the Control Software Test shown where some of the Quality
Signal Test Cases have failed. . . . . . . . . . . . . . . . . . . . . . .
34
35
36
37
41
42
56
Abbreviations
API
AWD
CAN
CAPL
CPU
dll
DUT
ECU
elf
GUI
ISO
JTAG
MFC
MSDN
PCB
TTS
Application Programming Interface
All-wheel Drive
Controller Area Network
CAN Access Programming Language
Central Processing Unit
Dynamic-link Library
Device Under Test
Electric Control Unit
Executable and Linkable Format
Graphical User Interface
International Organisation for Standardisation
Joint Test Action Group
Microsoft Foundation Classes
Microsoft Developer Network
Printed Circuit Board
TorqTransfer Systems
11
1
Introduction
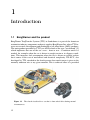
1.1
BorgWarner and the product
BorgWarner TorqTransfer Systems (TTS) in Landskrona is a part of the American
automotive industry components and parts supplier BorgWarner Inc. where TTS focuses on research, development and production of all-wheel drive (AWD) products.
The main product provided by TTS is an AWD-clutch of the type "on-demand" [2]
which implicates that one of the car’s axes - front or rear - is undriven until it is
needed, for example when the car is driven in rough terrain or in slippery conditions. This improves fuel consumption when the car is driven on regular surface
but it comes at the cost of mechanical and electrical complexity. The ECU, also
developed by TTS, attached to the clutch governs how much torque is given to the
normally undriven axis at any given moment. This is achieved since it is provided
Figure 1.1 The clutch visualised in a car that is front wheel drive during normal
circumstances.
12
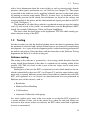
1.2
Testing
with a lot of information about the status of the car such as steering angle, throttle
position, wheel speed, acceleration, etc. via CAN-bus (see Chapter 2.1). The torque
is provided to the undriven axis by applying hydraulic pressure to the clutch plates
by running an electric pump motor. There is, in most cases, no feedback in terms
of hydraulic pressure on the clutch, the calculations are based on the voltage and
current supplied to the motor and the aforementioned signals provided to the ECU
via CAN, see Figure 1.1.
The demand of all-wheel drive vehicles is predicted to increase over the coming
years [2] and several of the world’s car manufacturers use the BorgWarner AWDclutch, for example Volkswagen, Volvo and Jaguar Land Rover.
The thesis work has been done at the department TTT-SW which mainly performs software testing of the ECU.
1.2
Testing
In order to make sure that the finished product meets the initial requirements both
the mechanical, electrical and software related aspects are extensively tested during
development - it is a part of the development process rather than being performed at
the end of each project. Since the thesis work has been done at the Software Testing
department the focus of it will be on this part.
Software testing
The testing of the software is governed by a test strategy which describes how the
testing should be performed so that there is a unified way of working within all the
projects [10]. This also leads to that a part of the test scripts can be used across
several projects.
During most of the tests the ECU is connected to a tool which simulates the car,
which is controlled by the tester’s PC (see Chapter 2.2) and also some further equipment such as a pump, different sensors and so on in order to simulate the reality the
ECU will experience in a car. Several so called functional tests are performed on
different areas of the software, such as:
• Bootloader
• Hardware Error Handling
• CAN interface
• Automatic Calibration of the pump
In a more explicit sense some of the tests might see to that the ECU responds in
a certain amount of time, and in the correct way, when the anti-lock brakes are
activated or that correct actions are taken by the ECU when some kind of problem
or error is encountered.
13
Chapter 1. Introduction
Furthermore a number of non-functional tests are performed on areas such as
performance and stability.
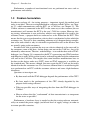
1.3
Problem formulation
In order to evaluate all - for testing purposes - important signals the method used
today is not ideal. The tests are implemented in a software called CANoe, see Chapter 2.3, which communicates with the ECU via a CAN-bus, see Chapter 2.1. The
CANoe software is connected to the ECU in the same way as the costumer (the car
manufacturer) will connect the ECU to the cars’ CAN-bus system. However, during testing, information is sent on the bus which is not supposed to be used by the
customer, hence, a purpose-built test-software has to be flashed on the ECU. This
means that the tests are performed on a device that is not identical to that which the
costumers use. The risk is that something unknown might happen during compilation of the code which is why it is desirable to perform the tests on the devices that
are actually going to the customers.
In order to be able to perform the tests on a device identical to the one used by
the customers some of the data - before being sent out on the CAN bus - has to be
obtained by other means. The aim - and challenge - is to read that data with a JTAGdebugger (see Chapter 2.4) connected to the ECU’s processing unit JTAG-interface
and integrate it with CANoe so that it can be evaluated together with the information
still sent on the CAN-bus. This implies that some hardware modifications have to
be done to the device under test (DUT) since no JTAG connector is available on
the standard unit. This means, though, that once again the ECU will not be totally
identical to that the costumers use. It is, however, deemed that it is worth having the
tests performed on an ECU with the customer software and some slight hardware
alterations.
Questions to investigate are:
• By how much will the JTAG-debugger degrade the performance of the CPU?
• By how much is the performance of the CPU already degraded by the
purpose-built testing software?
• What are possible ways of integrating the data from the JTAG-debugger in
CANoe?
• How to achieve that this ”workaround” of data transmission is as transparent
for the tester as possible?
Furthermore, a hardware layer is needed so that the testing software automatically can control the power supply (on/off and level of supply voltage) in order to
test more possible scenarios.
14
1.4
1.4
Related work
Related work
Similar work do not seem to have been published in the past. It is possible that
companies using similar tools and equipment as BorgWarner have tried to implement a similar approach since some benefits are obvious (perform tests on customer
software).
There are however tools available that may achieve the same goal, such as XCP
[5] which is a protocol that can access, for example, target memory. This method
still loads the CAN bus a bit more than a standard customer ECU would but the
tool is well integrated in CANoe which should make it relatively easy to integrate
in existing way of work.
1.5
Outline of the report
Chapter 2 will explain the software, hardware and protocols used in the existing
test set up. Chapter 3 declares how the set up looks like when incorporating the
JTAG debugger. Further in Chapters 4, 5 and 6 the procedure and results of the
performance measurements, a discussion regarding which approach to choose for
integrating data in CANoe and how the final solution is implemented are discussed.
These are followed by Chapters 7 and 8 discussing the result, conclusion and further
work.
15
2
Background
2.1
CAN-bus
The CAN protocol is an ISO standard for serial data communication which was developed by Roberth Bosch GmbH [3] during the ’80s for automotive applications.
Now, however, CAN is not exclusively used in automotive context but also in industrial automation and mobile machinery. CAN differs from several other buses
in the way that it does not require a host computer or processor; every node on the
bus has its own processor which allows them to communicate with each other. This
makes the technique well suited for automotive purposes since a modern car may
have 50-100 ECUs for various subsystems.
Since all nodes on the bus are able to communicate, all nodes ”hear” all transmissions - all nodes pick up all traffic. This might lead to undesirable interaction
between different nodes or systems on the bus. There are, however, methods like
filtering in the hardware to make sure that certain messages only reach a certain
node.
Hardware
The physical connections between the nodes on the CAN bus most commonly comprise a two-wire (plus ground) scheme, each line called CAN-HI and CAN-LO
respectively. The signal is differential and also usually connected in a twisted-pair
fashion making it less prone to interfere with a noisy environment. Each end of the
bus has to be terminated with a 120 Ω resistor.
According to the CAN standard - ISO-11898-1 - the maximum transmission
speed is 1 Mb/s when the cable length is less than ∼40 meters. If the network gets
larger the bit rate has to be reduced.
CAN-message
There are basically three different message types, called ”Frames”, on a CAN-bus:
• the Data Frame
16
2.1
CAN-bus
Figure 2.1 The standard identifier CAN frame with one byte of data.
• the Remote Frame, and
• the Error Frame
The Data frame carries, as the name implies, the data on the bus. Since a specific frame can not be directed to a specific node each frame comprises an identifier
which is unique on the bus. Apart from the identifier (which is a part of the arbitration field) the frame also consists of, see Figure 2.1, a control field containing
information regarding type of identifier and number of bytes of data; a data field
which contains zero to eight bytes of data; a CRC field which contains a 15-bit
checksum used for error detection and an acknowledgement slot which tells the receiver that the frame has been received by a node, not necessarily the node the data
was intended to.
The identifier can be either 11-bit or 29-bit long, called standard (also CAN
2.0A) and extended (CAN 2.0B) identifier respectively. To differentiate between
the two a reserved bit in the control field is used. It is possible to mix 2.0A and 2.0B
nodes on a bus as long as a B node does not send frames with an extended identifier
(it is capable of sending standard identifiers as well). The extra ”space” in the B
message can then be used as an extension of the data field.
The Remote frame is different from the Data frame in two ways, it is marked
as a remote frame with a dedicated bit in the arbitration field and there is no data
field. The Remote frame is used by a node when it is requesting data with a specific
identifier.
The Error frame is used when a node detects an error on the bus and does not
look like the regular Data or Remote frames. When the frame is sent the other nodes
detecting this frame will also start sending error frames, hopefully making sure that
it is detected by the last transmitting node which then tries to retransmit the message.
Error counters make sure that the bus traffic does not become destroyed by the error
frames.
There is also a fourth type of frame, the Overload frame, which is sent when
a node becomes too busy. This frame is, however, rarely used nowadays since the
only CAN controller capable of sending it is the outdated Intel AN82526 [4].
On the CAN bus a transmitted ”0” is dominant and a ”1” is recessive which
means that if two nodes are trying to transmit a message simultaneously the one
17
Chapter 2. Background
with the lower ID will succeed. The node trying to transmit the message with the
higher ID will wait and try again.
2.2
Software Test Rig
During testing it is necessary that the ECU is connected to the testing equipment
in a fashion similar to the car it is supposed to be fitted to. The test rig, to which
the ECU is connected via CAN during testing, is capable of simulating a whole
car, with all its CAN nodes, if necessary. It also offers the possibility to connect, or
simulate, sensors and actuators so that the testing environment becomes as close to
reality as possible.
The test rig is based on a 19” rack cabinet and consists of different modules:
• Power module, capable of delivering high currents since the pump during
brief moments might be under heavy load.
• Pump module, containing four different pumps to simulate different scenarios; normal, pressure too high, pressure too low and pump with stuck motor
axle.
• Fault injection module, containing equipment to simulate external hardware
faults such as short circuits, power loss, disconnected pump, etc.
• VT-system or VN8970 module, see below.
VT-system
The VT-system, developed by the company Vector Informatik GmbH [8], is the
”heart” of the test rig and the main part of it is its real-time module which basically
is a computer that simulates the car to which the ECU is connected. The real-time
module is used to enhance the performance by running the real-time parts of the
CANoe tests on a dedicated platform rather than the user PC, which often has a lot of
different processes running at all times. It is accessed from the user PC by Ethernet
which does not affect the behaviour or performance of the real-time system.
The system is modular in itself and consists of, apart from the real-time module;
a CAN network module, general purpose relay and analog-/digital I/O modules and
a couple of power modules, see Figure 2.2.
VN 8970
The VN8970, also from Vector [14], is similar to the VT-system in that sense that it
is also running a real-time computer and CANoe in order to simulate the imaginary
car. It differs in that it is not a modular system with the capability to expand with
modules such as I/O and relay modules. It does, however, comprise several CANbus channels and a general I/O port, see Figure 2.3. For the scope of the thesis work
18
2.2
Software Test Rig
Figure 2.2 The VT-system with its modules mounted in a 19” rack cabinet. Realtime module to the far left. Power supply below the VT-system.
Figure 2.3 The VN8970 device.
19
Chapter 2. Background
either of the mentioned Vector hardware devices fulfil the requirements. The major
difference is that it is possible to expand the VT-system and suit it to the specific
task by means of I/Os and so on, the VN8970 has a fixed number of I/Os from the
beginning.
2.3
CANoe
All the tests, called measurements, performed on the ECU are implemented in CANoe, also developed by, just as the VT-system and the VN8970, Vector [6]. CANoe
is highly integrated with the VT/VN hardware and comprises functions such as simulation of bus systems, analysis of bus communication, testing of entire networks
and/or individual ECUs etc.
A CANoe test set up, called configuration, consists partly of a Simulation Setup
where the CAN network, with its nodes, is graphically presented, see Figure 2.4.
The node presented to the far right is the CAN interface towards the hardware used;
the ECU. Each other node is configured by CANoe and might be of different type.
For example, as seen in Figure 2.4, an ’I-Generator’ (Interactive Generator) block
which can be set to send one or several specific frames once or on a cyclic basis or
more configurable nodes, such as the ’ECU’ blocks. These blocks are configured by
a C-like programming language called CAPL [9] which makes the nodes convenient
to suit the specific application. The actual test scripts are also implemented in this
language, see example code below.
// To block all standard (11-bit) messages on channel 2
canSetChannelAcc(2, 0x7FF, 0x7FF);
// To block all extended (29-bit) messages on channel 2
canSetChannelAcc(2, 0x8FFFFFFF, 0x8FFFFFFF);
// To accept on message 0x100 on channel 1
canSetChannel(1, 0x100, 0x100);
A configuration may also comprise a number of so-called system variables.
These variables are used for development and testing since they do not describe
external input/output signals of a node nor communication between nodes (called
environment variables) but rather provide the possibility to change and analyse internal values and parameters. System variables do not have to be received via the
network, such as CAN or the I/O-modules, but can be set by other means, for example in a CAPL instance or by the CANoe API. The system variables in the configuration are playing a vital part for the scope of this thesis.
20
2.4
JTAG and Trace32
Figure 2.4 Simulation Setup in CANoe.
CANoe API
Vector provides an API written in C with CANoe that, when used, has to be built
as a dll-file which in turn has to be linked in the specific CANoe configuration. The
API consist of a number of functions like reading and writing system variables but
also comprises some functions that have to be implemented so that CANoe is able to
”run” the dll. These are functions that are called, for example, when the dll is loaded,
when the measurement (test) starts, and when the measurement stops. The names
of the functions in the CANoe API are preceded by ccl, for example cclPrintf
which is a standard printf-function but writes specifically to the ’write’-window
in CANoe.
2.4
JTAG and Trace32
JTAG is a tool used for integrated circuits debugging purposes [11]. Given enough
pins on the device, almost every modern processor implement a JTAG interface. The
interface makes it possible to access on-chip debug modules, setting breakpoints and
debug at machine instruction level or high level source code. To actually access the
on-chip data and modules one have to connect a JTAG-debugger to the target CPU.
JTAG-enabled devices feature at least one Test Action Port (TAP) which handles
the JTAG interface, see Figure 2.5, and uses the following signals:
• TCK - Test Clock
• TMS - Test Mode select
• TDI - Test Data In
• TDO - Test Data Out
21
Chapter 2. Background
Figure 2.5 Several TAPs connected through daisy-chain, TRST not shown. This
might illustrate separate devices/chips or different modules on one device/chip.
• TRST - Test reset (Optional)
The TMS signal controls the behaviour of the JTAG interface by controlling
in which state the TAP controller is. The clock signal synchronizes the TAP controller’s operations and the Data In and Data Out signals represents the data shifted
in/out of the controller’s test or programming logic at rising and falling edge of
TCK, respectively. The reset signal, which is optional can reset the TAP controller’s
state machine [7].
Trace32 is a debug and development tool supplied by Lauterbach GmbH [12]
which uses said JTAG interface to communicate with the CPU in the ECU. All the
variables that are interesting for the scope of the thesis work are accessible by the
software.
Trace32 API
The API provided by Trace32 is written as a C library with a number of predefined
functions making it possible to remotely, for example from a Visual Studio-written
application, control the software and the debugger [1]. When configured the application communicates with Trace32 via a socket interface making it possible to run
the application and Trace32 on different hosts. Every function name of the Trace32
API is preceded by T32_. Important functions for the scope of the thesis work provided by the API are among others:
// Configures the communication driver of the API.
// Example T32_Config("NODE", "LOCALHOST")
int T32_Config(char* string1, char* string2)
// Initialize and connect to Trace32 driver.
int T32_Init(void)
22
2.5
The ECU and ECU software
Figure 2.6 A standard and a JTAG-modified ECU.
// Reads data from target memory
int T32_ReadMemory(dword address, int access,
byte* buffer, int size)
// Ends connection with Trace32 driver
int T32_Exit(void)
In order to get Trace32 to work with the specific project on the target CPU one
has to load an .elf file which is created during compilation of the project. The file
contains information about memory, symbols, debug information, etc, and is loaded
through the command line in Trace32 via DATA.LOAD.ELF [path_to_file].
2.5
The ECU and ECU software
The ECU features two connectors, one for the hydraulic pump and one for power
supply, CAN-bus, ignition and some further model-specific signals. The power supply is made up of two pins (three including ground) in the specific connector; one
that is connected to the battery, hence having supply at all times, and one connected
to the ignition circuit, being supplied only when the vehicle is running. These two
power supplies are called KL30 and KL15, respectively.
In order to connect the JTAG debugger it has to be modified since there is no
JTAG connector implemented as standard. The ECU has a CPU from Freescale
which does, however, contain a JTAG interface which is available on the PCB in
terms of measurement points and in order to incorporate a connector it is only a
matter of soldering leads on to the specific measurement points, guide these out of
the casing and on to a connector, see Figure 2.6.
23
Chapter 2. Background
The software on the ECU consists of basically two parts, base software
and control software. The control part is relatively similar between the different project/customers comprising management of the pump, mathematical models for temperature calculations and so on, while the base software is more
project/customer specific, handling the CAN frames sent on the CAN-bus to and
from the car, car-specific behaviour and so on.
There are two major builds of software used for different purposes at the company, one called Application and one called Monitor. The Application software is
the software which the customer is going to get on the ECUs mounted on the cars,
the Monitor software is used in-house for testing and development purposes. The
two builds differ mainly by a part of code called ioDebug which does not exist in
the Application build. ioDebug handles the frames sent on the CAN-bus specifically
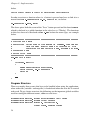
for software testing and evaluation purposes i.e. the part of code, which by the thesis work, we aim to get rid of and instead extract the data via JTAG. Not all debug
variables are sent all the time, the tester can select (manually or in the test script for
the change to be done automatically) which group of variables to receive from the
ECU by sending a frame to the ECU on the CAN-bus specifying a so called ”debug
case”. This is to reduce the load on the bus and each case is created so that a specific
group of tests can be performed without changing it. This means that some variables
exist in several cases, see example cases in Figure 2.7, but since only one case is
active at any given time, the overall bus load is reduced compared to if all variables
where to be transmitted. In the project from which the thesis work is based on there
are a total of five different debug cases ranging from 26 to 9 variables in each.
24
2.5
The ECU and ECU software
241---------------------------------------------------FLVel
FRVel
RLVel
RRVel
EngineOmega
ActionTorque
EngineTorque
ReqEngineTorque
244---------------------------------------------------PumpCurrent
PumpVoltage
Curvature
VehicleVel
VehicleMaxAcc
VehActualAcc
TorqueDistBrake
VehicleMode
ErrorCtrlMode
250---------------------------------------------------PumpCurrent
PumpVoltage
AutoCalibState
AutoCalibStatus
VehicleVel
VehicleMode
ErrorCtrlMode
Figure 2.7 Example debug cases (241, 244 and 250) showing what case could
contain what variable.
25
3
Equipment
The equipment used was a PC, an ECU - connected to the JTAG debugger, a JTAG
debugger - connected to the PC via USB and a Vector real-time system - VT or VN
8970 - also connected to the ECU via CAN and the personal computer via Ethernet,
see Figure 3.1 where which software is run on which device is shown in red. The
PC runs CANoe and Trace32 whilst the Vector real-time system runs the real-time
part of the CANoe tests. The ECU is also connected to a pump block so that it
can perform all the test as if it was installed in a car. Between the real-time system
and the ECU the hardware layer is connected which is controlled by the real-time
system via a couple of I/O-signals which in turn controls the power supply to the
ECU, see Chapter 6.1 for more details.
For development and using the APIs provided by CANoe and Trace32, Visual
Studio C++ 2010 [13] was used.
Figure 3.1 Equipment and set up overview. The different software run be the different devices are shown in red.
26
4
Performance
BorgWarner has implemented tests to measure the performance of the ECU in terms
of cycle time, CPU-load, execution time of certain threads etc, which are performed
on the ECU when changes in the software have been made. It was possible to use
these tests to measure the performance when at the same time extracting data on the
JTAG interface to see if the performance was degraded.
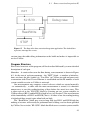
ECU
CAN
CAN
JTAG
Figure 4.1 The ECU during the test, regular traffic on the CAN bus specifying
driving scenario, status of the car, status of the ECU/AWD clutch, etc, and the JTAG
connection reading a part of the CPU’s memory.
4.1
Procedure
The set up in order to test the performance is the same as in Figure 3.1. During
the test CANoe runs a general measurement running the ECU through a number
of different driving scenarios whilst the CPU is being ”stressed” by the reading of
memory and the data being extracted on the JTAG interface every 20 ms, see Figure
4.1. At the end of the test Trace32 runs a script which extracts information from the
CPU regarding the performance by means of execution times, loads, etc.
Several tests were run with different software (Application and Monitor) and
different amount of data extracted. Tests on the application software without any
27
Chapter 4. Performance
data extraction were run in order to have a reference and also to evaluate what difference the ioDebug part - the part of the software that sends the debug/test specific
frames over CAN, see Chapter 2.5 - of the software makes to the overall performance. In order to decide how large amount of data to extract during the tests the
ioDebug code was studied to actually see what variables are sent on the bus. In the
case of the project used during testing ioDebug sent variables adding up to approximately 1 kB of data. Normally during a test not all variables are necessary which
is why separate tests with different amount of data extracted were performed - one
with all the data, one with approximately half and one with approximately a tenth
of the data. Furthermore, in order to stress the system to its max, one test where the
whole RAM was extracted was performed. All of the tests with simultaneous data
extraction were done on an ECU with the Application software flashed.
The performance script presents the result from the tests by means of execution
time and CPU-load for all the different so called schedules in the CPU - initialisation schedule, operating schedule, suspended schedule, shut down schedule and
so on, which basically are different modes in which the CPU can be operating. It
is implemented so that it presents the worst case times and loads recorded for the
different schedules and threads. That is, the result presented below shows the maximum execution time of that thread recorded during the test. The most important
schedule to investigate is the operating schedule since it is in this schedule the CPU
is operating when everything is normal.
Execution times and loads might change slightly due to different noise factors
which is why each test case was run three times to get statistical validity. The result
is then presented as a mean value of the three measurements.
4.2
Result
Figures 4.2 and 4.3 show the accumulated time for all the threads in the different
schedules for the different software and amount of data extracted. Even though the
differences are small in absolute time (Monitor is roughly 2% slower than Application in operating mode) it is clear that the Application build is the fastest and that
when the whole RAM is extracted is the slowest. When extracting the amount of
data corresponding to 10% of the ioDebug variables no noticeable difference can be
seen.
More importantly, the more realistic cases when data corresponding to all, or a
part, of the variables in ioDebug are extracted are not worse than the Monitor build.
All of the schedules (not presented here) show a similar behaviour which is why it
is possible to conclude that, for these purposes, the JTAG data extraction method
satisfies the current needs of not degrading the CPU’s performance.
28
4.2
Result
Figure 4.2 Accumulated time by the operating schedule for different software and
JTAG data extraction loads. The blue bars represent how much time is added to the
thread by reading the memory.
Figure 4.3 Accumulated time by the suspended schedule for different software and
JTAG data extraction loads. The blue bars represent how much time is added to the
thread by reading the memory.
29
5
Solution approach
In order to analyse data extracted from the ECU via the JTAG debugger in the regular testing environment, CANoe, the data has to be shifted from the JTAG debugger
software, Trace32, to CANoe. Two main approaches where considered trying to
achieve this, see Sections 5.1 and 5.2.
Common for the two approaches are that the JTAG debugger is connected to the
user PC via USB.
5.1
RS232 approach
Serial communication (in this case RS-232) ports are available to use with the Vector
hardware in the form of USB-to-Serial adaptors and furthermore CAPL has functions defined to handle serial communication. When the data has been extracted
from the serial port it is trivial to write it to specific system variables from which
it can be used during testing. So how do we provide the Vector hardware with the
serial data?
Trace32 is provided with an API so that one can write an application controlling
the software and the debugger. With the API functions it is possible to extract data
from the ECU to your application, process it and send it on the computer’s serial
port.
This is a ”straight forward” approach that is easy to understand and overview,
see Figure 5.1. The drawback is that RS-232 is only capable of quite slow transmission speeds - in test cases where timing is important a high bandwidth is of
essence - and that it introduces new hardware in terms of a cable from the PC to the
Vector hardware. Furthermore the application extracting the data from Trace32 and
sending it on the serial port has to be started and operated by the tester, hence this
approach is not as transparent from the tester’s point of view as wished. Therefore
this approach is here after considered as secondary.
30
5.2
Integrated approach
Figure 5.1 Overview of the ”RS-232 approach”
5.2
Integrated approach
This approach is based on writing a C++ application using the API’s of both Trace32
and CANoe, see Sections 2.4 and 2.3. Using the CANoe API dictates that the application has to be built as a dll and the implementation has to contain certain CANoe
API functions. Furthermore, the dll is run by the Vector real time system by linking it in the CANoe configuration, this means that the application has to connect to
the Trace32 application run by the user PC via the Ethernet connection shown in
Figure 5.2. Although Lauterbach Trace32 recommend that the application using the
Trace32 API and the actual Trace32 instance is run on the same host, it is possible
to run your application on a remote device. It is therefore possible to run the application on the Vector real time system by configuring the Trace32 API to connect to
the IP-address of the user PC.
The C++ application has therefore access to every function needed in order to
integrate data extracted from Trace32 in CANoe.
This approach is somewhat more ”elegant” than the aforementioned since it
eliminates the use of extra hardware which makes it more user friendly, though, the
user has to link the application dll-file in CANoe.
31
Chapter 5. Solution approach
Vector Real-time device
Real-time CANoe
dll / C++ application
CANoe API
Trace32 API
Ethernet
Trace32
CANoe
Figure 5.2 Software overview of the ’Integrated approach’.
32
6
Implementation
The following chapter will describe how the suggested solution to the challenges
described in Chapter 1.3 was implemented. Firstly the hardware of the test rig will
be described followed by the two parts of software implemented; the graphical user
application which function is that the user can create a file containing the information needed by the second part - the software governing the actual transmission of
data between the ECU and CANoe.
6.1
Test rig
The hardware needed of the test rig was somewhat more basic than the one used
on the regular test rigs, see Section 2.2, where a lot of more test scenarios have
to be possible to realize. In this case it was deemed enough to have the possibility
to remotely, via the simulation software, control the level of supply voltage and
also have the possibility to control KL30 and KL15 power supply on/off. This is
possible to achieve using the general I/O port available on the VN8970 unit which
comprises both digital and analog inputs/outputs. In this case two digital outputs
to operate the relays controlling KL30 and KL15 voltage and one analog output to
connect to the power supply controlling the level of voltage are needed. The extra
hardware components needed were mounted in a plastic box.
In order to make the test rig a bit more user friendly two of the CAN channels
available on the VN8970 are connected through the box with new connectors on the
side which also comprises the power supply connectors to the ECU, making that
specific side of the box the interface to the ECU.
The level of the voltage is controlled via an analog input, 0-5V, on the power
supply where 0V input means 0V output and 5V input means 70V output. The
power supply is here limited to maximum output voltage of 24V in order to protect
the ECU. The analog input is connected to the corresponding analog output on the
VN8970.
The relays used to control the KL30 and KL15 voltages are standard 12VDC
relays used in automotive contexts. To control these relays two ”relay” outputs on
33
Chapter 6. Implementation
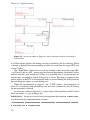
Figure 6.1 Schematics for the light version test rig.
the VN8970 unit are used since the standard outputs cannot supply enough current
for the relays. The outputs are not really relay outputs but rather solid state outputs
controlled by MOSFETs. In practice this means that the supply to the relays has to
be connected to, and through, the VN8970 but since the large power supply feeding the ECU might drop well below 12V during testing another 12VDC source is
needed. For this purpose a standard, wall-socket mounted 230VAC-12VDC transformer is used, capable of delivering ~650mA, enough for the relays consuming
roughly 150mA a piece.
Further two LEDs are implemented so that it is easy to see if any or both relays
are set and also a protection circuit for the acting contact in the relay, see Figure 6.1.
6.2
User application
Background
The purpose of the graphical user application is to create a file containing information to the software that transmits the data from the ECU to the testing software,
CANoe. The file consists mainly of the name, address and length of the variables
which Trace32 is supposed to read via its JTAG interface, but it also contains the IPaddress of the host which runs Trace32 and the path to a file that has to be provided
34
6.2
User application
PumpCurrent
m_ulGradientFixPoint
m_uiPumpCurrentRAWValue
m_lOffsetFixPoint
ClutchPedalPressed m_boClutchPedalPressed
BrakePedalActive m_boBrakesActive
HandBrake m_boHandBrakeActive
CONSTANTS
m_uiTEMP_IN_TABLE
m_uiPCB_RESISTANCE_IN_TABLE
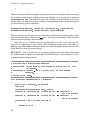
Figure 6.2 Syntax of the file to be loaded in the application.
to Trace32 which specifies the code and variables available on the CPU.
Usage
As a first step a .txt-file has to be manually created which specifies what variables
ioDebug.c actually puts in the different debug frames sent on the CAN-bus. This is
achieved by looking through the source code in ioDebug.c. Most variables are global
and are just copied into the frame, but there are also variables calculated locally in
ioDebug.c which means that in some cases several variables have to be extracted
in order to calculate this value. Therefore the file is to be written according to the
syntax shown in Figure 6.2, depending on whether it is a ”dynamic” or ”indirect”
variable. In the eaxmple PumpCurrent is ”indirect” and calculated from the three,
indented, following variables and e.g. BrakePedalPressed is ”dynamic” and directly revealed in the variable on the same line. The names in the second column
or with indentation are the exact names which are used in the code on the CPU. By
loading this file via the ”Load File” button, see Figure 6.3, the file is read and all
the available variables are shown in the box in the centre of the GUI. Here only the
names in the first column of the file are shown, this is also the exact name of the
system variables specified in the CANoe configuration.
Further, another file has to be loaded via the ”Load Map” button. This file is
created when the code for the CPU is compiled and contains, among others, name,
address and size of all variables in the code. It usually has the extension .map when
created but has the appearance of a standard text file and it is possible to just save it
as a .txt file, which is the format the application needs. When the file is loaded each
line of it is added as an element in a container. Since the map file might be very
large, several thousands of lines in some cases, this might take a few seconds and
during this time any interaction with the application is unavailable or ”grayed out”.
It is through this file the mapping between the name that is shown in the GUI and
the address and size is done, which is vital information when reading the memory
of the CPU via the JTAG debugger.
35
Chapter 6. Implementation
Figure 6.3 The user interface of the application with variable-file loaded and all
available variables shown.
As seen in Figure 6.3 there is a field where the user should state the IP-address
of the host running Trace32. The address is needed by the Trace32 API when connecting to the actual Trace32 application since the API is not running on the same
host as Trace32 but rather on the Vector real-time device. There is also a field where
the user should input the path to the .elf-file containing information about the code
and project on the CPU such as symbols, hardware, etc, needed by Trace32 in order
to use the API functions see Section 2.4.
When clicking the ”Create and Save” button the container holding the information from the Map-file is searched for the variables specified in the first loaded file.
When the container is searched and the variables are found (or not found) the final
file is created and the user is prompted to specify name and place where to save the
file. The user must not change the name from that the application suggests for the
file - ”CANoeUserFileDebugVars.txt” - since this name is used when reading it in a
later stage, see Section 6.3. If not all variables were found the user will be prompted
with this information and suggestions for what the reason might be, spelling error
or wrong map file loaded. The file is still created and the variables not found will be
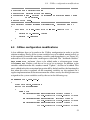
pointed out. If all was found the file is created with the syntax shown in Figure 6.4.
36
6.2
User application
IPADRESS: 169.254.233.80
PATH TO ELF FILE: P:\AKA000\bin\rel\monitor.elf
CONSTANT VARIABLES -------------------------------------------m_uiECU_SWITCH_LOSS_TABLE 00018b3e 00000012
m_uiPCB_RESISTANCE_IN_TABLE 00018b08 00000012
m_uiTEMP_IN_TABLE 00018b50 00000012
INDIRECT VARIABLES -------------------------------------------m_lOffsetFixPoint 400007a0 00000004
m_tModel 400013f8 0000000a
m_uiDutyCycle 40000914 00000002
DYNAMIC VARIABLES --------------------------------------------AYCFFWDistRaw 40000b38 00000002
AccPedalRaw 40000cfa 00000001
CANoe SYSTEM VARIABLES----------------------------------------ABSActive
PumpCurrent
Figure 6.4 Syntax of the file created by the application.
The second and third columns are the address and size of the variable respectively. The names of the dynamic variables are also the names of the system variables specified in CANoe, this is also the case for the names under ”CANoe System
Variables” which are the names of the variables that must be calculated from the
”Indirect variables”. The "Constant variables" are variables that are read just once,
at the beginning of each measurement and later used during the calculations.
Visual Studio project details
For this application the Microsoft Foundation Classes libraries, MFC, were used in
order to get the functionality wanted; the MFC libraries wrap a part of the Windows
API in C++ classes so that an application written behaves as ”standard Windows”.
There is a MFC-project template available to choose when starting a new project in
Visual Studio 2010, however this project is rather ”bloated” from scratch with quite
a bit of code not necessary for this purpose. For details of what is exactly needed in
order to get an empty MFC project running, see Appendix A.
Each object (button, text field, etc) in the interface has a unique ID defined in
the properties for that specific object and is accessible in the code by declaring a
pointer and initialize it with the function GetDlgItem(object_ID), see example
37
Chapter 6. Implementation
below.
CEdit* pVarFilePath = (CEdit*) GetDlgItem(varFilePath);
In order to activate a function when i.e. a button is pressed one have to link it in a
macro function ON_COMMAND(object_ID, function), see below.
ON_COMMAND(But_Save, save)
The above piece links the event of the ”Save” button pressed and the function save
which is declared as a public function in the sub class to ’CDialog’. The functions
in this class have to be declared with afx_msg before the return type, see example
below.
/**************************************************************
* FUNCTION NAME save
* DESCRIPTION Called when button "Save" is pressed. Creates and
*
lets the user specify name and location of file
*
containing chosen variable name, address and size.
* PARAMETERS None
* RETURN VALUE None
**************************************************************/
afx_msg void save()
{
if(varMap.empty())
{
MessageBox(defCstrMapNotLoaded,
defCstrError, MB_ICONERROR);
return;
}
...
}
Program Structure
There are mainly three events that have to be handled when using the application;
when either file (variable- and map-file) is loaded and when the new file is created
and saved. To get a better overview, the following are the important global variables
used for storing the different names, addresses and sizes:
std::map<std::string, std::vector<std::string>> vars;
std::map<std::string, std::string> varMap;
std::set<std::string> sysVars, indirectVars,
dynamicVars, constantVars;
38
6.3
Data extraction/integration dll
When loading the first file, the one revealing name and dependencies of the
different variables, the std::map<...> vars is filled with the name of the system
variable (first column of the file, see Figure 6.2) as key and the dependencies or
the dynamic variable name in a std::vector<std:string> as value. If it is a
”dynamic” variable the string dynamic is added as first element in the vector. All
key values are then added to the ListBox in the center of the GUI, see Figure 6.3,
showing all available variables.
When the map-file is loaded every line of it is added to the std::map<...>
varMap with the first word of the line as key and the rest of it as value. The file is
created in such a way that each key is a name of a variable and the value contains
the address and size. The file might be large, several thousands of lines in some
cases, which is the reason it is added to a std::map which is sorted and has a time
complexity when searching it of O(log(n)). A linear search inside the file for each
variable would take far too long time.
The mapping is done when the ”Create and save” button is pressed; vars is iterated over the elements and each variable in the vector associated to each element
is searched for in the varMap. Depending on type; dynamic, indirect, constant or
system variable name, a string containing name, address and size (just name in the
case of system variable) is added to the corresponding std::set<std::string>.
A stream to a file is then created and each std::set is iterated over creating the
structure seen in Figure 6.4 with the ip-address and path to the elf-file defined in the
corresponding field in the GUI copied to the beginning of the file.
6.3
Data extraction/integration dll
Background
This dll executes the actual transmission of data; extraction from the debugger/Trace32, processing and writing to CANoe - automatically during a measurement. In order to reduce the work load the same debug cases are used by this solution
as used by the debug frames, see Section 2.5.
The implementation of the dll uses the CANoe API, see Section 2.3, and in order
for it to work with CANoe, a number of functions needs to be implemented. First,
a function called by CANoe when the dll is loaded (at the start of a measurement)
has to be implemented otherwise the dll will not function together with CANoe, see
below.
// Called when dll is loaded by CANoe;
// before anything else takes place in a measurement.
void cclOnDllLoad();
Other functions to implement in order to get the functionality synchronised with
what occurs during the measurement in CANoe are for example:
39
Chapter 6. Implementation
// Called just before the actual measurement starts.
void OnMeasurementPreStart();
// Called when the measurement starts.
void OnMeasurementStart();
// Called when the measurement stops.
void OnMeasurementStop();
Besides the above mentioned functions there are also timers available through
the API as well as functions to trigger when certain events have occurred in the
measurement, such as a reset of a system variable etc.
In order to extract the data the Trace32 API, see Section 2.4, is used within the
framework specified by CANoe.
Usage
One of the main goals was to create a solution that is as transparent for the tester
as possible, i.e. he or she should not have to change the work flow by a substantial
amount. However, a few actions have to be taken in order to get the data transmission running within an existing CANoe configuration.
First the dll has to be added in the ’Options-Programming-C libraries’ field of
the configuration of CANoe. This specifies the path to the dll which is loaded and
run by the Vector real-time unit at every measurement start. Furthermore, by the
way the dll is implemented it reads information from two files, one specified by
the graphical user application described in Section 6.2 and another on specifying
what variables exists in each debug case, see example in Figure 2.7, named ”CANoeUserFileDebugCase.txt”. For the dll to be able to access these files, since it is
executed on the real time device, they have to be loaded onto the real time device as
well. This is possible through ’Options-Extensions-User Files’ where the files then
are loaded to a pre-defined location on the real time device’s storage area at every
measurement start, making it possible to access them from the dll.
Visual Studio project details
In order to create a dll that is to be used by CANoe the Visual Studio project has to
be created as described in the following section. The foundation is an empty Win32
project with ’application type’ selected as ’DLL’. In the compiler settings ’Precompiler headers’ has to be deactivated and the file CCL.def (provided by CANoe as a
part of the API) has to be specified as a ’Module Definition File’.
In order to get the Trace32 API to compile, ws2_32.lib has to be added in
’Additional Dependencies’ under ’Linker Input’.
Finally it is just a matter of including the header and source files of both API’s in
the project and later on build the ’Release’ version of the project, i.e. not the ’Debug’
40
6.3
Data extraction/integration dll
INIT
KL15/30
Debug case
Read/Write
STOP
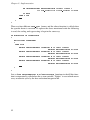
Figure 6.5 The flow of the data extraction/integration application. The dashed lines
represents interrupt-like events.
version since that adds debug information to the build and makes it impossible to
use for CANoe.
Program Structure
First a brief overview of the program will be described followed by a more detailed
description of each part.
Overview A concise chart over the flow during a measurement is shown in Figure
6.5. At the start of each measurement - the ”INIT”-block - a number of initialisations are done; the files loaded via ’User-Files’ in CANoe are read and processed,
a connection with Trace32 over Ethernet is established and the ID number of each
system variable to write to CANoe is retrieved.
One measurement may comprise several sub-tests which are started manually
- or automatically - a while after the main measurement is started, it is therefore
unnecessary to start the reading/writing of data before the actual test starts. This
is taken care of in the ”KL15/30”-block by listening on two system variables in
CANoe telling if KL15 and/or KL30 is high or low (see Section 2.5 for an exlanation
of the functionality of KL15 and KL30), that is, if either is low the reading/writing
is halted and then started again when both are high.
The ”Read/Write”-block may start to loop with just KL15 and KL30 high but
nothing of essence will actually be performed until a debug case has been specified
by CANoe. Just as in the ”KL15/30”-block the dll observes a certain system variable
41
Chapter 6. Implementation
Figure 6.6 Overview similar to Figure 6.5 where functions called in each block is
shown in red.
in CANoe which specifies the debug case that is needed by the test running. When
a change is detected the corresponding variables are read from the target CPU and
sent to CANoe.
The ”Read/Write”-block takes care of the reading of data from the target CPU
- via Trace32 and its API -, processing the data and performing calculations of the
indirect variables and writing to CANoe. It is repeated after a certain amount of
milliseconds according to which debug case is active. The loop is stopped if the
power supply to the ECU is disconnected and it is paused during the short period of
time the program adjusts to a new debug case.
When the measurement is stopped - the ”STOP”-block - the connection to
Trace32 is terminated and all memory that has been allocated by the dll during
the measurement is deleted.
An overview similar to Figure 6.5 - where some of the functions called in each
block are shown - is seen in Figure 6.6.
Initialisation At the very start of every measurement the function cclOnDllLoad
is called, below the implementation is shown.
/**************************************************************
* FUNCTION NAME cclOnDllLoad
42
6.3
Data extraction/integration dll
* DESCRIPTION Called when the DLL is loaded. Initialises event
*
routines.
* PARAMETERS None.
* RETURN VALUE None.
**************************************************************/
void cclOnDllLoad()
{
cclSetMeasurementPreStartHandler(&OnMeasurementPreStart);
cclSetMeasurementStartHandler(&OnMeasurementStart);
cclSetMeasurementStopHandler(&OnMeasurementStop);
}
What the function does is essentially telling what functions to run just before the
measurement starts, when it actually starts and when it stops. The initialisation is
done by the function OnMeasurementPreStart, see below.
/**************************************************************
* FUNCTION NAME OnMeasurementPreStart
* DESCRIPTION Called right before a measurement starts.
*
Initialises event routines for timers and
*
system variable reset.
* PARAMETERS None.
* RETURN VALUE None.
**************************************************************/
void OnMeasurementPreStart()
{
iTimerID1 = cclTimerCreate(&OnTimer1);
iTimerID2 = cclTimerCreate(&OnTimer2);
initOK = onMPreStart();
if(findFeedBackVarsID(&iKL15ID, &iKL30ID,
&debugCaseID) >= 0)
{
cclSysVarSetHandler(iKL15ID, &onKL15Update);
cclSysVarSetHandler(iKL30ID, &onKL30Update);
cclSysVarSetHandler(debugCaseID, &onDebugCaseUpdate);
}
}
As the description of the function tells, the function initialises event routines for
timers and system variable reset. This means that when the timer is started and later
expires, the function referenced as an argument to the create function is run. In a
similar way the function referenced to in cclSysVarSetHandler is run when the
system variable with the corresponding ID is reset in CANoe, hence the interruptlike behaviour. The ID of the ’feedback’ variables (called so for the reason that
43
Chapter 6. Implementation
these three tell the dll that something has happened in CANoe during the measurement) are fetched in findFeedBackVarsID through the use of the function
cclSysVarGetID(char* variableName) where the name of the variable has to
match the exact name specified in ’System variables’ in CANoe, see Section 6.4. If
the variable is not found an error value will be returned.
The function onMPreStart reads and processes the files loaded through ’User
Files’ and adds all the variables to the following global containers,
std::map<std::string, varInfo*> constVars, indirectVarsAll,
dynamicVarsAll;
std::map<std::string, CANoeVarInfo*> CANoeSysVarsAll;
std::set<std::string> case241Vars, case242Vars, case243Vars,
case244Vars, case250Vars;
where varInfo and CANoeVarInfo are structures defined as follows:
struct varInfo {
uint32_t adress;
int size;
uint8_t* data;
};
struct CANoeVarInfo{
int ID;
int32_t data;
};
The address and size of the variables are found directly in the file created by the
graphical user application, see Section 6.2. The ID’s, however, must be fetched in
the way described above. Apart from the variables found in the file another one is
added by default called ”Update”. This one is needed by CANoe in order to update
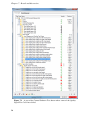
all of the other variables, see Section Process and Calculate below.
Help to the user is provided in the way that if either file is inaccessible a help
text will be shown in the write window in CANoe as well as if the user created the
file in the graphical user application with error, i.e. not all variables found, the user
will be informed.
Besides the processing of the files onMPreStart also establishes a connection
with Trace32 with information received from the file specifying the IP-address of
the user’s PC and the path to the .elf-file. The initialisation is basically shown below,
all error handling and return statements are omitted.
/**************************************************************
* FUNCTION NAME Init_Trace32
44
6.3
Data extraction/integration dll
* DESCRIPTION Initializes connection with the Trace32
*
application.
* PARAMETERS IP, elfPath - strings containing IP address of
*
host running the T32 application and full path to
*
elf-file.
* RETURN VALUE EXIT_SUCCESS if connection established
*
successfully.
*
EXIT_FAILURE otherwise.
**************************************************************/
int Init_Trace32( std::string IP, std::string elfPath )
{
T32_Config("NODE=", IP.c_str());
T32_Config("PACKLEN=", "1024");
T32_Config("PORT=", "20000");
T32_Init();
T32_Attach(T32_DEV_ICD); //Attaches the specific debugger
T32_Cmd("data.load.elf" + elfPath.c_str());
}
If the files were read successfully and the connection to Trace32 was established
onMPreStart returns true and the rest of the program is given the clear to go.
Debug Case When an update of the system variable occurs the following function
is called.
/**************************************************************
* FUNCTION NAME onDebugCaseUpdate
* DESCRIPTION Called when the system variable containing debug
*
case changes.
* PARAMETERS time - current time of the measurement.
*
sysVarID - System Variable ID.
* RETURN VALUE None.
**************************************************************/
void onDebugCaseUpdate(long long time, int sysVarID)
{
static int preCase;
cclSysVarGetInteger(sysVarID, &debugCase);
if(debugCase != preCase)
{
cclTimerCancel(iTimerID1);
cclPrintf("Current debug case: %i", debugCase);
delay = debugCaseChanged(debugCase);
cclTimerSet(iTimerID1, cclTimeMilliseconds(20));
preCase = debugCase;
45
Chapter 6. Implementation
}
}
When it is detected that an update in debug case has occurred the timer governing
the read/write functions is halted and the new debug case is passed to the function
debugCaseChanged. This function clears all variables from the debug case active
before from, and adds the correct variables corresponding to the current debug case
to, the following global containers.
std::map<std::string, varInfo*> indirectVars, dynamicVars;
std::map<std::string, CANoeVarInfo*> CANoeSysVars;
These containers are the ones that are iterated over during the read/write phase. The
ones mentioned above, ending with ...All are always containing all the variables
and are constant during a measurement.
Since the test in CANoe may be implemented in such a way that the debug case is updated on a cyclic basis, even though the actual case is the same, a
static int preCase is defined to make sure that the update in the dll is run only
when there has been an actual change.
KL15 KL30 Just as in the case of an update of debug case two special functions
are called when an update of either KL15 or KL30 occurs. These functions call a
common function shown below.
/**************************************************************
* FUNCTION NAME startStopDataReading
* DESCRIPTION Called when either system variable KL15 or KL30
*
is changed.
* PARAMETERS sysVarID - ID of either KL15 or KL30 system
*
variable.
* RETURN VALUE None.
**************************************************************/
void startStopDataReading(int sysVarID)
{
static long pre15Val, pre30Val;
long val;
cclSysVarGetInteger(sysVarID, &val);
pre15Val = (sysVarID == iKL15ID && val != pre15Val) ?
val : pre15Val;
pre30Val = (sysVarID == iKL30ID && val != pre30Val) ?
val : pre30Val;
if(pre15Val == 1 && pre30Val == 1)
{
systemUp = 1;
46
6.3
Data extraction/integration dll
cclTimerSet(iTimerID2, cclTimeMilliseconds(10));
cclPrintf("LauterBach reading started");
}
}
else
{
systemUp = 0;
cclPrintf("LauterBach reading paused");
}
The essential feature of the function above is the flag systemUp which is a global
variable passed to the function responsible for the read/write loop telling if the system is up and running. After detecting that the ECU is fully powered up a second
timer is set in order to start the actual execution by a couple of Trace32 commands,
see below, error handling omitted.
/**************************************************************
* FUNCTION NAME onTimer2
* DESCRIPTION Called when Timer2 expires; just after it is
*
detected that the ECU is powered up.
* PARAMETERS iInitOK - parameter telling if initialisation is
*
done successfully.
* RETURN VALUE None.
**************************************************************/
void onTimer2( int iInitOK )
{
if( !iInitOK )
{
return;
}
T32_Cmd("System.up");
T32_Cmd("Go");
readConstantVars();
}
The calling of the function reading the constant variables is done here since it is not
necessary to read these at every Read/Write-loop, see below.
Read/write loop The timer called on a cyclic basis, calling the function responsible for reading, calculating and writing - onTimer1 - is shown below.
/**************************************************************
* FUNCTION NAME OnTimer1
47
Chapter 6. Implementation
* DESCRIPTION Called when Timer1 expires.
* PARAMETERS time - current time of the measurement.
* timerID - timer ID.
* RETURN VALUE None.
**************************************************************/
void OnTimer1( long long time, int timerID )
{
if( initOK )
{
onTimer1(systemUp);
cclTimerSet(timerID, cclTimeMilliseconds(delay));
}
}
If the initialisation was done successfully onTimer1 is called and the timer resets itself with the time determined by what debug case is active. The details of
onTimer1 are described in the following topics.
Read The reading of the target CPU memory is done by calling a function in the
Trace32 API; T32_ReadMemory. By calling the following function with each of the
containers indirectVars and dynamicVars as parameters once per cycle, all the
current variables are read and stored.
/**************************************************************
* FUNCTION NAME readVars
* DESCRIPTION Reads memory of target from Trace32.
* PARAMETERS *map - pointer to container with stored variables.
* RETURN VALUE EXIT_SUCCESS if all variables successfully read.
*
EXIT_FAILURE if one variable unsuccessfully
*
read.
**************************************************************/
int readVars( std::map<std::string, varInfo*> *map )
{
varInfo* vI;
for( auto it = map->begin(); it != map->end(); ++it )
{
vI = it->second;
if( T32_ReadMemory(vI->adress, 0x40,
vI->data, vI->size) != 0 )
{
cclPrintf("Failed to read memory at: %x",
vI->adress);
48
6.3
}
}
Data extraction/integration dll
return EXIT_FAILURE;
}
return EXIT_SUCCESS;
Process and Calculate After all the data has been read from the target CPU some
processing and calculation has to be done. Firstly, the data gathered from the CPU
is stored in a 8-bit array, see the varInfo struct further above, the value that is to
be written to CANoe is a long which is why all the dynamic variables can directly
be assembled to a long, see below.
/**************************************************************
* FUNCTION NAME assembleInt
* DESCRIPTION Assembles 8-bit data to 16, 24 or 32 bit data.
* PARAMETERS vI - struct containing 8-bit data.
* RETURN VALUE Assembled value.
**************************************************************/
long assembleInt( varInfo* vI )
{
int sz;
sz = vI->size;
long tmp = 0;
for(int i = 0; i < sz; ++i)
{
tmp |= vI->data[sz-i-1] << (i*8);
}
return tmp;
}
The assembled values are then stored in the container CANoeSysVars which is iterated over when writing to CANoe. The variable ”Update” is assigned each loop as
Update++ in order to trig a function in CANoe, see Section 6.4.
Furthermore, a number of calculations have to be done to calculate the variables that are not directly accessible in the memory of the target CPU. All of the
variables needed in order to perform the calculations are stored in the container
indirectVars and the actual functions performing the calculations are more or
less copied from the source code on the target CPU. A streamlined ”calculations”
header file (not all functions shown) can be seen in Appendix B. Several of the functions take a reference to the whole indirectVars container as a parameter and sort
out which values in it that are necessary for that specific calculation. When all the
calculations are done, the final values are stored in CANoeSysVars together with
the dynamic variables.
49
Chapter 6. Implementation
Write After the processing and calculation CANoeSysVars contains all the values
that are to be sent to CANoe. This is done as the final part of onTimer1 and in a
similar way to when the memory is read from the target CPU, see below.
for( auto it = CANoeSysVars.begin();
it != CANoeSysVars.end(); ++it )
{
returnVal = cclSysVarSetInteger(it->second->ID,
it->second->data);
if( returnVal != CCL_SUCCESS )
{
cclPrintf("cclSysVarSetInteger with ID %i failed with
error %i", it->second->ID, returnVal);
}
}
Stop When the measurement is stopped the following function is called which
stops the execution of the CPU, deletes allocated memory, and terminates the connection to Trace32:
/**************************************************************
* FUNCTION NAME onMStop
* DESCRIPTION Called on measurement stops. Terminates
*
connection with Trace32, deletes allocated
*
memory.
* PARAMETERS None.
* RETURN VALUE None.
**************************************************************/
void onMStop(){
T32_Cmd("Break");
T32_Cmd("System.down");
deleteAllocMem(&constVars);
deleteAllocMem(&indirectVarsAll);
deleteAllocMem(&dynamicVarsAll);
for(auto it = CANoeSysVarsAll.begin();
it != CANoeSysVarsAll.end(); ++it)
{
delete it->second;
}
T32_Exit();
cclWrite("Connection with Trace32 terminated.");
}
where the following function is used:
50
6.4
CANoe configuration modifications
/**************************************************************
* FUNCTION NAME deleteAllocMem
* DESCRIPTION Deletes allocated memory.
* PARAMETERS *map - pointer to std::map containing memory area
*
to be deleted.
* RETURN VALUE None.
**************************************************************/
void deleteAllocMem( std::map<std::string, varInfo*> *map )
{
for( auto it = map->begin(); it != map->end(); ++it )
{
delete[] it->second->data;
delete it->second;
}
}
6.4
CANoe configuration modifications
A few additions have to be made to the CANoe configuration in order to get the
solution working. Firstly all the system variables have to be added, named exactly as
in the manually created file containing variables and dependencies, see Figure 6.2,
and each has to be created under a namespace called T32. The ”feedback variables”
(debugCase, KL15 and KL30) have to be added under a sub-namespace in T32
called Feedback. Further, each has to be set to be an integer. In addition to the
variables added from the file, another, named ”Update”, also has to be added. This
one is added in the data extraction/integration dll by default and has the functionality
that when this value is updated, all the remaining variables are also updated. In a
regular implementation of the measurement the values sent by the debug frames are
assigned to the system variables used by the test in the following way.
on message CAN1.INFO_CTRL_3
{
float fHighByte,fLowByte;
switch (bDevFrameCase)
{
case 241:
@sysvar::CSWTest::fFLWheelVel=(float) ((word)
((this.byte(1)<<8)+this.byte(0)))/512;
@sysvar::CSWTest::fFRWheelVel =(float) ((word)
((this.byte(3)<<8)+this.byte(2)))/512;
@sysvar::CSWTest::fRLWheelVel=(float) ((word)
((this.byte(5)<<8)+this.byte(4)))/512;
51
Chapter 6. Implementation
}
}
@sysvar::CSWTest::fRRWheelVel=(float) ((word)
((this.byte(7)<<8)+this.byte(6)))/512;
break;
case 242:
...
There are four different INFO_CTRL frames and the above function is called when
the specific frame is received. To replace the above mentioned code the following
is used, the scaling and type casting is kept in the same way.
on sysvarUpdate T32::Update
{
switch(bDevFrameCase)
{
case 241:
@sysvar::CSWTest::fFLWheelVel = (float) ((word)
@sysvar::T32::FLVelRaw)/512;
@sysvar::CSWTest::fFRWheelVel = (float) ((word)
@sysvar::T32::FRVelRaw)/512;
@sysvar::CSWTest::fRLWheelVel = (float) ((word)
@sysvar::T32::RLVelRaw)/512;
@sysvar::CSWTest::fRRWheelVel = (float) ((word)
@sysvar::T32::RRVelRaw)/512;
...
}
}
Just as the onDebugCaseUpdate and onKL15Update functions in the dll this function is automatically called when the system variable ”Update” is reset which occurs
every read/write cycle by the data extraction/integration dll.
52
7
Result and discussion
This chapter will present and discuss the result of the thesis. First a section explaining how the concept of integrating data read from the target CPU by JTAG in
CANoe works in practice, followed by a section explaining how the software test of
the ECU works with this solution.
7.1
Concept
The data extracted from the target CPU via its JTAG interface is provided to CANoe
by a dll - created in Visual Studio 2010, written in C++ - using the CANoe and
Trace32 API:s loaded as a ’C-library’ in CANoe. To incorporate this solution in an
existing CANoe configuration the user has to follow the work flow below.
• Manually create a txt-file containing debug variables and dependencies, see
Figure 6.2.
• Create a file defining what variables exist in which debug case, see Figure
2.7, named ”CANoeUserFileDebugCase.txt”.
• Use the graphical user application, see Section 6.2, in order to create the file
with the variables with associated address and size. Use default file name ”CANoeUserFileDebugVars.txt”.
• Load the newly created file together with the debug case file in ’User Files’
in CANoe configuration options.
• Load the dll in ’C-libraries’ in CANoe configuration options.
• Add the system variables defined in the first file in the CANoe configuration
under the namespace T32 and the feedback system variables, see Section 6.4,
in a sub namespace to T32 called Feedback.
53
Chapter 7. Result and discussion
• Add a function on sysvarUpdate T32::Update to the test code in which
the created system variables are updated and also assign the feedback variables on appropriate locations in the code, see Section 6.4.
• Start Trace32.
• Start the measurement.
The variables are updated in CANoe cyclically with a period depending on debug case, see Section 6.3. It was proven that the update frequency had to be adjusted
according to how many variables there are in each debug case, trying to run the same
frequency in a debug case with 26 variables as one with 7 generated an error during
the measurement. The error given tells the information that ”Real time event processing was interrupted at simulation time <t>. Events may be lost!” and that the
cause basically is that the work load of real time system is too high and that the
remedy is to reduce it. The repetition period of each debug case is shown in Table
7.1 and by using these periods the error is suppressed.
Table 7.1
Update period of each debug case.
Debug Case
241
242
243
244
250
# variables
26
12
17
9
7
period [ms]
80
40
40
20
20
The time it takes to read a single, 1-byte, variable was evaluated in order to see
in which region the bandwidth of the transmitted data was. The measurement was
done using a MSDN function called QueryPerformanceCounter in the readVars
function, see Section 6.3 - Read, as follows.
QueryPerformanceCounter(&start);
retVal = T32_ReadMemory(vI->adress, 0x40, vI->data, vI->size);
QueryPerformanceCounter(&finish);
By evaluating start and finish it was shown that reading a single variable took
roughly around 1 ms. This together with the fact that the update periods for the
different debug cases need a certain amount of time in order to avoid an error, means
that there is an obvious limitation in speed. Attempts to try to decrease this time has
been taken without any major improvement such as increasing the JTAG interface
clock and also halting the execution of the ECU when reading the memory. The
former made no noticeable difference telling us that the bottleneck most likely is
not the actual JTAG interface, the latter made a small difference - approximately
54
7.2
The test
0.1 ms - for the better. However, halting the ECU during a measurement is not a
feasible option since this will have a too great effect on the real time properties.
An option could be to read a larger amount of data each loop, since the JTAG
does not seem to be the bottleneck, and sort out the different variables locally in
the dll. There is, however, a problem with this approach as well, since the data of
interest is spread out over an area of roughly 1.5 kB in the memory.
In order to try and locate where the time is consumed an attempt was done
by installing the Trace32 application on to the Vector real time device; the VTsystem more specifically since the VN8970 does not support remote desktop. It was
possible to install the application and drivers for the Lauterbach hardware on to the
real time system and it is therefore possible to run the solution entirely stand alone
since the debugger then is connected to the VT-system; the user PC does not do any
of the real time tasks. However, the time of reading the memory of the target CPU
was not shortened by a noticeable amount.
7.2
The test
The test performed on the ECU - with the application software on board, see Section
2.5 - was a test of the control software where the debug variables were extracted
from the CPU via JTAG and integrated from Trace32 in CANoe. The test consists
of several sub-tests where, for example, a certain variable or couple of variables
are tested so that it behaves as it should and it was proven that roughly 12% of the
sub-tests were able to pass. Some of the tests does not always pass when tested the
conventional way with monitor software on the ECU, which is why these specific
tests are somewhat disregarded when evaluating the validity of this solution.
There are, however, tests that consistently fails when using this solution, for example some of the ”Quality Signal Test Cases”, see Figure 7.1. These tests have in
common a number of boolean variables that appear to fluctuate rather randomly between true and false during some phases of the tests. This behaviour is inconsistent
when comparing with performing the tests the conventional way. Some research led
to the conclusion that the cause of this behaviour lies in the nature of how the fault
control of these variables is implemented in the software of the ECU. To give an example one of the variables is called boAllWheelSpeedsOK which is a quality flag
of all the wheel speeds and the flow of the fault control is basically implemented as
follows.
• Read wheel speeds
• Set boAllWheelSpeedsOK to true.
• Fault control of the wheel speeds, set boAllWheelSpeedsOK to false if fault
detected.
55
Chapter 7. Result and discussion
Figure 7.1 A part of the Control Software Test shown where some of the Quality
Signal Test Cases have failed.
56
7.2
The test
• boAllWheelSpeedsOK used elsewhere in code, for example assigned to a
debug frame.
• Repeat.
As long as there is no fault the variable is read as true at all times; no issues. The
problem presents itself when there is a fault and boAllWheelSpeedsOK is set to
false; as long as there is a fault present the read value of the quality flag will fluctuate
between true and false since this solution reads the memory asynchronously with
the execution of the CPU. (The monitor software uses the same variable but only
when it is valid.) This is a serious problem that presented itself in the final stages
of the thesis work period due to the lack of depth in the study of the software when
studying current system and solutions.
Attempts to implement a kind of filter looking for a trend in the signal have been
tried with some success, without it almost every Quality Signal Test Case in Figure
7.1 would have failed. It is implemented in such a way that when the signal has
gone low for one sample a further 5 consecutive samples of the high state have to be
recorded in order to actually set the variable high in the dll. This of course reduces
the bandwidth of those signals and it is still very possible to sample more than 5
high states even though the signal after fault control is low. Therefore this approach
is considered not to be a viable option.
Further possible ways of solving this problem - that not have been tried - are
discussed in Chapter 8.
57
8
Conclusion and Further
Work
In retrospect we can conclude that the concept is proven; it is possible to use an
external device, such as a Lauterbach debugger, to read data from the target CPU
and integrate it in CANoe. This means that it is possible to perform the software
tests on an ECU that is identical - from a software point of view - to the customer
product. Diversities that may be encountered when building the ”test specific software” (monitor software, see Section 2.5) are therefore eliminated. The drawback is
that some hardware modifications have to be done to the ECU, namely a connector
has to be fitted and connected to the PCB in order to make the - in this specific case
- JTAG interface accessible from outside the ECU, see Figure 2.6.
The reading of the memory is limited in a time sense, a reading takes somewhere
around 1 ms when reading one byte of data. Together with the fact that CANoe
throws an error when writing to its system variables too often, see Section 7.1,
means that this solution provides the data to CANoe slower than when performing
the tests the conventional way. However, the control software test which this work
is focused on is not extremely sensitive in a timing sense which is why the solution
still works - apart from the challenge discussed in Section 7.1.
The overall conclusion is that, yes, it is possible to perform software tests on
an ECU with customer software without degrading the performance more than the
monitor software does but in order to get all sub tests to pass it is most likely that
some modifications have to be done to the software either way.
The future work should focus on investigating possible solutions to the problem
discussed in Section 7.1. To solve this problem some synchronisation between the
reading of memory and execution of the CPU has to be established. One way could
be to declare one or several variables in the software telling ”It is now okay to read
variables XX and YY”. This comes with some further challenges; first, to declare
new variables in the software is not preferable - the aim was to be able to run the
tests on pure application builds. Second, since the CPU runs most of its cycles with
58
Chapter 8. Conclusion and Further Work
a period of 10 or 20 ms, it is of essence that the extraction of data during this
period when it is okay to read is rapid; the variables will not be okay to read for a
large amount of time of these 10 or 20 ms. With the equipment available this is a
substantial challenge to overcome since the polling of the ”Okay to read” variable
alone takes around 1 ms. This will most likely lead to that other equipment will be
considered; equipment that is capable of faster reading of the memory.
One approach that may be investigated is if there is a possibility to synchronise
the CPU and debugger by hardware. The Lauterbach debugger comprises an input
”TRIG” which by default is able to halt the execution of the CPU when a positive
transition is sensed. There may be possibilities to configure the input in such a
way that another, or group of, command(s) are executed when it is trigged, such as
reading memory. This approach eliminates the need of an ”Okay to read” variable,
hence, possibly making the procedure faster since polling of this variable no longer
would be necessary. This approach would need further modification of the ECU; a
connection from the ECU to connect to the trigger input of the debugger and most
likely also some software modifications.
If the synchronisation challenge is solved this method opens up several new
possibilities from a test perspective. For example it becomes easy to expand the test
cases and read new variables and data from the CPU since no software alterations
have to be done to the CPU. As a result this method is not limited to tests of the
control software but also capable of testing every other part of the software.
59
Bibliography
[1]
API for Remote Control and JTAG Access. URL: http : / / www2 .
lauterbach.com/pdf/api_remote.pdf (visited on 05/19/2014).
[2]
J. Barlage, D. Bruder, V. Jones, E. Nielsen, T. Perttola, and L. Pritchard. AllWheel Drive. BorgWarner Inc., 2009.
[3]
CAN history. URL: http://www.can-cia.de/index.php?id=161#c137
(visited on 02/04/2014).
[4]
CAN message. URL: http://www.kvaser.com/en/about- can/thecan-protocol/17.html (visited on 02/04/2014).
[5]
CANoe.XCP Read and Write Access on Memory Addresses in the ECU. URL:
https://vector.com/vi_canoe_xcp_en.html (visited on 05/19/2014).
[6]
ECU Development and Test with CANoe. URL: http://vector.com/vi_
canoe_en.html (visited on 05/16/2014).
[7]
Jtag technical guide. URL: http : / / www . xjtag . com / support - jtag /
jtag-technical-guide.php (visited on 03/25/2014).
[8]
Modular Test Hardware: VT System. URL: http://vector.com/vi_vtsystem_en.html (visited on 05/16/2014).
[9]
Programming with CAPL. URL: http : / / vector . com / portal /
medien / vector _ cantech / faq / ProgrammingWithCAPL . pdf (visited
on 05/16/2014).
M. Åkesson. Software Test Strategy. BorgWarner Internal Documentation,
2014.
Standard Test Access Port and Boundary Scan Architecture. IEEE 1149.12001, 2008.
Trace32 In-Circuit debugger. URL: http : / / www . lauterbach . com /
tutorial.pdf (visited on 05/16/2014).
Visual Studio 2010. URL: http : / / msdn . microsoft . com / en - us /
library/dd831853(v=vs.100).aspx (visited on 05/16/2014).
[10]
[11]
[12]
[13]
60
Bibliography
[14]
VN8900 - Modular FlexRay/CAN/LIN/J1708/K-Line Network Interface with
up to 8 Channels. URL: http : / / vector . com / vi _ vn8900 _ en . html
(visited on 05/16/2014).
61
A
Essentials of Visual Studio
MFC project
A Win32 project is created and in ’Application settings’, ’Empty project’ is chosen.
To use the MFC library in an empty project one has to change the project settings
under ’Configuration Properties-General-Use of MFC’ to ’Use MFC in a static library’.
Two classes are then needed in order to get the application running, one that
inherits from ’CDialog’ and one that inherits from ’CWinApp’.
#include <afxwin.h>
#include "resource.h"
/* --- Global pointers to objects in the interface are
declared here, see example below --- */
CEdit * pVarFilePath;
class GUI_FORM : public CDialog
{
public:
GUI_FORM(CWnd* pParent = NULL): CDialog(GUI_FORM::IDD,
pParent)
{
}
enum{IDD = INTERFACE1};
protected:
virtual void DoDataExchange(CDataExchange* pDX)
{
CDialog::DoDataExchange(pDX);
}
virtual BOOL OnInitDialog()
{
62
Appendix A. Essentials of Visual Studio MFC project
CDialog::OnInitDialog();
/* --- Pointers to all objects in the
interface are initialized here on the form
(type cast to correct type) GetDlgItem(ID_of_object),
see example below --- */
pVarFilePath = (CEdit*) GetDlgItem(varFilePath);
}
public:
/* --- User defined functions on the form
''afx_msg void functionName()'', see example below --- */
afx_msg void loadVars()
{
pListBoxIn->ResetContent();
CFileDialog dlgFile(TRUE);
dlgFile.DoModal();
CString path = dlgFile.GetPathName();
pVarFilePath->SetWindowTextW(path);
addVarsToListBoxInAndMap(path);
}
DECLARE_MESSAGE_MAP()
};
class TheGUI : public CWinApp
{
public:
TheGUI() { }
public:
virtual BOOL InitInstance()
{
CWinApp::InitInstance();
GUI_FORM dlg;
m_pMainWnd = &dlg;
INT_PTR nResponse = dlg.DoModal();
return FALSE;
}
};
BEGIN_MESSAGE_MAP(GUI_FORM, CDialog)
/* --- Links an event in the interface with a public
function declared in GUI_FORM on the form
''ON_COMMAND(ID_of_object, function)'',
see example below --- */
ON_COMMAND(But_LoadVars, loadVars)
63
Appendix A. Essentials of Visual Studio MFC project
END_MESSAGE_MAP()
TheGUI theApplication; /* --- Creats an instance of 'TheGUI'
and starts the application --- */
64
B
Selection from
calculations.h
/**************************************************************
* FUNCTION NAME iMathMul
* DESCRIPTION Multiplies iMul1 and iMul2.
* PARAMETERS iMul1, iMul2 - factors.
* RETURN VALUE iMul1 * iMul2
**************************************************************/
long lMathMul(int iMul1, int iMul2);
/**************************************************************
* FUNCTION NAME iMathDiv
* DESCRIPTION Divides iNum by iDem.
* PARAMETERS iNum, iDem - Numerator, Denominator.
* RETURN VALUE iNum / iDem.
**************************************************************/
long lMathDiv(int iNum, int iDem);
/**************************************************************
* FUNCTION NAME iGetKL30Value
* DESCRIPTION Calculates KL30 voltage.
* PARAMETERS iKL30RawValue - raw value.
* RETURN VALUE KL30 voltage.
**************************************************************/
int iGetKL30Value(int iKL30RawValue);
/**************************************************************
* FUNCTION NAME iGetPumpCurrent
* DESCRIPTION Calculates pumpcurrent when raw value NOT
*
already defined.
65
Appendix B. Selection from calculations.h
* PARAMETERS *vars - pointer to std::map containing variables.
* RETURN VALUE Pumpcurrent in mA if successfully calculated.
*
0 otherwise.
**************************************************************/
int iGetPumpCurrent(std::map<std::string, varInfo*> *vars);
/**************************************************************
* FUNCTION NAME iGetPmpVoltage
* DESCRIPTION Calculates Pump voltage.
* PARAMETERS *vars - pointer to std::map containing variables.
* RETURN VALUE Pump voltage in mV.
**************************************************************/
int iGetPmpVoltage(std::map<std::string, varInfo*> *vars);
66
Lund University
Department of Automatic Control
Box 118
SE-221 00 Lund Sweden
Document name
MASTER´S THESIS
Date of issue
June 2014
Document Number
ISRN LUTFD2/TFRT--5945--SE
Author(s)
Supervisor
Anton Karlsson
Mattias Wozniak, BorgWarner AB
Anders Nilsson, Dept. of Automatic Control, Lund
University, Sweden
Karl-Erik Årzén, Dept. of Automatic Control, Lund
University, Sweden (examiner)
Sponsoring organization
Title and subtitle
JTAG-optimisation for CANoe
Abstract
This master thesis investigates the possibilities to perform software validation tests on ECUs with
customer-identical software. Instead of using a ”test specific” software which sends ”test specific”
information on the CAN-bus this data is to be extracted from the target CPU by a JTAG debugger and
integrated in the testing software CANoe. The benefit of this method is that it eliminates the problems
that may be encountered during building of the ”test specific” software and that may affect other parts
of the software.
The work has been done at BorgWarner in Landskrona at the TTT-SW (software test) department.
Keywords
Classification system and/or index terms (if any)
Supplementary bibliographical information
ISSN and key title
ISBN
0280-5316
Language
Number of pages
English
1-66
Security classification
http://www.control.lth.se/publications/
Recipient’s notes