1
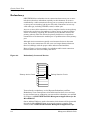
®
MicroMMAC-E
Management Module Guide
Notice
Cabletron Systems reserves the right to make changes in speciÞcations and other information
contained in this document without prior notice. The reader should in all cases consult Cabletron
Systems to determine whether any such changes have been made.
The hardware, Þrmware, or software described in this manual is subject to change without notice.
IN NO EVENT SHALL CABLETRON SYSTEMS BE LIABLE FOR ANY INCIDENTAL,
INDIRECT, SPECIAL, OR CONSEQUENTIAL DAMAGES WHATSOEVER (INCLUDING BUT
NOT LIMITED TO LOST PROFITS) ARISING OUT OF OR RELATED TO THIS MANUAL OR
THE INFORMATION CONTAINED IN IT, EVEN IF CABLETRON SYSTEMS HAS BEEN
ADVISED OF, KNOWN, OR SHOULD HAVE KNOWN, THE POSSIBILITY OF SUCH
DAMAGES.
Virus Disclaimer
Cabletron has tested its software with current virus checking technologies. However, because no
anti-virus system is 100% reliable, we strongly caution you to write protect and then verify that
the Licensed Software, prior to installing it, is virus-free with an anti-virus system in which you
have conÞdence.
Cabletron Systems makes no representations or warranties to the effect that the Licensed
Software is virus-free.
Copyright © April 1998, by Cabletron Systems, Inc. All rights reserved.
Printed in the United States of America.
Order Number: 9031124 E4
Cabletron Systems, Inc.
P.O. Box 5005
Rochester, NH 03866-5005
SPECTRUM, the SPECTRUM IMT/VNM logo, DCM, IMT, and VNM are registered
trademarks, and SpectroGRAPH, SpectroSERVER, Inductive Modeling Technology,
Device Communications Manager, and Virtual Network Machine are trademarks of
Cabletron Systems, Inc.
C++ is a trademark of American Telephone and Telegraph, Inc.
UNIX is a trademark of UNIX System Laboratories, Inc.
OSF/Motif and Motif are trademarks of the Open Software Foundation, Inc.
X Window System is a trademark of X Consortium, Inc.
Ethernet is a trademark of Xerox Corporation.
9031124 E4
i
Restricted Rights Notice
(Applicable to licenses to the United States Government only.)
1. Use, duplication, or disclosure by the Government is subject to restrictions as set forth in
subparagraph (c) (1) (ii) of the Rights in Technical Data and Computer Software clause at
DFARS 252.227-7013.
Cabletron Systems, Inc., 35 Industrial Way, Rochester, New Hampshire 03866-5005.
2. (a) This computer software is submitted with restricted rights. It may not be used,
reproduced, or disclosed by the Government except as provided in paragraph (b) of this
Notice or as otherwise expressly stated in the contract.
(b) This computer software may be:
(c)
(1)
Used or copied for use in or with the computer or computers for which it was
acquired, including use at any Government installation to which such computer or
computers may be transferred;
(2)
Used or copied for use in a backup computer if any computer for which it was
acquired is inoperative;
(3)
Reproduced for safekeeping (archives) or backup purposes;
(4)
Modified, adapted, or combined with other computer software, provided that the
modified, combined, or adapted portions of the derivative software incorporating
restricted computer software are made subject to the same restricted rights;
(5)
Disclosed to and reproduced for use by support service contractors in accordance with
subparagraphs (b) (1) through (4) of this clause, provided the Government makes
such disclosure or reproduction subject to these restricted rights; and
(6)
Used or copied for use in or transferred to a replacement computer.
Notwithstanding the foregoing, if this computer software is published copyrighted
computer software, it is licensed to the Government, without disclosure prohibitions, with
the minimum rights set forth in paragraph (b) of this clause.
(d) Any other rights or limitations regarding the use, duplication, or disclosure of this
computer software are to be expressly stated in, or incorporated in, the contract.
(e) This Notice shall be marked on any reproduction of this computer software, in whole or in
part.
ii
MicroMMAC-E
Management Module Guide
Contents
Preface
What Is in This Guide .......................................................................................................... ix
Conventions .......................................................................................................................... ix
Related SPECTRUM Documentation....................................................................................x
Other Related Documentation ...............................................................................................x
Getting Help ......................................................................................................................... xi
Chapter 1
Introduction
What Is in This Chapter..................................................................................................... 1-1
MicroMMAC-E Management Module................................................................................ 1-1
MicroMMAC-E Applications .............................................................................................. 1-2
SPMA and the MicroMMAC-E........................................................................................... 1-4
Chapter 2
Device Views
What Is in This Chapter..................................................................................................... 2-1
Chassis Device View ........................................................................................................... 2-3
Accessing the MicroMMAC-E Chassis Device View................................................... 2-4
Ports .............................................................................................................................. 2-6
Redundancy .................................................................................................................. 2-8
Interface Device View ......................................................................................................... 2-9
Accessing the Interface Device View......................................................................... 2-10
MicroMMAC-E Interface Icons Panel ....................................................................... 2-11
Device Topology View/Interface Number Label ................................................. 2-11
ConÞguration - CSIIfPort View/Administrative Status Label .......................... 2-11
Interface Type Label............................................................................................ 2-12
Interface Model Information View/MAC Address Label.................................... 2-14
Network Information Label/Network Address Label ........................................ 2-14
Interface Performance - CSIIfPort View/Logical Gauge Label.......................... 2-14
Interface Options Panel ............................................................................................. 2-15
Gauge Control Panel View .................................................................................. 2-16
Selected Attribute ......................................................................................... 2-16
Gauge Mode ................................................................................................... 2-16
Gauge Type ................................................................................................................. 2-17
Gauge Control Panel Buttons.................................................................................... 2-18
The Physical Device View ................................................................................................ 2-19
Accessing the Physical Device View.......................................................................... 2-19
9031124 E4
iii
Chapter 3
ConÞgurationViews
What Is in This Chapter .....................................................................................................3-1
Accessing the MicroMMAC-E Device ConÞguration View .........................................3-2
MicroMMAC-E Device ConÞguration View.................................................................3-3
Interface ConÞguration Table ......................................................................................3-3
Module and Port ConÞguration Views.........................................................................3-5
Module Management (Module ConÞguration View Only)..........................................3-5
Port Management (Port ConÞguration View Only) ....................................................3-6
Trap ConÞguration .......................................................................................................3-6
Alarm ConÞguration.....................................................................................................3-7
Error Source..................................................................................................................3-8
Stack Repeater ConÞguration View ...................................................................................3-9
Repeater Management .................................................................................................3-9
Source Address Management.....................................................................................3-10
Trap ConÞguration .....................................................................................................3-10
Alarm ConÞguration...................................................................................................3-10
Error Source................................................................................................................3-11
Board Map...................................................................................................................3-12
Manages ......................................................................................................................3-12
Chapter 4
Event and Alarm Messages
What Is in This Chapter .....................................................................................................4-1
MicroMMAC-E Events and Alarms ...................................................................................4-1
Index
iv
MicroMMAC-E
Management Module Guide
Figures
Chapter 2
Figure 2-1.
Figure 2-2.
Figure 2-3.
Figure 2-4.
Figure 2-5.
Figure 2-6.
Figure 2-7.
Device Views
MicroMMAC-E Device View ................................................................................. 2-2
Logical Module Fields and Menu Selections ....................................................... 2-3
Port Icon - Device Chassis View ........................................................................... 2-7
Redundantly Connected Devices ......................................................................... 2-8
MicroMMAC-E Interface Device View ................................................................. 2-9
Micro MMAC Interface Icon ............................................................................... 2-11
Physical Device View .......................................................................................... 2-20
9031124 E4
v
vi
MicroMMAC-E
Management Module Guide
Tables
Chapter 1
Table 1-1.
Chapter 2
Table 2-1.
Table 2-2.
Table 2-3.
Table 2-4.
Table 2-5.
Table 2-6.
Table 2-7.
Table 2-8.
Table 2-9.
Chapter 3
Table 3-1.
Chapter 4
Table 4-1.
Introduction
Stack Repeater....................................................................................................... 1-4
Device Views
Module Menu Selections ....................................................................................... 2-5
Stack Menu Selections .......................................................................................... 2-5
Port Menu Selections............................................................................................. 2-7
Configuration - CSIIfPort View .......................................................................... 2-12
Interface Types .................................................................................................... 2-12
Color and Statistical Definitions for Each Attribute ......................................... 2-14
Gauge Mode Totals Attributes and Color Definitions ....................................... 2-16
Gauge Mode Rate Attributes and Color Definitions.......................................... 2-17
Physical Device View - Module Icon Menu Selections....................................... 2-21
ConÞgurationViews
Port Interface Types .............................................................................................. 3-4
Event and Alarm Messages
MicroMMAC-E Events and Alarms...................................................................... 4-1
9031124 E4
vii
viii
MicroMMAC-E
Management Module Guide
Preface
You should read this manual if you are going to manage a MicroMMAC-E
Device through SPECTRUM.
Before reading this manual, you should be familiar with SPECTRUMÕs
operation. Familiarity with network management is helpful, as is an
understanding of the device hardware and Þrmware described in the
MicroMMAC-22E and MicroMMAC-24E 10 Base-T Intelligent Stackable
Hub UserÕs Guide.
What Is in This Guide
This guide is organized as follows:
Chapter
Description
Chapter 1
Introduction
Describes the MicroMMAC-E management
module and model types.
Chapter 2
Device Views
Describes the MicroMMAC-EÕs Device View
from the interface, chassis, and physical
sites.
Chapter 3
ConÞguration Views
Describes the conÞguration views for the
MicroMMAC-E Devices model and the
device-speciÞc management information
provided by each view.
Chapter 4
Event and Alarm
Messages
Contains a listing and explanation of typical
event and alarm messages generated in the
Event Log or Alarm View for the
MicroMMAC-E Devices model type.
9031124 E4
ix
Related SPECTRUM Documentation
Conventions
In this manual the following conventions are used:
¥
Command names are printed in bold; for example, Clear or Save
& Close.
¥
Menu selections to access a view are printed in bold; for example,
ConÞguration or Detail.
¥
Buttons are represented by a shadowed box; for example:
Help
Related SPECTRUM Documentation
When using this guide, you should have a clear understanding of SPECTRUM
functionality and navigation techniques as described in the Administration,
Operation, and following documentation:
How to Manage a Network with SPECTRUM
SPECTRUM AutoDiscovery UserÕs Guide
SPECTRUM MicroMMAC-22E and MicroMMAC-24E 10Base-T
Intelligent Stackable Hub UserÕs Guide
SPECTRUM Portable Management Application for the EMM-E6 UserÕs
Guide
Other Related Documentation
Computer Networks, Andrew S. Tanenbaum, Prentice-Hall, Inc.
Internetworking Technology Overview, Cisco Systems, Inc. (1993, Cisco
Systems, Inc.)
LAN Troubleshooting Handbook, Mark Miller (1989, M&T Publishing, Inc.)
Local Area Networks, Architectures and Implementations, James Martin &
Kathleen K. Chapman for the Arben Group, Inc. (1989, Prentice-Hall, Inc.)
The Simple Book Ñ An Introduction to Management of TCP/IP-based
Internets, Marshall T. Rose, Performance Systems International, Inc.
Preface
x
MicroMMAC-E
Management Module Guide
Getting Help
Getting Help
For additional support for SPECTRUM products, or to make comments or
suggestions regarding SPECTRUM or this manual, contact Cabletron
Systems Technical Support via one of the following means:
Location
Mail
FAX
Telephone
603-337-3075
603-337-3500
(*)-44-635-552062
(*)-44-635-580000
Europe
Cabletron Systems, Ltd.
Network House
Newbury Business Park
London Road, Newbury
Berkshire, England RG13 2PZ
E-mail: [email protected]
(*)-61-2-950-5950
(*)-61-2-950-5900
PaciÞc
Cabletron Systems, Inc.
Allambie Grove Estate
25 FrenchÕs Forest Road East
FrenchÕs Forest, NSW 2086
Sydney, Australia
E-mail: [email protected]
(*)-81-3-3240-1985
(*)-81-3-3240-1981
Japan
Cabletron Systems, KK
JTB Building 9F
164 Maranouchi
Chiyoda-ku
Tokyo 100 Japan
E-mail: [email protected]
(*)-65-7763382
(*)-65-7755355
Singapore
Cabletron Systems, Inc.
85 Science Park Drive
#03-03/04
The Cavendish
Singapore 051
E-mail: [email protected]
(*)-49-6103/991-229
(*)-49-6103/991-269
Germany
Cabletron Systems GmbH
Dreieich Park
Im GeÞerth 13d
63303 Dreieich
Frankfurt, Germany
E-mail: [email protected]
Cabletron Systems, Inc.
P. O. Box 5005
North America
Rochester, NH 03866-5005
E-mail: [email protected]
*International Operator Code
Questions About SPECTRUM Documentation?
E-MAIL
9031124 E4
Send your questions, comments or suggestions regarding SPECTRUM
documentation to the Technical Communications Department directly via the
following internet address:
[email protected]
Preface
xi
Getting Help
Preface
xii
MicroMMAC-E
Management Module Guide
Chapter 1
Introduction
What Is in This Chapter
This chapter describes the SPECTRUM Management Module for the
MicroMMAC-E. It will also give you the model type names assigned to the
MicroMMAC-E in SPECTRUM. (Model type name refers to the template used
to specify attributes, actions, and associations for device models in
SPECTRUM.)
MicroMMAC-E Management Module
The SPECTRUM MicroMMAC-E Management Module contains information
necessary to manage MicroMMAC-Es, by using SPECTRUMÕs software
emulation of the device attributes and functionality.
The MicroMMAC-E Management Module manages all MicroMMAC-E device
models using the SNMP advanced network management agent and the
Management Information Bases (MIBs), which come as part of the
management module. The SPECTRUM model type name for the
MicroMMAC-E device is as follows:
BRtrCSIuMMAC: A Cabletron Systems Micro Multi Media Access Center
(uMMAC) Multi-Port Intelligent Bridging Routing Module.
The MicroMMAC-E is a multi-port intelligent repeater that can be stacked
with the HubSTACK series of stackable workgroup hubs. The MicroMMAC-E
provides management for up to Þve nonintelligent stackable Ethernet hubs.
The MicroMMAC-E also supports one optional Bridging Routing Interface
Module (BRIM) which bridges packets from one transmission type to another
9031124 E4
1-1
MicroMMAC-E Applications
(e.g., Ethernet to: FDDI network backbones, Wide Area, or Ethernet, etc.).
Other optional BRIMs are as follows:
¥ BRIM-E: Ethernet module with selectable media connections
¥ BRIM-F6: FDDI Dual Attached Station (DAS) connection
¥ BRIM-WT1: Wide Area NetworK (WAN)
When a BRIM is inserted into a MicroMMAC-E chassis, the icon dynamically
changes from a hub icon to a bridging icon, demonstrating the additional
bridging functionality provided by the BRIM. This is referred to as Òin-the-hub
bridging/routing.Ó
To model these devices, you create a LAN_802_3 model representing each
network the MicroMMAC-E is monitoring; you can then connect them to the
device icon. This model type software ÒconnectsÓ a repeater icon to the
repeater port and places it in the MicroMMAC-E Device Topology (DevTop)
View. (The repeater model is related to the hub model with the ÒManagesÓ
relation.) You copy these repeater icons into the LAN_802_3 icons to allow the
hubs to gather performance statistics on each LAN_802_3 subnet.
The following chapters explain how to use SPECTRUM and the management
module software to monitor and manage a MicroMMAC-E.
MicroMMAC-E Applications
The MicroMMAC-E Management Module supports both common and devicespeciÞc applications described in the MIB II Applications, Bridging
Applications, and Miscellaneous Applications references. SPECTRUM
management of a MicroMMAC-E is based on the following common and
device-speciÞc applications:
¥ Bridging (CSIBridge)
- Ethernet Special Database (SDB) (Ct_BdgEnet_App)
- PPP_BdgApp1474
- Spanning Tree (Ct_Stp_App)
- Static (Static_App)
- Transparent (CT_Tp_App
¥ CtRouter (CtRouterApp
- IP Routing (CtIP2App)
- CtIPServices
¥ DLM (DLM_Agent)
¥ CtWANAppDS1
¥ PPP_LCPApp1471
Introduction
1-2
MicroMMAC-E
Management Module Guide
MicroMMAC-E Applications
¥ CtWANAppRS232
- RFC1317sync
¥ DownLoad (CtDownLoadApp)
¥ Repeating (StckRptrRev4)
¥ MIB--II (SNMP2_Agent)
- ICMP (ICMP_App)
- IP (IP2_App)
- System (System2_App)
- UDP (UDP2_App)
¥ RMON App
- RMONEthProbe
¥ CtWANApp
RMON/CtRouter/DLM are also supported. SPECTRUM management of these
MIBs are purchased separately. Refer to the documentation provided with the
each of the above management modules for descriptions of these capabilities
(RMON Management Guide, Routing Services Management Module
Guide, and DLM Management Module Guide).
NOTE
If there is an Uninterruptible Power Supply (UPS) connected to your device,
CtUPS_App will show as a major software application.
¥ Device
¥ Devtop
¥ Performance
¥ ConÞguration
¥ Repeater Redundancy
¥ Source Address
¥ Repeater Security ConÞguration
¥ Model Information
¥ Utilities
These views are further detailed in the table below and in the MIB II
ApplicationsÕs, Bridging Applications, and Miscellaneous Applications
references.
9031124 E4
Introduction
1-3
SPMA and the MicroMMAC-E
Table 1-1.
Stack Repeater
Menu Selection
Description
Performance
Opens the Performance View. See SPECTRUM
Performance View Reference.
Stack
ConÞguration
Opens the Stack Repeater Rev 4 (MicroMMac-EÕs Repeater).
See Chapter 3 in this guide.
Repeater
Redundancy
Opens the Repeater ConÞguration View. See Chapter 3 in
this guide.
Repeater Source
Address
Opens the Source Address View. See SPECTRUM Portable
Management Application for the MicroMMAC-E UserÕs
Guide.
Repeater Security
ConÞguration
See SPECTRUM Portable Management Application for
the MicroMMAC-E UserÕs Guide.
Model Information
Opens the Repeater Model Information View. See the
SPECTRUM Views refernce.
SPMA and the MicroMMAC-E
SPMA for the MicroMMAC-E is described in the SPECTRUM Portable
Management Application for the MicroMMAC-(E) UserÕs Guide and the
SPECTRUM Portable Management Application for the
MicroMMAC-(E) Tools Guide. For details on the following views, refer to the
SPECTRUM Portable Management Application for the
MicroMMAC-(E) UserÕs Guide:
¥ Chapter 2, Using the MicroMMAC-(E) Hub View, describes the visual
display of the Hub and explains how to use the mouse within the Hub
View; the operation of some basic functions available only from the Hub
view are also described.
¥ Chapter 3, Alarm ConÞguration, describes how to set thresholds and
enable or disable alarms at the network (channel), module, and port
levels.
¥ Chapter 4, Link/Seg Traps, describes how to conÞgure link and
segmentation traps to suit your management needs.
¥ Chapter 5, Repeater Redundancy, describes how to conÞgure redundant
circuits to keep your network connections up and running in the event of a
single port failure.
¥ Chapter 6, Source Addressing, describes how to display the Source
Address List, how to set the aging time, and how to conÞgure source
address traps; it also describes the effects of source address locking.
Introduction
1-4
MicroMMAC-E
Management Module Guide
SPMA and the MicroMMAC-E
¥ Chapter 7, Security, describes how to conÞgure and manage the
LANVIEWSECURE feature incorporated into the new generation of
CabletronÕs family of stackable hubs.
¥ Chapter 8, Using the MicroMMAC-(E) Bridge View, provides detailed
instructions for conÞguring and managing the MicroMMAC-(E)Õs powerful
bridging capabilities, including monitoring bridge operation, using the
special and Þltering data bases, and setting forwarding thresholds and
notiÞcation options.
For details on the following views, refer to the SPECTRUM Portable
Management Application Tools Guide:
¥ Chapter 2, Using the MIB I, MIB II Tool, explains how to use this tool to
view and change MIB I and MIB II object ID values.
¥ Chapter 3, Using the Community Names Tool, explains CabletronÕs
ÒComponentÓ structure of device MIBs, and describes how to change
device community names.
¥ Chapter 5, Using TFTP Download Tool, explains how to upgrade Þrmware
on Cabletron devices equipped with Flash EEPROMs.
¥ Chapter 6, The Traps Table Tool, explains how to establish which network
management workstations on your network will receive trap alarms from
a selected device, and also provides a brief overview of some of the traps
supported by Cabletron SystemsÕ devices.
¥ Chapter 7, Using Charts and Meters, explains how to launch charts or
meters (used to analyze device statistics) from a UNIX prompt, and
control the Meter ToolÕs display.
¥ Chapter 8, ConÞguring and Monitoring an Uninterruptible Power Supply,
introduces the UPS system (which connects a computer interface port to
an intelligent MIM) and explains how to start, conÞgure, and monitor the
UPS Tool.
¥ Chapter 9, Using DLM, explains how to manage Òsmart hubÓ devices, or
DLM Servers, on your network. Accessing the DLM Application and its
windows, adding/deleting DLM entries, and managing DLM is also
described.
¥ Chapter 10, Using the Path Tool, explains how to generate a list of router
hops between a managed Cabletron device and a remote destination, and
display speciÞc information about each hop found in the router path.
¥ Chapter 11, MIB Tree/MIB Tools, provides an overview of the MIB
Browser, the MIB Details tool, the MIB Editor, and browsing the MIB
Tree.
9031124 E4
Introduction
1-5
SPMA and the MicroMMAC-E
Introduction
1-6
MicroMMAC-E
Management Module Guide
Chapter 2
Device Views
What Is in This Chapter
This chapter provides a description of the Device View for the MicroMMAC-E
Management Module, including an explanation of how to use the Interface,
Chassis, and Physical representations of the MicroMMAC-E, access
SPECTRUM generic views, and monitor performance.
¥ The Chassis View displays a logical view of the MicroMMAC-E chassis,
its interfaces, and the other stacked chassis. From this view you can get
information about the performance, conÞguration, and status of the
modules; the stack (for example, repeater); the BRIMÕs bridge; and the
ports.
¥ The Interface View displays a logical (narrative) view of the
MicroMMAC-EÕs interfaces and provides access to information on their
performance, status, and conÞguration.
¥ The Physical View displays a graphical representation of the device and
its stack. This view gives access only to module information.
These Device Views show the MicroMMAC-EÕs conÞguration. When the
conÞguration is modiÞed, the display reßects those changes after the modelÕs
next polling cycle.
Figure 2-1 shows an example of the MicroMMAC-E Device Views.
9031124 E4
2-1
What Is in This Chapter
Figure 2-1.
MicroMMAC-E Device View
Chassis Device View
Interface Device View
Interface Device View
Physical Device View
Device Views
2-2
MicroMMAC-E
Management Module Guide
Chassis Device View
Chassis Device View
The MicroMMAC-E Chassis Device View shows a logical representation of
each module in the stack.
From this view, you can go into several Þelds that access information about
the chassis, the module, the repeater stack, bridging, and the ports. An
overview of the process for accessing the Chassis Device View follows.
Each representation of a port includes a gauge which shows changes in trafÞc
over that port as it occurs. Figure 2-2 displays the Þelds in the MicroMMAC-E
Chassis Device View (Logical Module Fields and Menu Selections).
Figure 2-2.
Logical Module Fields and Menu Selections
Slot Number
Module Type
Stack
Bridging (with
BRIM installed)
1
uMMAC34
STACK
UNLOCKED
24
NLK
23
ON
22
NLK
Pkts 0
Pkts 49
Pkts 0
12
11
10
NLK
Pkts 0
NLK
NLK
Pkts 0
Pkts 0
11
10
21
NLK
Pkts 0
9
NLK
Pkts 0
EPIMs
Ports
20
NLK
Pkts 0
8
NLK
Pkts 0
19
NLK
Pkts 0
7
NLK
Pkts 0
18
NLK
Pkts 0
6
NLK
Pkts 0
17
NLK
Pkts 0
5
NLK
Pkts 0
16
NLK
15
NLK
Pkts 0
Pkts 0
4
3
NLK
NLK
Pkts 0
Pkts 0
4
3
14
NLK
13
NLK
Pkts 0
Pkts 0
2
1
NLK
NLK
Pkts 0
Pkts 0
2
1
E2
E1
26
NLK
Pkts 0
25
NLK
Pkts 0
Bridging
2
SEH22
12
NLK
Pkts 0
9031124 E4
NLK
Pkts 0
NLK
Pkts 0
9
NLK
Pkts 0
8
NLK
Pkts 0
7
NLK
Pkts 0
6
NLK
Pkts 0
5
NLK
Pkts 0
NLK
Pkts 0
NLK
Pkts 0
NLK
Pkts 0
NLK
Pkts 0
E1
25
NLK
Pkts 0
Device Views
2-3
Chassis Device View
Accessing the MicroMMAC-E Chassis Device View
Accessing the MicroMMAC-E Chassis Device View
Access the Chassis Device View using one of the following methods:
¥ Double-click on the Device View button of the MicroMMAC-E device icon.
This will open the Device View that was opened last (i.e. Chassis,
Interface, or Physical).
Model Name
Model Type
Device View Button
¥ Highlight the MicroMMAC-E device icon and select Device -> Chassis
from the Icon Subviews menu.
View
Go Back
Ctrl+b
Go Up
Icon Subviews
View Path
New View
Bookmarks
View History
Current View Info...
Notes...
Jump by name...
Zoom
Map Hierarchy
Page
Close
Ctrl+c
Navigate
Alarms
Performance
Notes...
Utilities
Zoom
Device
Chassis
DevTop
Interface
The Þelds in the MicroMMAC-E Chassis Device View and their related menus
are described below:
Slot Number
The deviceÕs assigned stack number.
Module Type
The type of module being displayed. Table 2-1 outlines the Icon Subviews
menu selections speciÞc to the available types of modules.
Device Views
2-4
MicroMMAC-E
Management Module Guide
Chassis Device View
Accessing the MicroMMAC-E Chassis Device View
Table 2-1.
Module Menu Selections
Menu Selection
Description
uMMAC Model
Information
(MicroMMAC-E only)
Opens the MicroMMAC-E Model Information View. See
the SPECTRUM Views reference.
uMMAC ConÞguration
(MicroMMAC-E only)
Opens the MicroMMAC-E ConÞguration View. See the
SPECTRUM Views reference.
Application View
(MicroMMAC-E only)
Opens the Application View. See the SPECTRUM
Views reference.
Module Notes
Opens the Module Notes View.
Module ConÞguration
Opens the Module ConÞguration View. See Chapter 3,
ConÞguration Views.
Module Performance
Opens the Module Performance View. See the
SPECTRUM Views reference.
Module Frame & Error
Breakdown
Opens the Module Frame & Error Breakdown View. See
the SPECTRUM Views reference.
Module Frame Size
Opens the Module Frame Size & Protocols View. See the
SPECTRUM Views reference.
Module DevTop View
Opens the ModuleÕs Device Topology View. See the
SPECTRUM Views reference.
Enable All Ports
Enables all ports on the selected module.
Security ConÞguration
Opens Repeater1 Security and Module Security Views.
See SPECTRUM Portable Management
Application for the MicroMMAC-E UserÕs Guide.
Stack
The Stack button provides access to views displaying information collected by
the MicroMMAC-EÕs repeater stack. The Stack button will be either in a
LOCKED, UNLOCKED, or MISMATCHED state depending on whether port
security has been enabled. The stack provides the menu selections deÞned in
Table 2-2.
Table 2-2.
Stack Menu Selections
Menu Selection
9031124 E4
Description
Stack Performance
Opens the Stack Performance View. See the
SPECTRUM Views reference.
Stack Frame & Error
Breakdown
Opens the Stack Frame & Size Breakdown View. See
the SPECTRUM Views reference.
Device Views
2-5
Chassis Device View
Ports
Table 2-2.
Stack Menu Selections (Continued)
Menu Selection
Description
Stack Frame Size &
Protocols
Opens the Stack Frame Size View. See the SPECTRUM
Views reference.
Stack ConÞguration
Opens the Stack ConÞguration View. See Chapter 3,
ConÞguration Views.
Stack Model
Information
Opens the Stack Model Information View. See the
SPECTRUM Views reference.
Repeater Redundancy
Opens the Repeater Redundancy View. See
SPECTRUM Portable Management Application for
the MicroMMAC-E UserÕs Guide.
Repeater Source
Address
Opens the Repeater Source Address View. See
SPECTRUM Portable Management Application for
the MicroMMAC-E UserÕs Guide.
Repeater Security
ConÞguration
Opens Repeater1 Security View. See SPECTRUM
Portable Management Application for the
MIcroMMAC-E UserÕs Guide.
Bridging
The Bridging button shows information views collected by the bridge,
provided that a BRIM is installed in your MicroMMAC-E. Please refer to How
to Manage a Network with SPECTRUM for more information on Bridges.
Ports
Ports are the interfaces on the module:
¥ The MicroMMAC-22E and -32E have twelve RJ45 ports and one EPIM
(Ethernet Port Interface Modules) port.
¥ The MicroMMAC-24E and -34E have twenty-four RJ45 ports and two
EPIM ports. EPIM ports are designated as E1 and E2.
Figure 2-3 shows the port iconÕs Òat-a-glanceÓ information:
Device Views
2-6
MicroMMAC-E
Management Module Guide
Chassis Device View
Ports
Figure 2-3.
Port Icon - Device Chassis View
Port Number - The number uniquely identifying the port.
Port Status - The portÕs status. Possible values are: ON, OFF, NLK (no link), or SEG (segmented)
10 NLK
Port Statistics - The rate of frames per second received by this port.
Pkts 0
Table 2-3 outlines the menu selections and information you can access from
the port menu:
Table 2-3.
Port Menu Selections
Menu Selection
9031124 E4
Description
Port Notes
Opens the Port Notes View.
Port ConÞguration
Opens the Port ConÞguration View. See Chapter 3,
ConÞguration Views.
Port Performance
Opens the Port Performance View. See the SPECTRUM
Views reference.
Port Frame & Error
Breakdown
Opens the Port Frame & Size Breakdown View. See the
SPECTRUM Views reference.
Port Frame Size &
Protocols
Opens the Port Frame Size & Protocols View. See the
SPECTRUM Views reference.
Port Redundancy
Opens the Port Redundancy View. See SPECTRUM
Portable Management Application for the
MicroMMAC-E UserÕs Guide.
Port Source Address
Opens the Port Source Address View. See SPECTRUM
Portable Management Application for the
MicroMMAC-E UserÕs Guide.
Port Security
ConÞguration
Opens Repeater1 Security and Port Security Views. See
SPECTRUM Portable Management Application for
the MicroMMAC-E UserÕs Guide.
Enable/Disable Port
Enables or disables the selected port.
Device Views
2-7
Chassis Device View
Redundancy
Redundancy
SPECTRUM allows redundant circuit connections between any two or more
hub devices that have redundant capability in their Þrmware. A circuit is
established by a cable connection from one port on a primary hub device to one
or more ports on secondary hub devices. The cable connections can use any
valid cable type, including UTP/STP, coaxial, or Þber optic.
Any two or more cable connections create a complete circular circuit pathway
between the two devices. One pathway is always set up as primary and the
others as secondary or backup. The secondary circuit becomes active if the
primary pathway fails. This allows the primary hub device to repeat data
transmission on an alternative module port if a problem exists on the primary
port.
Although circuit connections typically occur between devices in the same
room, the circuit connections can also occur over longer distances between
ßoors or buildings (with the proper cables and associated modules).
Refer to Figure 2-4 for an example of a redundant cable circuit connection
between the device and a secondary hub device.
Figure 2-4.
Redundantly Connected Devices
MicroMMAC-E
Primary Active Circuit
Backup Inactive Circuit
MicroMMAC-E
Views related to redundancy are the Repeater Redundancy and Port
Redundancy Views. Descriptions of the Þelds found in these views and stepby-step instructions on conÞguring your network for redundancy are outlined
in Chapter 5 of SPECTRUM Portable Management Applications for the
MicroMMAC-E.
Source Address Tables are used to determine which frames will be forwarded
through the MicroMMAC-E from one network segment to another. This
section, found in SPECTRUM Portable Management Applications for
Device Views
2-8
MicroMMAC-E
Management Module Guide
Interface Device View
the MicroMMAC-E, provides a description of the source address views used
to establish a source address table for the MicroMMAC-E.
Interface Device View
This section describes the functions of the Interface Icons and the Interface
Options; information about the Device Icon Panel, which displays the
MicroMMAC-E Location View Icon, can be found in the SPECTRUM Views
reference. The Interface Device View includes three panels shown in
Figure 2-5
Figure 2-5.
MicroMMAC-E Interface Device View
Interface Options Panel
Device Icon Panel
MicroMMAC-E Interface
Icons Panel
9031124 E4
Device Views
2-9
Interface Device View
Accessing the Interface Device View
Accessing the Interface Device View
You can access the Interface Device View using one of the following methods:
¥ Double-click on the Device View button of the MicroMMAC-E device icon.
This will open the Device View that was opened last (i.e. Chassis,
Interface, or Physical).
Model Name
Model Type
Device View Button
¥ Highlight the MicroMMAC-E device icon and select Device -> Interface
from the Icon Subviews menu.
View
Go Back
Ctrl+b
Go Up
Icon Subviews
View Path
New View
Bookmarks
View History
Current View Info...
Notes...
Jump by name...
Zoom
Map Hierarchy
Page
Device Views
2-10
Close
Ctrl+c
Navigate
Alarms
Performance
Notes...
Utilities
Zoom
Device
Chassis
DevTop
Interface
MicroMMAC-E
Management Module Guide
Interface Device View
MicroMMAC-E Interface Icons Panel
MicroMMAC-E Interface Icons Panel
This section describes the MicroMMAC-E Interface Icon, the iconÕs doubleclick zones, and associated views. Figure 2-6 is a model of the MicroMMAC-E
Interface Icon.
Figure 2-6.
Micro MMAC Interface Icon
Close
Navigate
Alarms
Performance
Notes...
Utilities
DevTop
ConÞguration
Model Information
(a)
(b)
(c)
(d)
(e)
(f)
(a)
(b)
(c)
(d)
(e)
(f)
Device Topology View/Interface Number Label
Port ConÞguration - CSIIfPort View/Administrative Status Label
Port InterfaceType Label
Interface Model Information View/MAC Address Label
Network Information Label/Network Address Label
Interface Performance - CSIIfPort View/Logical Gauge Label
Device Topology View/Interface Number Label
Double-clicking on this label of the Interface Icon takes you to the
MicroMMAC-E Device Topology (DevTop) View. This label also gives you the
number of this interface. Further information about the DevTop View can be
found in the SPECTRUM Views reference.
ConÞguration - CSIIfPort View/Administrative Status Label
This label gives you the interfaceÕs administrative status as well as access to
the ConÞguration - CSIIfPort View. The Administrative Status label includes a
text label and a background color representing the current state of the
interface. You can get this view by double-clicking on the label, or by
highlighting the interface icon and using the right mouse button to select
9031124 E4
Device Views
2-11
Interface Device View
ConÞguration from the Icon Subviews menu. Table 2-4 describes the
information found in the ConÞguration - CSIIfPort View.
Table 2-4.
ConÞguration - CSIIfPort View
Field
NOTE
Description
Interface Index
Indicates the value identifying the interface.
Interface Type
Indicates the type of interface.
Operation Status
Indicates the current operating condition of the interface for
which the entry exists.* Possible entries are: On (Green), Off
(Blue), Test (Red), and (Yellow) when operational status is off
and admin status is on.
Admin Status
Indicates the current administrative state of the interface for
which the entry exists.* Possible entries: On (Green), Off
(Blue), Test (Red), and (Yellow) when operational status is off
and admin status is on. You can modify this Þeld.
IF Description
Displays a textual description of the interface.
These colors are displayed as a background color in the interface icon found in
the Device/Interface View section (b) only.
Interface Type Label
The Port Interface Type Label gives you the type of MicroMMAC-E interface.
Possible interface types are shown in Table 2-5.
Table 2-5.
Interface Types
Interface Type
Device Views
2-12
Description
Other
None of the following
Reg1822
Regular 1822
HDH1822
HDLC Distant Host protocol
DDNX25
Defense Data Network X.25
rfc877X25
RFC877 X.25
Ethernet
Ethernet CSMA/CD
MicroMMAC-E
Management Module Guide
Interface Device View
Table 2-5.
Interface Types (Continued)
Interface Type
9031124 E4
Description
iso88023
ISO CSMA/CD
iso88024
ISO token bus
iso88025
ISO token ring
iso88026
ISO man
starLan
StarLAN IEEE (Institute of Electronic & Electrical
Engineers) 802.3
Prot10MB
ProNET 10 Mbps
Prot80MB
ProNET 80 Mbps
HypChan
Hyperchannel
FDDI
Fiber Distributed Data Interface
LAPB
X.25 Line Access Procedure, Balanced
SDLC
IBM Synchronous Data Link Control protocol
T1
T1 link (USA and Japan)
CEPT
T1 link (Europe)
BasicISDN
Basic Integrated Services Digital Network
PrimISDN
Proprietary Integrated Services Digital Network
PPSerial
Proprietary Point to Point Serial
PPP
Point to Point Protocol
SFTWARLPBK
Software Loopback
CLNPoverIP
Connectionless Network Protocol over IP
Enet3MB
Ethernet 3 Mbps
XNSoverIP
Xerox Network Service Protocol over IP
SLIP
Generic Serial Line IP
ULTRA
ULTRA Technologies
T-3
T3 link
SMDS
Switched Multimegabit Data Service
FrameRelay
T1 Frame relay
Device Views
2-13
Interface Device View
Interface Model Information View/MAC Address Label
This label gives you the physical address of the MicroMMAC-E interface as
well as access to interface model information. Double-clicking on this label of
the icon opens the CSI Interface Port Model Information View. (You can also
access these views by highlighting the interface icon and using the right
mouse button to select Model Information from the Icon Subviews menu.)
The deÞnitions for these Þelds are described in the SPECTRUM Views
reference.
Network Information Label/Network Address Label
This label gives you name, network address, and subnet mask information for
the interface, according to the selections you made in the Interface Options
Panel, see the next section.
Double-clicking on this label shows you the Network Information Panel. The
network information entries from this panel can be displayed on the Network
Address Label.
Interface Performance - CSIIfPort View/Logical Gauge Label
Double-clicking on this label of the Interface Icon gives you the Performance CSIIfPort View. (This view can also be accessed by highlighting the Interface
icon and using the right mouse button to select Performance from the Icon
Subviews menu.) The Performance - CSIIfPort View summarizes network
packet trafÞc ßow for this interface. (Refer to the SPECTRUM Views
reference for descriptions of this viewÕs Þelds.)
This label dynamically tracks packet trafÞc; you can see it presented
graphically through the Logical Gauge referred to in the Interface Options
Panel section and outlined in Table 2-6.
Table 2-6.
Color and Statistical DeÞnitions for Each Attribute
Statistic
Device Views
2-14
Color
Description
% Transmitted
white
The percentage of the total number of packets that
have been transmitted by this interface during
uptime.
% Discarded
orange
The percentage of the total number of packets that
have been discarded by this interface during uptime.
% Error
red
The percentage of the total number of packets that
have contained errors by this interface during uptime.
MicroMMAC-E
Management Module Guide
Interface Device View
Interface Options Panel
Table 2-6.
Color and Statistical DeÞnitions for Each Attribute (Continued)
Statistic
Color
Description
% Host Bound
yellow
The percentage of the total number of packets that
have been delivered to the local host from the
interface during uptime.
# In Packet
Rate p/s
light blue
The total number of packets that have been received
by this interface during uptime.
# Out Packet
Rate p/s
turquoise
The total number of packets that have been
transmitted by this interface during uptime.
# Total Packet
Rate p/s
royal blue
The total number of packets that have been
transmitted and received by this interface during
uptime.
In Load
green
The amount of bandwidth used per packets received
during the interfaceÕs uptime.
Out Load
mustard
green
The amount of bandwidth used per packets
transmitted during the interfaceÕs uptime.
Total Load
light green
The amount of bandwidth used per packets received
and transmitted during the interfaceÕs uptime.
Interface Options Panel
The Interface Options Panel area of the Device View allows you to modify the
presentation of the Logical Interface Icon. It contains the Þelds described
below as well as access to the Gauge Control Panel View.
Filter
The Filter area of the Interface Options Panel is only implemented if the
SPECTRUM Routing Services Management Module is loaded.
Network Information
The Network Information area of the Interface Options Panel allows you to
select the interface information displayed in the Network Information Label
zone of that interfaceÕs Logical Interface Icon. Possible selections are
ADDRESS, NAME, or MASK.
Interface Description
Selecting an Interface Icon displays the type of interface in the Interface
Description area of the Interface Options Panel.
9031124 E4
Device Views
2-15
Interface Device View
Interface Options Panel
Gauge Control Panel View
The Gauge Control Panel View allows you to change the type of statistical
information presented in the Logical Gauge area of the Logical Interface Icon.
To access the Gauge Control Panel, either double-click on the Interface
Options Panel or single-click on the panel to highlight it and then use the
right mouse button to select Gauge Control Panel from the Icon Subviews
menu.
Selected Attribute
This area of the Gauge Control Panel allows you to select the statistical
attribute displayed on the Logical Interface IconÕs Gauge. The label changes
color to reßect the attribute selected. Table 2-7 and Table 2-8 provide lists of
attributes and their corresponding colors per gauge mode.
Gauge Mode
This area of the Gauge Control Panel allows you to select the mode presented
by the Logical Gauge. Possible selections are Totals, Rates, or Percentages.
The Percentages selection represents the percentage of the interface compared
to the rest of the interfaces. In this model, the percentages are not
implemented. Table 2-7 shows the attributes displayed when selecting the
Totals gauge mode and Table 2-8 shows the attributes displayed when
selecting the Rates gauge mode.
Table 2-7.
Gauge Mode Totals Attributes and Color DeÞnitions
Selected
Attribute
Device Views
2-16
Color
Errors
Orange
In Packets
Lt. Blue
Out Packets
Lt. Blue
In Octets
Green
Out Octets
Green
Discards
Tan
Forwarded
Lt. Purple
Host Bound
Yellow
MicroMMAC-E
Management Module Guide
Interface Device View
Gauge Type
Table 2-7.
Gauge Mode Totals Attributes and Color DeÞnitions (Continued)
Selected
Attribute
Table 2-8.
Color
Transmitted
White
Filtered
Gray
Gauge Mode Rate Attributes and Color DeÞnitions
Selected
Attribute
Color
Load
Green
Load In
Green
Load Out
Green
Packet Rate
Lt. Blue
In Packet Rate
Lt. Blue
Out Packet Rate
Lt. Blue
% Discard
Tan
% Filtered
Gray
% Forwarded
Lt. Violet
% Host Bound
Yellow
% Error
Orange
% Transmitted
White
Gauge Type
This option allows you to select either a numeric or linear representation of
the Logical Gauge. The following section describes the Logical Gauge button.
Apply
Apply the current selections to the Logical Gauge by clicking on this button.
The settings cannot be saved.
9031124 E4
Device Views
2-17
Interface Device View
Gauge Control Panel Buttons
Gauge Control Panel Buttons
You can control the way the Gauge Control Panel selections affect the logical
interface icon through using the following buttons:
Keep Settings
Click on this button to save the current gauge settings while running
SpectroGRAPH.
Reset
When clicked on, this button resets the settings selections to the last kept
settings.
Close
Click on this button to close the Gauge Control Panel.
Default
Click on this button to reset the default attribute to Load.
Device Views
2-18
MicroMMAC-E
Management Module Guide
The Physical Device View
The Physical Device View
This section describes the module information available from the
MicroMMAC-E Physical Device View, which displays a physical
representation of the MicroMMAC-E module and its stack.
Accessing the Physical Device View
Access the Physical Device View using one of the following methods:
¥ Double-click on the Device View button of the MicroMMAC-E device icon.
This will open the Device View that was opened last (i.e. Chassis,
Interface, or Physical).
Model Name
Model Type
Device View Button
¥ Highlight the MicroMMAC-E device icon and select Device -> Physical
from the Icon Subviews menu.
View
Go Back
Ctrl+b
Go Up
Icon Subviews
View Path
New View
Bookmarks
View History
Current View Info...
Notes...
Jump by name...
Zoom
Map Hierarchy
Page
9031124 E4
Close
Ctrl+c
Navigate
Alarms
Performance
Notes...
Utilities
Zoom
Device
Chassis
DevTop
Interface
Physical
Device Views
2-19
The Physical Device View
Accessing the Physical Device View
Figure 2-7.
Physical Device View
Physical Device View
Device Views
2-20
MicroMMAC-E
Management Module Guide
The Physical Device View
Accessing the Physical Device View
Non-generic selections related to the module icons in the MicroMMAC-E
Physical Device View are described in Table 2-9.
Table 2-9.
Physical Device View - Module Icon Menu Selections
Menu Selection
9031124 E4
Description
uMMAC Model
Information
Opens the MicroMMAC-E Model Information View. See
the SPECTRUM Views reference.
uMMAC ConÞguration
Opens the MicroMMAC-E ConÞguration View. See the
SPECTRUM Views reference.
Application View
Opens the Application View. See the SPECTRUM
Views reference.
Module Notes
Opens the Module Notes View.
Module ConÞguration
Opens the Module ConÞguration View. See Chapter 3,
ConÞguration Views.
Module Performance
Opens the Module Performance View. See the
SPECTRUM Views reference.
Module Frame & Error
Breakdown
Opens the Module Frame & Size Breakdown View. See
Chapter 3, ConÞguration Views.
Module Frame Size
Opens the Module Frame Size & Protocols View. See the
SPECTRUM Views reference.
Module DevTop View
Opens the ModuleÕs Device Topology View. See the
SPECTRUM Views reference.
Enable All Ports
Enables all ports on the selected module.
Device Views
2-21
The Physical Device View
Accessing the Physical Device View
Device Views
2-22
MicroMMAC-E
Management Module Guide
Chapter 3
ConÞgurationViews
What Is in This Chapter
This chapter provides general descriptions of the conÞguration views that are
available for the MicroMMAC-E. These views allow you to access devicespeciÞc conÞguration information.
The MicroMMAC-E management module manages the following conÞguration
views:
¥
¥
¥
¥
¥
Device
Interface
Module
Port
Stack Repeater
9031124 E4
3-1
What Is in This Chapter
Accessing the MicroMMAC-E Device ConÞguration View
Accessing the MicroMMAC-E Device ConÞguration View
Access the Device ConÞguration View using one of the following methods:
¥ Double-click on the ConÞguration view label of the MicroMMAC-E device
icon.
Model Name
Model Type
ConÞguration View Button
¥ Highlight the MicroMMAC-E device icon and select ConÞguration from
the Icon Subviews menu.
View
Go Back
Ctrl+b
Go Up
Icon Subviews
View Path
New View
Bookmarks
View History
Current View Info...
Notes...
Jump by name...
Zoom
Map Hierarchy
Page
ConÞgurationViews
3-2
Close
Ctrl+c
Navigate
Alarms
Performance
Notes...
Utilities
Zoom
Device
DevTop
Application
Configuration
MicroMMAC-E
Management Module Guide
What Is in This Chapter
MicroMMAC-E Device ConÞguration View
MicroMMAC-E Device ConÞguration View
The MicroMMAC-E Device ConÞguration View provides information on the
conÞguration and operating status of the MicroMMAC-E and includes the
following information:
Contact Status
This Þeld indicates if a connection with the device has been established.
Firmware Revision
The Þrmware revision for the device being modeled.
Hardware Revision
The hardware revision for the device being modeled.
Component Table
You click on this button to access the Community Name View. This view will
give you information on the MicroMMAC-E components. For further
information, see SPECTRUM Portable Management Application Tools
Guide.
DownLoad Application
Click on this button to access the DownLoad ApplicationView. This view
allows you to upgrade the Þrmware for a MicroMMAC-E from a TFTP Boot or
Bootp Server. For more information on this view, refer to SPECTRUM
Portable Management Application Tools Guide.
Trap Table
Click on this button to access the Trap Table View. This view allows you to
enable and disable traps and specify the IP address of the management
workstation that receives and processes the trap messages. For more
information, see SPECTRUM Portable Management Application Tools
Guide.
Interface ConÞguration Table
The Interface ConÞguration Table gives you the following conÞguration
information for each of the MicroMMAC-EÕs ports:
Number of Interfaces
Displays the number of interfaces available from this device.
9031124 E4
ConÞgurationViews
3-3
What Is in This Chapter
Interface ConÞguration Table
Index
Displays the number of the interface.
Type
The Port Type Label displays the type of MicroMMAC-E interface. Possible
interface types are shown in Table 3-1.
Table 3-1.
Port Interface Types
Interface Type
ConÞgurationViews
3-4
Description
Other
None of the following
Reg1822
Regular 1822
HDH1822
HDLC Distant Host protocol
DDNX25
Defense Data Network X.25
rfc877X25
RFC877 X.25
Ethernet
Ethernet CSMA/CD
iso88023
ISO CSMA/CD
iso88024
ISO token bus
iso88025
ISO token ring
iso88026
ISO man
starLan
StarLAN IEEE (Institute of Electronic & Electrical
Engineers) 802.3
Prot10MB
ProNET 10 Mbps
Prot80MB
ProNET 80 Mbps
HypChan
Hyperchannel
FDDI
Fiber Distributed Data Interface
LAPB
X.25 Line Access Procedure, Balanced
SDLC
IBM Synchronous Data Link Control protocol
T1
T1 link (USA and Japan)
CEPT
T1 link (Europe)
BasicISDN
Basic Integrated Services Digital Network
PrimISDN
Proprietary Integrated Services Digital Network
PPSerial
Proprietary Point to Point Serial
PPP
Point to Point Protocol
SFTWARLPBK
Software Loopback
CLNPoverIP
Connectionless Network Protocol over IP
Enet3MB
Ethernet 3 Mbps
MicroMMAC-E
Management Module Guide
What Is in This Chapter
Module and Port ConÞguration Views
Table 3-1.
Port Interface Types (Continued)
Interface Type
Description
XNSoverIP
Xerox Network Service Protocol over IP
SLIP
Generic Serial Line IP
ULTRA
ULTRA Technologies
T-3
T3 link
SMDS
Switched Multimegabit Data Service
FrameRelay
T1 Frame relay
Phy Address
The Ethernet (MAC) address of the interface.
Max Frame Size
The maximum frame size for the MicroMMAC-E interfaces.
Oper Status
The current operational state of this port (Up, Down, or Testing).
Module and Port ConÞguration Views
The Module and Port ConÞguration Views provide information on the
conÞguration and operating status of selected modules or ports. You can
access the Module ConÞguration View from the MicroMMAC-E Chassis
Device View by clicking on the module to highlight it and then selecting
Module ConÞguration from the Icon Subviews menu. You can access the
Port ConÞguration View from the MicroMMAC-E Chassis Device View by
clicking on the port to highlight it and then selecting Port ConÞguration
from the Icon Subviews menu.
Module Management (Module ConÞguration View Only)
This area of the Module ConÞguration View provides the following port
information for the selected module:
Port Count
The total number of ports on this module.
Ports On
The total number of ports currently in the ON state on this module.
9031124 E4
ConÞgurationViews
3-5
What Is in This Chapter
Port Management (Port ConÞguration View Only)
Ports Operational
The number of operational ports on this module.
Module Ports
Setting this Þeld to Enable enables all the ports on this module. Disable will
disable all ports on the module. You can also enable module ports by selecting
Enable All Module Ports from the Icon Subviews menu for the module.
Port Management (Port ConÞguration View Only)
This area of the Port ConÞguration View provides the following information
for the selected port:
Port Id
The number of the module port.
Administrative Status
The desired operational state of the port (Enable or Disable). You can update
this Þeld.
Operational Status
The current operational state of the port (Not-Operational or Operational).
Segmentation Status
The current segmentation state of the port (Not-Segmented or Segmented).
Link Status
The current link state of the port (Not-Linked, Linked, or Not-Applicable).
Topological State
The current port topological state (Station or Trunk).
Set Topological State
The desired port topological state (Not_Forced or Forced_Trunk). You can
update this Þeld.
Trap ConÞguration
This area of the Module and Port ConÞguration View allows you to enable or
disable any of the following types of traps:
ConÞgurationViews
3-6
MicroMMAC-E
Management Module Guide
What Is in This Chapter
Alarm ConÞguration
Link Traps
When enabled, all packets indicating a change in link status are reported
within the trap database.
Segmentation Traps
When enabled, all packets indicating a change in segmentation status are
reported within the trap database.
Source Address Traps
When enabled, all packets indicating a change in source address are reported
within the trap database.
Alarm ConÞguration
This area of the Module or Port ConÞguration View provides conÞguration and
status information for generation of alarms by the selected module. The Alarm
ConÞguration section provides the following information:
TrafÞc Alarms
This Þeld displays whether trafÞc alarms are disabled or enabled. You can
update this Þeld.
TrafÞc Threshold
The threshold value within the alarm timebase which, once that number of
packets is exceeded, generates a trafÞc alarm. You can update this Þeld.
TrafÞc Alarm Condition
You can set this Þeld to disable the module/port if the trafÞc alarm threshold
is exceeded: an alarm for the module is generated. This is useful in preventing
excessive network trafÞc from alarm messages transmitted by the module and
aids in module troubleshooting.
Collision Alarms
This Þeld displays whether collision alarms are disabled or enabled. You can
update this Þeld.
Collision Threshold
The threshold value within the alarm timebase which, once that number of
collisions per good packet is exceeded, generates a collision alarm. You can
update this Þeld.
Collision Alarm Condition
You can set this Þeld to disable the module/port if the collision alarm
threshold is exceeded; an alarm for the module is generated. This is useful in
9031124 E4
ConÞgurationViews
3-7
What Is in This Chapter
Error Source
preventing excessive network trafÞc from alarm messages transmitted by the
module and aids in module troubleshooting.
Broadcast Alarms
This Þeld displays whether broadcast alarms are disabled or enabled. You can
update this Þeld.
Broadcast Threshold
The threshold value within the alarm timebase which, once that number of
broadcast packets is exceeded, generates a broadcast alarm. You can update
this Þeld.
Broadcast Alarm Condition
You can set this Þeld to disable the module/port if the broadcast alarm
threshold is exceeded; an alarm for the module is generated. This is useful in
preventing excessive network trafÞc from alarm messages transmitted by the
module and aids in module troubleshooting.
Error Alarms
This Þeld displays whether error alarms are disabled or enabled. You can
update this Þeld.
Error Threshold
The threshold value within the alarm timebase which, once the percentage of
errors per good packet is exceeded, generates an error alarm.
Error Alarm Condition
You can set this Þeld to disable the module/port if the error alarm threshold is
exceeded; an alarm for the module is generated. This is useful in preventing
excessive network trafÞc from alarm messages transmitted by the module and
aids in module troubleshooting.
Error Source
The Error Source area of the Module or Port ConÞguration View provides a
series of buttons allowing you to select error types to include in the error sum.
You can modify the selectable error types. The selectable error types are as
follows:
CRC
The number of packets received by the module with bad Cyclical Redundancy
Checks (CRC).
ConÞgurationViews
3-8
MicroMMAC-E
Management Module Guide
Stack Repeater ConÞguration View
Runts
The number of runt packets received by the module. A runt packet is one byte
less than the standard Ethernet frame of 64 bytes (not including preamble).
OOW_Colls
The number of collisions out of the standard window (51.2µs) due to a network
problem.
Alignment
The number of misaligned packets detected by the module.
No_Resource
The number of times the module ran out of resources (i.e., lack of buffer space)
and could not accept packets.
Giants
The number of giant packets received by the module. A giant packet exceeds
1518 bytes (not including preamble).
Stack Repeater ConÞguration View
The Stack Repeater ConÞguration View provides information on the
conÞguration and operating status of the network the repeater is monitoring.
You can access the Stack Repeater ConÞguration View from the StckRptrRev4
Icon by selecting Stack ConÞguration option or from the Application View by
clicking on the Repeating Icon and then selecting ConÞguration from the Icon
Subviews menu.
Repeater Management
This area of the Repeater ConÞguration View provides the following port
information:
Port Count
The total number of ports on this LAN segment.
Ports On
The total number of ports currently in the ON state on this network.
Ports Operational
The number of operational ports on this network.
9031124 E4
ConÞgurationViews
3-9
Stack Repeater ConÞguration View
Source Address Management
Network Ports
Allows you to Enable/Disable the network ports on this network segment. You
can update this Þeld.
Network Port Security
Allows you to Lock/Unlock repeater ports. You can update this Þeld.
Source Address Management
This section of the Repeater ConÞguration View indicates the timeout period
in seconds.
Aging Interval
The time, in seconds, that dynamically learned forwarding information
remains in the database before being selected. You can update this Þeld.
Trap ConÞguration
This area of the Repeater ConÞguration View allows you to Enable or Disable
any of the following types of traps:
Link Traps
When enabled, all packets indicating a change in link status are reported
within the trap database.
Segmentation Traps
When enabled, all packets indicating a change in segmentation status are
reported within the trap database.
Source Address Traps
When enabled, all packets indicating a change in source address are reported
within the trap database.
Alarm ConÞguration
This area of the Repeater ConÞguration View provides conÞguration
information on generating alarms for the selected module. The conÞguration
information is as follows:
ConÞgurationViews
3-10
MicroMMAC-E
Management Module Guide
Stack Repeater ConÞguration View
Error Source
Timebase
This Þeld allows you to set the alarm timebase. The timebase is the number of
seconds used as the interval for performing all of the rate alarm checks. The
minimum is 10 seconds. For example, if the timebase is 10 seconds, an alarm
will occur only when the speciÞed number of errors occurs within 10 seconds.
TrafÞc Alarms
This Þeld displays whether trafÞc alarms are disabled or enabled. You can
Enable/Disable trafÞc alarms.
TrafÞc Threshold
The threshold value within the alarm timebase which, once the number of
packets is exceeded, generates a trafÞc alarm.
Collision Alarms
This Þeld displays whether collision alarms are disabled or enabled. You can
Enable/Disable collision alarms.
Collision Threshold
The threshold value within the alarm timebase which, once the number of
collisions per good packet is exceeded, generates a collision alarm.
Broadcast Alarms
This Þeld displays whether broadcast alarms are disabled or enabled. You can
Enable/Disable broadcast alarms.
Broadcast Threshold
The threshold value within the alarm timebase which, once the number of
broadcasts received is exceeded, generates a broadcast alarm.
Error Alarms
This Þeld displays whether error alarms are disabled or enabled. You can
Enable/Disable error alarms.
Error Threshold
The threshold value within the alarm timebase which, once the percentage of
errors per good packet is exceeded, generates an error alarm.
Error Source
The Error Source area of the Repeater ConÞguration View provides a series of
buttons allowing you to select the types of errors to include in the error sum.
The selectable error types are as follows:
9031124 E4
ConÞgurationViews
3-11
Stack Repeater ConÞguration View
Board Map
CRC
The amount of packets received by the module with bad CRC.
Runts
The amount of runt packets received by the module. A runt packet is one byte
less than the standard Ethernet frame of 64 bytes (not including preamble).
OOW_Colls
The amount of collisions out of the standard window (51.2µs) due to a network
problem.
Alignment
The amount of misaligned packets detected by the module.
No_Resource
The number of times the module ran out of resources (i.e., lack of buffer space)
and could not accept packets.
Giants
The amount of giant packets received by the module. A giant packet exceeds
1518 bytes (not including preamble).
Board Map
The Board Map provides a series of read-only indicator buttons displaying the
chassis slots occupied by the boards in this network.
Manages
This area of the Repeater ConÞguration View displays the Model Name of the
device managing this repeater. This section also allows you to access the
Device ConÞguration View by double-clicking on the Model Name or
highlighting the address and clicking OK.
ConÞgurationViews
3-12
MicroMMAC-E
Management Module Guide
Chapter 4
Event and Alarm Messages
What Is in This Chapter
This chapter describes the types of events and alarms generated by the
MicroMMAC-E and provides any probable cause messages corresponding to
these alarms.
MicroMMAC-E Events and Alarms
Table 4-1 lists typical events and alarms for the MicroMMAC-E.
Table 4-1.
MicroMMAC-E Events and Alarms
Message in the Event Log
Alarm View
CsEvFormat/Event00010203
CsPCause/Prob00010203
{d Ò%w- %d %m-, %Y - %TÓ} - The
model created is not the same type as
the device. Model type = {t}, Name =
{m}, User = {u}. (event [{e}])
The model created is not the same type as
the device.
CsEvFormat/Event00010306
{d Ò%w- %d %m-, %Y - %TÓ} - A(n) {t}
device, named {m}, has been cold
started. (event [{e}])
No Probable Cause Message
9031124 E4
4-1
MicroMMAC-E Events and Alarms
Table 4-1.
MicroMMAC-E Events and Alarms (Continued)
Message in the Event Log
Alarm View
CsEvFormat/Event00010307
{d Ò%w- %d %m-, %Y - %TÓ} - A(n) {t}
device, named {m} has been warm
started. (event [{e}])
No Probable Cause Message
CsEvFormat/Event00010308
CsPCause/Prob00010308
{d Ò%w- %d %m-, %Y - %TÓ} - A(n) {t}
device, named {m}, has detected a
communication Link Down. (event [{e}])
Communication link is down.
CsEvFormat/Event00010309
{d Ò%w- %d %m-, %Y - %TÓ} - A(n) {t}
device, named {m}, has detected a
communication Link Up. (event [{e}])
No Probable Cause Message
CsEvFormat/Event0001030a
CsPCause/Prob0001030a
{d Ò%w- %d %m-, %Y - %TÓ} - A(n) {t}
device, named {m}, has detected an
Authentication Failure. (event [{e}])
Authorization failure. Other user is trying
to connect to device with an invalid
community string.
CsEvFormat/Event00010401
CsPCause/Prob00010401
{d Ò%w- %d %m-, %Y - %TÓ} - Device
{m} of type {t} is created with an IP
address already used by another
model. (event [{e}])
DUPLICATE IP ADDRESS
The model has the same IP address as
that of some other model.
CsEvFormat/Event00010402
CsPCause/Prob00010402
{d Ò%w- %d %m-, %Y - %TÓ} - Device
{m} of type {t} is created with a
physical (MAC) address already used
by another model. (event [{e}])
DUPLICATE PHYSICAL ADDRESS
The model has the same Physical address
(MAC address) as that of some other
model.
Event and Alarm Messages
4-2
MicroMMAC-E
Management Module Guide
Index
Symbols
% Discarded 2-14
% Error 2-14
% Host Bound 2-15
% Transmitted 2-14
A
ADDRESS 2-15
Admin. Status 2-12
Administrative Status 3-6
Label 2-11
Aging
Interval 3-10
Alarm
ConÞguration 3-7, 3-10
Alarm ConÞguration
Timebase 3-10
Alignment 3-9, 3-12
Alternative Module Port 2-8
Apply Button 2-17
B
Basic
Integrated Services Digital Network
2-13, 3-4
BasicISDN 2-13, 3-4
Board
Map 3-12
Broadcast
Alarms 3-11
Threshold 3-11
C
Cable Connections 2-8
CEPT 2-13, 3-4
Chassis Device View 2-15
Circuit
Connections 2-8
CLNPoverIP 2-13, 3-4
Collision
Alarms 3-11
Threshold 3-11
Component Table 3-3
Connectionless Network Protocol Over IP
2-13, 3-4
Contact
Status 3-3
CRC 3-8, 3-12
Cyclical Redundancy Checks 3-8
D
DDNX25 2-12, 3-4
Defense Data Network X.25 2-12, 3-4
Device
ConÞguration
View 3-3
Icon Panel 2-15
Model 1-2
Topology View
Label 2-11
Discard 2-17
Discards 2-16
E
EMME
Interface
Icon 2-11
Enet3MB 2-13, 3-4
Error 2-17
Alarms 3-11
Source 3-8, 3-11
Threshold 3-11
Errors 2-16
Ethernet 2-12, 3-4
3 Mbps 2-13, 3-4
CSMA/CD 2-12, 3-4
ETWMIM
Models 1-2
9031124 E4
1
F
FDDI 2-13, 3-4
Fiber Distributed Data Interface 2-13, 3-4
Filtered 2-17
Find 2-15
Firmware
Revision 3-3
Forwarded 2-16, 2-17
FrameRelay 2-13, 3-5
G
Gauge
Control Panel 2-16
Mode 2-16
Type 2-17
Generic
Serial Line IP 2-13, 3-5
View 2-1
Banner 3-2
Giant Packets 3-9
Giants 3-9, 3-12
Gray 2-17
Green 2-15, 2-16, 2-17
H
Hardware Revision 3-3
HDH1822 2-12, 3-4
HDLC Distant Host protocol 2-12, 3-4
Host
Bound 2-16, 2-17
HyChan 2-13, 3-4
Hyperchannel 2-13, 3-4
I
IBM Synchronous Data Link Control
Protocol 2-13, 3-4
IF Description 2-12
In
Load 2-15
Octets 2-16
Packet
Rate 2-15, 2-17
Packets 2-16
Index 3-4
Index
2
Intelligent
Bridging Module 1-1
Interface
ConÞguration Table 3-3
Description 2-15
Index 2-12
Number Label 2-11
Options Panel 2-15
Performance View Label 2-14
Type 2-12
ISO
CSMA/CD 2-13, 3-4
Man 2-13, 3-4
Token
Bus 2-13, 3-4
Ring 2-13, 3-4
ISO88023 2-13, 3-4
ISO88024 2-13, 3-4
ISO88025 2-13, 3-4
ISO88026 2-13, 3-4
L
LAPB 2-13, 3-4
Link
Status 3-6
Traps 3-7, 3-10
Load 2-17
In 2-17
Out 2-17
Logical
Gauge 2-16
Label 2-14
Interface Icon 2-15
Lt.
Blue 2-15, 2-16, 2-17
Green 2-15
Purple 2-16
Violet 2-17
M
Management
Information Base 1-1
Manages 3-12
MASK 2-15
Max
Frame Size 3-5
MIB 1-1
MicroMMAC-E
Management Module Guide
M (Continued)
Misaligned Packets 3-9
Module
ConÞguration
View 3-5
Management 3-5
Type 2-4
Mustard Green 2-15
N
NAME 2-15
Network
Information 2-15
Panel
Label 2-14
Port 3-10
Security 3-10
No
Resource 3-9
No_Resource 3-12
Notice i
Number of
Interfaces 3-3
O
OOW Colls 3-12
Oper Status 3-5
Operation Status 2-12
Orange 2-14, 2-16, 2-17
Other 2-12, 3-4
Out
Load 2-15
Octets 2-16
Packet 2-16
Rate 2-15, 2-17
P
Packet
Rate 2-17
Percentages 2-16
Phy Address 3-5
Point to Point Protocol 2-13, 3-4
Polling
Cycle 2-1
Port
9031124 E4
ConÞguration
View 3-5
Label 2-11, 2-12
Count 3-5, 3-9
Management 3-6
Type
Label 2-12
Ports
On 3-5, 3-9
Operational 3-6, 3-9
PPP 2-13, 3-4
PPSerial 2-13, 3-4
Primary
Circuit Pathway 2-8
Hub Device 2-8
PrimISDN 2-13, 3-4
Probable Cause Messages 4-1
ProNET
10 Mbps 2-13, 3-4
80 Mbps 2-13, 3-4
Proprietary
Integrated Services Digital Network
2-13, 3-4
Point to Point Serial 2-13, 3-4
Prot10MB 2-13, 3-4
Prot80MB 2-13, 3-4
R
Rates 2-16
Red 2-14
Reg1822 2-12, 3-4
Regular 1822 2-12, 3-4
Related Reading x
Repeater
ConÞguration
View 3-9
Restricted Rights Notice ii
RFC877 X.25 2-12, 3-4
Royal Blue 2-15
Runt Packets 3-12
Runts 3-12
S
SDLC 2-13, 3-4
Secondary
Circuit 2-8
Pathway 2-8
Index
3
S (Continued)
Segmentation
Traps 3-10
Selected Attribute 2-16
Set
Topological State 3-6
SFTWARLPBK 2-13, 3-4
SLIP 2-13, 3-5
SMDS 2-13, 3-5
SNMP 1-1
Software
Emulation 1-1
Loopback 2-13, 3-4
Source
Address
Management 3-10
Traps 3-10
SPMA
Alarm ConÞguration 1-4
Bridge View 1-5
Community Names 1-5
Generic SNMP (MIB I II) 1-5
Hub View 1-4
Link/Seg Traps 1-4
Repeater Redundancy 1-4
Security 1-5
Source Addressing 1-4
TFTP Download 1-5
Trap Table 1-5
StarLan 2-13, 3-4
StarLAN IEEE 802.3 2-13, 3-4
Switched Multimegabit Data Service 2-13,
3-5
TrafÞc
Alarms 3-11
Threshold 3-7, 3-11
Transmitted 2-17
Trap ConÞguration 3-6, 3-10
Turquoise 2-15
Type 3-4
U
ULTRA 2-13, 3-5
Technologies 2-13, 3-5
V
Virus Disclaimer i
W
White 2-14, 2-17
X
X.25 Line Access Procedure 2-13, 3-4
Xerox Network Service Protocol over IP
2-13, 3-5
XNSoverIP 2-13, 3-5
Y
Yellow 2-15, 2-16, 2-17
T
T1 2-13, 3-4
Frame relay 2-13, 3-5
Link 2-13, 3-4
T-3 2-13, 3-5
T3 link 2-13, 3-5
Tan 2-16, 2-17
TCP/IP Based Networks x
Timebase 3-11
Total 2-16
Load 2-15
Packet Rate 2-15
Trademarks i
Index
4
MicroMMAC-E
Management Module Guide