1
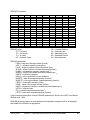
Appendix III-B
Western Washington Hydrology Model – Information,
Assumptions, and Computation Steps
The information and assumptions used in the Western Washington Hydrology Model (WWHM)
are described in this document.
WWHM Limitations
The WWHM has been created for the specific purpose of sizing stormwater control facilities for
new development and redevelopment projects in Western Washington. The WWHM can be
used for a range of conditions and developments; however, certain limitations are inherent in
this software. These limitations are described below.
The WWHM uses the EPA HSPF software program to do all of the rainfall-runoff and routing
computations. Therefore, HSPF limitations are included in the WWHM. For example,
backwater or tailwater control situations are not explicitly modeled by HSPF. This is also true in
the WWHM.
In addition, the WWHM is limited in its routing capabilities. The user is allowed to input a single
stormwater control facility and runoff is routed through this facility. If the proposed development
site contains multiple facilities in series or involves routing through a natural lake, pond, or
wetland in addition to a stormwater control facility then the user should use HSPF to do the
routing computations and additional analysis.
Routing effects become more important as the drainage area increases. For this reason it is
recommended that the WWHM not be used for drainage areas greater than one-half square
mile (320 acres). The WWHM can be used for small drainage areas down to less than an acre
in size.
WWHM Information and Assumptions
1. Precipitation data.
Length of Record
The WWHM uses long-term (43-50 years) precipitation data to simulate the potential impacts of
land use development in western Washington. A minimum period of 20 years is required to
simulate enough peak flow events to produce accurate flow frequency results. A 40 to 50-year
record is preferred. The actual length of record of each precipitation station varies, but all
exceed 43 years.
Rainfall Distribution
The precipitation data are representative of the different rainfall regimes found in western
Washington. A total of 17 precipitation stations are used. These stations represent rainfall at
elevations below 1500 feet. Snowfall and melt are not included in the WWHM.
January 2003
Volume III – Hydrologic Analysis and Flow Control Design/BMPs
B-1
The primary source for precipitation data is National Weather Service stations. The secondary
source is precipitation data collected by local jurisdictions. During development of WWHM,
county engineers at 19 western Washington counties were contacted to obtain local
precipitation data. Only King County provided local data.
The following precipitation stations have been included in the WWHM:
Precipitation Station
Astoria, OR
Blaine
Burlington
Clearwater
Darrington
Everett
Frances
Landsburg
Longview
McMillian
Montesano
Olympia
Port Angeles
Portland, OR
Quilcene
Sappho
SeaTac
Years of Data
1955-1998 = 43
1948-1998 = 50
1948-1998 = 50
1948-1998 = 50
1948-1996 = 48
1948-1996 = 48
1948-1998 = 50
1948-1997 = 49
1955-1998 = 43
1948-1998 = 50
1955-1998 = 43
1955-1998 = 43
1948-1998 = 50
1948-1998 = 50
1948-1998 = 50
1948-1998 = 50
1948-1997 = 49
County Coverage
Wahkiakum
Whatcom, San Juan
Skagit, Island
Jefferson (west)
Snohomish (northeast)
Snohomish (excluding northeast)
Pacific
King (east)
Cowlitz, Lewis (south)
Pierce
Grays Harbor
Thurston, Mason (south), Lewis (north)
Clallam (east)
Clark, Skamania
Jefferson (west), Mason (north), Kitsap
Clallam (west)
King (west)
The records were reviewed for length, quality, and completeness of record. Annual totals were
checked along with hourly maximum totals. Using these checks, data gaps and errors were
corrected, where possible. A "Quality of Record" summary was produced for each precipitation
record reviewed.
The reviewed and corrected data were placed in multiple WDM (Watershed Data Management)
files. One WDM file was created per county and contains all of the precipitation data to be used
by the WWHM for that particular county.
Computational Time Step
The computational time step used in the WWHM is one hour. The one-hour time step was
selected to better represent the temporal variability of actual precipitation than daily data.
2. Precipitation multiplication factors.
Precipitation multiplication factors increase or decrease recorded precipitation data to better
represent local rainfall conditions. This is particularly important when the precipitation gage is
located some distance from the study area.
Precipitation multiplication factors were developed for western Washington. The factors are
based on the ratio of the 24-hour, 25-year rainfall intensities for the representative precipitation
gage and the surrounding area represented by that gage’s record. The 24-hour, 25-year rainfall
B-2
Volume III – Hydrologic Analysis and Flow Control Design/BMPs
January 2003
intensities were determined from the NOAA Atlas 2 (Precipitation-Frequency Atlas of the
Western United States, Volume IX – Washington, 1973).
These multiplication factors were created for the Puget Sound lowlands plus all western
Washington valleys and hillside slopes below 1500 feet elevation. The factors were placed in
the WWHM database and linked to each county’s map. They are transparent to the general
user. The advanced user will have the ability to change the precipitation multiplication factor for
a specific site. However, such changes will be recorded in the WWHM output.
3. Pan evaporation data.
Pan evaporation data are used to determine the potential evapotranspiration (PET) of a study
area. Actual evapotranspiration (AET) is computed by the WWHM based on PET and available
moisture supply. AET accounts for the precipitation that returns to the atmosphere without
becoming runoff. Soil moisture conditions and runoff are directly influenced by PET and AET.
Evaporation is not highly variable like rainfall. Puyallup pan evaporation data are used for all of
the 19 western Washington counties.
Pan evaporation data were assembled and checked for the same time period as the
precipitation data and placed in the appropriate county WDM files.
Pan evaporation data are collected in the field, but PET is used by the WWHM. PET is equal to
pan evaporation times a pan evaporation coefficient. Depending on climate, pan evaporation
coefficients for western Washington range from 0.72 to 0.82.
NOAA Technical Report NWS 33, Evaporation Atlas for the Contiguous 48 United States, was
used as the source for the pan evaporation coefficients. Pan evaporation coefficient values are
shown on Map 4 of that publication.
As with the precipitation multiplication factors, the pan evaporation coefficients have been
placed in the WWHM database and linked to each county’s map. They will be transparent to
the general user. The advanced user will have the ability to change the coefficient for a specific
site. However, such changes will be recorded in the WWHM output.
4. Soil data.
Soil type, along with vegetation type, greatly influences the rate and timing of the transformation
of rainfall to runoff. Sandy soils with high infiltration rates produce little or no surface runoff;
almost all runoff is from groundwater. Soils with a compressed till layer slowly infiltrate water
and produce larger amounts of surface runoff during storm events.
The WWHM uses three predominate soil type to represent the soils of western Washington: till,
outwash, and saturated
Till soils have been compacted by glacial action. Under a layer of newly formed soil lies a
compressed soil layer commonly called "hardpan". This hardpan has very poor infiltration
capacity. As a result, till soils produce a relatively large amount of surface runoff and interflow.
A typical example of a till soil is an Alderwood soil (SCS class C).
January 2003
Volume III – Hydrologic Analysis and Flow Control Design/BMPs
B-3
Outwash soils have a high infiltration capacity due to their sand and gravel composition.
Outwash soils have little or no surface runoff or interflow. Instead, almost of their runoff is in the
form of groundwater. An Everett soil (SCS class A) is a typical outwash soil.
Outwash soils over high groundwater or an impervious soil layer have low infiltration rates and
act like till soils. Where groundwater or an impervious soil layer is within 5 feet from the surface,
outwash soils may be modeled as till soils in the WWHM.
Saturated soils are usually found in wetlands. They have a low infiltration rate and a high
groundwater table. When dry, saturated soils have a high storage capacity and produce very
little runoff. However, once they become saturated they produce surface runoff, interflow, and
groundwater in large quantities. Mukilteo muck (SCS class D) is a typical saturated soil.
The user will be required to investigate actual local soil conditions for the specific development
planned. The user will then input the number of acres of outwash (A/B), till (C), and saturated
(D) soils for the site conditions.
Alluvial soils are found in valley bottoms. These are generally fine-grained and often have a
high seasonal water table. There has been relatively little experience in calibrating the HSPF
model to runoff from these soils, so in the absence of better information, these soils may be
modeled as till soils.
Additional soils will be included in the WWHM if appropriate HSPF parameter values are found
to represent other major soil groups.
The three predominate soil types are represented in the WWHM by specific HSPF parameter
values that represent the hydrologic characteristics of these soils. More information on these
parameter values is presented below.
5. Vegetation data.
As with soil type, vegetation types greatly influence the rate and timing of the transformation of
rainfall to runoff. Vegetation intercepts precipitation, increases its ability to percolate through
the soil, and evaporates and transpires large volumes of water that would otherwise become
runoff.
The WWHM will represent the vegetation of western Washington with three predominate
vegetation categories: forest, pasture, and lawn (also known as grass).
Forest vegetation represents the typical second growth Douglas fir found in the Puget Sound
lowlands. Forest has a large interception storage capacity. This means that a large amount of
precipitation is caught in the forest canopy before reaching the ground and becoming available
for runoff. Precipitation intercepted in this way is later evaporated back into the atmosphere.
Forest also has the ability to transpire moisture from the soil via its root system. This leaves
less water available for runoff.
Pasture vegetation is typically found in rural areas where the forest has been cleared and
replaced with shrub or grass lots. Some pasture areas may be used to graze livestock. The
interception storage and soil evapotranspiration capacity of pasture are less than forest. Soils
may have also been compressed by mechanized equipment during clearing activities.
B-4
Volume III – Hydrologic Analysis and Flow Control Design/BMPs
January 2003
Livestock can also compact soil. Pasture areas typically produce more runoff (particularly
surface runoff and interflow) than forest areas.
Lawn vegetation is representative of the suburban vegetation found in typical residential
developments. Soils have been compacted by earth moving equipment, often with a layer of
topsoil removed. Sod and ornamental bushes replace native vegetation. The interception
storage and evapotranspiration of lawn vegetation is less than pasture. More runoff results.
Predevelopment default land conditions are forest, although the user has the option of
specifying pasture if there is documented evidence that pasture vegetation was native to the
predevelopment site. If this option is used, the change will be recorded in the WWHM output.
Forest vegetation is represented by specific HSPF parameter values that represent the forest
hydrologic characteristics. As described above, the existing regional HSPF parameter values
for forest are based on undisturbed second-growth Douglas fir forest found today in western
Washington lowland watersheds.
Postdevelopment vegetation will reflect the new vegetation planned for the site. The user has
the choice of forest, pasture, and landscaped vegetation. Forest and pasture are only
appropriate for postdevelopment vegetation in parcels separate from standard residential or
non-standard residential/commercial. Development areas must only be designated as forest or
pasture where legal restrictions can be documented that protect these areas from future
disturbances. The WWHM assumes the pervious land portion of the standard residential and
non-standard residential/commercial is covered with lawn vegetation, as described above.
6. Development land use data.
Development land use data are used to represent the type of development planned for the site
and are used to determine the appropriate size of the required stormwater mitigation facility.
For the purposes of the WWHM in Western Washington developed land is divided into two
major categories:
1. Standard residential, and
2. Non-standard residential/commercial.
Standard Residential
Standard residential development makes specific assumptions about the amount of impervious
area per lot and its division between driveways and rooftops. Streets and sidewalk areas are
input separately. Ecology has selected a standard impervious area of 4200 square feet per
residential lot, with 1000 square feet of that as driveway, walkways, and patio area, and the
remainder as rooftop area.
Impervious, as the name implies, allows no infiltration of water into the pervious soil. All runoff
is surface runoff. Impervious land typically consists of paved roads, sidewalks, driveways, and
parking lots. Roofs are also impervious.
For the purposes of hydrologic modeling, only effective impervious area is categorized as
impervious. Effective impervious area (EIA) is the area where there is no opportunity for
surface runoff from an impervious site to infiltrate into the soil before it reaches a conveyance
January 2003
Volume III – Hydrologic Analysis and Flow Control Design/BMPs
B-5
system (pipe, ditch, stream, etc.). An example of an EIA is a shopping center parking lot where
the water runs off the pavement and directly goes into a catch basin where it then flows into a
pipe and eventually to a stream. In contrast, some homes with impervious roofs collect the roof
runoff into roof gutters and send the water down downspouts. When the water reaches the
base of the downspout it can be directed either into a pipe or dumped on a splash block. Roof
water dumped on a splash block then has the opportunity to spread out into the yard and soak
into the soil. Such roofs are not considered to be effective impervious area. For hydrologic
modeling purposes, runoff credits are given to developments that contain houses that have roof
runoff systems that disperse roof runoff and allow it to drain into the soil. A runoff credit is given
by assuming in the modeling that the roof area behaves hydrologically as lawn rather than EIA.
The non-effective impervious area uses the adjacent or underlying soil and vegetation
properties. Vegetation often varies by the type of land use. Standard residential and nonstandard residential/commercial are both assumed to have lawn as their typical pervious area
vegetation.
The assumption is made in the WWHM that the EIA equals the TIA (total impervious area). This
is consistent with King County’s determination of EIA acres for new developments. Where
appropriate, the TIA can be reduced through the use of runoff credits (more on that below).
For standard residential developments the user will input the impervious area in the public rightof-way (streets and sidewalks). In addition, the user will input the number of residential lots and
the number of acres associated directly with these residential lots (public right-of-way acreages
and non-residential lot acreages excluded). The number of residential lots and the associated
number of acres will be used to compute the average number of residential lots per acre. This
value together with the number of residential lots and the impervious area in the public right-ofway will be used by the model to calculate the TIA for the proposed development.
Runoff credits will be given reducing runoff from standard residential lots. Runoff credits can be
obtained using any or all of the three methods described below.
1. Infiltrate roof runoff
2. Disperse roof runoff
3. Use porous pavement for driveway areas
Credit is given for disconnecting the roof runoff from the development’s stormwater conveyance
system and infiltrating on the individual residential lots. The WWHM assumes that this infiltrated
roof runoff does not contribute to the runoff flowing to the stormwater detention pond site. It
disappears from the system and does not have to be mitigated.
Credit is also given for disconnecting the roof runoff from the development’s stormwater
conveyance system and dispersing it on the surface of individual lots. This runoff is assumed to
be the equivalent of runoff from lawn vegetation.
The third option for runoff credit is the use of porous pavement for private driveway areas.
Specific HSPF parameters for porous pavement have not been developed for the WWHM.
Ecology has made the assumption that porous pavement runoff is the equivalent to the
conversion of 147 square feet (1000*0.147) of impervious area to lawn vegetation. This
assumption is used in the WWHM calculations.
B-6
Volume III – Hydrologic Analysis and Flow Control Design/BMPs
January 2003
Forest and pasture vegetation areas are only appropriate for separate undeveloped parcels
dedicated as open space, wetland buffer, or park within the total area of the standard residential
development. Development areas must only be designated as forest or pasture where
legal restrictions can be documented that protect these areas from future disturbances.
Non-Standard Residential/Commercial
Non-standard residential/commercial development includes residential developments for which
the standard residential developments assumptions are inappropriate, plus commercial,
industrial, schools, roads, multi-family residential (apartments, condos), and other non-single
family residential developments. For this type of development the user will input the roof area,
landscape area, street/sidewalk/parking areas, and any appropriate non-developed forest and
pasture areas. Developed runoff will be calculated based on these categories and their areas.
The only explicit runoff credit available to the user is porous pavement for streets, sidewalks,
and parking lots. The credit works the same way as for standard residential. It is specified as
14.7% of the total street/sidewalk/ parking impervious area. The user can also implicitly obtain
other runoff credits by decreasing or eliminating roof area where roof runoff is infiltrated or by
modeling roof area as lawn where roof runoff is dispersed in accordance with the infiltration and
dispersion requirements in Chapter 3. This will decrease surface runoff.
Forest and pasture vegetation areas are only appropriate for separate undeveloped parcels
dedicated as open space, wetland buffer, or park within the total area of the development.
Development areas must only be designated as forest or pasture where legal restrictions
can be documented that protect these areas from future disturbances.
Other Development Options and Model Features
The WWHM allows the flexibility of bypassing a portion of the development area around a flow
control facility and/or having offsite inflow that is entering the development area pass through
the flow control facility. Three options are available to the user:
A. Design Basin: usual development situation with no offsite inflow and no flow bypass.
B. Bypass: a portion of the development does not drain to a stormwater detention facility.
Onsite runoff from a proposed development project may bypass the flow control facility
provided that all of the following conditions are met.
1. Runoff from both the bypass area and the flow control facility converges within a
quarter-mile downstream of the project site discharge point, and
2. The flow control facility is designed to compensate for the uncontrolled bypass
area such that the net effect at the point of convergence downstream is the same
with or without bypass, and
3. The 100-year peak discharge from the bypass area will not exceed 0.4 cfs, and
4. Runoff from the bypass area will not create a significant adverse impact to
downstream drainage systems or properties, and
5. Water quality requirements applicable to the bypass area are met.
C. Offsite Inflow: an upslope area outside the development drains to the flow control facility in
the development. If the existing 100-year peak flow rate from any upstream offsite area is
greater than 50% of the 100-year developed peak flow rate (undetained) for the project site,
January 2003
Volume III – Hydrologic Analysis and Flow Control Design/BMPs
B-7
then the runoff from the offsite area must not flow to the onsite flow control facility. The
bypass of offsite runoff must be designed so as to achieve the following:
1. Any existing contribution of flows to an onsite wetland must be maintained, and
2. Offsite flows that are naturally attenuated by the project site under predeveloped
conditions must remain attenuated, either by natural means or by providing
additional onsite detention so that peak flows do not increase.
For each of these options the user inputs the number of acres in the different categories for the
predevelopment and postdevelopment land use. The WWHM computes the runoff from each
separately and adds them together, as appropriate, to check to see if the stormwater standards
have been satisfied. The following
WWHM uses this information to compute the corresponding number of acres of pervious and
impervious land and assign these acres to specific PERLNDs and IMPLNDs. These terms are
HSPF-speak for pervious land categories and impervious land categories. WWHM uses the
PERLNDS and IMPLNDS to compute postdevelopment runoff.
Application of WWHM in Re-developments Projects
WWHM allows only forest or pasture as the predevelopment land condition in the Design Basin
screen. This screen does not allow other types of land uses such as impervious and
landscaped areas to be entered for existing condition. However, WWHM can be used for
redevelopment projects by modeling the existing developed areas that are not subject to the
flow control requirements of Volume I as offsite areas. For the purposes of predicting runoff
from such an existing developed area, enter the existing area in the Offsite Inflow screen. This
screen is designed to predict runoff from impervious and landscaped areas in addition to the
forest and pasture areas. If the existing 100-year peak flow rate from the existing developed
areas that are not subject to flow control is greater than 50% of the 100-year developed peak
flow rate (undetained but subject to the flow control requirements of Volume I), then the runoff
from the offsite area must not be allowed to flow to the onsite flow control facility.
7. PERLND and IMPLND parameter values.
In WWHM (and HSPF) pervious land categories are represented by PERLNDs; impervious land
categories (EIA) by IMPLNDs. An example of a PERLND is a till soil covered with forest
vegetation. This PERLND has a unique set of HSPF parameter values. For each PERLND
there are 16 parameters that describe various hydrologic factors that influence runoff. These
range from interception storage to infiltration to active groundwater evapotranspiration. Only
four parameters are required to represent IMPLND.
The PERLND and IMPLND parameter values to be used in the WWHM are listed below. These
values are based on regional parameter values developed by the U.S. Geological Survey for
watersheds in western Washington (Dinicola, 1990) plus additional HSPF modeling work
conducted by AQUA TERRA Consultants.
B-8
Volume III – Hydrologic Analysis and Flow Control Design/BMPs
January 2003
PERLND Parameters
Name
LZSN
INFILT
LSUR
SLSUR
KVARY
AGWRC
INFEXP
INFILD
BASETP
AGWETP
CEPSC
UZSN
NSUR
INTFW
IRC
LZETP
TF
TP
TL
OF
OP
OL
SF
SP
SL
4.5
0.08
400
0.10
0.5
0.996
2.0
2.0
0.0
0.0
0.20
0.5
0.35
6.0
0.5
0.7
4.5
0.06
400
0.10
0.5
0.996
2.0
2.0
0.0
0.0
0.15
0.4
0.30
6.0
0.5
0.4
4.5
0.03
400
0.10
0.5
0.996
2.0
2.0
0.0
0.0
0.10
0.25
0.25
6.0
0.5
0.25
5.0
2.0
400
0.10
0.3
0.996
2.0
2.0
0.0
0.0
0.20
0.5
0.35
0.0
0.7
0.7
5.0
1.6
400
0.10
0.3
0.996
2.0
2.0
0.0
0.0
0.15
0.5
0.30
0.0
0.7
0.4
5.0
0.80
400
0.10
0.3
0.996
2.0
2.0
0.0
0.0
0.10
0.5
0.25
0.0
0.7
0.25
4.0
2.0
100
0.001
0.5
0.996
10.0
2.0
0.0
0.7
0.18
3.0
0.50
1.0
0.7
0.8
4.0
1.8
100
0.001
0.5
0.996
10.0
2.0
0.0
0.7
0.15
3.0
0.50
1.0
0.7
0.8
4.0
1.0
100
0.001
0.5
0.996
10.0
2.0
0.0
0.7
0.10
3.0
0.50
1.0
0.7
0.8
PERLND types:
TF = Till Forest
TP = Till Pasture
TL = Till Lawn
OF = Outwash Forest
OP = Outwash Pasture
OL = Outwash Lawn
SF = Saturated Forest
SP = Saturated Pasture
SL = Saturated Lawn
PERLND parameters:
LZSN = lower zone storage nominal (inches)
INFILT = infiltration capacity (inches/hour)
LSUR = length of surface overland flow plane (feet)
SLSUR = slope of surface overland flow plane (feet/feet)
KVARY = groundwater exponent variable (inch-1)
AGWRC = active groundwater recession constant (day-1)
INFEXP = infiltration exponent
INFILD = ratio of maximum to mean infiltration
BASETP = base flow evapotranspiration (fraction)
AGWETP = active groundwater evapotranspiration (fraction)
CEPSC = interception storage (inches)
UZSN = upper zone storage nominal (inches)
NSUR = roughness of surface overland flow plane (Manning’s n)
INTFW = interflow index
IRC = interflow recession constant (day-1)
LZETP = lower zone evapotranspiration (fraction)
A more complete description of these PERLND parameters is found in the HSPF User Manual
(Bicknell et al, 1997).
PERLND parameter values for other additional soil/vegetation categories will be investigated
and added to the WWHM, as appropriate.
January 2003
Volume III – Hydrologic Analysis and Flow Control Design/BMPs
B-9
IMPLND Parameters
EIA
Name
LSUR
SLSUR
NSUR
RETSC
400
0.01
0.10
0.10
IMPLND parameters:
LSUR = length of surface overland flow plane (feet)
SLSUR = slope of surface overland flow plane (feet/feet)
NSUR = roughness of surface overland flow plane (Manning’s n)
RETSC = retention storage (inches)
A more complete description of these IMPLND parameters is found in the HSPF User Manual
(Bicknell et al, 1997).
The PERLND and IMPLND parameter values will be transparent to the general user. The
advanced user will have the ability to change the value of a particular parameter for that specific
site. However, such changes will be recorded in the WWHM output.
Surface runoff and interflow will be computed based on the PERLND and IMPLND parameter
values. Groundwater flow will not be computed, as it is assumed that there is no groundwater
flow from small catchments that reaches the surface to become runoff. This is consistent with
King County procedures (King County, 1998).
8. Guidance for flow control standards.
Flow control standards are used to determine whether or not a proposed stormwater facility will
provide a sufficient level of mitigation for the additional runoff from land development. Guidance
is provided on the standards that must be met to comply with the Ecology Stormwater
Management Manual.
There are two flow control standards stated in the Ecology Manual: Minimum Requirement #7 Flow Control and Minimum Requirement #8 - Wetlands Protection (See Volume I).
Minimum Requirement #7 specifies flow frequency and flow duration ranges for which the
postdevelopment runoff cannot exceed predevelopment runoff. Minimum Requirement #8
specifies that discharges to wetlands must maintain the hydrologic conditions, hydrophytic
vegetation, and substrate characteristics necessary to support existing and designated
beneficial uses.
Minimum Requirement #7 specifies that stormwater discharges to streams shall match
developed discharge durations to predeveloped durations for the range of predeveloped
discharge rates from 50% of the 2-year peak flow up to the full 50-year peak flow. In addition,
the developed peak discharge rates should not exceed the predeveloped peak discharge rates
for 2-, 10-, and 50-year return periods. In general, matching discharge durations between 50%
of the 2-year and 50-year will result in matching the peak discharge rates in this range.
B-10
Volume III – Hydrologic Analysis and Flow Control Design/BMPs
January 2003
The WWHM uses the predevelopment peak flow value for each water year to compute the
predevelopment 2- through 100-year flow frequency values. The postdevelopment runoff 2through 100-year flow frequency values are computed from the outlet of the proposed
stormwater facility. The user must enter the stage-surface area-storage-discharge table (HSPF
FTABLE) for the stormwater facility. The model then routes the postdevelopment runoff through
the stormwater facility. As with the predevelopment peak flow values, the maximum developed
flow value for each water year will be selected by the model to compute the developed 2through 100-year flow frequency.
The actual flow frequency calculations are made using the federal standard Log Pearson Type
III distribution described in Bulletin 17B (United States Water Resources Council, 1981). This
standard flow frequency distribution is provided in U.S. Geological Survey program J407,
version 3.9A-P, revised 8/9/89. The Bulletin 17B algorithms in program J407 are included in the
WWHM calculations.
The WWHM compares the postdevelopment 2-year flow frequency value with the
predevelopment flood value. If the postdevelopment value is greater than the predevelopment
value then flow frequency requirement has not been met. The same test is conducted for the 5, 10-, 25-, 50-, and 100-year flow frequency values. The results are reported in the WWHM
output.
The second half of the Minimum Requirement #7 is based on flow duration. The WWHM will
use the entire predevelopment and postdevelopment runoff record to compute flow duration.
The standard requires that postdevelopment runoff flows must not exceed the flow duration
values of the predevelopment runoff between the predevelopment flow values of 50 percent of
the 2-year flow and 100 percent of the 50-year flow.
Flow duration is computed by counting the number of flow values that exceed a specified flow
level. The specified flow levels used by WWHM in the flow duration analysis are listed below.
1. 50% of the 2-year predevelopment peak flow.
2. 100% of the 2-year predevelopment peak flow.
3. 100% of the 50-year predevelopment peak flow.
In addition, flow durations are computed for 97 other incremental flow values between 50
percent of the 2-year predevelopment peak flow and 100 percent of the 50-year
predevelopment peak flow.
There are three criteria by which flow duration values are compared:
1. If the postdevelopment flow duration values exceed any of the predevelopment flow levels
between 50% and 100% of the 2-year predevelopment peak flow values (100 Percent
Threshold) then the flow duration requirement has not been met.
2. If the postdevelopment flow duration values exceed any of the predevelopment flow levels
between 100% of the 2-year and 100% of the 50-year predevelopment peak flow values
more than 10 percent of the time (110 Percent Threshold) then the flow duration
requirement has not been met.
3. If more than 50 percent of the flow duration levels exceed the 100 percent threshold then
the flow duration requirement has not been met.
The results are provided in the WWHM report.
January 2003
Volume III – Hydrologic Analysis and Flow Control Design/BMPs
B-11
Minimum Requirement #8 specifies that discharges to wetlands must maintain the hydrologic
conditions, hydrophytic vegetation, and substrate characteristics necessary to support existing
and designated beneficial uses. Criteria for determining maximum allowed exceedences in
alterations to wetland hydroperiods are provided in guidelines cited in Guide Sheet 2B of the
Puget Sound Wetland Guidelines (Azous and Horner, 1997).
Because wetland hydroperiod computations are relatively complex and are site specific, they
will not be included in the WWHM. HSPF is required for wetland hydroperiod analysis. Ecology
intends to determine the appropriate steps in using HSPF to compute hydroperiod based on
joint recommendations from wetland biologists and HSPF modelers.
WWHM Computation Steps
STEP 1. Location project site.
Drag flag to project site on map.
Zoom in or out on map, as needed.
Click on NEXT.
STEP 2. Input land area data.
Type in Name of Development, Development Address, City/County, and Project Description.
Select Standard Residential or Non-standard/Commercial.
For Standard Residential:
For Design Basin (project site) input number of acres of
Predeveloped Soils
Outwash (A&B)
Till (C)
Saturated (D)
Select Predeveloped Vegetation (Forest or Pasture)
Residential Acres
Lot Acres (excluding public right-of-ways and non-residential parcels)
Streets/Sidewalks (public right-of-ways)
Forest (undeveloped parcels only)
Pasture (undeveloped parcels only)
Landscaped Area (parks, etc., excluding residential lots)
Each of the above must be separated into A/B soils and C soils.
(NOTE: Saturated (D) soil areas should not be included in the developed
area acres as these are wetland areas.)
Number of Lots (corresponding to the total Lot Acres)
(NOTE: the user is allowed a maximum of 10 lots per acre.)
Roof Runoff Credits (if appropriate)
Infiltrate (percent of lots)
Disperse (percent of lots)
Pavement Credit (if appropriate)
Porous Pavement (private pavement areas only)
Repeat information (if necessary) for Bypass.
Repeat information (if necessary) for Offsite Inflow.
Click NEXT.
Compute Runoff now? Click Yes.
B-12
Volume III – Hydrologic Analysis and Flow Control Design/BMPs
January 2003
For Non-standard/Commercial:
For Design Basin (project site) input number of acres of
Predeveloped Soils
Outwash (A&B)
Till (C)
Saturated (D)
Select Predeveloped Vegetation (Forest or Pasture)
Non-standard Residential/Commercial
Impervious Area (Roof acres)
Landscaped Area (pervious acres)
Streets/Sidewalks/Parking
Forest (undeveloped parcels only)
Pasture (undeveloped parcels only)
Each of the above must be separated into A/B soils and C soils.
(NOTE: Saturated (D) soil areas should not be included in the developed
area acres as these are wetland areas.)
Pavement Credit (if appropriate)
Porous Pavement (percent of total Streets/Sidewalks/Parking)
Repeat information (if necessary) for Bypass.
Repeat information (if necessary) for Offsite Inflow.
Click NEXT.
Compute Runoff now? Click Yes.
STEP 3. Compute runoff.
HSPF executes for predevelopment and postdevelopment conditions.
Click NEXT.
STEP 4. Perform flow frequency analysis.
Click PERFORM to compute flow frequency values for predevelopment (black), flow duration
values for predevelopment (red), and flow frequency values for postdevelopment without
stormwater detention facility (blue).
2-Year to 100-Year flow frequency results are reported for the predevelopment and
postdevelopment without detention facility conditions. If the difference in the 100-year flow
frequency values is less than 0.1 cfs then no facility is required.
If needed to size a stormwater facility, click EXPORT to export either predevelopment,
postdevelopment (without routing through stormwater facility), or postdevelopment (with routing
through stormwater facility) runoff time series to a separate file.
Click NEXT.
STEP 5. Check stormwater detention facility.
Enter Facility Name/ID and Type of Facility.
Add Table from File or enter manually the following information:
Stage/depth (feet) starting zero
Area (acres) of surface corresponding to stage, starting at zero
Storage (acre-feet) of facility corresponding to stage, starting at zero
January 2003
Volume III – Hydrologic Analysis and Flow Control Design/BMPs
B-13
Discharge1 (cfs) from facility to surface flow, corresponding to stage, starting at zero
If the stormwater facility is an infiltration facility then click on Infiltration and enter:
Discharge2 (cfs) from facility to subsurface flow, corresponding to stage, starting at zero
NOTE:
(1)
(2)
(3)
(4)
the first row of values must be zero;
stage must increase from one row to next;
storage must increase from one row to next;
maximum number of total values cannot exceed 500.
Click NEXT.
Compute Runoff now? Click Yes.
Postdevelopment runoff is routed through the stormwater facility.
Click NEXT.
STEP 6. Perform flow frequency analysis for postdevelopment runoff with stormwater
detention facility.
Click NEXT.
STEP 7. Compare flow duration statistics for predevelopment and postdevelopment
runoff with stormwater detention facility.
Click lower PERFORM to compute flow frequency values for postdevelopment with stormwater
detention facility (black) and flow duration values for postdevelopment with facility (red).
2-Year to 100-Year flow frequency results are reported for the postdevelopment with detention
facility. Compare with predevelopment conditions.
Change 110 Percent Threshold (default value) if required by Ecology or local jurisdiction,
otherwise use default value.
Click Perform Statistical Analysis to compare predevelopment and postdevelopment flow
duration values.
Identify which values passed or failed the test.
Click NEXT.
STEP 8. Ecology Flow Control Standard Summary.
Summary information shows whether the stormwater facility passes or fails the Ecology flow
control standard.
To view a complete listing of the input and output information:
(1) save the file (File, Save Project As, enter File name, Save)
(2) click Generate Report
(3) view and/or print Report
To exit the WWHM: File, Exit
B-14
Volume III – Hydrologic Analysis and Flow Control Design/BMPs
January 2003
References for Western Washington Hydrology Model
Beyerlein, D.C. 1996. Effective Impervious Area: The Real Enemy. Presented at the
Impervious Surface Reduction Research Symposium, The Evergreen State College. Olympia,
WA.
Bicknell, B.R., J.C. Imhoff, J.L. Kittle Jr, A.S. Donigian Jr, and R.C. Johanson. 1997.
Hydrological Simulation Program – Fortran User’s Manual for Version 11. EPA/600/R-97/080.
National Exposure Research Laboratory. Office of Research and Development. U.S.
Environmental Protection Agency. Research Triangle Park, NC.
Dinicola, R.S. 1990. Characterization and Simulation of Rainfall-Runoff Relations for
Headwater Basins in Western King and Snohomish Counties, Washington. Water-Resources
Investigations Report 89-4052. U.S. Geological Survey. Tacoma, WA.
King County. 1998. Surface Water Design Manual. Department of Natural Resources.
Seattle, WA.
United States Water Resources Council. 1981. Guidelines for Determining Flood Flow
Frequency. Bulletin #17B of the Hydrology Committee. Washington, DC.
January 2003
Volume III – Hydrologic Analysis and Flow Control Design/BMPs
B-15