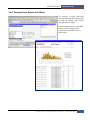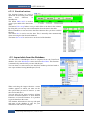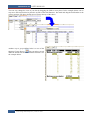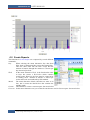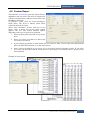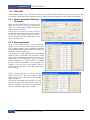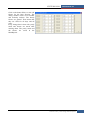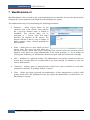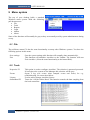
1
User Manual PassCheck 3G USER MANUAL] Version 1.31 Date: 2008-03-30 COPYRIGHT NOTICE This manual is a publication of Actron AB, and is provided for use by its customers only. The contents of the manual are copyrighted by Actron AB.; reproduction in whole or in part, for use other than in support of Acton’s equipment, is prohibited without the specific written permission of Actron AB. WARRANTY Actron AB warrants each System Product to be free from electrical and mechanical defects in materials and workmanship for a period of one year from the date of shipment. This warranty does not apply to defects in the Products caused by abuse, misuse, accident, casualty, alteration, negligence, repair not authorized by Actron AB, use on current or voltages other than specified by Actron, or application or installation not in accordance with published installation manuals. This warranty is in lieu of any other warranty either expressed or implied. Acton’s liability is limited to the repair or replacement of the System Product only, and not costs of installation, removal, or damage to user’s property or other liabilities. If Actron is unable to repair or replace a nonconforming Product, it may offer a refund of the amount paid to Actron for such Component in full satisfaction of its warranty obligation. Maximum liability of Actron is the cost of the Product. Information furnished by Actron AB, is believed to be accurate and reliable. However, no responsibility is assumed by Actron AB for the use of this information or for any infringements of patents or other rights of third parties which may result from its use. No license is granted by implication, or otherwise, under any patent or patent rights of Actron AB. Actron retains the right to revise or change its products and documentation at any time without notice. SUPPORT This manual is designed to provide the necessary information for trouble-free use of your new System. However, if you need assistance, please e-mail PassCheck Support at Actron: [email protected] or visit our web site at www.passcheck.com. Windows and Excel is Registered Trademark for Microsoft Corporation. Copyright © 2005 - 2007 Actron AB. All rights reserved 2 0BWelcome to PassCheck the Reliable People Counting System | Actron AB [] USER MANUAL PassCheck 3G TABLE OF CONTENTS: 1 Welcome to PassCheck the Reliable People Counting System ..................................7 1.1 The Hardware Technology ......................................................................................................................................... 7 1.1.1 Thermo Sensors ................................................................................................................................................ 7 1.1.2 Beam Sensors.................................................................................................................................................... 8 1.1.3 The Data Logger ............................................................................................................................................... 8 1.1.4 The PC .............................................................................................................................................................. 9 1.2 The Software Technology .......................................................................................................................................... 9 1.2.1 AutoMaxi – The Basic User Interface .............................................................................................................. 9 1.2.2 Database............................................................................................................................................................ 9 1.2.3 Report and Analyse ........................................................................................................................................... 9 1.3 Installation and Calibration ...................................................................................................................................... 10 1.4 Start your PassCheck 3G Application ...................................................................................................................... 11 1.5 Main Functions ......................................................................................................................................................... 11 2 3 Using Quick Reports .....................................................................................................12 Using MaxiCrystal II - Web Reports .............................................................................13 3.1 Login ........................................................................................................................................................................ 13 3.2 Set-up of the report type ........................................................................................................................................... 13 3.2.1 Report Type (Absolute / Relative) .................................................................................................................. 13 3.2.2 Report Type .................................................................................................................................................... 14 3.2.3 Templates ........................................................................................................................................................ 14 3.2.4 Custom Reports............................................................................................................................................... 15 3.2.5 Disable Custom Names ................................................................................................................................... 15 3.3 Report Designer........................................................................................................................................................ 15 3.3.1 Filter by Site/Category .................................................................................................................................... 15 3.3.2 Filter by Entrances, Zones .............................................................................................................................. 15 3.3.3 List of Entrances, Zones ................................................................................................................................. 16 3.3.4 Type ................................................................................................................................................................ 16 3.3.5 Direction ......................................................................................................................................................... 16 3.3.6 Date / Time ..................................................................................................................................................... 16 3.3.7 Run report ....................................................................................................................................................... 16 3.3.8 Add new Plot .................................................................................................................................................. 16 3.3.9 Selection List .................................................................................................................................................. 16 3.3.10 Sum or Average ............................................................................................................................................ 16 3.3.11 Name (for Sum and Average) ....................................................................................................................... 16 3.3.12 Optional report info ...................................................................................................................................... 17 3.3.13 Add Offset Plot ............................................................................................................................................. 17 3.3.14 Add as percent Base ..................................................................................................................................... 17 3.3.15 Report Type .................................................................................................................................................. 17 3.3.16 Chart Type .................................................................................................................................................... 17 3.3.17 Template Name ............................................................................................................................................ 17 3.3.18 Save as Template .......................................................................................................................................... 17 3.4 Hour Report .............................................................................................................................................................. 18 3.4.1 Example Absolute Hour Report ...................................................................................................................... 18 3.4.2 Example Hour Report with Offset .................................................................................................................. 19 3.4.3 Day Report ...................................................................................................................................................... 20 3.5 Week Report............................................................................................................................................................. 21 3.6 Month Report ........................................................................................................................................................... 22 3.7 Year Report .............................................................................................................................................................. 23 3.8 High Resolution Report ............................................................................................................................................ 24 3.9 Occupation Hour Report .......................................................................................................................................... 24 3.10 Custom Report ..................................................................................................................................................... 25 3.11 Selections and Information in the Report Header ................................................................................................ 26 3.11.1 Report Type .................................................................................................................................................. 26 3.11.2 Report time period ........................................................................................................................................ 26 3.11.3 Printout time ................................................................................................................................................. 26 3.11.4 Page Number ................................................................................................................................................ 26 Actron AB | 0BWelcome to PassCheck the Reliable People Counting System 3 PassCheck 3G 3.11.5 3.11.6 3.11.7 3.11.8 3.11.9 4 USER MANUAL] Software Revision ........................................................................................................................................ 26 Print .............................................................................................................................................................. 26 Page Navigation ........................................................................................................................................... 27 Zoom the Report ........................................................................................................................................... 27 Export ........................................................................................................................................................... 27 Using MaxiVis ................................................................................................................28 4.1 Definitions ................................................................................................................................................................ 28 4.2 Login ........................................................................................................................................................................ 28 4.3 Standard Interface..................................................................................................................................................... 29 4.3.1 Pop-Up ............................................................................................................................................................ 29 4.3.2 Map Menu ....................................................................................................................................................... 29 4.3.3 MaxiVis Objects ............................................................................................................................................. 30 4.3.3.1 Arrows...................................................................................................................................................... 30 4.3.3.2 Double Arrows ......................................................................................................................................... 30 4.3.3.3 Zones ........................................................................................................................................................ 30 4.3.3.4 Value Observer Objects ........................................................................................................................... 30 4.3.3.5 Zoom ........................................................................................................................................................ 31 4.3.3.6 Text Object............................................................................................................................................... 31 4.3.3.7 Line Objects ............................................................................................................................................. 31 4.3.3.8 Custom Objects ........................................................................................................................................ 31 4.3.4 Properties Window (Arrow, Double Arrow and Zone)................................................................................... 31 4.4 Administrator interface............................................................................................................................................. 32 4.4.1 Uploading new maps ...................................................................................................................................... 32 4.4.2 Active Layer ................................................................................................................................................... 32 4.4.3 Creating and modifying objects ...................................................................................................................... 33 4.4.3.1 Arrows, Double Arrow and Zones ........................................................................................................... 33 4.4.3.2 The Zoom object ...................................................................................................................................... 33 4.4.3.3 Text Object............................................................................................................................................... 34 4.4.3.4 Line Objects ............................................................................................................................................. 34 4.4.3.4.1 Handles .............................................................................................................................................. 34 4.4.3.4.2 Creating multiple lines ...................................................................................................................... 34 4.4.3.4.3 Colour and Comments ....................................................................................................................... 34 4.4.3.5 Value Observers ....................................................................................................................................... 35 4.4.3.6 Custom Objects ........................................................................................................................................ 35 4.4.4 The Zoom object ............................................................................................................................................. 36 4.4.5 Layers ............................................................................................................................................................. 36 4.4.5.1 Layer-User Management .......................................................................................................................... 36 4.4.6 User Management ........................................................................................................................................... 36 4.5 Simulation ................................................................................................................................................................ 37 4.6 Zooming ................................................................................................................................................................... 37 4.7 Tools ......................................................................................................................................................................... 37 4.8 Guest Interface ......................................................................................................................................................... 38 5 Using MaxiGraph II ........................................................................................................39 5.1 Login ........................................................................................................................................................................ 40 5.2 Setup the Graph to be displayed ............................................................................................................................... 40 5.2.1 Disable customer names ................................................................................................................................. 41 5.2.2 Filter by Site/Category .................................................................................................................................... 41 5.2.3 Flow/Occupancy ............................................................................................................................................. 41 5.2.4 List of Entrances, Zones ................................................................................................................................. 41 5.2.5 Add to Selection list ........................................................................................................................................ 41 5.2.6 Open Template................................................................................................................................................ 42 5.2.7 Open................................................................................................................................................................ 42 5.2.8 Delete .............................................................................................................................................................. 42 5.2.9 Direction ......................................................................................................................................................... 42 5.2.10 Type .............................................................................................................................................................. 42 5.2.11 Selection List ................................................................................................................................................ 42 5.2.12 Delete selection(s) ........................................................................................................................................ 42 5.2.13 Save as Template .......................................................................................................................................... 42 5.2.14 Initial display ................................................................................................................................................ 42 5.2.15 Save .............................................................................................................................................................. 42 4 0BWelcome to PassCheck the Reliable People Counting System | Actron AB [] USER MANUAL PassCheck 3G 5.2.16 Display Graph............................................................................................................................................... 42 5.3 Graph ........................................................................................................................................................................ 43 5.3.1 Type ................................................................................................................................................................ 43 5.3.2 Real time Display............................................................................................................................................ 43 5.3.3 Date ................................................................................................................................................................. 43 5.3.4 Set Date ........................................................................................................................................................... 44 5.3.5 Zoom Selected ................................................................................................................................................ 44 5.3.6 Zoom out ......................................................................................................................................................... 44 5.3.7 Zoom All ......................................................................................................................................................... 44 5.3.8 Move ............................................................................................................................................................... 44 5.3.9 Now ................................................................................................................................................................ 44 5.3.10 Flow/Occupancy per minute axis ................................................................................................................. 44 5.3.11 Time axis ...................................................................................................................................................... 44 5.3.12 Selected area ................................................................................................................................................. 44 6 Using MaxiReport ..........................................................................................................45 6.1 MaxiReport Menu .................................................................................................................................................... 45 6.2 Sheets ....................................................................................................................................................................... 45 6.2.1 ”Hour”............................................................................................................................................................. 45 6.2.1.1 Function buttons ....................................................................................................................................... 46 6.3 Import data from the Database ................................................................................................................................. 46 6.4 Make Table ............................................................................................................................................................... 47 6.5 Create Reports .......................................................................................................................................................... 50 6.6 Custom Report.......................................................................................................................................................... 51 6.6.1 Example .......................................................................................................................................................... 53 6.7 Forecast .................................................................................................................................................................... 54 6.7.1 How to generate a forecast of visitors ............................................................................................................. 54 6.7.2 Forecast factors ............................................................................................................................................... 54 7 8 9 MaxiWebAdmin II ...........................................................................................................56 Hide .................................................................................................................................57 Menu system ..................................................................................................................58 9.1 9.2 9.3 9.4 9.5 9.6 File............................................................................................................................................................................ 58 Tools ......................................................................................................................................................................... 58 Reports ..................................................................................................................................................................... 59 Logon ....................................................................................................................................................................... 59 Admin ....................................................................................................................................................................... 59 About ........................................................................................................................................................................ 60 Appendix A: How a system is configured ..........................................................................61 Appendix B: Accuracy theory for occupancy ...................................................................64 Accuracy ............................................................................................................................................................................ 66 Test of accuracy ............................................................................................................................................................ 66 Actron AB | 0BWelcome to PassCheck the Reliable People Counting System 5 PassCheck 3G USER MANUAL] 6 0BWelcome to PassCheck the Reliable People Counting System | Actron AB [] USER MANUAL PassCheck 3G 1 Welcome to PassCheck the Reliable People Counting System Your PassCheck 3G system is installed in order to continuously count the amount of visitors in your building or facility. The system consists of both hardware and software applications. Hardware in the form of sensors together with local controllers at each entry point (an entry point can be an External Entrance to the Facility or an Internal Entrance between different parts of the Facility). We use different types of sensors depending on the type of entrance; it can be Thermal Camera systems, Beam Sensors or other types that provides the accuracy needed for your entrances. All entry points are bound together to one system, the Software System, through a Network connected to a central computer where the AutoMaxi application program is running. This manual instructs you how to use the PassCheck 3G People Counting System by describing the functions that are available for you to use. The main part of this manual is based on how to create a report on your visitor statistics. 1.1 The Hardware Technology Actron is constantly scanning the market for the best and most cost effective hardware solutions to make the PassCheck system accurate and reliable. We try to use components from Industrial Automation, as these components normally are more reliable then components designed for Office Automation. Below do we have short descriptions over the hardware technologies that we use in PassCheck 3G systems. 1.1.1 Thermo Sensors One of the basic sensors used in the PassCheck 3G systems are the Thermal Cameras – MaxiTherm. MaxiTherm exist in two basic versions one for indoor use and one for outdoor use. The sensors can be equipped with a lens for ether 60º, 40º or 20º field of view, that means, they are prepared to be mounted on different heights over the entrance. MaxiTherm is a people counting sensor with the imaging optics, sensor, signal processing and interfacing electronics all contained within a plastic housing as above. The unit normally used in a downward looking manner, with an unhindered view of the target area. The unit functions optically, seeing the heat emitted by people passing underneath as Infra-Red radiation, through a lens with a 60º, 40º or 20º field of view. The sensing area is a square on the floor whose width is approximately equal to the mounting height; at 3.5m the unit ‘sees’ a 3.5x3.5m square on the floor (with a 60º lens). Mounting height ranges from 2.5-4.5 meters can be Actron AB | 0BWelcome to PassCheck the Reliable People Counting System 7 PassCheck 3G USER MANUAL] covered with the standard 60º lens option. The units may be used as single counting nodes, linked into the controller unit. During installation and setup a virtual counting-line is defined in the MaxiTherm internal software using a set-up tool, usually on PC, and counting occurs when people passing through the camera image and crosses the counting line in a defined direction. Rapid installation is possible and the ‘cost of installation’ is, therefore, low. The picture shows how MaxiTherm detect a person passing through an entrance. 1.1.2 Beam Sensors When using beam sensors we have installed over the entrance in a frame, that we call a ramp. The ramp contains of infra-red photo sensors with a distance from each other of approximate 55 cm. These are installed in a line with the purpose to count the total number of visitors and with the use of double photo sensors indicating the direction of transits, i.e. if a transit is either in or out of the building. The photoelectric sensors (photo sensor) are infra-red sensors that are guaranteed harmless for humans and animals and accepted by worldwide authorities for public usage. The sensors will recognize objects. This means that an infrared light beam is sent out a distance from the photocell in the ramp (about 0.2 m – 2.5 m). The distance is programmed to detect objects that are approx. 130 cm above the floor-level. When the sensor gets a reflection of an object it will generate a signal to the controller unit located in the ramp or in a unit mounted separately close to the ramp. . The system operates with distributed intelligence preformed by a controller system called PLC, Programmable Logical Controller, in each ramp. 1.1.3 The Data Logger The sensor is connected to a data logger. The logger shall be mounted close to the sensors. The main component in the logger is a PLC – Programmable Logical Controller. PLCs are the most stable computing components as they normally are used in production lines for Industrial Automation. Each logger can administrate up to 5 ramps (locally) and up to 30 controllers can be connected on the two-wire loop. The use of more than one ramp to a controller will shorten the number of days that data will be saved. The embedded PLC application software are special designed to compute, register and save each transit, in or out to provide an accurate counting for all types of entrances. All of this information is counted continuously and saved in a special memory buffer. It normally saves for each hour the amount of in and out transits per entrance together with the entrance number, time and date. Then this saved data can be remotely read from the system PC via different types of communications, i.e. a Wire loop, Radio or Ethernet. Normal is a two-wire loop used. This loop is connected to the PCs serial port via a communication adapter. The local controller, in its standard application, can save this data up to 33 days. This means, in this case that if something happens with the PC or the communication to each controller; it can be down for more than 33 days without the system is losing any data. 8 0BWelcome to PassCheck the Reliable People Counting System | Actron AB [] USER MANUAL PassCheck 3G 1.1.4 The PC The PC that acts as the main server for the application and storage of data is a standard of the shelf PC with preinstalled software from Actron. The PC is normally equipped with a communication adapter for the type of communication used with the controllers. The PC shall always be connected to the internet to make it possible for Actron to give online support. 1.2 The Software Technology The PC software is based on standard Windows components such as Databases and other software components. As a base the PC needs as a minimum Windows 2000 or Windows XP and Microsoft Excel. The communication between the PLC and the PC is handled by the program AutoMaxi. 1.2.1 AutoMaxi – The Basic User Interface AutoMaxi is your main interface and the kernel for the PassCheck 3G system. From this screen you can start and run all report applications available in the system, as well as configure and maintain the system The main screen holds the online presentation of how many people that has entered the building or facility. You have a possibility to change the “skin” used and move the different objects, such as buttons and online presentations to different places that suite you more than the standard setup. 1.2.2 Database The main component in PassCheck 3G and AutoMaxi is the database. As a standard are we using Microsoft SQL Database Server. It is possible to use other SQL databases. All readings from the controllers are stored in the database, as well as all system settings. 1.2.3 Report and Analyse Standard reports are done with the WEB Report function. This simplifies the users work with the system as the system automatically can send reports to the people that need them regularly. Actron AB | 0BWelcome to PassCheck the Reliable People Counting System 9 PassCheck 3G USER MANUAL] Administration of the WEB report is easy and can be done by all authorised users. They can easy select the entrances that shall be included in the report and if a diagram shall be included or not. The reports can be generated in many different formats, such as MS Excel, MS Word or Adobe Acrobat. The more advanced report and analyse tool are MaxiReport. MaxiReport are a MS Excel based tool that retrieves information from the SQL Database and depending on the user is filtrated and turned to give the user the view of the information needed. 1.3 Installation and Calibration To get as correct values as possible all PassCheck 3G systems must be correct installed and calibrated. The calibration is used to statistically correct readings of the in and out footfall. This calibration has to be done to correct people’s behaviour at the different types of entrances. To work correctly it is essential that the system is installed in a proper way. First of all must all entrances be covered with ramps and sensors. If this is not done it is impossible to get correct figures for the occupancy. The sensors shall be mounted as close to the entrance as possible. When using Beam-sensors, it is very important as a first adjustment measure to check that all photo sensors are completely parallel/straight in pairs. The requirement of parallelism applies for all directions, in height and depth as well as laterally. Each ramp shall be calibrated for the entrance in which it is mounted. The reason is the different behaviour of the people that enters to different entrances. This calibration is done with the PassCheck system terminal and manually counting of the number of people passes the entrance. This procedure will give an automatic calibration figure to the specific ramp. See Appendix A for description on system setup. 10 0BWelcome to PassCheck the Reliable People Counting System | Actron AB [] USER MANUAL PassCheck 3G 1.4 Start your PassCheck 3G Application If PassCheck 3G main program AutoMaxi is not running please start it by locating the AutoMaxi icon on the desktop, or start the AutoMaxi application from the START menu. When AutoMaxi is started you will have the following screen (front end) on your computer. The AutoMaxi front end will cover your complete desktop. From this front end can you control all function in you PassCheck 3G application. Please observe that it is possible to alter this screen by different skin or by locate the buttons and information on different places. These settings will help you to become more comfortable with the AutoMaxi application and working with your customer statistics and reports. Descriptions about how to do the screen settings is located later this document. 1.5 Main Functions The main functions in PassCheck 3G are easy to located and start from you AutoMaxi desktop. The functions are: ) Quick Reports A number of quickly accessible functions and reports. The types of reports for this menu function are configured at set-up and is easy to change or up-date. ) Web Report Generate reports in different format that can send to users automatically or send when generated. ) Graph analyse Maxi Graph a graphical analyse tool which tracks flow, trends, occupancy, average visiting times and other key factors. ) MaxiReport This is an Excel-based software toolkit that imports data from the PassCheck database. The user then has the possibility to analyse the data and create reports. The built-in functions of MaxiReport are easily located thru the MaxiReport menu. ) MaxiVis The MaxiVis gives the user a graphical on-line visualisation of the occupancy in predefined areas and the people flow at the entrances. The screen shows by colour information and real-time figures the hot and cold zones. (Optional software). ) Admin Administration tool for users, such as report admin, web admin and user admin. Actron AB | 0BWelcome to PassCheck the Reliable People Counting System 11 PassCheck 3G ) Hide USER MANUAL] Hides the AutoMaxi desktop, the program runes in the background. To get the desktop back, click on the AutoMaxi icon in the lower left corner. 2 Using Quick Reports The Function Quick reports are a possibility with one button to lunch Web Reports or any other application you may need. When activating Quick Reports you get a menu with the reports your administrator has setup as available. This menu is easy to change functions in or add new menu items. This set up is normally done during commission. 12 1BUsing Quick Reports | Actron AB [] USER MANUAL PassCheck 3G 3 Using MaxiCrystal II - Web Reports The best and the easy way to create reports in your PassCheck 3G systems are to use the MaxiCrystal II Web Reports. These reports can be generated either manual or automatic. We will describe both methods below. The reports use the historical data stored in the database. 3.1 Login The user interface for MaxiCrystal II is a WEB browser. The application is password protected. The passwords are administrated in MaxiWebAdmin. MaxiCrystal will per default use the browser (users) locale language as long as this translation is available. If the browsers language does not exist a default language is predefined and used in this case, this can also manually be chosen with the tick box “Use standard language”. Custom translations can be added without reinstalling. 3.2 Set-up of the report type The set-up page for the report type will appear after the login. From this page shall the user select if he need a new report or if he want to run a predefined report. If the user has a predefined report can he select it from the list on the left side of the set-up page by pressing the link run. If the user has to define a new report can he define it as ether “Absolute” or “Relative”. 3.2.1 Report Type (Absolute / Relative) Absolute a report defined from a specified time and date to a specified time and date. These reports are normally used when you need a special report for a time period. Relative The Relative Time Reports is used when you for example every Monday need a report over the visitors from last week. Actron AB | 2BUsing MaxiCrystal II - Web Reports 13 PassCheck 3G USER MANUAL] The generation and build-ups of the reports are the same for both groups; the only difference is that for Relative Reports you must save the report setup as a template that can be called to run automatically. 3.2.3 3.2.2 3.2.4 3.2.5 3.2.1 3.2.2 Report Type The following report types can be generated: Year report – an accumulated report for the selected years. Month report – an accumulated report for the selected months. Week report – an accumulated report for the selected weeks. Day report – an accumulated report for the selected days. Hour report – report for the selected hours. High Resolution Report – report with higher resolution then hour (normally 15 min) Occupancy Hour Report – report for the occupancy in selected areas Normally you will adapt your type of report show you the information you need to investigate or report. By selecting a report type and “Absolute” or “Relative” you will open up the “Report Designer” ( see 4.3) for the report type. 3.2.3 Templates List of existing earlier created Templates. You can run a template by pressing “Run”. Or delete a template by pressing “Delete”. 14 2BUsing MaxiCrystal II - Web Reports | Actron AB [] USER MANUAL PassCheck 3G 3.2.4 Custom Reports In some cases customers may need special reports; these reports can then be selected in this field. 3.2.5 Disable Custom Names Custom for entrances can be set in WebAdmin. The use of the custom namess can be disabled by selecting this function. 3.3 Report Designer 3.3.1 3.3.9 3.3.2 3.3.4 3.3.3 3.3.5 3.3.10 3.3.6 3.3.11 3.3.8 3.3.17 3.3.7 3.3.18 3.3.12 3.3.13 3.3.14 3.3.15 3.3.16 3.3.1 Filter by Site/Category Select only the Entrances/passages or Zones that belongs to a category or a Site. This function is good when you work with large sites or Cooperate solutions. 3.3.2 Filter by Entrances, Zones Select if you need to make a Report over Entrances/passages or Zones. This list can be filtered by selection of site(s) or Category. Actron AB | 2BUsing MaxiCrystal II - Web Reports 15 PassCheck 3G USER MANUAL] 3.3.3 List of Entrances, Zones List of all Entrances/passages or Zones. This list can be filtered by selection of site(s) or Category. Select the entrances that shall be included in the report. You can select one or more entrances. If you select more than one press the control key and select the entrances you need for the report. 3.3.4 Type Use to select/filter the type of entrance. You can select between: “All Entrances”, “Internal”, “External” or “Parking”. This selection is not available when occupancy is selected. 3.3.5 Direction Used as a selection/filter function for the selection. You can select between “All”, “Positive/In” or “Negative/Out”. This selection is not available when occupancy is selected. • All – all directions for all entrances, internal and external. • Positive/In – only the figures for people enter into the building (area) or in to a zone thru an internal entrance. • Negative/Out – only the figures for people leaving the building (area) or out from a zone thru an internal entrance. 3.3.6 Date / Time Selection time period for the report, this setting will depending on the type of report the user is designing. 3.3.7 Run report Generate a report from the settings. 3.3.8 Add new Plot Button to add a selection to the “Selection list”, this selection can be repeated if you need more selections to the list. 3.3.9 Selection List List and displays the selected Entrances or zones. 3.3.10 Sum or Average Setting if he data shall be presented as: Average – presents an average of the data for each time stamp and entrance selected. Sum – presents a summation of the data for each time stamp and entrance selected. 3.3.11 Name (for Sum and Average) 16 2BUsing MaxiCrystal II - Web Reports | Actron AB [] USER MANUAL 3.3.12 PassCheck 3G Optional report info Additional information included that will be included in the report. 3.3.13 Add Offset Plot To be used if you need to compare the data selected with data from other entrances or another time period. 3.3.14 Add as percent Base Used as base when m comparison with other entrances or other time periods. It is a very common case that you want to compare one or more entrances/zones in % of something else, e.g. the total. Select the entrances that shall be the base for the comparison. Then press the button “Add as Percent Base” to define what shall represent as base for the comparison. After that you select a comparison and define what entrances/zones that are going to be compared against the base reference. 3.3.15 Report Type Select the type of presentation you need for your report. You can select between • Chart – Generates a Chart over the selected data. • Table – Generates a table of the selected data from the database. • Chart and Table – Generates a report with a chart in the top and the data below. 3.3.16 Chart Type Select type of chart to be used in the report. Bar graph chart or Line based chart. 3.3.17 Template Name Input box to enter the name for the Template. 3.3.18 Save as Template The report that you have configured in the Selection List can be saved as a template to be used later. The selected items is saved when you give the template a name in this box and pres the “Save” button. This option is suitable for Relative Reports; there isn’t normally any use for this in Absolute Reports. But you may want a quick way to get the same report every time you go to the web reports, then this is useful even for fixed reports. Actron AB | 2BUsing MaxiCrystal II - Web Reports 17 PassCheck 3G USER MANUAL] 3.4 Hour Report Start to generate an “Hour Report” by selecting this report type in the start page (see 4.2). The Hour Report show the information on hourly basis from the first hour on the “From date” until the last hour on the “To date” 3.4.1 Example Absolute Hour Report In this example have we generated an Hour report for one day with a bar graph and data. The two entrances are manually selected from the Entrance list, together with the time for the report in Report Designer. 18 2BUsing MaxiCrystal II - Web Reports | Actron AB [] USER MANUAL PassCheck 3G 3.4.2 Example Hour Report with Offset To compare a report with data from another time period may this be done by setting a time offset and generate the report. In this example did we to the data from our first example add a comparison with data from 24 hour earlier. Actron AB | 2BUsing MaxiCrystal II - Web Reports 19 PassCheck 3G USER MANUAL] 3.4.3 Day Report The settings to generate a Day Report are similar to the settings for Hour Report. The only difference is that the report only shows the total number of people for each selected day and entrance. 20 2BUsing MaxiCrystal II - Web Reports | Actron AB [] USER MANUAL PassCheck 3G 3.5 Week Report The settings to generate a Day Report, the only difference are that you have to select year and week numbers for the report. The week number definition follows international standards. The report shows the total number of people for each selected week and entrance. Actron AB | 2BUsing MaxiCrystal II - Web Reports 21 PassCheck 3G USER MANUAL] 3.6 Month Report The Month Report generation are similar with the other reports. The only difference is that you only select year and month for this report 22 2BUsing MaxiCrystal II - Web Reports | Actron AB [] USER MANUAL PassCheck 3G 3.7 Year Report The year report shows the total passages at the selected entrances. To generate this: select entrances, the year(s) and press “Run Report”. Actron AB | 2BUsing MaxiCrystal II - Web Reports 23 PassCheck 3G USER MANUAL] 3.8 High Resolution Report Not implemented in this version. 3.9 Occupation Hour Report 24 2BUsing MaxiCrystal II - Web Reports | Actron AB [] USER MANUAL PassCheck 3G 3.10 Custom Report Several custom reports may be available. They can be selected in the same way as the other reports. See example below. Actron AB | 2BUsing MaxiCrystal II - Web Reports 25 PassCheck 3G USER MANUAL] 3.11 Selections and Information in the Report Header The gray header consists of a few options that may be useful. 3.10.6 3.10.7 3.10.8 3.10.4 3.10.3 3.10.9 3.11.1 3.10.2 3.10.1 3.10.5 Report Type Information about the type of report generated. This can be • Year Report • Month Report • Week Report • Day Report • Hour Report • High Resolution Report • Occupancy Report • Custom Report 3.11.2 Report time period Shows the time period for the report generated. 3.11.3 Printout time Displays the actual time and date when the report was created. 3.11.4 Page Number The actual page number and total number of pages used for the report. 3.11.5 Software Revision Displays of the version number for the software module MaxiCrystal II. 3.11.6 Print 26 2BUsing MaxiCrystal II - Web Reports | Actron AB [] USER MANUAL PassCheck 3G Press this button when you need to print the report. 3.11.7 Page Navigation Buttons and indications used to navigate between the different report pages. 3.11.8 Zoom the Report To get a better view of the graph and the table is it possible to zoom into the information. 3.11.9 Export This function is used to export the Report to one of the following formats: x Crystal Reports (RPT) x Acrobat format (PDF) x MS Word x MS Excel 97-2000 x MS Excel 97-2000 (data only) x Rich Text Format When export is selected the menu to the right will appear. Select the Export format from the dropdown menu and select how many pages that shall be exported to the selected report. The example to the left is a exported report in Acrobat format. Actron AB | 2BUsing MaxiCrystal II - Web Reports 27 PassCheck 3G USER MANUAL] 4 Using MaxiVis MaxiVis is the graphical online toll to monitor the PassCheck system. The squares will show the occupancy with colour marking from cold to hot (blue, green, yellow, orange and red). The arrows will show the flow of people in entrances or passages from cold to hot (blue, green, yellow, orange and red) During set-up can the administrator set the following parameters: - The interval for each colour A level for generating a physical alarm. To which an output from the Control Unit can be connected. A level when an automated SMS will be sent, to whom and information in the message. A level when an automated email will be sent, to whom and information in the message. 4.1 Definitions • • • • • Map: The word map is used in MaxiVis as the common definition for the plane over the mall (Shopping centre). Layer: A layer is a placeholder for MaxiVis Objects (see below). A map can have several layers. MaxiVis Objects: Arrows, Double Arrows, Zones, Value observers, Text fields, Custom objects (pictures), Lines and Zoom objects. Arrows, Zones and Value observers are graphical representations of the counting at entrances/passages and zones. Online value: The number of detections recorded at an entrance/passage per minute, hour or day. Entrance/passage: An entrance or passage monitored by sensors used by AutoMaxi to record the passages in a database available for MaxiVis. 4.2 Login Enter your username and password if you wish to log in as administrator or standard user. Select your login type from the dropdown box and click the login button. To log in as guest no username or password is required. 28 3BUsing MaxiVis | Actron AB [] USER MANUAL PassCheck 3G 4.3 Standard Interface After logging in to MaxiVis you will start with the predefined map of the system. 4.3.1 Pop-Up The pop-up is displayed when the mouse cursor is moved over a MaxiVis object (4.3.4). It displays the exact on-line count held within the selected object. The pop-up has three buttons (from the left); the first will open a webpage if any is connected to the object (set by administrator), the second will pin down the pop-up and make it stick to the screen even when the cursor is moved outside the object, the third allows the pop-up to be dragged. 4.3.2 Map Menu The Map Menu is visible at all times. Select a map in the list to show it and together with the objects connected to its layers in the main window. When a map is selected its layers will show in the map menu in a classical tree-way style. Selecting one or several of the layers on the map menu will show Actron AB | 3BUsing MaxiVis 29 PassCheck 3G USER MANUAL] only those layers, hiding the objects on the other layers. Multiple selections are done using standard Ctrl and/or Shift clicks. A separate way to navigate between maps is using the zoom/navigation icons. Press the Show Previews button to display an overview of all available maps. The menu item Make current Start Map will define the current selected map as the default map at start-up. 4.3.3 MaxiVis Objects The MaxiVis Objects consist of shapes and icons that are displayed on top of maps in the main window. The first three objects are connected to entrances/passages and get their online values from a database. The online value is displayed as a number in the centre of the object. The colour of these objects is set by the objects threshold levels for the online value. When the online value is above the highest threshold value the object becomes red to illustrate a critical level as in figure. The colours for other threshold levels are orange, yellow and green which can be seen in the Object Properties panel along with other properties. 4.3.3.1 Arrows As entrances which Arrows are connected to can have two directions; in or out, Arrows have a direction property. An arrow that is set to in has an inward curved tip and arrows set to out have outward curved tips. 4.3.3.2 Double Arrows Double Arrows consist of two arrows that are connected to the same entrance but have different directions. 4.3.3.3 Zones While Arrows and Double arrows mainly are connected to entrances/passages, the Zone objects are connected to zones, representing a larger area. A zone represents the occupancy within a defined area; each zone is defined by the entrances/passages to this area. 4.3.3.4 Value Observer Objects The Value Observer Object is used to display the number of passages at a specific entrance. The object can display the number of passages per minute, per hour or per day. 30 3BUsing MaxiVis | Actron AB [] USER MANUAL PassCheck 3G 4.3.3.5 Zoom By clicking this object another map will be displayed. The Zoom object in figure is set to zoom out to an overlooking map while the one in figure is set to zoom in. 4.3.3.6 Text Object The text object is used to include text information in the map. 4.3.3.7 Line Objects The line object is used to include lines in the map. 4.3.3.8 Custom Objects Custom objects (pictures) may be included into the map to highlight a function or a position. 4.3.4 Properties Window (Arrow, Double Arrow and Zone) A user always uses the administrator’s settings for colour intervals and levels of different alarms unless the user sets his or her own settings. To do this, press button to show the properties window. This window looks the same for both: Arrow, Double Arrow and Zone objects. Threshold values for object colour indication are entered as well as levels for alerts and notifications to output, SMS and e-mail. A URL can also be entered for these objects. The webpage can be accessed by clicking the link button in the pop-up that is displayed in “standard user mode”. Actron AB | 3BUsing MaxiVis 31 PassCheck 3G USER MANUAL] 4.4 Administrator interface When a user is logged in as an administrator MaxiVis Objects, maps and data can be modified. A menu for creating objects is available on the left side of the application. 4.4.1 Uploading new maps MaxiVis support most common image formats for maps (jpeg, png & gif). To upload a new map, click the “Upload new map” button in the map menu. When a map is selected and uploaded from the file system it will appear in the Map menu and is displayed in the main window when clicked. 4.4.2 Active Layer Each map has an “active layer”, and it is to this layer new objects can be created. That means that if several layers are visible when you create a new object, the object is created on the active layer. The active layer is highlighted in the map menu by a green circle. To change which layer is active, simply double click on that layer in the map menu. 32 3BUsing MaxiVis | Actron AB [] USER MANUAL PassCheck 3G 4.4.3 Creating and modifying objects To create a new MaxiVis object, first select a map and layer in the map menu for the new object to be created on. Then drag and drop an object from the object menu on the left on to the map. The administrator can easily change size or/and rotate most of the map objects. To scale the object, drag the scale tool: . When an object is scaled down to a certain size the circle behind the online value disappears. In the same way the object can be rotated by the rotate tool: . The administrator can copy, cut, paste or delete any object on a map, by any of the functions in the bottom of the object menu. 4.4.3.1 Arrows, Double Arrow and Zones These objects can be dragged, scaled and rotated. Any object can be moved by click and drag. Their properties window looks very much alike; this is what the Arrows properties window looks like: (also see section 4.3.4.) 4.4.3.2 The Zoom object The Zoom object is created in the same way as the other objects but cannot be scaled or rotated. (This object cannot be scaled or rotated.) Actron AB | 3BUsing MaxiVis 33 PassCheck 3G USER MANUAL] 4.4.3.3 Text Object The text object is created by dragging into the map from the object panel. The administrator can then enter a text into the object. In the Properties tab is it possible to change font size and colour. 4.4.3.4 Line Objects The line object may as an example is used to document the installation. A Line is created using drag & drop as any other object, but once the line is created it cannot be moved using drag & drop anymore. To change the size and location of the line, use the lines handles. 4.4.3.4.1 Handles To rotate or change length of the line, select the line by clicking on it. You will get two handles one in each end of the line. You can then drag a handle with the mouse to rotate or change the position of the line. 4.4.3.4.2 Creating multiple lines There is a special way to create lines, which is perfect to use if you want to create several connecting lines. If you hold down Ctrl and the drag a handle of an existing line, you will create an additional line, starting from the position of the old lines handle. The new lines will have all the properties of the old line, like colour and comment. The new line is created on the same layer as the old. 4.4.3.4.3 Colour and Comments To change the colour of the line, select the line and change the properties in the properties window. It’s possible load a comment to each line, this comment may function as a documentation for the line. This comment will be visible when hovering over the line. 34 3BUsing MaxiVis | Actron AB [] USER MANUAL PassCheck 3G 4.4.3.5 Value Observers This object is used to monitor the values at entrances/passages or zones. The value observer is entered into the map by dragging it from the object panel to the map. Then select to which entrance/passage or zone it shall be connected to in the Properties window and select the type of value to be displayed: in per minute, out per minute, in per hour, out per hour, in per day or out per day. The font size may be changed. If the value is simulated will the background colour change from blue to yellow. 4.4.3.6 Custom Objects The custom objects are pictures that can be used document or highlight something on the map. To a custom object is it possible to connect links to other web sites. When clicking at the object in the picture a list with possible links appears. The custom object is included by drag the Custom object symbol into the map. Select the Graphics from the Properties window (when the custom object is selected). The objects in the Graphics field must be stored in the web server folder \CustomObjects. The following file formats may be used for the objects: .jpg, .gif and .png. The connection to web pages is set-up in the Properties window. Set a description in the label field and the web link in the Send to: field. A maximum of 5 links can be set-up. Then will a drop down list appear with the possible links. If only one link is set-up you will go directly to this web site when clicking on the object. Actron AB | 3BUsing MaxiVis 35 PassCheck 3G USER MANUAL] 4.4.4 The Zoom object When a Zoom object is created or selected the Object Properties Window enable the administrator to select a map to which the Zoom object will link to. It can be set to zoom in or out, this will only affect the appearance of the object by changing the zoom symbol to ´+´or ´-´ for zoom in respectively zoom out. 4.4.5 Layers MaxiVis supports layer handling in the map area. A layer is defined by the administrator and placed on top of the map. The administrators can then place an object in the layer and it’s only visible when the layer is selected. To manage mapped layers, press the “Manage layers” button on the right side menu. As default a map has a layer called *Default layer* and is always visible for the user. It is possible to change the name or delete this layer though. 4.4.5.1 Layer-User Management The administrator can set a layer available only to certain users. To make a layer available to some users, choose which layer in the “Active Layer” dropdown box, then select the users in the “Can not see layer” list and press the >> button. 4.4.6 User Management The administrator can give or remove login-access for specific users. To do this, press the “Manage Users” button in the right side menu. This View functions similar to the “User-Layer Management” part of section 4.4.5.1. 36 3BUsing MaxiVis | Actron AB [] USER MANUAL PassCheck 3G 4.5 Simulation To be able to test the function of the objects in the map can the administrator simulate the values of the objects. To activate or deactivate a simulation of an object must the administrator first select the object and then go the Simulation window using the Simulation button and mark the checkbox Run simulation. The object that is simulated will be marked with the object number in a yellow dot. For normal users (not administrators) the pop-up box will be marked with the text Simulating. In simulation mode may the administrator change the values as needed for the test (or demonstration). When he is finished with the simulation must he unmark the checkbox Run simulation. An alternative to this is to use the button Turn off all simulations in the left panel, and then all simulations will stop. 4.6 Zooming To zoom in or out on a map is it possible to use the mouse scroll function or use the keyboard. When using the keyboard pres the ctrl-key and (+)-key to zoom in and the (-)-key to zoom out. You can navigate (scroll) and zoomed in map by using the mouse to drag the map. 4.7 Tools The button of the left panel contains tool button for copy, cut, paste and delete an object. To use any of this functions mark the object and click on the appropriate button. When copying or moving (cut) an object select the object and click on the appropriate button then click on paste put the object into the Working layer. It is always possible to move objects with this method between different layers (working layers). Actron AB | 3BUsing MaxiVis 37 PassCheck 3G USER MANUAL] 4.8 Guest Interface The Guest interface is not much different from the Standard User interface. It is a type of login that does not require a username or password, but gives the user no way to make any changes in the system whatsoever. This login is recommended when the application is being online on a public computer. 38 3BUsing MaxiVis | Actron AB [] USER MANUAL PassCheck 3G 5 Using MaxiGraph II The purpose of Graph monitor, trace and analyze the people flow and occupancy. This is an important tool determine how the actual people flow are in your facility. You can easily get the information on where and to where people typically are going. You can from the Graph readout information about average the time from one passage to another. You will get information about what portion of the people who are selecting a specific track - entrance. When you look at the occupancy you can get information about the average time customers are inside the zone. The predefined online data is normally stored for two weeks. Look at following example: When people are passing through the Main entrance some are going out Side Entrance 1, some are going out Side Entrance 2 and some select Side Entrance 3. When there is an even flow of people it will be difficult to trace. But sometimes there will be peaks of people. These peaks are possible to trace as a delayed similar, but smaller peak on another entrance. In this example there is a peak of people coming in through the main entrance. The conclusions in the example above are: - Approx 28 % of the people passes out through Side Entrance 1 after approx. 30 seconds. Approx 60 % of the people passes out through Side Entrance 2 after approx. 50 seconds. Approx 11 % of the people passes out through Side Entrance 3 after approx. 80 seconds. You have to repeat the tracing on a number of peaks to be sure that the pattern is the real one. You can zoom into an interesting peak of people flow and study in detail how the flow of people is moving. Actron AB | 4BUsing MaxiGraph II 39 PassCheck 3G USER MANUAL] 5.1 Login The user interface for MaxiGraph II is a WEB browser. The application is password protected. The passwords are administrated in MaxiWebAdmin. MaxiGraph will per default use the browser (users) locale language as long as this translation is available. If the browsers language does not exist a default language is predefined and used in this case, this can also manually be chosen with the tick box “Use standard language”. Custom translations can be added without reinstalling. 5.2 Setup the Graph to be displayed The setup of MaxiGraph to view a graph is simple: 1. Select the entrance/passages or zones you like to monitor 2. Press “Add to Selection list” to add the selection to the list. 3. Pres “Display graph” to show the graph. If you already have saved a selection as a Template can this be used easily by selecting appropriate template in the selection box “Open Template”. 40 4BUsing MaxiGraph II | Actron AB [] USER MANUAL PassCheck 3G 5.2.1 5.2.11 5.2.2 5.2.3 5.2.12 5.2.4 5.2.13 5.2.5 5.2.14 5.2.6 5.2.15 5.2.7 5.2.8 5.2.9 5.2.10 5.2.1 Disable customer names This function will disable the custom names that the user has set in MaxiWebAdmin. When selecting this function the standard names defined by the commission engineers will appear. 5.2.2 Filter by Site/Category Select only the Entrances/passages or Zones that belongs to a category or a Site. This function is good when you work with large sites or Cooperate solutions. 5.2.3 Flow/Occupancy Select if you want to monitor flow or occupancy. 5.2.4 List of Entrances, Zones List of all Entrances/passages or Zones. This list can be filtered by selection of site(s) or Category. 5.2.5 Add to Selection list Button to add a selection to the “Selection list”, this selection can be repeated if you need more selections to the list. Actron AB | 4BUsing MaxiGraph II 41 PassCheck 3G USER MANUAL] 5.2.6 Open Template Pull down list with earlier defined templates. Select the template you like to monitor and press open. 5.2.7 Open Function used to open the selected template in the Template list. 5.2.8 Delete Function used to delete the selected template in the Template list. 5.2.9 Direction Used as a selection/filter function for the selection. You can select between All, Positive/In or Negative/Out. This selection is not available when occupancy is selected. 5.2.10 Type Use to select/filter the type of entrance. You can select between: All Entrances, Internal, External or Parking. This selection is not available when occupancy is selected. 5.2.11 Selection List List and displays the selected Entrances or zones. 5.2.12 Delete selection(s) By selecting one or more items in the Selection List can you delete them by pressing this button. 5.2.13 Save as Template The selected items in the Selection List is saved as a template when you give the template a name in this box and pres the “Save” button. 5.2.14 Initial display Whit this selection can you select how the Graph shall be presented. If you have selected Flow Graph then you can select Flow or Flow accumulated in this menu. If you selected Occupancy Graph you may select Occupancy or Average Wait in this menu. 5.2.15 Save With this button you will save the selection as a Template. 5.2.16 Display Graph With this button you change the web page and display the selected Graph. 42 4BUsing MaxiGraph II | Actron AB [] USER MANUAL PassCheck 3G 5.3 Graph The display of the Graph can be zoomed in to get a better resolution. You can easily select between historical data or online information. 5.3.1 5.3.3 5.3.2 6.3.4 5.3.10 5.3.12 5.3.11 5.3.5 5.3.6 5.3.7 5.3.8 5.3.9 5.3.1 Type Whit this selection can you select how the Graph shall be presented. If you have selected Flow Graph then you can select Flow or Flow accumulated in this menu. If you selected Occupancy Graph you may select Occupancy or Average Wait in this menu. This is the same as the setting Initial display on the setting page. 5.3.2 Real time Display When this box is selected will the application automatically receive online data from the server. It is recommended to unselect this if you are looking on historical data, as this function may slow down the functionality. 5.3.3 Date Select the date for view historical data. After setting the date press Set Date. Actron AB | 4BUsing MaxiGraph II 43 PassCheck 3G USER MANUAL] 5.3.4 Set Date Press this button is pressed the information the selected Date will appear. Accept the date selection. 5.3.5 Zoom Selected After selecting a zone pres this button to zoom into the zone. 5.3.6 Zoom out Zoom out the trend graph one step. 5.3.7 Zoom All Zooms out and shows the trend graph for a complete day. 5.3.8 Move The active trend window will move in the direction of the arrows. |< << < > >> >| moves to start of the selected day moves the active window one window back moves the active window one tick back moves the active window one tick forward moves the active window one window forward moves the active window end of the selected day 5.3.9 Now The active trend window will follow the actual time. 5.3.10 Flow/Occupancy per minute axis The flow axis are flexible it will change depending on how many visitors there are per minute. 5.3.11 Time axis The time axis is flexible and will show the zoom level – the time frame you have selected. 5.3.12 Selected area To select a shorter time frame for the trend window select the start time and then the end time. This is done by clicking inside the trend graph. When you received a gray area in the trend then press the button Zoom Select to zoom into this part of the graph. 44 4BUsing MaxiGraph II | Actron AB [] USER MANUAL PassCheck 3G 6 Using MaxiReport MaxiReport is an Excel-based software toolkit that imports data from the PassCheck database. The user may then analyse the data and create reports. The built in functions of MaxiReport are easily located in the MaxiReports menu. A good working knowledge in Excel is important, as that gives you better opportunities to customise your analyse and reports. Some of the most used functions are also available by buttons on the main sheets. 6.1 MaxiReport Menu The pull-down menu gives you all possible options for MaxiReport. The functions are: Read Data. Reads data from the PassCheck Database. Make Table. Creates a Pivot table of the active data. Filter on/off. Enables the filter function. Sort. Sorts the data, this is normally done automatically. Clean. Clears and deletes all data and spreadsheets (with the exception of the Hour sheet) in MaxiReport. Export. Exports the page to a new Excel document. Create Report. Creates different reports: - Day - Week - Month - Custom - Forecast Properties. Sets properties for MaxiReports. Help. Displays this Manual. About. Displays information about MaxiReports, such as version number. 6.2 Sheets The MaxiReport document contains, like all Excel documents, of different sheets. New pages will automatically be generated when functions are used. The only sheet that shall appear at start-up will be the Hour sheet. At closing all sheets will be deleted and the Hour sheet will be cleaned up. Do not save any data as all important information is saved in the PassCheck 3G database. If you save data this can give you problem next time. 6.2.1 ”Hour” The main page in MaxiReports is Hour. This page contains the data imported from the database on hourly base. At the top of the sheet is some quick function buttons located. Actron AB | 5BUsing MaxiReport 45 PassCheck 3G USER MANUAL] 6.2.1.1 Function buttons The function buttons are used as quick link for activating some of the most used functions in MaxiReports. The button Make table is used to create a pivot table of the data in the table. The button Filter on/off makes it easy to add a filter to the data in the columns. By doing this you can easy extract information from the data in the table. Please remember to reset and close the filter function after you have used the function. The button Sort is used to sort the data. This is normally done automatically when retrieving the data from the database. The button Go to end is used to move to the end of the database. 6.3 Import data from the Database All data used in MaxiReport must be imported from the PassCheck database. Go to the MaxiReports menu and select Read data. This function is automatically started when you enter MaxiReport. You can when ever start retrieve new data from another period and make a new report without leaving MaxiReport (Excel). When activating the import function a menu window appears in which you must set the time period that you need to retrieve. (a start time and an end time.) You can select if you want to retrieve all data from the External Entrances or from Internal Entrances or from all Entrances. It is possible to get the data from the zones. The database information in the top with path and name of the database is only for your information and cannot be changed. 46 5BUsing MaxiReport | Actron AB [] USER MANUAL PassCheck 3G Normally the readings will clear all old data in the Hour sheet, which means that you can start the analysing with a fresh set data. Remember that all important information is stored in the database and MaxiReport will never writ to the database. That means that when you end your work in MaxiReports and exit Excel if asked always select the option do not save, this as you will never lose any vital information by using MaxiReport. The checkbox Add Data shall be used when you like to add data from one other time period to the data you already have retrieved. The usage of this function is to be able to compare a month this year with the same month last year. The database that you retrieve data from shall be set up at commissioning of the system. It is normally a SQL database and the location of the database is determined during the database setup. If a Access database is used, shall it be located in the directory C:\Passcheck\database. After that the data has been imported to the “Hour” sheet a dialog box will inform you of the amount of data imported and for which time period. 6.4 Make Table The function Make table helps you to create a flexible table or chart of the data you retrieved in any of the data sheets (Hour, Day, Week or Month). You generate a standard Pivot Table, this may not be the correct view of the data that you need but the table is easy for you to change to the view you like. We will below give you some hints how you can change this table. For more information about Pivot tables please find it in Excel help system and in Excel reference literature. The generated Pivot Table includes the following pivot fields: Year, Month, Date, Data and Entrance (time is not included as this example table is generated from the Day sheet). By clicking on the arrow on the left side of each field header you can select the information (data) you need for your analyse (report). In the example to the left we only need information about August. When you click on field arrows you will receive a list with all variables belonging to the field. By deselecting variables of no interest you can get a better table for your analyse. Actron AB | 5BUsing MaxiReport 47 PassCheck 3G USER MANUAL] You can easy change the view of you data by dragging the fields to new places. In the example below can we easy move the Data field to be placed it in front of the field Entrance. Just mark and drag the field header to the correct position. (We have already moved Year to the top of the sheet) Another way to get predefined tales is to use of the function Format Report. You can select several different formats for the table with this function. See the example below. 48 5BUsing MaxiReport | Actron AB [] USER MANUAL PassCheck 3G By using the diagram function you can create a nice graph of your data. Steps to do this: 1) Unselect data you do not need. 2) Press to get a Wizard to create the graph. You may then receive the chart like the one below. To be able to understand it select a smaller time frame and change the chart to a better format. Actron AB | 5BUsing MaxiReport 49 PassCheck 3G USER MANUAL] 6.5 Create Reports The functions in Create Report are composed by several different commands: Day When selecting the menu alternative Day data from Hour sheet is summarized into a new sheet named Day. This new sheet looks like the Hour except that the amount of transits through the entrances is shown per day instead of per hour. Week In the menu alternative Week, is the function the same as Days but creates a Week-sheet which contains weekly totals. However the Day must be created prior to creating Week. Amount of transits is shown per weeks and weeks are numbered by SIS standard. Month The menu alternative Month, functions are same as in Day, but it creates the Month-sheet that contains the monthly totals. Custom This alternative creates a custom report. See more below. Forecast In this menu alternative can you set the forecast that are used in Custom report. See more below. 50 5BUsing MaxiReport | Actron AB [] USER MANUAL PassCheck 3G 6.6 Custom Report The function Custom Report generates reports that are adaptable to the user needs. The report is composed of a table or a diagram that is added as a new sheet in the MaxiReport document. To generate a report, select one of the MaxiReport sheets (Hour, Day, Week or Month). These sheets contain the data for the report. Select menu alternative Custom from the Create Report menu. A dialog box for the report options appears. The box will contain different options depending on the type of report to be generated: 1. Select the time period selection in from and to boxes. 2. Select you want a pivot table or a chart in the Presentation format box. 3. If you selected presentation in table format can you in the box Show transits select if the data shall be shown for individual entrances or for the entire system. 4. Select if the report shall be in percentage or in real amounts in the box Readout formats. If you select percentage, the individual readout will be shown in percentage of all readouts that are shown for the selected period. Example of some reports: Actron AB | 5BUsing MaxiReport 51 PassCheck 3G USER MANUAL] Create a Chart. If the box Compare with forecast is selected the report will also contain a comparison with the forecast summary as well as data for the select period. The expected summary is based on the forecast that the user previously entered in the Forecast menu. You can, if needed, make a report, comparing two or more different periods with each other. First you select the period that you want to have presented in the box From and To as above. This period will be the reference period which others are to be compared with in the report. Then click on button Add in the box Comparison 52 5BUsing MaxiReport | Actron AB [] USER MANUAL PassCheck 3G periods. A dialog window will ask you for a start-time for a comparison period. The comparison period will automatically be of equal length as the reference period. Because of this you do not need to indicate a end time for the comparison. At this point, by clicking OK you return to the report dialog window. The No. Of Periods within the Comparison period box has now increased by one. Since one or more comparison periods have been selected you can no longer change the reference period. You can either enter more comparison periods as above or end the report by clicking OK. When using this function to compare periods please enter equivalent periods. That is if your reference period starts on a Monday is it recommended that your compare period starts on a Monday as well. 6.6.1 Example Suppose that you want to create a diagram which compares afternoons of the 19th to the 19th of January, 2004 with the week starting on February 9th. First make sure that “Hour” – main sheet is selected in MaxiReports. Then select Custom report from the Create Reports menu. In boxes From and To, in the dialog window you select the time period. Click on button Add…. Select February 9th 2005 as start of the comparison period in the dialog window. Click OK to return to main dialog. Amount of comparison periods has increased from 0 to 1. Select diagram as presentation format. Select Show amount as readout format in order to compare in and out transit amounts between the two afternoons. Click OK. A diagram as below is created on a new sheet. Another sheet has been created which contains the amounts on which the diagram is based. Actron AB | 5BUsing MaxiReport 53 PassCheck 3G USER MANUAL] 6.7 Forecast The optional function Forecast is used to feed in an expected forecasted amount of visitors to the system. This data is then used by the Custom report in order to compare the actual amount of visitors with forecasted data. 6.7.1 How to generate a forecast of visitors Select the menu alternative Forecast from the menu Create Report. A dialog window will open. It is in this dialog window all feed-in data are given to forecasts. In box Expected Amount of Visitor you have to enter the total amount of forecasted visitors for the year that is entered in the box above. Use the rotation box (the small buttons with arrows) to select year. 6.7.2 Forecast factors Click on the Months button to start editing the factors for each of the month during the forecast year. A dialog window opens in which you indicate the different months quota on the forecasted total amount of visitors for that year. The amount in the right column is the corresponding month’s relative visitor index. For example, a month with a visitor index of 100 gets twice as many as a month with a visitor index of 50. You can use any relative summary as a visitor index, for example forecast visitor in thousands or in percentage. The column to the left shows that month’s share of yearly totals in percentage. Click OK to return to the forecast dialog. Click on button Weekdays to edit the weekly factors for the year. The dialog window that opens works in the same way as the monthly index seen above. The factors for months and weekdays are only valid for the year that is shown when clicking on Month or Weekday. Thus each year has its own factors for months respectively weekdays. 54 5BUsing MaxiReport | Actron AB [] USER MANUAL PassCheck 3G Click on the button Hours to start edit factors for the hour forecast. The dialog window works as for months and weekday indexes. The hourly factors are general. That means that they are valid for all days and all years. Every change that is done with yearly totals and factors are stored after entering them. The yearly totals and the factors are saved in the MaxiReports. Actron AB | 5BUsing MaxiReport 55 PassCheck 3G USER MANUAL] 7 MaxiWebAdmin II MaxiWebAdmin is the tool used by the system administrator to control the access to the reports and to configure the system parameters the simplify understanding of the reports. The administrators may set-up and manage the following parameters: • Entrances – define logical names for the entrances used in the system. Each entrance has a physical entrance name is defend in AutoMaxi. This physical name can be connected to a logical name that better describes the entrance in the reports. The benefit with this is that it’s easy to change or define entrance names without updating the main database. • Zones – define zones or areas which you need reports from. The zones are used when you need an occupancy report from an area. Note that Zone reports (values) are not stored in the database, zone reports are created dynamically in the report generator. I.e. if you change an existing zone definition you will also alter format on reports with date before date of change. • Sites – definition of a physical location. The administrator may divide a physical location in several sites if needed (but it is recommended to use zones instead). An entrance or zone can exist in different Sites. • Categories – defines group of entrances/zones which have some correlation to each other (categories or branch), for example fashion, or sports. • Users – define user login, password and authorisation. In Site management is used to build groups which will be the foundation for the user rights, the administrator set which Sites, etc. that belongs to a group. 56 6BMaxiWebAdmin II | Actron AB [] USER MANUAL PassCheck 3G 8 Hide This function will minimise AutoMaxi to the Taskbar. The function does not Exit AutoMaxi. Actron AB | 7BHide 57 PassCheck 3G USER MANUAL] 9 Menu system The top of your desktop holds a standard Windows menu system. With the following pull-down menus: File Tools Reports Login Admin About Some of the functions will normally be gray as they are normally used by system administrators during set-up. 9.1 File The pull-down menu File has the same functionality as many other Windows systems. You have the following options in this menu: Save settings Exit Save the system settings (this function will normally done automatically). This function will minimise AutoMaxi to the Taskbar. The function wills not Exit AutoMaxi. (It has the same functionality as the button Hide). 9.2 Tools Properties F2 Events License OnlineRead F5 This option is used to configure AutoMaxi. The selection is password protected. If not login to the system as Site Manager this selection will be gray. Opens a log over events (time stamped events and errors) for e.g. troubleshooting. Se screen shoot below. Used to add or change AutoMaxi license. Turns On / Off the Online Read. This function controls the data sampling from the local controllers. 58 8BMenu system | Actron AB [] USER MANUAL PassCheck 3G 9.3 Reports This menu has the same function as the button QuickReports. 9.4 Logon Logon Logoff user User Administration: Used to login as administrator for AutoMaxi. Logoff as administrator. The Site Manager can create new user accounts.. 9.5 Admin The Administrators Toolbox to manage and supervise the PassCheck 3G system. PLC Administration: Used by qualified technicians to check and change settings in the local controllers. Station Config Wizard: Scans the PassCheck network for local controller stations and sets up the found configuration. AutoMaxi Task manager: For qualified technicians to check and administrates the ongoing processes. Exit AutoMaxi: The real exit function of AutoMaxi (as alternative to <Ctrl+Alt+Del>). Database Admin: For qualified technicians to check the database editor and viewer. Update database structure: Update the structure of you old database to fit a new version. Create MaxiNet file: This will create a .dat file for export of the data in the database. Send email: Force a sending of a status email. Read Historic data: Reads all historic data from the Control Units and stores into the database. Edit Skin: Lets you customize the front-end or skin. Delete Demodata Remove demo data from the database. Actron AB | 8BMenu system 59 PassCheck 3G USER MANUAL] 9.6 About Displays a help window that the basic version information about your PassCheck 3G - AutoMaxi system. About: Gives to the system data about version, database, web server and configuration, versions number etc. Help: System help. 60 8BMenu system | Actron AB [] USER MANUAL PassCheck 3G Appendix A: How a system is configured To explain the system configuration, we can look at a typical example. We have a department store, as shown on the picture to the left, with: − 3 External entrances − 3 Internal passages (or entrances) − 3 departments (zones) All entrances and passages between the departments must be covered with sensors. If any passage is not covered it is impossible to have any figures for occupancy. In this case can you only measure the people flow in the entrances with sensors. Next step after installing sensors and control units at all entrances is to define the entrances by giving them a “ramp” number. This can look like the following list: Entrance A Passage A to C Passage A to B Passage B to C Entrance C Entrance B ramp number 101 (sensors connected to control unit 1) ramp number 102 (sensors connected to control unit 1) ramp number 201 (sensors connected to control unit 2) ramp number 202 (sensors connected to control unit 2) ramp number 301 (sensors connected to control unit 3) ramp number 401 (sensors connected to control unit 4) Control unit 1 Control unit 2 Control unit 3 Control unit 4 Actron AB | 9BAppendix A: How a system is configured 61 PassCheck 3G USER MANUAL] Decide where to place the sensors and the Control units. How to do this is explained to the by Actron authorised installation people in the PassCheck 3G Installation Manual. Basically the installation is done by mounting the sensors inside the entrance where people who have entered are moving steadily away from the entrance and where they do not normally stop. The control units can supply several sensors. But place the control units reachable and where it still is possible to see the sensors and passages by your eyes. This as the installation team must be able to make proper calibrations. Give each unit a unique station number. Decide the Directions, in the picture below is the blue arrows indicating the IN direction. Control unit 1 Passage A to C Entrance A Entrance C Control unit 2 Passage A to B Entrance B Passage B to C Control unit 3 Control unit 4 Next step during installation when all hardware is installed is to set up the software. From the information above do we know everything and we can enter the information into AutoMaxi. It will look like the information in the table below. We have 6 entrances 3 external and 3 internal (the passages between the different departments). No. 1 2 3 4 5 6 Stn No 1 1 2 2 3 4 Cont. Unit 101 102 201 202 301 401 Name Entrance A Passage A to C Passage A to B Passage B to C Entrance C Entrance B Type E I I I E E Active 1 1 1 1 1 1 62 9BAppendix A: How a system is configured | Actron AB Direction 0 0 0 0 0 0 [] USER MANUAL PassCheck 3G All entrances (doors) to the system must have sensors; this means that we can configure the zones. The zones give us the occupancy the different departments. In our example do we have 4 zones: Total, Department A, Department B and Department C. Select all the entrances/passages leading in and out from the zone. The definition of direction at an entrance is important to the zone setup, as this gives the software information if it shall add or subtract when someone enters the zone. (To explain this has we indicated the direction with arrow points into the zone in the picture above) For the zone TOTAL is the following entrances involved: Nr 1 5 6 Name Entrance A Entrance B Entrance C Change dir. 0 0 0 As all of them leads into the store will there be no change in direction. For Department A are the following entrances involved: Nr 1 2 3 Name Entrance A Passage A to C Passage A to B Change dir. 0 0 1 Passage A to B points out of the zone and therefore we have to change the direction (1). For Department B are the following entrances involved: Nr 3 4 6 Name Passage A to B Passage B to C Entrance B Change dir. 0 1 0 Passage B to C points out of the zone and therefore we have to change the direction (1). For Department B are the following entrances involved: Nr 2 4 5 Name Passage A to C Passage B to C Entrance C Change dir. 1 0 0 Passage A to C points out of the zone and therefore we have to change the direction (1). Actron AB | 9BAppendix A: How a system is configured 63 PassCheck 3G USER MANUAL] Appendix B: Accuracy theory for occupancy Even if the flow accuracy normally is far better than 95% the flow error will accumulate during a complete day. This means that in a store, which had 1000 visitors during a day it could be e.g.10 people left close to closing time. With a accuracy of the flow of 95% the system could theoretically in worst case e.g. shows 50 people to much in and 50 people too less out. In this case, the number of people shown by the system will be 100. If, at that moment an accuracy calculation would take place the error would be 1000%. This shows that an accuracy number of occupancy is theoretical impossible. The occupancy figures have anyway a very strong information value due to the way the PassCheck system treats the figures, learns automatically and compensates for these errors. 64 10BAppendix B: Accuracy theory for occupancy | Actron AB [] USER MANUAL PassCheck 3G An acceptable solution to this accuracy problem can be: • • • • • • A high accuracy of the sensors system A stable sensors A self learning and self calibrating system Most important, algorithms in the central computer must be updating automatically the system every day Self learning through checking systematic errors and leakages in the system. Making accumulating averages for different types of days (e.g. weekdays , Sundays, Holidays) This reduces the Real Time values to an acceptable level as a Real Time indication. Only random errors remain as the repeatable calibration errors and system leakage errors are eliminated But to reach good accuracy the result has to be produced the day after (when the final value is known.) Through retroactive auto correction in this report the error in the end of the day (as well as in the beginning of the day) will be very small. The Max error will also be much reduced. This is possible because the system starts to count in the beginning of the day when 0 people are assumed to be inside and in the end of the day the assumption is that 0 people are inside. This means that graph could be proportionally adjusted in the end of the day. (The error will then be 0 in the end of the day as well as in the beginning) As an example, you may the next day create a graph that shows the corrected occupancy for the previous day. This graph then uses the corrected values for the occupancy for the different zones or part of your building or facility. Actron AB | 10BAppendix B: Accuracy theory for occupancy 65 PassCheck 3G USER MANUAL] Accuracy The accuracy the PassCheck 3G system depends on many different things and how the entrances are maintained during the lifetime of the system. At commissioning of a system will approved engineers from Actron set-up the system according to the people flow and environment as it is. Normal our customers make changes to entrance to attract customers; this may change the accuracy for counting at the entrance. The changes can be new signboard in the entrance, a change of location of a display rack or a product counter, and so on. These small changes to attract more customers can change people’s behaviour in the entrance. As a result of the methods described above have we found that typical accuracy for counting a people flow is 95% or better. In many cases have we achieved a high level of accuracy and exceeded our customers’ expectations with an accuracy better than 98% It has to be clear that we cannot give any guarantee for the accuracy for the occupancy (especially in real time). The reason for this is obvious when you read the previous information. Test of accuracy The counting references must be agreed before the installation and calibration of the system. See theory of “Real amount of people contra Real Reference amount of People.doc” How to determine the Real amount of people contra Real Reference amount of People? There are no exact people counting system. It will never be any because an exact 100% accuracy as it will never be possible to reach. If this is correct then will there theoretically never be any exact people counting system. Is this correct? Take the following example. Two serious people Mr A and Mr B will perform a test by counting simultaneously side by side for a complete day the people passing an entrance. At end of the day they present the counting figures to each other. Surprisingly, most likely they will present figures that are quite different to each other. That does not mean that anybody did a mistake? No, the main reason is that they had two different counting references. Mr A counts all people he sees even very small children while Mr B only counts people, which he assumes are potential buyers, which means, in his mind, people more than 12 years old (or people taller than 130 cm).Mr A counts all people going in an out while Mr B does not count people just going outside the door and going in again (e.g. to take smoke) because he thinks that they are already counted. There are many more reasons why different people will have different references. The conclusion of this when counting it is up to the individual what the reference are and how the counting is shall be preformed. Everything can be correct it is depending on the reference you set for the counting. This means that to judge if an automatic people counting system counts correct or not has to be decided from the beginning what the reference of counting is. The system has to be adjusted to meet this reference. The test has to be made by manual counting at least 200 people in each entrance to the area. The total accuracy will be the relevant figure. 66 10BAppendix B: Accuracy theory for occupancy | Actron AB [] USER MANUAL PassCheck 3G If an entrance has a very small flow, which means that test counting of 200 people will take too long time, and then it is OK to count a smaller amount, but never less than 50 people. Is so, it will be OK to interrupt after this smaller amount if the counting accuracy by this level shows a trend to be well inside the 95% accuracy. Actron AB | 10BAppendix B: Accuracy theory for occupancy 67