1
Hyperion Manual, Release 0.9.7
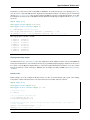
As for AMR grids, Hyperion includes an interface to the yt package for Octree grids. If you extracted the quantities
with:
oct = m.get_quantities()
you can call the following method to output a StreamStaticOutput yt object that can be directly used for plotting
in yt:
pf = oct.to_yt()
where pf is a yt StaticOutput object. See Visualizing physical quantities from adaptive grids with yt for more
details and a plotting tutorial.
The Tutorials section contains a number of examples illustrating how to extract and visualize observables and quantities.
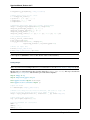
Note: A convenience script is provided to quickly extract image cubes and physical grids for inspection as FITS files:
# Retrieve all images
hyperion2fits --images model.rtout
# Retrieve all physical arrays (only works for regular grids)
hyperion2fits --physics model.rtout
Ds9 version 7 or later is required to be able to navigate FITS cubes with more than 3 dimensions. This is only meant
as a quick look tool. To extract properly scaled and sliced information from the output file, see the sections above.
3.6 Tutorials
3.6.1 Basic Python
If you are not comfortable with writing out files or making plots in Python, the following two sections will help you
get started:
Writing files in Python
Pure Python
The most basic way to write files in Python is to simply open a file with write access:
f = open('file.txt', 'wb')
and to then call the write method to write to the file:
f.write("Hello World")
Line returns have to be explicitly included using \n:
f.write("Line 1\n")
f.write("line 2\n")
And files should be closed with:
f.close()
3.6. Tutorials
47