1
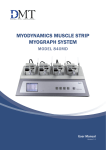
MYOVIEW
USER MANUAL
User Manual
Version 1.0
1
TRADEMARKS
Danish Myo Technology A/S reserves the right to alter specifications as required.
This document was, as far as possible, accurate at the time of printing.
Changes may have been made to the software and hardware it describes since then.
New information may be supplied separately.
No part of this document may be reproduced by any means without the
prior written permission of Danish Myo Technology A/S.
Copyright © Danish Myo Technology A/S
2
MyoVIEW - USER MANUAL
CONTENTS
Trademarks..........................................................................................................................................................................................2
Chapter 1 - Start up............................................................................................................................................................................4
1.1 MyoVIEW Start up on your computer................................................................................................................................................4
1.2 Layout..................................................................................................................................................................................................5
1.2.1 Reset of the MyoVIEW layout.......................................................................................................................................................8
Chapter 2 - Control Windows.............................................................................................................................................................9
2.1 Camera Control Window.....................................................................................................................................................................9
2.2 Calibration of the camera .............................................................................................................................................................. 10
2.3 Image Analysis Control Window...................................................................................................................................................... 13
2.3.1 Zones......................................................................................................................................................................................... 13
2.3.2 Tracking problems and solutions............................................................................................................................................. 16
2.3.3 Reset Fine Edge Dection sliders.............................................................................................................................................. 16
2.3.4 Snapshot image of the mounted vessel.................................................................................................................................. 16
2.4 Pressure Interface Control Window................................................................................................................................................ 16
2.4.1 Heater Control........................................................................................................................................................................... 17
2.4.2 Pressure Control....................................................................................................................................................................... 17
2.4.3 Force ......................................................................................................................................................................................... 17
2.5 Sequencer Control Window............................................................................................................................................................ 17
2.6 Flow meter Control window (optional)............................................................................................................................................ 19
2.7 DMT Inverted Microscope Control Window (optional)................................................................................................................... 19
CHAPTER 3 - THE MyoVIEW menus and configuration ................................................................................................................ 20
3.1 Application button (DMT logo)........................................................................................................................................................ 20
3.2 MyoVIEW Quick Access Toolbar...................................................................................................................................................... 20
3.3 New trace......................................................................................................................................................................................... 21
3.3.1 Setting of the Y-axis ................................................................................................................................................................. 23
3.4.1 MyoVIEW Menu......................................................................................................................................................................... 24
3.4.1.1 Analysis submenu............................................................................................................................................................... 24
3.4.1.2 Source submenu................................................................................................................................................................ 24
3.4.1.3 Markers submenu.............................................................................................................................................................. 24
3.4 Menus.............................................................................................................................................................................................. 24
3.4.2 Data Menu................................................................................................................................................................................. 26
3.4.2.1 Export submenu................................................................................................................................................................. 27
3.4.2.2 Delete submenu................................................................................................................................................................. 27
3.4.2.3 Data Collection submenu.................................................................................................................................................. 27
3.4.2.4 Video Recording submenu................................................................................................................................................. 28
3.4.3 View Menu ................................................................................................................................................................................ 28
3.4.3.1 Application Layout submenu............................................................................................................................................. 28
3.4.3.2 Data Analysis sub menu.................................................................................................................................................... 28
3.4.3.3 Live Traces submenu......................................................................................................................................................... 30
3.4.3.4 Trace selection submenu................................................................................................................................................... 30
3.4.3.5 Zone colors sub menu....................................................................................................................................................... 30
Chapter 4 - Data Collection and Saving Data................................................................................................................................ 31
Chapter 5 - Data Analysis and Export............................................................................................................................................ 33
Appendix 1 - Parameter formulas used in MyoVIEW.................................................................................................................... 35
Appendix 2 - MyoView Upgrades or Change License.................................................................................................................... 37
Notes................................................................................................................................................................................................. 39
CONTENTS
3
CHAPTER 1 - START UP
The DMT Pressure Myograph Systems is primarily operated via the MyoVIEW software. The function of the software is to control
the heat of the chamber, the pressure and the trace recording of following parameters:
•
•
•
•
•
•
•
•
•
•
•
•
•
•
•
•
•
•
Left Wall Thickness
Right Wall Thickness
Average Wall Thickness
Outer Diameter
Inner Diameter
Vessel Area
Lumen Area
Cross Sectional Area
Media/Lumen Ratio
Shear Stress (optional)
Inlet Pressure
Outlet Pressure
Mean Pressure
Flow (optional)
Vascular resistance (optional)
Temperature
Force (longitudinal)
pH (optional)
1.1 MyoVIEW Start up on your computer
Go to Start -> All Programs -> DMT -> MyoVIEW
NOTE
RIGHT CLICK ON MYOVIEW AND SELECT “SEND TO” TO CREATE A MYOVIEW SHORTCUT ON YOUR DESKTOP.
MyoVIEW will start up with the layout from last time MyoVIEW was used. The following MyoVIEW screen will now be visible on the
screen (see figure 1.1 or 1.2):
Figure 1.1 Example of MyoVIEW start screen with DMT microscope attached
4
MyoVIEW - USER MANUAL
Figure 1.2 Example of MyoVIEW start screen without DMT microscope attached
1.2 Layout
The layout on the screen can be simplified by hiding the different small windows for the DMT Inverted Microscope (or video from
normal inverted microscope e.g. Zeiss), Camera, Pressure Interface, Image Analysis, Sequencer and Flow Meter (optional). By
clicking the needle-pin icon in the top right hand corner (marked in figure 1.3 below) the windows will hide either on the left or
right hand side of the MyoVIEW screen.
Figure 1.3 Indication of needle-pin icon
CHAPTER 1
5
After hiding the five different windows the MyoVIEW layout will look like this:
Figure 1.4 Layout after hiding the windows
The five different windows will slide in if requested and be visible by holding the mouse pointer on the yellow tab. By pressing the
needle-pin again the window will stay open and not be hidden, see figure 1.5, A-B below.
Vertical needle-pin: The Camera Menu will NOT be hidden.
Horizontal needle-pin: The Camera Menu will be hidden.
Figure 1.5, A-B Indication of vertical needle-pin icon (left) and horizontal needle-pin icon (right)
The Image Analysis window showing the video from the USB camera can be moved around and resized as required. Simply holding down the left mouse button on the Image Analysis window and drag it to the requested position on the screen. At the given
position the size of the Image Analysis window can be scaled up and down, see figure 1.6 and 1.7.
The layout in MyoVIEW is extremely flexible and user friendly. MyoVIEW saves the given layout shown on the screen when the
program is closed.
6
MyoVIEW - USER MANUAL
Figure 1.6 Image Analysis window at the buttom of the MyoVIEW screen
Figure 1.7 Image Analysis window moved and resized at the center of the MyoVIEW screen
CHAPTER 1
7
1.2.1 Reset of the MyoVIEW layout
At any given time the layout can be set to default by going to the View Menu and click on the Reset window layout.
Figure 1.8 “Reset window layout”
8
MyoVIEW - USER MANUAL
CHAPTER 2 - CONTROL WINDOWS
The MyoVIEW control windows control the Camera, the Image Analysis, the Pressure Interface, the Sequencer, FlowMeter (optional) and DMT Inverted Microscope (optional).
2.1 Camera Control Window
The capture of video images from the video camera is activated by pressing CAPTURE (marked in figure 2.1 A below) and stopped
again by pressing STOP (marked in figure 2.1 B below) in the Camera control window. The Brightness, Gamma and Gain of the
camera can be adjusted using the appropriate sliders (see figure 2.1 B below) to obtain a good image of the mounted vessel.
Figure 2.1 A Camera control window
- Capture
Figure 2.1 B Camera control window
- Stop
The best image to obtain a good tracking of the vessel walls is images in the grayscale area and not very bright images showing
a black and white image. Keep the light and brightness to the lower side and keep the image in the grayscale instead of a very
bright image resulting in a completely white background. The latter will result in poor quality tracking of the wall, see examples
in figure 2.2 A-B below.
Figure 2.2 A Good image for tracking
of the vessel wall
Figure 2.2 B Too bright image and the
tracking will not be good.
CHAPTER 2
9
2.2 Calibration of the camera
It is very important that the camera is calibrated to obtain the pixel/µm relationship for the objective used on the given camera.
Once the camera is calibrated with the given objective the calibration data will be saved in MyoVIEW. A new camera calibration is
only performed if the objective or camera is changed or never have been used before.
1. Press CAPTURE in the Camera Control Window to start the Video Capture.
2. Place the supplied micrometer ruler on the microscope and adjust the microscope to get the ruler in focus. DMT Inverted Microscope users place the micrometer ruler on the supplied micrometerpositioner ruler adaptor as shown in the picture below.
Figure 2.3 Placing the micrometerpositioner ruler on DMT Inverted Microscope
3. To calibrate the camera press the Calibrate icon in the Camera Control window (marked in figure 2.4 below).
Figure 2.4 Camera Control window - Calibrate Camera
10
MyoVIEW - USER MANUAL
4. The micrometer ruler will now be displayed on the screen. Select the Magnification (marked in figure 2.5 below) corresponding to the objective used on the microscope.
5. Draw a box covering the 1000µm ruler exactly as shown in figure 2.5 (red box) below using the mouse holding the left mouse
button down. The appearing red box with the tick marks can be rotated 90 degrees by clicking either the Width or Height on
the right hand side (marked in figure 2.5 below) to be able to get the red box to fit the ruler (for every 200µm), see figure 2.6
below.
Figure 2.5 Calibrate Camera - micrometer ruler
Figure 2.6 Calibrate Camera - micrometer ruler - rotated 90
degrees
6. Fine adjust the red box tick marks by clicking on the plus and minus slider (marked in figure 2.7) until it fits exactly.
Figure 2.7 Plus and minus slider
7. Click on Calibrate and fill in the number of µm the red box covers into the box Enter measured microns. Press the ENTER
key to save the calibration of the camera; in this case it is 1000µm (see figure 2.8).
Figure 2.8 Enter measured microns
CHAPTER 2 11
8. In the box Measurement (µm) (marked in figure 2.9 below) the camera will now show how many µm the red box covers. This
value should in this case be 1000µm. By resizing the red box the calibration of the camera can be controlled by reading the
number in the Measurement (µm) when the red box is resized.
Figure 2.9 Measurement (µm) box
The camera calibration will be saved as an ‘action’ in the Action Sheet to document that the camera calibration has been performed. In the example shown below we have calibrated the camera three times just for illustration.
Figure 2.10 Action sheet - illustration of saved calibration of the camera
12
MyoVIEW - USER MANUAL
2.3 Image Analysis Control Window
The Image Analysis Control window is showing the video of the mounted vessel. This video image is used to measure and calculate the parameters recorded in MyoVIEW.
Figure 2.11 Image analysis control window
2.3.1 Zones
Before MyoVIEW can calculate the dimensions of a mounted vessel the user has to define a region wherein MyoVIEW will track
the vessel wall and calculate all the parameters. In MyoVIEW a zone is placed by left clicking and dragging a box across the video
image of the vessel in the Image Analysis Control Window (marked in figure 2.121 below). MyoVIEW can handle up to two zones.
In each zone all the parameters are tracked, measured and calculated individually. Each zone will have a number (1 or 2). In
figure 2.12 below two zones have been placed and in the left side of the trace window a 1 and 2 can be seen representing zone
1 and zone 2, respectively (marked in figure 2.122 below). To see the trace of a parameter from zone 1 click on the 1 and then
select the parameter to be shown by right clicking on the trace (see figure 2.13).
When the measuring zone is placed on the video image of the vessel in the Image Analysis Control Window a Trace recording
will be opened automatically (see figure 2.123 below) without any selected parameter (if not opened manually before).
2
3
1
Figure 2.12 Image Analysis Control Window - Trace recording
CHAPTER 2 13
Right click on the trace to select the parameter as shown below.
Figure 2.13 Select a parameter
Trace data of a given parameter from zone 1 or zone 2 is selected by clicking on the small box 1 or 2 on the left hand side of the
trace marked below.
Figure 2.14 Zone 1 and Zone 2 - Select the zone to be shown
14
MyoVIEW - USER MANUAL
The zones can be moved, enlarged or minimized as needed by dragging the box. As soon as the box is placed the wall tracking
algorithm in MyoVIEW will start trying to track the inner and outer wall of the vessel. The red line will show the tracking of the outer
wall and the green lines will show the tracking of the inner wall. To the far right in the Image Analysis Control window the outer
(red lines) and inner diameter (green lines) are shown for the two zones, see figure 2.15 below.
If the tracking of the inner and outer wall is not correct then the algorithm can be fine tuned by highlighting the zone box and
thereafter change the Course Edge Detection using the slider or the minus and plus sign in the Image Analysis Control window
as marked in figure 2.15 below until the tracking of the inner and outer wall is perfect (see figure 2.16).
Figure 2.15 Use the Course Edge Detection Slider to adjust the tracking
Figure 2.16 Here the slider Course Edge Detection has been changed for
zone 2 to get a better tracking of the vessel walls.
In cases where connecting or fat tissue can not be removed perfectly from the vessel the tracking of the walls could be a problem
for the tracking algorithm. In these cases the Fine Edge Detection sliders in the Image Analysis Control window is used (see
figure 2.17 below). There is one slider for each of the four tracking lines. By sliding the Fine Edge Dection bar offset values are
added or subtracted to the tracking algorithm and thereby the user will be able manually to place the tracking line to the position
where the user can see the wall even though there is a lot of connecting tissue attached to the vessel.
Figure 2.17 Fine Edge Dection
CHAPTER 2 15
2.3.2 Tracking problems and solutions
1. If there is a problem with the tracking even after changing the Course Edge Detection parameters then try to change the
camera gain and brightness combined with the Course Edge Detection parameters. Adjusting the light intensity on the microscope is also an option to get a better tracking of the vessel walls.
2. Very large/thick vessels are too thick to light through making it impossible to track the inner diameter. An example would be
rat aorta. In this case select Ignore Inner Diameter in the MyoVIEW Menu. MyoVIEW will then only track the outer diameter.
3. The vessel is not clean: The vessel has some connecting tissue and fat attached making it impossible to track the right position of the wall.
A. Try to move the zone to another position.
B. Use the Fine Edge Detection sliders in the Image Analysis Control window.
C. Clean a new vessel and mount it in the Myograph chamber.
2.3.3 Reset Fine Edge Dection sliders
The Fine Edge Detection sliders can be reset by going to the Image Analysis control window and click on the camera and then
select Reset Fine Edge Detection as shown in the figure 2.18 below.
2.3.4 Snapshot image of the mounted vessel
Go into the Image Analysis control window and click on the camera and select Export image to file as shown in the figure 2.18
below.
Figure 2.18 “Reset Fine Edge Detection” and “Export image to file”
2.4 Pressure Interface Control Window
The Pressure Interface Control window is placed along the right side of the MyoVIEW layout as shown in the figure below. The
Pressure Interface Control window is divided into three parts; Heater control, Pressure Control and Force control.
Figure 2.19 Pressure Interface control window
16
MyoVIEW - USER MANUAL
2.4.1 Heater Control
Control the temperature in the Myograph Chamber and Pressure Interface buffer bottles.
Enter the temperature of choice (RT to 50 C) and press ENTER on the keyboard or click the
Change icon. To turn the heat on and off click the On and Off icon respectively.
2.21 Heater control
2.4.2 Pressure Control
•
Pressure On/Off - To pressurize the bottles in the Pressure Interface click on the On
icon and to turn off the pressure on the bottles in the Pressure Interface click on the
Off icon.
NOTE
WHEN MYOVIEW OPENS THE PRESSURE IS ALWAYS OFF AS A DEFAULT.
• P1 and P2 - Setting of the pressure at the P1 and P2 side of the chamber. Enter the
pressure of choice at the P1 and P2 side (0-250mmHg and press the ENTER key or
click the Change icon to save the entered values. To prevent backflow MyoVIEW will
not accept a higher P2 pressure than P1 pressure.
Figure 2.22 Pressure control
• Gradient - The Pressure Interface can build up pressure with different speeds. The
default setting is 10mmHg/sec meaning going from 40mmHg to 50mmHg takes 1 sec.
The speed/gradient can be changed between 1mmHg/sec and 10mmHg/sec
• Flow On/Off - Inside the Pressure Interface a valve will normally be closed blocking the
flow coming from the P2 side of the chamber and create a no-flow situation (Simulate
Blind-sac experiment). The flow is turned on by a click on the On icon and off by a click
on the Off icon. In the no-flow state only the Pressure entered as the P1 value will be
applied to the mounted vessel.
NOTE
WHEN MYOVIEW OPENS THE FLOW IS ALWAYS OFF AS A DEFAULT.
2.4.3 Force
• Zero - The force transducer measuring the longitudinal force generated by the mounted vessel is calibrated as described in the Pressure Myograph Systems User Manual.
In MyoVIEW the zero is used to zero the force of the force transducer. Besides using the
force transducer for measuring the longitudinal force generated during an experiment
the force transducer can also be used for normalizing the vessel during mounting of
the vessel. To make sure that all vessels are strectched equally each time the force
can be used to put the same stretch/force to the vessel before starting an experiment.
Figure 2.23 Force
2.5 Sequencer Control Window
The Sequencer in MyoVIEW is a feature to program the Pressure Interface to define pressures after a defined time period. A sequence will normally contain several steps/programs/tasks. The sequencer is found at the bottom of the MyoVIEW Layout, see
figure 2.24 below.
Figure 2.24 Sequencer control window
CHAPTER 2 17
Adding Task steps to the sequencer:
1. Click on the sequencer triangle icon and select Add task (see figure 2.25).
2. The Task manager (see figure 2.26)
Several information are needed for each task to be filled in.
• Description: Free text describing the task.
• Show description on trace when task starts: If this is selected the free text from
Description will be written on the traces when the task starts (see figure 3.18).
• Duration: Time in seconds the task should run before continuing to the next task.
• Inflow (P1): Target pressure in mmHg for the P1 (0-250mmHg).
• Outflow (P2): Target pressure in mmHg for the P2 (0-250mmHg).
• Temperature (C): Chamber temperature (RT-50°C).
• Prompt user: When the task ends the sequencer will prompt the user for an OK
with the text written into the text box before it will continue to the next task. In figure
2.26 the text ‘Add Drug 1’ have been added. This results in a prompt box with the
text ‘Add Drug 1’ that the user has to click OK before the sequencer continue to
next step.
• Wait: A tick mark in the Wait box (See figure 2.27) means that the task will continue for 10 seconds as listed and then check if the pressure at P1 has reached
40mmHg if not the task will continue until the 40mmHg has been reached.
3. Enter all the tasks needed in the sequencer and click OK. The sequencer tasks are
listed in the trace as marks, marked in figure 2.28 below.
Figure 2.25 Sequencer
drop down menu
Figure 2.26 Task manager
Edit a Task: Double click on a task and the Task Manager will show the task to be edited.
Alternative mark the task and select edit task in the drop down menu of the sequencer
(see figure 2.25).
Delete a Task: Mark the task and select delete task in the drop down menu of the sequencer.
Load Sequence: Select Load Sequence in the drop down menu of the sequencer.
Save Sequence: Select Save Sequence in the drop down menu of the sequencer.
Clear Sequence: A sequence can be deleted. Select Delete Sequence in the drop down
menu of the sequencer.
Loop Sequence: A sequence can be repeated again and again using the ‘Loop Sequence’
function. Select Loop Sequence in the drop down menu of the sequencer.
Figure 2.28 Experiment using the sequencer.
The sequencer tasks are listed in the trace as marks
18
MyoVIEW - USER MANUAL
Figure 2.27 Task manager
- wait box
2.6 Flow meter Control window (optional)
The DMT FlowMeter - 162FM is not an active flow meter able to control the flow. The FlowMeter is only at the moment able to
measure the flow as a result of a pressure gradient across the vessel due to the value for P1 and P2.
Figure 2.29 DMT FlowMeter control window
2.7 DMT Inverted Microscope Control Window (optional)
The DMT Microscope Control window shown below is used to adjust the Infrared Light (IR-light) intensity in the DMT Inverted
Microscope. The IR-light can also be adjusted directly on the DMT Inverted Microscope turning the silver knob on the back of the
microscope. The IR-light can be used to obtain the optimal contrast image of the vessel to track the vessel walls.
Figure 2.30 DMT Microscope control window
CHAPTER 2 19
CHAPTER 3 - THE MYOVIEW MENUS AND CONFIGURATION
3.1 Application button (DMT logo)
Figure 3.1 Application button
New trace: A new trace will be shown in MyoVIEW.
Open experiment: Open a saved MyoVIEW experiment.
Save experiment: Save the MyoVIEW experiment as a Myo file.
Close experiment: Close the MyoVIEW experiment.
Exit: Exit the MyoVIEW programme.
3.2 MyoVIEW Quick Access Toolbar
The MyoVIEW quick access tool bar is in the top left corner, see figure 3.2 below.
Figure 3.2 MyoVIEW Quick Acces Toolbar
Customize Quick Access toolbar: Customize the Quick Access Toolbar, see figure 3.3 below.
Figure 3.3 Customize Quick Acces Toolbar
20
MyoVIEW - USER MANUAL
3.3 New trace
By clicking the New Trace Icon (at the MyoVIEW Quick Acces Toolbar) a new trace will be shown in MyoVIEW. The new trace will
not be dedicated to show any specific parameter before this is selected.
Before opening the first trace:
1. Select Record Video in the Video Recording submenu of the Data Menu if video of the experiment should be recorded and
saved.
2. Start Video Capture in the Camera Control Window.
3. Mark one or two zones on the vessel to be recorded in the Image Control Window.
To select and show a trace of a specific parameter right click on the trace and the following will be shown, see figure 3.4 below.
Figure 3.4 Select parameter from drop down menu
Select the parameter of interest. As many traces as requested can be opened and shown at the same time. The traces can be
stacked as tabs, in columns or in rows. The trace layout can easily be arranged as requested simply by dragging the actual Trace
window to the requested position. The three different layout are shown on the next pages in figure 3.6 - 3.8.
If the data traces cannot be seen on the screen then first click on 1 for showing zone 1 or 2 if two zones have been made on the
video image (marked figure 3.5 below).
If the traces still can not be seen then the scale on the y-axis could be set wrong.
Figure 3.5 Click for zone 1 or 2
CHAPTER 3 21
Figure 3.6 Trace Layout 1 - Tab-layout
Figure 3.7 Trace Layout 2 - Column Layout
22
MyoVIEW - USER MANUAL
Figure 3.8 Trace Layout 3 - Rows Layout
3.3.1 Setting of the Y-axis
Click on the Y-axis icon
at the left hand side.
It will open a Y-axis setting menu as shown below.
Figure 3.9 Y-axis setting menu
•
•
•
•
•
•
Trace Type - Select the parameter to be shown.
Vertical limits - Enter the minimum and maximum Y-value.
Auto range - Will at all time scale the Y-value data shown in the trace automatically.
Unit type - Measure unit. This cannot be changed but shows the unit of the given parameter.
Show unit type - Will show the unit of the given parameter on the y-axis of the trace e.g. inner diameter will show µm
Label count - The distance between tick marks on the y and x axis can be entered.
Move Y-axis up or down
Scrolling the mouse wheel moves the Y-axis up or down. This is a fast and easy way to get the trace in the center of the viewing
field on a given trace, or click on the UP and DOWN arrow icons to move the Y-axis up or down.
CHAPTER 3 23
3.4 Menus
In the MyoVIEW program there are three main menus in the toolbar: MyoVIEW, Data and View, marked in figure 3.10 below.
Figure 3.10 MyoVIEW Menus
3.4.1 MyoVIEW Menu
In the MyoVIEW Menu there are three submenus: Analysis Menu, Source Menu and Markers Menu.
3.4.1.1 Analysis submenu
• Auto Threshold - Selecting Auto Threshold will disable the manual setting of the tracking parameters in the tracking algorithm and use the default parameters. The Auto
Threshold will only be optimal for very clean vessels.
• Invert Image - Invert the pixel values on the video input making white black and visa
versa.
• Ignore Inner Diameter - The inner diameter will not be calculated. This should normally be selected for very thick vessels as e.g. aorta where tracking of the inner diameter
is very difficult.
Figure 3.11 Analysis submenu
3.4.1.2 Source submenu
• C
amera - Selection of camera (for now DMT only support one type of camera)
• Play video from file - A recorded video file from e.g. a former pressure experiment can
be loaded, shown and also reanalyzed using MyoVIEW.
NOTE
THE GAIN, BRIGHTNESS AND GAMMA VALUES CANNOT BE CHANGED ON A RECORDED
VIDEO FILE.
Figure 3.12 Source submenu
3.4.1.3 Markers submenu
• F1 - F12 - Linked to predefined Marker Strings.
• Settings - Enter Marker text for the given Hotkeys.
In MyoVIEW markers can be added to the traces in two ways. To enter a free text at a given
position in a trace, double click on the trace and this will open a text box as shown on next
page.
24
MyoVIEW - USER MANUAL
Figure 3.13 Markers submenu
Enter any given text of choice and press Save message or press the ENTER key.
Figure 3.14 Markers - enter free text
The entered text will be shown at the given position in the trace as marked in figure 3.15 below.
Figure 3.15 The entered text shown at a given position
CHAPTER 3 25
The other possibility in MyoVIEW is to predefine Marker text and link them to Hotkeys. This functionality is very useful for Marker
text used again and again. In the Markers submenu press settings and the dialog box below will be shown.
Figure 3.16 Marker strings
Here the Hotkey (Function key) is selected and the appropriate text linked to a Hotkey is entered. Below the text ‘Drug 1’ has been
connected to Hotkey F1. Every time the F1 Hotkey is pressed during an experiment the text ‘Drug 1’ will be added to the trace as
a marker at the given time.
There is in total 12 Hotkeys (F1 - F12) that can be predefined with a user selected Marker text of choice.
Figure 3.17 Hotkey
3.4.2 Data Menu
In the Data Menu there are three submenus: Export, Delete and Video Recording.
Figure 3.18 Data Menu
26
MyoVIEW - USER MANUAL
3.4.2.1 Export submenu
• Export to Excel - This submenu will export all the data selected in the Data Sheet into
Excel. By clicking Export to Excel Excel (only if installed on the computer) opens up
and all data from the MyoVIEW data sheet will be exported into an Excel sheet.
Figure 3.19 Export submenu
• Export to CSV file - This submenu will export data in the Data Sheet into a comma
separated file. By clicking the Export to CSV file icon the following will be shown if different export types (Mean, Maximum and Minimum) have been used to generate the
data in the Data Sheet.
Select the data sets to export and save the CSV file.
• Copy to clip board – This function will copy the data in the data sheet to the clip
board and can then be pasted into an appropriate program as e.g. Word, Excel and
PowerPoint.
3.4.2.2
Figure 3.20 Export data to CVS file
Delete submenu
• Clear Data Sheet - This will delete all the data in the Data Sheet.
NOTE
THE DATA FROM THE DATA SHEET CANNOT BE RECOVERED IF ‘CLEAR DATA SHEET’
IS USED.
• Clear Action Sheet - This will delete all the data in the Action Sheet.
Figure 3.21 Delete submenu
NOTE
THE DATA FROM THE ACTION SHEET CANNOT BE RECOVERED IF ‘CLEAR ACTION
SHEET’ IS USED.
3.4.2.3 Data Collection submenu
• Synchronize data - This make sure that all recorded data is synchronized in respect to
time. MyoVIEW will check for hardware connected (Pressure Interface, Camera, Flow
meter) and dependent on the hardware identified the maximum data collection rate
possible will be set and all parameters will be recorded as synchronized data sets
in respect to time. The actual set sampling rate will be written in the action sheet as
shown in figure 3.23 below. The data will be recorded as synchronized data as soon as
the Synchronise data box is checked. When the Synchronise data box is unchecked
all incoming data will be collected at maximum speed for each parameter and a line
in the Action Sheet with the text Data Samples not synchronised will be added with a
time stamp.
Figure 3.22 Data Collection
submenu
Figure 3.23 The actual set sampling rate written in the action sheet
CHAPTER 3 27
3.4.2.4
Video Recording submenu
• Record Video - Selected if the video signal from the USB camera should be saved together with all the trace recordings of an experiment. If this is not selected you will not
be able to start video recording during your experiment without first stopping the Video
Capture, save the data and start a new file.
VERY IMPORTANT
IF THE VIDEO FILE OF THE EXPERIMENT SHOULD BE SAVED IT IS EXTREMELY
IMPORTANT TO SELECT ‘RECORD VIDEO’ BEFORE STARTING THE VIDEO CAPTURE
IN THE ‘CAMERA CONTROL WINDOW’.
Figure 3.24 Video Recording
submenu
• Video quality - The video of the experiment can be recorded in three qualities; Low,
Medium and High. The size of the recorded video file will increase significantly from a
low to a high quality file. An example is given here:
A 10 minutes video file size:
• Low quality: 10MB
• Medium quality: 50MB
• High quality: 150MB
Free disk space availability on the computer should be considered before selecting the
quality of the recorded video.
3.4.3 View Menu
In the View Menu there are five submenus; Application layout, Data Analysis, Live Traces, Trace Selection and Zone Colors.
Figure 3.25 View Menu
3.4.3.1 Application Layout submenu
• Show Analysis Window – Will open up the Image Analysis window (Video from camera) if closed by the user.
• Reset Window Layout – Return the MyoVIEW layout to the default layout. Very useful
in situations where the layout needs to be ‘cleaned up’.
• Show Status Bar – The status bar is the bar at the bottom of the screen showing the
Hotkey’s F1-F12.
Figure 3.26 Application Layout
submenu
3.4.3.2 Data Analysis sub menu
• Show Data Sheet - Open the Data sheet
• Show Action Sheet - Open the Action Sheet. The action sheet will list all the events as
e.g. camera calibration, sequencer tasks, markers etc.
• Select all traces - To transfer data from all open traces for the same time frame the
Select all traces are selected. When one time frame is selected in one trace all open
traces will have the same time frame. If this is followed by clicking on the Export to
Datasheet in the Trace Selection submenu then the data from all the open traces for
the selected time frame will be transferred to the Data Sheet.
To transfer only the data from one given trace and time frame the Select all traces
is NOT selected. When the Export to Datasheet in the Trace Selection submenu is
selected only data from the selected trace and time frame is transferred to the data
sheet.
Select all traces is marked. Followed by Export to data Sheet will transfer data to the
data sheet from all the selections shown in figure 3.28.
28
MyoVIEW - USER MANUAL
Figure 3.27 Data Analysis
submenu
Figure 3.28 Selection of all traces
See Data Sheet marked in figure 3.29 below.
Figure 3.29 Export of data sheet of all traces
When Select all traces is NOT marked as shown below Export to data Sheet will only transfer data to the data sheet from the
selection shown in the given trace.
Figure 3.30 Selection of the given trace
CHAPTER 3 29
See Data Sheet marked in figure 3.31 below.
Figure 3.31 Export of data sheet of one given trace
3.4.3.3 Live Traces submenu
• Time (secs) - Number of seconds shown on the recording traces. If 100 seconds is
typed in then the last 100 seconds of the running traces are shown.
• Start Live Trace/Stop Live Trace - Stop Live Trace will stop the refreshing of the trace
and let the current trace ‘freeze’ making it possible to look carefully at a part of the
curve while the data still being recorded. Start Live trace will always show the ‘front’ of
the trace where new data is being recorded into the trace.
• Scrolling Bar - The scrolling bar is used to scroll through the traces. Press the minus
to scroll back in time and the plus to scroll forward in time. Alternative move the slider
toward the minus or plus to scroll back and forth in time respectively.
Figure 3.32 Live Trace submenu
3.4.3.4 Trace selection submenu
• Export Type - Selection of the data transformation type to be carried out on the selected data:
- Mean Value: Calculate the mean value of the selected data
- Maximum Value: The highest value in the selected data set
- Minimum Value: The lowest value in the select data set
• Export to Data Sheet - Transfer the Mean, Maximum or Minimum value (depending on
the selected Export Type) to the Data Sheet.
IMPORTANT
BEFORE EXPORTING DATA TO THE DATA SHEET SELECT THE “SELECT ALL TRACES” IN
THE DATA ANALYSIS MENU IF DATA FOR THE MARKED TIME FRAME FROM ALL OPEN
TRACES SHOULD BE EXPORTED TO THE DATA SHEET. OTHERWISE ONLY THE MARKED
TRACE WILL BE EXPORTED.
Figure 3.33 Trace selection
submenu - Export type
Figure 3.34 Trace selection
submenu
• Expand View - Zoom function. Select a time frame (>5 sec) and press EXPAND VIEW
-> the selected time frame will be expanded to fill the whole viewing field of a trace e.g.
a selected time frame of 90 sec will by pressing EXPAND VIEW result in traces where
maximum the last 90 seconds of the traces can been seen on the screen at any given
time. When pressing EXPAND VIEW the selected time frame will be transferred to the
Time field in Live Traces submenu
3.4.3.5 Zone colors sub menu
• Zone Border color - Select the color of the Zone box wherein the vessel dimension
should be measured.
• Outer edge color - Select the color of the tracking bar for the outside wall position of
the mounted vessel.
• Inner edge color - Select the color of the tracking bar for the inside wall position of the
mounted vessel.
30
MyoVIEW - USER MANUAL
Figure 3.35 Zone colors
submenu
CHAPTER 4 - DATA COLLECTION AND SAVING DATA
MyoVIEW will not record and save data for any parameters before the Start recording data button is pressed at the status bar of
MyoVIEW shown in figure 4.1 below. MyoVIEW will in the traces write “Data Not Saved” as long as the Start button is not activated
as an indication of that the incoming data will not be collected and saved.
Figure 4.1 Start recording data button
Pressing the Start button will reset the time to zero and the traces shown and the Start button will change to a Stop collecting
data button as showed in figure 4.2 below.
Figure 4.2 Stop collecting data button
CHAPTER 4 31
The data will now be recorded and saved in MyoVIEW until the Stop recording data button is pressed. When the Stop recording
button is pressed a marker will be shown in the trace with the text “Data Collection stopped” and in the Action Sheet (see figure
XX) a line will be entered with the text Data Collection stopped with a time stamp. Furthermore, all traces will show the text Data
Not Saved when the Stop button has been pressed or the Start button not activated.
If the Start collecting data button is activated again after it has been stopped using the Stop button MyoVIEW will ask if the
former recorded data should be saved in a file or discarded.
Figure 4.3 Warning message - save
If the data should be saved enter a title of the experiment and a description of the experiment as shown in figure 4.4 below. Press
save.
Figure 4.4 Save Experiment
Enter a filename and the location on the computer where the file should be saved. After reactivating the Start button and saving
the former data MyoVIEW will zero the time, reset the trace and start collecting and saving the new data.
32
MyoVIEW - USER MANUAL
CHAPTER 5 - DATA ANALYSIS AND EXPORT
MyoVIEW will record and save data for all parameters during an experiment. Open a given experiment and data file in MyoVIEW.
The open file will show you the same layout as shown when the file was saved. Below is an example.
Figure 5.1 Example of an open file
To look at other parameters of the experiment:
• Open a new trace and right click on the trace to select the parameter of choise.
• Select zone 1 or zone 2 and eventually adjust the y-axis to see the recorded trace for the given parameter.
CHAPTER 5 33
Scroll through the traces and recorded video by adjusting the time in the View Menu and by using the scrolling function (see
chapter 3.4.3.3 and figure 5.2 below). The video of the experiment will be shown in the Camera Control window if Record Video
was selected before the video capture was started. Scrolling through a trace using the scroll function will show the trace parameter data as well as the recorded video image at the given time as seen in figure 5.2 below.
Figure 5.2 Scrolling through the data using the scroling bar in the Live Traces submenu,
shows the traces as well as the corresponding video with the two zones.
Export the data of interest to the MyoVIEW Data Sheet as described in chapter 3.4.2.1. All the collected data in the MyoVIEW
Data Sheet can be exported to a CSV or Excel/Word/WordPad. The Raw Data can be exported to alternative programs for data
analysis (see below).
Export of raw data:
Export of raw data to Excel, Word, or WordPad: Select/mark a given part or the whole trace. Drag the selected part to Excel/Word/
WordPad. The exported raw data will be shown in two columns where the first column always are the time and the second column
the given parameter of the selected trace.
Export of raw data to a CSV file (comma separated file):
Select/mark a part of a trace or the whole trace. Drag the selected part while holding down the ALT key to an appropriate folder.
The CSV file will be given an arbitrary file name. Rename the file if wanted. The exported raw data will be shown in two columns
where the frist column always are the time and the second column the given parameter of the selected trace.
Export Video Image:
The image shown in the Camera Control window can be exported either as an image file bescribed in chapter 2.3.4 and as shown
in figure 2.18 or drag the image in the Camera Control window to e.g. Word, Powerpoint, Excel, Wordpad etc while pressing the
SHIFT key.
34
MyoVIEW - USER MANUAL
APPENDIX 1 - PARAMETER FORMULAS USED IN MYOVIEW
MyoVIEW performs several measurements and calculations relevant to vascular physiology. These measurements and calculations are based on raw inputs (data from the flow meter and pressure interface), as well as vessel dimension outputs. The following is a list of the formulas used to calculate real-time parameters and how they are relevant to vessel physiology and vascular
function.
WALL THICKNESS
(De-Di)/2
De is the outer or external diameter of the vessel and Di is the luminal or inner diameter. Wall thickness can be used as an index
of vascular hypertrophy; the thicker the wall, the greater the degree of hypertrophy.
CROSS SECTIONAL AREA
(π/4)*[(De)2 - (Di)2]
De is the outer or external diameter of the vessel and Di is the luminal or inner diameter. Similar to wall thickness, cross sectional
area can be used as an indication of hypertrophy or vascular wall remodeling.
MEDIA/LUMEN RATIO
(De - Di)/( Di)
De is the outer or external diameter of the vessel and Di is the luminal or inner diameter. The media/lumen ratio is indicative of
morphological changes and can be used along with wall thickness and cross sectional area to determine the particular form of
hypertrophy.
MEAN PRESSURE
(Pin+Pout)/2 or (P1+P2)/2
Pin or P1 is the input or inlet pressure and Pout or P2 is the output or outlet pressure. The mean pressure is the average of the inlet
and outlet pressures. It is necessary to monitor when flow is induced by a pressure gradient or differential between P1 and P2.
Mean pressure should be constant when measuring flow-mediated dilation to verify that increases in vessel diameter are flowinduced and not pressure induced.
VASCULAR RESISTANCE
Pdiff/Q
Pdiff is the pressure difference and Q is the flow volume. The vascular resistance is the force opposing the movement of solution
through a vessel. It is inversely proportional to the vessel radius to the 4th power. A greater vascular resistance will require a
greater degree of vasodilation in order to maintain constant pressure within the vessel.
SHEAR STRESS
(8* *V)/Di
The constant, , (or eta, sometimes represented as µ, or mu) is the dynamic viscosity, V is the flow velocity and Di is the inner
diameter of the vessel. Shear stress is a characterization of the frictional drag exerted on arterial walls during flow. Many physiological functions are influenced and promoted by this biomechanical force. Normal levels of shear stress serve to maintain wall
physiology. High shear stress triggers vascular dilation in order to regulate the mechanical forces exerted on arterial walls.
APPENDIX 1 35
APPENDIX
The following example is given for water at 37°C to help with the conversion of input to intermediate to output units. Input units
will be determined by either the hardware attached or the task set up in the software. For example, all units of length will input
as micrometers if the dimensioning task is set up this way in the task manager. The output units were taken from a survey of the
primary literature. The selection of intermediate units is personal preference. In this example, “cgs” units have been chosen (i.e.,
centimeters, grams and seconds) as the intermediate units because most of the output values taken from the literature use cgs
standards, such as dynes.
VESSEL FLOW RECORDING TASK
Intermediate units
Length (cm):
Mass (g):
Time (sec.):
Solution presets constants
Density ( 9.937e-1) :
g/cm^3
Viscosity: 6.904e-4
g/(cm x s)
Input Units
Slope
Inter. Units
Volume Flow (Q)
µl/min
1.667e-5
cm^3/s
Inner Diameter (Di)
µm
1.000e-4
cm
Inner Area (Ai)
µm^2
1.000e-8
cm^2
Inlet Pressure (Pin)
mm Hg
1.333e3
g/(cm*s^2)
Outlet Pressure (Pout)
mm Hg
1.333e3
g/(cm*s^2)
Inter. Units
Slope
Output Units
Flow Velocity cm/s
1
cm/s
Mean/Diff. Pressure
g/(cm*s^2)
7.501e-4
mm Hg
Vascular Resistance*** g/(cm^4*s)
1
(dyne*s)/cm^5
Vascular Resistance***
g/(cm^4*s)
0.100
(MPa*s)/m^3
Shear Stress
g/(cm*s^2)
1
dyne/cm^2
UNIT CONVERSIONS
Input Units to Intermediate Units Conversions
Intermediate Units to Output Units Conversions
*** Vascular Resistance is commonly reported in either (dyne*s)/cm5 or (MPa*s)/m3, or both.
FOR FURTHER READING
Kristopher S Cunningham and Avrum I Gotlieb. The role of shear stress in the pathogenesis of atherosclerosis. Laboratory Investigation (2005) 85, 9–23. (Please note that the units given for Re in this reference are wrong.
36
MyoVIEW - USER MANUAL
APPENDIX 2 - MYOVIEW UPGRADES OR CHANGE LICENSE
MyoVIEW upgrades is free within the same version number e.g. if version 3 has been purchased all upgrades up to version 3.9.9
will be free of charge. When DMT release a new version number a complete installation of new the MyoVIEW version will be performed keeping the old version.
A question mark icon is shown in MyoVIEW in the right corner (see figure A2.1). Clicking this icon will open the License Manager
of MyoVIEW as seen in figure A2.1 below. Here the license version installed can bee seen. Furthermore the MyoVIEW license can
be either upgraded or changed.
Upgrade license
This is used for upgrading MyoVIEW with modules in the the basic version of MyoVIEW e.g. as the FlowMeter Module. A new
license code will follow and be delivered with an investment in a FlowMeter as a new module for the Pressure Myograph System.
The MyoVIEW license will have to be upgraded with this new license.
Figure A2.1 Upgrade or change MyoVIEW licens
Change license
Used to shift between MyoVIEW for the Pressure Myograph System and the Culture Myograph System.
Figure A2.2 Change license
APPENDIX 2 37
Figure A2.3 Fill in license and click “change license”
38
MyoVIEW - USER MANUAL
NOTES
NOTES 39
Aalborg Hospital South • Academic Medical Center Amsterdam • Academy of Sciences of the Czech Republic • Actelion Pharmaceuticals Ltd • Ahmadu Bello University • Akzo Nobel/Organon • Albert
Einstein College of Medicine • Albert-Ludwigs-Universität Freiburg • Arete Therapeutics • Aarhus Kommunehospital • Arizona State University • Asterand UK Ltd. • Aston University • AstraZeneca •
AstraZeneca R&D Mölndal • Aventis Pharma • Bayer HealthCare AG • Baylor College of Medicine • Bristol-Myers Squibb • Brock University • Bulgarian Academy of Sciences • Campus Charité Mitte •
Cardiff University • Case Western Reserve University • Charles University • Childrens Hospital of Pittsburgh • Chinese University of Hong Kong • Christian-Albrechts-Universität zu Kiel • Clinica Medica,
PUGD Udine • CNRS d’Orléans • CNRS UMR 6097 • Columbia University • Copenhagen Hospital Glostrup • Copenhagen University • Cork University Maternity Hospital • Cornell University • Coventry
University • CV Therapeutics Inc. • Cytokinetics Inc. • Daegu Catholic University • Deakin University • Der Universität Freiburg • Der Universität Im Neuenheimer Feld 326 • Deutsche Forschungsgemeinschaf
(DFG), Bonn • Duke University • Duke University Pharmacology • Dundalk Institute of Technology • East Carolina University • Eastern Virginia Medical School • Ecole Polytechnique Fédérale De Lausanne
• Ege University • Emory University • Emory University, School of Medicine • Erasmus Universiteit Rotterdam • Federal University of Minas Gerais • Ferring Research Institute Inc. • Florida Atlantic
University • Florida International University • Forschungsverbund Berlin E.V. • Fourth Military Medical University • Franz-Volhard-Clinic • Free University Berlin • Freie Universität Berlin • Friedrich Schiller
University • Fudan University • Georgetown University • Glasgow Caledonian University • Glasgow University • GlaxoSmithKline • Glenfield Hospital • Göteborg University • Grand Vally State University
• Harefield Hospital • Harvard Medical School • Harvard University • Hebei Medical University • Henry Ford Health System • Hospital Clinic (Barcelona) • Hospital Lariboisiere • Hospital Ramón y Cajal
(Madrid) • Hospital Universitario de Getafe (Madrid) • Hospital Universitario La Fe (Valencia) • Hospital Universitario Virgen del Rocío (Sevilla) • Humboldt Universität zu Berlin • ICBM University of Chile
• Imperial College London • Indiana University • INSERM U541 • INSERM U637 • INSERM U644 • INSERM U772 College de France • Inserm U858 • Institut de Pharmacologie Moléculaire et Cellulai
• Institut De Recherches Cliniques De Montréal • Institute of Cellular Biology and • Institute of Immunology & Physiology • Istanbul University • J.W. Goethe-Universität • Jagiellonian University • James
Cook University • Johann-Wolfgang-Goethe-Universität • Johns Hopkins University • Juntendo University • Justus-Liebig-Universität Giessen • Kaohsiung Medical University • Karolinska Institute • KAS
Glostrup • Katholieke Universiteit Leuven • King’s College London • King’s College London GKT School of Medicine • KK Women’s and Children’s Hospital • Klinikum Der Universität Zu Köln •
København Universitet • Korea University • Laboratorios Almirall (Barcelona) • Linköping University • Liverpool University • Loma Linda University • Loyola University At Chicago • Ludwig Maximilians
University • Lund Universitet • Lundbeck Pharmaceuticals • Luther College • M.V.Lomonosov Moscow State University • Manchester Royal Infirmary • Manchester University • Manitoba Institute of Child
Health • Marquette University • Martin-Luther Universität Halle-Wittenberg • Massachusetts General Hospital • Max-Delbrück-Centrum • Mayo Clinic • McMaster University • MDC Berlin • Medical
College of Georgia • Medical College of Wisconsin • Medical University of South Carolina • Memorial University Of Newfoundland • Michigan State University • Mogiglass Artigos Para Laboratorio LTDA
• Monash University • Mount Sinai School of Medicine • Nanyang Technological University • Nat. Inst. Of Pharnaceutical Education & Research • National Defencse Medical Center • National Institute
on Aging • National University of Ireland • NeuroSearch A/S • Neurox Pharmaceuticals LLC • New York Medical College • New York Presbytarian • North Carolina Central University • North Sichuan
Medical College • Norwegian Univ Sci Tech • Novo Nordisk A/S • Ohio State University • Ono Phamaceutical Co., Ltd. • Oregon Health And Science University • Orthologic Corp. • Pathology “Nicolae
Simionescu” • PDL BioPharma • Pennsylvania State University • Pfizer Ltd. • Philipps Universität • Proteon Therapeutics • Queen Mary University London • Queen’s University • Queens University
Belfast • Radboud University Nijmegen Medical Centre • Ranbaxy • RMIT University • Robert Gordon University • Royal College Of Surgeons In Ireland • Ruhr-Universität Bochum • Saarland University
• Saint Louis University • Samsung Deutschland GmbH • Sanofi-Aventis • Shanghai Institute of Materia Medica • Skejby Sygehus, Aarhus • Slovak Academy of Sciences • SmithKline Beecham • South
Florida VA Hospital • St. George’s Hospital • St. Paul’s Hospital • St. Thomas’ Hospital, London • State University of New York • Stony Brook University • Sultan Oaboos University • Swedish Defence
Research Agency, FOI • Swiss Cardiovascular Ct. Bern • Swiss Federal Institute Of Technology • Syddansk Universitet • Technischen Universität Dresden • Technischen Universität München • Temple
University School of Medicine • Texas A&M University HSC • Texas Southern University • The American Cardiovascular Research Institute • The Australian National University • The Chinese University of
Hong Kong • The Cleveland Clinic • The College Of William & Mary • The Edith Wollfson Medical Center • The John Curtin School of Medical Research • The Ohio State University School of Public Health
• The Panum Institute, Copenhagen • The University of Alabama At Birmingham • The University of Chicago • The University of Edinburgh • The University of Hong Kong • The University of Liverpool •
The University of Naples -Federico II • The University of Newcastle • The University of Queensland • The University of Sydney • The University of Texas Medical Branch • Theravance, Inc. • Tokyo Medical
and Dental University, School of Medicine • Tufts University • UCL Université Catholique • UHI Millennium Institute • Ulleval University Hospital • Universidad Autónoma de Barcelona • Universidad
Autónoma de Madrid • Universidad Complutense de Madrid • Universidad de Castilla-La Mancha (Albacete) • Universidad De Chile • Universidad De Murcia • Universidad de Salamanca • Universidad
de Santiago de Compostela • Universidad de Sevilla • Universidad de Valencia • Universidade Do Estado Do Rio De Janeiro • Universit Milano Bicocca • Universitá Degli Studi De Torino • Universitá
Degli Studi Di Brescia • Universitaet Göttingen • Universitaet Hamburg • Universität Bern • Universität Geissen • Universität Göttingen • Universität Hamburg • Universität Heidelberg • Universität
Klinikum Der JWG • Universität Marburg • Universität Regensburg • Universität Rostock • Universität Tübingen • Üniversität Zürich • Universitätshospital Zürich • Universitätsklinik Essen •
Universitätskliniken des Saarlandes • Universitätsklinikum Berlin • Universitätsklinikum Bonn • Universitätsklinikum Carl Gustav Carus • Universitätsklinikum Eppendorf, Hamburg • Universitätsklinikum
Essen • Universitätsklinikum Münster • Universitätsklinikum Schleswig-Holstein • Universitätsmedizin Berlin-Charité • Universite Bordeaux 2 • Université catholique de Louvain • Université D’Angers •
Université de Genéve • Université de Tours • Université Henri Poincaré • Université Victor Segalen • Universiteit Antwerpen • Universiteit GENT • Universiteit Maastricht • Universitetssjukhuset UMAS
MALMÖ • Universitetssykehuset Nord-Norge • Universiti Brunei Darussalam • University College Dublin • University College London • University Hospital (CHUV) • University Hospital of Copenhagen Rigshospitalet • University Hospital Zürich • University Newcastle upon Tyne • University of Aarhus • University of Alberta • University of Amsterdam AMC • University of Arizona • University of Bath •
University of Bern • University ff Birmingham • University of Bonn • University of Brescia • University of Brighton • University of Bristol • University of British Colombia • University of Calgary • University
of California - Irvine • University of Cambridge • University of Catania • University of Cologne • University of Colorado • University of Debrecen Inst Cardio • University of Dresden • University of Dundee
• University of Edinburgh • University of Essen • University ff Exeter • University of Florida • University of Georgia • University of Glasgow • University of Göttingen • University of Groningen • University
of Guelph • University of Heidelberg • University of Iceland • University of IL Urbana-Champ • University of Iowa • University of Kansas • University of Kentucky • University of Leeds • University of
Leicester • University of Liverpool • University of London • University of Louisville • University of Lübeck • University of Lund • University of Maastricht • University of Malaya • University of Manchester
• University of Manitoba • University of Maryland • University of Medicine and Pharmacy • University of Melbourne • University of Miami • University of Michigan • University of Missouri •
University of Montreal • University of Nevada, Reno • University of New Hampshire • University of New Mexico • University of New South Wales • University of North Dakota • University of
North Texas • University of Northern British Columbia • University of Nottingham • University of Osijek • University of Otago • University of Ottawa • University of Oxford • University of
Padova • University of Pennsylvania • University of Pisa • University of Pittsburgh • University of Queensland • University of Rochester • University of Sao Paulo • University of
Saskatchewan • University of Scranton • University of Sheffield Medical School • University of South Alabama • University of Southampton • University of St. Andrews •
University of Strathclyde • University of Sunderland • University of Sydney • University of Szeged • University of Tampere • University of Texas • University of Texas
Health Science Center • University of Toronto • University of Tsukuba, Graduate School of Comprehensive Human Sciences • University of Tübingen •
University of Turku • University of Utah • University of Vermont • University of Virginia • University of Wales • University of Warwick • University of
Washington • University of Zurich • University of Virginia • University Victor Segalen • Virginia Commonwealth University • Wake Forest
University School of Medicine • Washington University in St. Louis • Wayne State University • Wenzhou Medical College •
West Virginia University • Western Michigan University • Westfälische Wilhelms-Universität
DMT A/S
Skejby Science Center
Skejbyparken 152
DK-8200 Aarhus N
Denmark
DMT-Asia Ltd.
Rm 2402B, Great Eagle Centre
23 Harbour Road
Wanchai, Hong Kong S.A.R.
P.R. China
DMT-Asia (China office)
Rm 28C, No. 8 Dong Fang Road
Lu Jia Zui Financial District
Shanghai 200120
P.R. China
DMT-USA, Inc.
525 Avis Drive
Suite 10
Ann Arbor, MI 48108
USA
Tel.: +45 87 41 11 00
Fax: +45 87 41 11 01
Tel.: +852 6621 8337
Fax: +852 3020 7554
Tel.: +86 (0) 21 5425 1330
Fax: +86 (0) 21 5877 0063
Tel.: +1 770 612 8014
Fax: +1 678 302 7013
www.dmt.dk
[email protected]
[email protected]
www.dmt-asia.com
[email protected]
[email protected]
www.dmt-asia.com
[email protected]
[email protected]
www.dmt-usa.com
[email protected]
[email protected]
40
MyoVIEW - USER MANUAL
MyoVIEW/11/2013
Münster • William Harvey Research Limited •