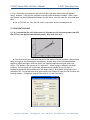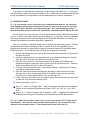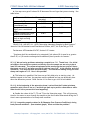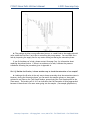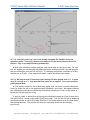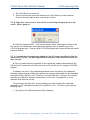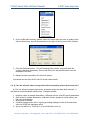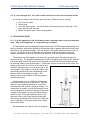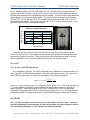
1
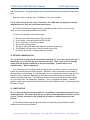
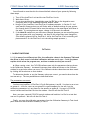
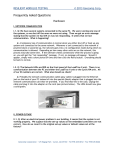
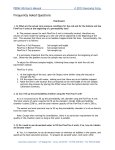
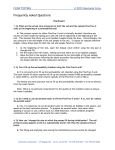
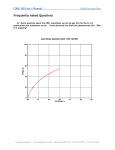
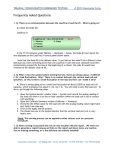
CYCLIC-Stress Path: MS User's Manual
© 2013 Geocomp Corp.
Frequently Asked Questions
Hardware
I. GENERAL
I-1. Q: When I view the system before starting a test, there is always an offset of about
±0.005 kN (1 lb). Why? There is no contact between the vertical load cell and specimen,
so why is there a small offset in the load and how can I make it zero?
A: Between tests, the load cell output will usually drift a small amount. At best, the noload condition will be in the range of ±0.025% of load cell full capacity, which translates to
about ±0.001 kN (±0.25 lb) for a 4.45 kN (1000 lb) load cell. If you observe a no-load
condition on the System Monitor window that is greater than ±0.025% of full capacity, use the
following steps to zero the load cell.
1. Be sure the load cell is not in contact with anything.
2. Bring down the Calibrate menu and select Summary to open the Calibration Summary
window. Position this window beside the System Monitor window.
3. Note the Load reading in counts on the System Monitor window (top left text field).
4. Replace the Offset value that is shown on the Calibration Summary window (when
Load is selected for the Channel choice) with the Load reading (in counts) that is on
the System Monitor window.
5. Click the Apply button, the Download button and then the Ok button to close the
Calibration Summary window.
6. You should now see in the System Monitor window that the vertical load cell reading
(in engineering units) is within ±0.025% of full capacity.
*Note: This zeroing process can be applied to other sensors such as the pressure
transducers.
I-2. Q: What are the actual zero pressures for both the cell and the sample FlowTrac-II
units at the beginning of a cyclic triaxial test?
A: The pressure sensor for each FlowTrac-II unit is inside the unit. Consequently, any
column of water in the tubing that goes from the unit to the test cell will result in a pressure
being registered by the pressure transducer at the beginning of a test. Conventionally, the
zero pressure condition is the pressure with the top of the column being at the mid height of
the soil sample in the test cell just before the test is started (assuming no air bubbles trapped
in the lines).
To adjust for different sample heights, follow these steps for both the cell and sample
FlowTrac-II units at the beginning of a test:
1. Open the Output valve (either using the FlowTrac-II keypad or the Valves Control
window in CYCLIC5N)
2. If the output line is connected to the cell, disconnect it and be sure there are no air
bubbles in it. If it is not connected to the cell, use the FlowTrac-II pump to push
Geocomp Corporation · 125 Nagog Park · Acton, MA 01720 · Tel 978-635-0012 · Fax 978-635-0266
CYCLIC-Stress Path: MS User's Manual
© 2013 Geocomp Corp.
water through the line until there are no bubbles. (See Q/A 4 above for instructions
to eliminate air bubbles.)
3. Open the System Monitor window (System option in the View menu) and the
Calibration Summary window (Summary option in the Calibrate menu).
4. Raise the end of the output line to the location that corresponds to the mid-height of
the soil sample. Record the pressure value (in counts) that is shown on the System
Monitor window (the left-hand text field for the pressure reading).
5. On the Calibration Summary window, select the appropriate Channel (Cell Pressure or
Sample Pressure). Type the pressure value you recorded into the Offset text field.
Click the Apply button.
I-3. Q: Can I fill up the cyclic triaxial chamber using the FlowTrac-II unit?
A: It is not practical to fill the test chamber using the FlowTrac-II unit. The total volume
of water required to fill the standard (model 3400) cyclic triaxial chamber is about 2500 ml,
and the total volume capacity of the pump cylinder in the FlowTrac-II unit is 250 ml.
The easiest and most practical way to fill the test chamber is to do so directly from the
water faucet.
*Note: There is no particular requirement for the quality of the chamber water
as long as the water is clean. Water that is drinkable satisfies this requirement.
I-4. Q: What are the minimum specifications for a computer able to handle the new
software for the lab equipment?
A: Any computer that can run Windows XP or Windows Vista will do the job. Typically,
our software programs are only 500 Kb in size. Test data are stored in binary files that are
typically 10 Kb in size. Consequently, very little computer memory and disc space are used.
II. LIMIT SWITCHES
II-1. Q: During the test, a controller error message appears on the screen telling me that a
limit switch is on. What should I do?
A: The first thing to do is to look at the front panel of the FlowTrac-II units to see which
unit has a red limit switch flashing. Close the valve on the test cell to which the line from
that FlowTrac-II unit is connected and then open the System Monitor window. Record the
appropriate pressure value (cell pressure or sample pressure in engineering units.
Disconnect the line from the quick-connect that has the closed valve. Depending on
which limit switch was triggered, refill the pump it was empty or empty it if it was full so that
the pump is about 50% full. Reconnect the line to the test cell valve.
Before opening the valve, reapply the pressure you recorded using the FlowTrac-II LCD
menus and keypad. (From the main menu select Control, then Apply and Maintain Pressure,
Geocomp Corporation · 125 Nagog Park · Acton, MA 01720 · Tel 978-635-0012 · Fax 978-635-0266
CYCLIC-Stress Path: MS User's Manual
© 2013 Geocomp Corp.
then Final Pressure. Using the keypad, enter the pressure value you recorded and then press
Ent.)
Open the valve on the test cell. Click Retry on the error window.
II-2. Q: After running several cyclic triaxial tests, the LEMA does not apply and hold the
designated load or does not cycle the actuator piston.
A: The limit switches are triggered which generates a fault in the servo-drive motor,
which in turn prevents the actuator from moving.
To correct the problem, follow these steps:
1.
2.
3.
4.
5.
6.
7.
Run the cyclic software and open the Drive menu.
Go to Control > Actuator and enter 50 N (10 lb).
Click "reset fault" on the Drive window.
The actuator must go down.
The upper yellow LED must blink when the actuator passes it by.
The actuator will stop when it hits the lower limit switch.
Be careful that there is nothing under the actuator.
III. NETWORK COMMUNICATION
III-1. Q: We have several systems connected to the same PC. We were running only one of
the systems, so we shut off the ones we were not using. Then we got an error message
stating that the system we had left on was not responding. It seems that we lost
communication. What is happening?
A: A temporary loss of communication is normal when you either shut off or boot up any
system unit connected to the same network. Whenever a unit connected to the network is
powered down or powered up, the network goes into a re-configuration mode during which no
communication is allowed. Depending on how many other units are on the network, this
process may take some time. If the software checks connections while the process is going
on, you will get the “not responding” message. If not, no message will appear. Should it
appear, simply wait a short period of time and then click the Retry button. Everything should
be back to normal.
IV. POWER OUTAGE
IV-1. Q: After an electrical power problem in our building, it seems that the system is not
working properly. We suspect that the set-up values on the embedded controllers are not
correct. How do we revert to the original set-up values or default values set at the
factory?
A: The default values may change either after an electrical power problem or due to
inadvertent actions by the end user.
Geocomp Corporation · 125 Nagog Park · Acton, MA 01720 · Tel 978-635-0012 · Fax 978-635-0266
CYCLIC-Stress Path: MS User's Manual
© 2013 Geocomp Corp.
You will need to revert back to the internal default values of your system by following
these steps:
1. Turn off the LoadTrac-II unit and the two FlowTrac-II units.
2. Wait about 10 sec.
3. As you turn each back on, immediately press the ESC key on the keypad to reset
everything back to the imbedded controller default values.
4. Now go to your LoadTrac-II and FlowTrac-II hardware manuals. In Section 2.1.4 of
each manual (Setup section) you will find a table of default settings for your system.
Got through each LCD menu and be sure the settings on the menu agree with those in
the table. If a setting does not agree, change it to the one in the manual.
5. If the Node ID numbers on your units were changed (because you are controlling more
than one system with your computer), set them to the values they were changed to.
(The default values are 65 for LoadTrac-II, 66 for the FlowTrac-II unit controlling cell
pressure and 67 for the FlowTrac-II unit controlling sample pressure.)
Software
I. CALIBRATION/ZEROING
I-1. Q: In many of our different test files, the calibration values in the Summary Table and
the values in each sensor's individual calibration table are not in sync. Could you please
explain which values the program uses, and how to make sure they are correct?
A: When running a test, the CYCLIC5N software uses only the parameters that are shown
in the Calibration Summary. A mismatch between these values and those on the Calibrate
window for a particular sensor can occur if the Calibrate window values have not been saved
by clicking the Save button on that window.
To determine whether or not the Summary values are correct, you need to know how the
test was set up. The two possibilities are described below.
The parameters are correct
You have two LoadTrac-II/FlowTrac-II/Cyclic-RM systems, A and B. You plan to run a test
on system A. A file for a test run on system B is a good template for the test, but the
calibration parameters in it are those for the sensors on system B. You open a CYCLIC5N
control window and load that file into the window. We will call that file Test-B.
Next, you open a second CYCLIC5N control window and load into it a file for a test that
was run on system A. We will call that file Test-A.
Finally, you copy the calibration parameters from the Calibration Summary in Test-A and
paste them into the Calibration Summary in Test-A.
Geocomp Corporation · 125 Nagog Park · Acton, MA 01720 · Tel 978-635-0012 · Fax 978-635-0266
CYCLIC-Stress Path: MS User's Manual
© 2013 Geocomp Corp.
You now have a control program that contains the correct calibration parameters for
running a test on system A, but those shown on the Calibration Summary will be different
from those on the individual sensor Calibrate windows.
The parameters are not correct
You have two LoadTrac-II/FlowTrac-II/Cyclic-RM systems, A and B. You plan to run a test
on system A. A file for a test run on system B is a good template for the test, but the
calibration parameters in it are those for the sensors on system B. You open a CYCLIC5N
control window and load that file into the window. We will call that file Test-B.
You decide to calibrate the sensors and use Test-B to do it. You go through the
calibration procedure for each sensor and click the Calibrate button on each Calibrate
window. But you forget to click the Save button on each window before closing it.
You now have a control program that has the correct calibration parameters on each
Calibrate window, and they will be different from those in the Calibration Summary.
However, it is the incorrect Summary values that will be used to run the test.
If you know (or suspect) that a test was run using a file with incorrect calibration
parameters on the summary window, you can recover from the error.
Error Recovery
Open a CYCLIC5N control window and load the erroneous test file into it.
You will need to replace the calibration parameters (factors and offsets) that are shown
on the Calibration Summary with correct ones.
If you are certain that the parameters on the individual Calibrate windows are correct,
simply click Save on each of those windows.
If you will have to enter new values manually, there are two ways to do this: (1) delete
the original values and type the new ones into the text fields or (2) copy and paste the new
ones. For the second option, you will need to open a second copy of CYCLIC5N and load the
test file that contains the correct calibration parameters.
Finally, save the file and reload it. The new values will be applied to the processed data.
*Note: The raw data and the results of data reduction shown on the report pages will
be changed. The stress target values that were entered into the Initialization page,
the Consolidation Table pages and the cyclic page will not be changed.
I-2. Q: Our Load cell reading is reading about 10 times too low of what it should be. Can
you please explain to me what may be the problem?
A: When calibrating the load cell, you must have the cable connection on both your
LoadTrac-II unit and Cyclic-RM unit. Both units must be turned on during calibration.
Otherwise, you will get false readings.
Geocomp Corporation · 125 Nagog Park · Acton, MA 01720 · Tel 978-635-0012 · Fax 978-635-0266
CYCLIC-Stress Path: MS User's Manual
© 2013 Geocomp Corp.
I-3. Q: I calibrated my transducer and filled out the Calibration table under the Options
menu. However, I can't get the program to save the new calibration numbers. When I open
the file back up the old calibration numbers are still there. How do I save the new calibration
data?
A: Go to File>Save As. Save the file under a new name such as newtemplate.dat
II. CONSOLIDATION PHASE
II-1. Q: I noticed that the cell volume starts to fluctuate as cell pressures greater than 900
kPa (125 psi) are applied (see attached graph). Why does it do this?
A: The fluctuations you have observed can be the result of the cell pressure I-Gain setting
being too high for the pressure you are applying. As each step in the consolidation phase
applies a higher and higher effective stress, the sample compresses and gets stiffer and
stiffer. The default I-Gain setting of 0.1 works well. (While trying to maintain the target
pressure, the flow pump will try to make adjustments too quickly which will result in
sequential overshoots and undershoots of the target value.) Bring down the Options menu
and select PID. On the sub-menu that opens select Cell Pressure to open the Cell Pressure PID
Settings window. Change the Integral Gain value to 0.1 and click Apply.
Geocomp Corporation · 125 Nagog Park · Acton, MA 01720 · Tel 978-635-0012 · Fax 978-635-0266
CYCLIC-Stress Path: MS User's Manual
© 2013 Geocomp Corp.
If this does not eliminate the fluctuations, try an Integral Gain value of 0.1. If there are
still fluctuations, reduce the Proportional Gain to 0.5. (Note that the settings should be kept
as high as possible so that adjustments will be made quickly but without fluctuations.)
III. SATURATION PHASE
III-1. Q: I am running a cyclic triaxial test on a compacted sand material. My saturation
ratio (Skempton pore pressure coefficient B) does not seem to ever reach the minimum
value of 0.95 that I specified on the Saturation page. Am I doing something wrong? Is
there a technique to improve the initial saturation of the sample before starting the test?
A: First check to be sure that your cell and sample pressure sensor calibration factors are
correct. If there is any reason they might have changed (e.g., they have not been calibrated
recently or there was some event that might have affected the transducer functioning), go
through the calibration procedure described in Appendix A.
Next, you could try a technique widely used to improve the saturation process. Flushing
the specimen with carbon dioxide gas (CO2) to replace as much air as possible prior to
backpressure saturation is a good way to improve saturation because CO2 has higher water
solubility than air. The following steps will guide you through the technique.
1. Dip the top drainage line (far right on the base) into a small container of clear water
and open the valve.
2. Connect a regulated source of compressed CO2 to the bottom drainage line (second
from the left on the base) and open the valve on that line.
3. Open the valve on the CO2 and slowly increase CO2 pressure until bubbles start
escaping through the water into which you have put the top drainage line. Continue
flushing the sample with CO2 for about 15 minutes.
4. Close the CO2 valve and the valve on the bottom drainage. Replace the CO2 source
with the de-aerated water source.
5. Open the valve on the bottom drainage line and apply a small vacuum to the top
drainage line to force a slow upward flow of de-aerated water into the specimen.
Continue until no more bubbles show in the top drainage line.
6. Finally, disconnect the device you are using to apply the vacuum and close the valves
on both the top and bottom drainage lines.
For further information, refer to:
Rad, N. S., and G. W. Clough (1984). "New Procedure for Saturating Sand Specimens"
Journal of the Geotechnical Engineering Division, ASCE, Vol. 110, No. 9, pp. 12051218.
Chaney, R. C.; Stevens, Edward; Sheth, Niranjan. (1979). “Suggested Test Method for
Determination of Degree of Saturation of Soil Samples by B Value Measurement”
III-2. Q: It seems that no matter what we do, we can never achieve 0.95 B value during
the saturation. We used the carbon dioxide flushing method. We increased the time
intervals in the saturation table. Is there anything else that we should try?
Geocomp Corporation · 125 Nagog Park · Acton, MA 01720 · Tel 978-635-0012 · Fax 978-635-0266
CYCLIC-Stress Path: MS User's Manual
© 2013 Geocomp Corp.
A: You may never get a B value of 0.95 because of the soil type that you are testing. See
table below.
Theoretical B-Values for different soils at complete or nearly complete
saturation*
Soil Type
S=100%
S=99%
Soft, normally
0.9998
0.986
Consolidated clays
Compacted silts and clays;
0.9988
0.930
lightly over consolidated
clays
Overconsolidated stiff clays;
0.9877
0.51
sands at most densities
Very dense sands; very stiff
0.9130
0.10
clays at high confining
pressures
*BLACK, D.K., AND LEE, K.L. (1973)”Saturating Laboratory Samples by Back Pressure.”
Journal of the Soil Mechanics and Foundations Division, ASCE, Vol.99,No.SM1,pp.75-93
Furthermore ASTM standard D 4767, Section 8.2.3 states:
”Specimens shall be considered to be saturated if the value of B is equal to or greater
than 0.95, or if B remains unchanged with addition of back pressure increments.”
III-3. Q: We are having problems saturating a sample for a C.U. Triaxial test. Our initial
calculations from moisture content and density show the sample we are using to be at
least 90% saturated. The software/equipment while monitoring the test gives a B factor
that starts out at 0.15 and after running all night we have 0.65. Is this possible, and why?
In addition, if we stop the same test and restart....the saturation reading during the tests
always start again at 0.15. How is this possible?
A: This behavior is possible if the lines are not fully bled prior to starting a test. Air
bubbles trapped in the lines, the specimen and the pedestal and cap can drastically slow
down the saturation process. Refer Section 6.1 for how to get rid of all air bubbles.
III-4. Q: At the beginning of the saturation phase I noticed that the B value (minimum
saturation ratio) went as low as -5 and then got back up to positive values after a while.
What should I do to prevent this from happening?
A: Double the values of the T1, T2 and T3 (on the Saturation page). This will give more
time for the water to move through the sample so that the B value determined during the T1
time is more representative of a steady-state condition.
III-5. Q: I am getting negative values for B (Skempton Pore Pressure Coefficient) during
back pressure saturation. (See attached graph.) What could be the problem?
Geocomp Corporation · 125 Nagog Park · Acton, MA 01720 · Tel 978-635-0012 · Fax 978-635-0266
CYCLIC-Stress Path: MS User's Manual
© 2013 Geocomp Corp.
A: The problem is either wrong calibration factors, or a small leak in the supply solenoid
valve inside the FlowTrac-II unit that is controlling the pore pressure. You can check for a
leak by inspecting the supply line for any water coming out during the saturation phase.
If you find evidence of a leak, please contact Geocomp Corp. for information about
replacing the solenoid valve. If there is no evidence of a leak, calibrate the pressure
transducer following the procedure given in Appendix A.
III-6. Q: Besides the B value, is there another way to check the saturation of our sample?
A: Looking at the B value is the only way to know accurately what the saturation status is.
However, during the Saturation phase, you can watch the sample volume vs. time graph
(plotted in real time on the Test Graph window, opened using the Test Graph option on the
View menu). The leveling off of ∆Vs is an indication that full saturation is being approached
because it shows there is no more water going into the sample. (See sample graph below.)
Geocomp Corporation · 125 Nagog Park · Acton, MA 01720 · Tel 978-635-0012 · Fax 978-635-0266
CYCLIC-Stress Path: MS User's Manual
© 2013 Geocomp Corp.
III-7. Q: I am testing soft clay, and I have already sheared a few samples during the
saturation phase. I am using a pressure increment of 50 kPa and a pressure rate of 50
kPa/min. Why is my sample shearing prematurely?
A: Both your pressure increment and your rate are too high for this type of soil. For very
soft soil samples you risk shearing the sample during the saturation phase if you use pressure
and rate values that work well for stiff soils. Try reducing the pressure increment to 10 kPa
and the rate to 20 kPa. If the sample still shears, reduce the values even farther.
III-8. Q: We have several CU tests that report having a B-value greater than 1.0. In some
cases it is as high as 1.7. Any idea what may cause this to happen? Your input would be
greatly appreciated.
A: Two possible causes for the B value being higher than 1.0 are an erroneous calibration
factor for either the cell or the sample pressure transducer, and a leak. We suggest checking
your calibration factors and re-calibrating the pressure transducers if there is any reason to
believe the factors might be wrong.
If there is a leak, it should show up during the initialization phase as a flow of water from
the cell FlowTrac-II pump to the sample FlowTrac-II pump. You can look for this by displaying
the system monitor on the LCD for each FlowTrac-II unit (select Monitor from the main menu
then choose Monitor). The percent full value for each pump should not be changing
significantly.
Geocomp Corporation · 125 Nagog Park · Acton, MA 01720 · Tel 978-635-0012 · Fax 978-635-0266
CYCLIC-Stress Path: MS User's Manual
© 2013 Geocomp Corp.
III-9. Q: Is it possible that the B value will drop during the cycling step of the back
pressure saturation?
A: This is possible if the time interval to allow for the pore pressure equalization during
the back pressure saturation (specified by the T2 value on the Saturation page) was not long
enough resulting in pressure changes only at the sample ends. Then when the cycling step is
reached, the B value will drop reflecting the continuing equalization throughout the sample.
A drop in B value will not have any negative effect on the test.
III-10. Q: I am getting negative B values at the beginning of the saturation phase. How
could that be possible?
A: Yes, it is possible to initially get some small negative values of B if the T1 and T2
values are relatively small and the soil sample is a stiff to very stiff material.
Eventually the B value will become positive and start to ramp up. When a very stiff
material is being tested, we recommend that you use values of 15 min and 10 min for T1 and
T2 respectively.
If the valve for sample pressure is closed on the triaxial cell it is also possible to get
similar results. Please see the Triaxial Cell manual for more information about correct valve
settings.
Another cause can be air bubbles in the sample system. Make absolutely sure that you
have removed all bubbles from the region between the sample and membrane, and from the
sample-pressure lines. This can be done at the beginning of the test using the procedure
described in Section 6.1.
III-11. Q: I have a problem with the data that the software saves in the Saturation phase.
The graph shows that the sample reached a B value of 0.95. When the test finished, the
graph of the report does not show all the data of Saturation.
A: This has to do with the time interval reading in the saturation Table. During the test
the data is acquired in real time and the graph that you see is updated every second whereas
the report graph is based on the data collected at time intervals specified in the Saturation
table. This is why they don’t match.
Geocomp Corporation · 125 Nagog Park · Acton, MA 01720 · Tel 978-635-0012 · Fax 978-635-0266
CYCLIC-Stress Path: MS User's Manual
© 2013 Geocomp Corp.
IV. CYCLIC PHASE
IV-1. Q: Prior to cyclically loading the sample, the program wants to lower the platen
while extending the actuator shaft. I presume that is done to put the actuator shaft in
the middle of its travel prior to cyclic loading. The program also allows you to skip this
step. If one opts to skip this step, is there still a little upwards piston travel available?
The reason I'm asking is that this "unloading" process is putting an undesired load on the
test specimen, and I've got some pore pressure changes.
A: You are right that the lowering of the platen before starting the cyclic phase is for the
purpose of getting the actuator shaft to its middle position so that it can extend and retract
through its full travel of ±1in. At the beginning of a test, the shaft is all the way retracted so
moving it out is necessary.
When the platen and the actuator shaft are simultaneously moving, the load on the
sample should normally not vary by more than 5 N (1 lb). If you are observing relatively large
loads that are creating excess pore pressure, it could be that the shaft is not aligned well
with the test cell piston.
If you anticipate that the strain during the cyclic phase is going to be small (resulting in a
small amplitude for the shaft motion), you could click OK during the "unloading" process when
you judge that there will be enough travel for the shaft.
IV-2. Q: The actuator is not moving at all. What could be the problem?
A: The servo-motor drive may have faulted, please follow these steps:
Geocomp Corporation · 125 Nagog Park · Acton, MA 01720 · Tel 978-635-0012 · Fax 978-635-0266
CYCLIC-Stress Path: MS User's Manual
© 2013 Geocomp Corp.
1. Shut off, wait 5mn then turn on. If that doesn't work
2. Use the software to reset to drive by going to Options--> Drive--> then click on Clear.
IV-3. Q: According to the manual, I first position the cell piston about 1-1.5 inches from
the load cell. Then it says that I connect the cell piston to the load cell through the
coupling assembly. Do I do this by raising the platen?
A: Yes, you do need contact between the load cell and the cell piston if you are running a
cyclic test. This is achieved by raising the platen. The platen should be 1-1.5” above its
bottom limit so the system can lower the platen and actuator during the start of the cyclic
phase.
IV-4. Q: Starting the cyclic phase of the test, it talks about the actuator piston extending
down to touch the cell piston, but these are already connected by the coupler. Do I
disconnect the coupler after the sample is saturated and consolidated, to get the 1-1.5
inch gap?
A: You want to extend the platen to bring the cell piston and load cell in contact and then
tighten the coupler. You should not create a gap between the load cell and cell piston after
the saturation and consolidation phases.
V. GENERAL
V-1. Q: The first five text fields on the System Monitor window show sensor values of 0 or
very large count values and no sensor seems to be active. What could be causing this?
A: Possible causes are:
Geocomp Corporation · 125 Nagog Park · Acton, MA 01720 · Tel 978-635-0012 · Fax 978-635-0266
CYCLIC-Stress Path: MS User's Manual
© 2013 Geocomp Corp.
1. The Cyclic-RM unit is turned off.
2. There is no electrical connection between the Cyclic-RM unit and the computer.
Check all network cables and be sure they are in place.
V-2. Q: Right after I start a test to save the file, the following message pops up on the
screen. What is going on?
A: Check the System Monitor. If all external sensors (those whose signal is shown in the
first five top text fields) show zero engineering readings, there is another copy of the
CYCLIC5N program open. Close any other CYCLIC5N program that is open and the test should
proceed normally.
V-3. Q: I noticed that the engineering readings on the LCD screen are different than the
ones on the PC screen. Are they supposed to be the same? Did it affect the results of a
test I just ran?
A: First, be assured that any mismatch of the engineering readings values between the
LCD and the PC screens will not affect the results of a test that you run using the CYCLIC5N
program.
A mismatch can occur if the calibration parameters that are shown in the Calibration
Summary (opened using the Calibration menu) have not been downloaded into the imbedded
controllers of the LoadTrac-II unit, FlowTrac-II and Cyclic-RM units. However, the software
uses only the Calibration Summary values when it runs a test. Consequently, it is very
important that these are correct.
To synchronize the LCD and PC screen readings, you need to update the calibration
parameters in the imbedded controller of the LoadTrac-II unit. To do this, go through the
following steps.
1. Bring down the Calibrate menu and select Summary.
Geocomp Corporation · 125 Nagog Park · Acton, MA 01720 · Tel 978-635-0012 · Fax 978-635-0266
CYCLIC-Stress Path: MS User's Manual
© 2013 Geocomp Corp.
2. On the Calibration Summary window, select the sensor that you want to update (from
the list shown when the pull-down button to the right of the top text field is clicked).
3. Click the Download button. This will automatically transfer (copy and save) the
current calibration parameters (Factor and Offset) for the selected sensor into the
embedded controller.
4. Repeat the above procedure for the other sensors.
You should now see that the PC and LCD screen values match.
V-4. Q: Can the software detect wrong values that are manually entered by the end user?
A: Yes, the software program detects any erroneous values that have been entered. It
also detects certain hardware malfunctions. Examples include:
1. Negative values for sample dimensions, calibration factors, and PID control parameters
2. Zero values for sample dimensions, calibration factors (except for offset value), and
PID control parameters
3. Wrong Node ID number
4. A malfunctioning sensor that it is giving an analog reading of either 0 (the minimum
value) or 65535 (the maximum value)
5. Any unit (LoadTrac-II, FlowTrac-II or Cyclic-RM) that is not on.
Geocomp Corporation · 125 Nagog Park · Acton, MA 01720 · Tel 978-635-0012 · Fax 978-635-0266
CYCLIC-Stress Path: MS User's Manual
© 2013 Geocomp Corp.
V-5. Q: I am running a test. Do I need to wait until the end of the test to see the results?
A: You do not need to wait until the end of the test. While the test is running:
1. Go to the File menu.
2. Select Load.
3. Go to the Report menu. You will be able to see the partial test results up to the
point when you did the Load.
4. Repeat the above steps as the test progresses.
VI. INITIALIZATION PHASE
VI-1. Q: At the beginning of the initialization phase, the platen starts to go down and then
stops. Why is this happening? It’s supposed to go up slightly.
A: The behavior you have described happens when the CYCLIC5N program determines that
there is already a stress being applied to the specimen that is greater than the Vertical Stress
specified on the Initialization page. This can happen if the sensor calibration factors are not
correct. First check to be sure these are correct and re-calibrate the load cell and cell
pressure transducers if there is any doubt (see Appendix A for the calibration procedure).
The behavior can also happen if the factors the program uses to calculate the vertical
stress are wrong. The program determines the stress by combining the output of the load cell
with three other factors that come from information on the Piston Settings window (opened
by selecting Piston on the Options menu). These other factors are the area of the piston, the
weight of the piston, the friction on the piston and
the uplift (buoyancy) force on the piston due to the
cell pressure. The weight of the piston adds to the
load reading while the friction and buoyancy force
subtract from it (see diagram at right). The
buoyancy force is the product of the cell pressure
and the piston area.
Unfortunately, it is very difficult to determine
the actual frictional force on the piston. However,
there is a way of getting around this, a way that
also eliminates the need for the piston weight. The
combination of weight, friction and buoyancy force
can be replaced by an effective buoyancy force that
is equal to the product of the cell pressure and an
effective area. Putting this effective area in the
Area text field on the Piston Setting window and
then leaving the Weight and Friction text fields with
zero is equivalent to using the actual area, weight
and friction values.
We determined the effective area of the piston
Geocomp Corporation · 125 Nagog Park · Acton, MA 01720 · Tel 978-635-0012 · Fax 978-635-0266
CYCLIC-Stress Path: MS User's Manual
© 2013 Geocomp Corp.
for our standard system with the 3400 model test cell. We did this by increasing the cell
pressure (while the cell was in contact with the load cell button and the platen was fixed in
position) and recording the corresponding load cell reading. A picture of the setup used and a
sample graph of the result are shown below. The effective area turned out to be between
130 mm2 (0.2 in2) and 226 mm2 (0.35 in2) instead of the actual area of 587 mm2 (0.197 in2)
(see sample graph above). We typically use 148 mm2 (0.23 in2) as the effective area. Go to
Options/Piston Settings to make these changes.
Piston uplift forcs, lbs
Effective Triaxial Piston Area
25
20
15
10
y = 0.205x - 0.5733
R2 = 0.9999
5
0
0
50
100
150
Cell Pressure, psi
It may be that the effective area value you have in the Piston Setting window is not
correct for your test cell. Go through the procedure of getting load cell readings while you
increase the pressure in the cell. Then plot the result and determine the slope of the line
(Excel works well for this). Use the value of the slope for the effective area.
VII. CYCLIC
VII-1. Q: how is the CSR determined?
A: In engineering practice, the CSR is estimated from a detailed site response analysis, or,
more commonly, the simplified procedure. Using the simplified procedure, the cyclic stress
ratio (CSR) at a given point in a profile is calculated by the following equation:
𝜎𝑣𝑜 𝑎𝑚𝑎𝑥
(𝐶𝑆𝑅)𝑀=7.5 = 0.65 �
𝜎
� 𝑣𝑜
�
𝑟𝑑
𝑀𝑆𝐹
,
where 𝜎𝑣𝑜 = total vertical stress, 𝜎�𝑣𝑜 = effective vertical stress, 𝑎𝑚𝑎𝑥 = PGA at ground surface,
𝑟𝑑 = stress reduction coefficient (which reduces the applied shear stress as a function of
depth), and MSF = magnitude scaling factor (which converts the CSR for an earthquake
magnitude M to an equivalent CSR for a reference magnitude of M = 7.5). The normalization
provided by the MSF is important because it incorporates the effects of duration of loading.
VIII. REPORT
VIII-1. Q: After running a successful test we ran into troubles with the report. We were
not able to generate a report because all links on the report pull down menu are inactive.
Are we missing something, or is the software not entirely installed?
Geocomp Corporation · 125 Nagog Park · Acton, MA 01720 · Tel 978-635-0012 · Fax 978-635-0266
CYCLIC-Stress Path: MS User's Manual
© 2013 Geocomp Corp.
A: To make the links active, parameters and data for a test must be loaded into the
CYCLIC5N program so that they can be displayed on the various CYCLIC5N windows. Go
through the following steps to load a data file.
1. First pull down the File menu.
2. Next, click on Load. This will display a window that shows data files for tests that
have been completed (and for any test that is currently running). Highlight the file
name for the test you wish to load and then click Open.
3. Finally, pull down the Report menu. You should now see that the options for Graph
and Table, as well as the Settings and Edit options, are all activated.
Using these options, you can view the results of the test, change various settings for the
report and edit the test data points. Remember that each time you change or edit any item
you will need to save the file and load it again.
Geocomp Corporation · 125 Nagog Park · Acton, MA 01720 · Tel 978-635-0012 · Fax 978-635-0266