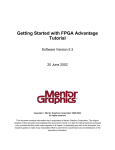
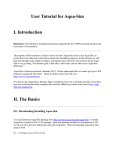
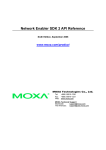
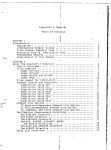
1
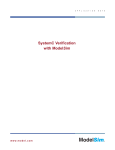
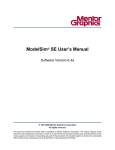
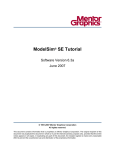
A
P
P
Introduction to
ModelSim 6.0 Debug GUI
www.model.com
L
I
C
A
T
I
O
N
N
O
T
E
Introduction to the New GUI
ModelSim provides an Integrated Debug Environment that facilitates efficient design debug for
SoC and FPGA based designs. This GUI has continuously evolved to include new windows
and support for new languages. This application note aims to give an introduction to the
ModelSim 6.0 debug environment. This environment is trilingual supporting designs based on
VHDL, Verilog (all standards including SystemVerilog, Verilog 2001 and Verilog 1995), and
SystemC. Subsequent releases of ModelSim will enable even more debug capabilities supporting higher levels of abstractions for verification and modeling in SystemVerilog and SystemC.
In ModelSim 6.0, the GUI has been enhanced and is based on Multiple Document Interface
(MDI) layout standard. In addition, the debug windows have been re-organized in such a way
as to display design data and simulation results in an intuitive manner.
The primary reason for updating the GUI in ModelSim 6.0 is to provide support for new data
types and design structures introduced by ModelSim’s support for new languages such as
SystemVerilog, SystemC and PSL. At the same time utilize the screen real estate more efficiently there by facilitating debug with fewer windows.
To illustrate some of the debug capabilities, we will be using a design modeled using SystemC,
SystemVerilog and Verilog. The design under verification is an Open Source Ethernet MAC IP
from Opencores.org. The testbench is modeled using SystemVerilog. The testbench sends
Ethernet packets through a PHY interface to the Ethernet MAC RX block. The MAC is connected to two wishbone busses via a crossbar switch. The master wishbone bus is connected to
a host interface and the slave wishbone bus is connected to a behavioral MP3 decoder modeled
in SystemC. The Host sets up the MAC RX registers via the wishbone master bus. This prepares the MAC for receiving Ethernet packets from the testbench. When the MAC RX block
receives a packet, it is forwarded to a memory interface which is modeled as a MP3 Decoder
(SystemC High level model) via the slave wishbone bus.
There is also a similar testbench described in SystemC using SCV Library capabilities such as
random stimulus generation. ModelSim requires that SystemC stubs be created for all HDL
(VHDL, SystemVerilog and Verilog) design units instantiated under SystemC. Please refer to
the Application note titled SystemC Verification with ModelSim for details of ModelSim’s
SystemC support in Version 6.0.
Launch ModelSim in GUI mode by typing vsim or vsim -gui on the command prompt. Most
tasks that can be done via the GUI have equivalent TCL commands useful for running scripts
during regressions in batch mode or command line mode. Since ModelSim’s interface is based
on TCL/TK, users can very quickly extend their verification environment using a combination
of ModelSim’s powerful TCL commands and standard TCL/TK commands. ModelSim SE is
packaged with a full TCL/TK interpreter command line.
New GUI in ModelSim 6.0
1
Debug Windows in ModelSim 6.0
There are ten debug windows including Active Process, Assertions, Dataflow, Functional Coverage,
List, Local, Memory, Monitor, Objects and Wave windows. In addition, there are tools such as Code
Coverage and the new Memory and Performance Profiler with their respective user interfaces.
Chapter 12 of the ModelSim User’s Manual has more information on profiling performance
and memory utilization during elaboration and simulation. Chapter 13 of the ModelSim User’s
Manual has more details on measuring code coverage.
The Main window is laid out into a workspace area, the MDI pane and Transcript window. In
the Workspace area of the Main window, there are tabs for Library, Structure, Project, Files,
Memories and Compare tabs depending on how ModelSim is used.
The figure below shows the new layout of the ModelSim GUI.
The Structure tab (named sim) now displays HDL and SystemC processes. In previous versions
of ModelSim there was a process window that showed this information. All hierarchical blocks
such as SystemC SC_Module, VHDL entity/architecture, Verilog Modules and SystemVerilog
Interface blocks appear as squares while processes appear as spheres. Tasks and Functions
appear as squares also.
All VHDL objects are colored navy blue, while SystemC and SystemVerilog/Verilog are colored
green and sky blue respectively.
2
New GUI in ModelSim 6.0
In ModelSim 6.0, the memory browser is now integrated into the workspace area. It appears as
a tab named Memories. All HDL memories are automatically extracted and displayed in this
browser. ModelSim simply looks for a two or more dimensional array in source code in order
to identify it as a memory block. Selecting a memory from the browser opens up the contents
of that memory in the MDI pane.
The Source, Wave, Dataflow and List windows are opened in the MDI pane area.
The new Objects window replaces the Signal window in previous versions of ModelSim and
the new Locals window replaces the Variables window in previous version of ModelSim. Both
windows retain to a large extent functionality of the old windows that they replace.
The Monitor window is a new free form window onto which you can drag and drop any
declared persistent variable, signal, constants, net, parameter or generic for continuous monitoring during simulation. These objects can be of abstract data types such as structures or
records. This window works for all HDL objects and SystemC objects that are supported for
debug in ModelSim.
The Dataflow window is a valuable debug aid. It allows you to view the connectivity of your
design at the process level. You can use it to trace events that propagate through your design.
There is the unique ChaseX® and associated TraceX® capability that allows you to trace back in
time and logic, the cause of unknown or Xs in your design. The GUI reference online document goes into details about the Dataflow window.
When the Dataflow window is used during debug with assertions (PSL in 6.0 and
SystemVerilog assertions in future releases), it allows you to quickly identify the source of the
failures flagged by an assertion firing during simulation. This feature makes use of the “show
drivers” binding between the Wave window and the Dataflow window. Double clicking on any
signal trace in the Wave window opens up the Dataflow window to show the driver of that signal or net. You can select the process or block in the Dataflow window to get to the source
code for that process which is displayed in the Source window. A blue arrow points at the
beginning of process in the Source window (usually the first executable line in the process).
Chapter 14, PSL Assertions, of the online ModelSim SE User’s Manual goes into detail on
using assertions in ModelSim.
New GUI in ModelSim 6.0
3
The Wave window in ModelSim 6.0 SE has been enhanced to allow waveform editing. You can
select an HDL and create stimuli for that block using the waveform editor. The resultant waveform can drive the simulation directly. Alternatively, you can write out a testbench in VHDL or
Verilog or you can write out a VCD file all of which can be used at a later time to drive simulation of the selected block.
Selecting a process in the Dataflow window causes
ModelSim to open the source code for that process.
4
New GUI in ModelSim 6.0
Debugging SystemC and HDL Models
The Integrated C Debugger facilitates source level debugging of C/C++ and SystemC source
code within the ModelSim Source window. ModelSim connects to open source GNU gdb
executable via ModelSim’s User Interface. GNU gdb 6.0 is included in the installation for
ModelSim since version 5.8. It is recommended that you use this version of gdb in order to
get the best debug experience.
Enabling source level debugging on runtime code is as easy as setting a breakpoint on an executable line of C/C++/SystemC code in the Source window. You set a breakpoint by clicking
on the leftmost column at the start of an executable line. ModelSim will automatically enable C
debugging by starting and connecting to gdb in the background if gdb is not already started. It
then sets the breakpoint at the requested line number. You must compile your C/C++ code with
the –g option to enable debugging. You can setup both HDL and SystemC breakpoints and both
will be managed by the ModelSim UI.
When debugging the initialization phase of FLI/PLI/VPI based C/C++ code, you have to start
the C debug interface manually by clicking on Tools > C debug > Start C Debug and by clicking
on Tools > C debug > Init Mode so that user has the opportunity to set breakpoints on initialization functions before they are run as ModelSim goes through its elaboration / loading
phase. Chapter 16, C Debug, of the online ModelSim User’s Manual has a section that goes
into details.
You can set a breakpoint on source .cpp files as well as .h files. To do this, open a .cpp or .h
file containing C/C++ code in the ModelSim Source window and click on an executable line.
A red dot will appear to the left-hand side before the line number. A solid red dot indicates that
the breakpoint is enabled while a hollow red dot indicates that the breakpoint is disabled. You
can enable, disable or delete this breakpoint by clicking on the RMB (right mouse button) and
selecting from the options in the popup menu that opens. You can also use the ModelSim command bp -c to set C/C++ break points. You will need to invoke it as bp -c [<function_name> |
<file_name>:<line#> | <line#> | *0x<hex_address>] in order to set breakpoints in C/C++.
Chapter 16 of the online ModelSim User’s Manual has more information on C Debug.
New GUI in ModelSim 6.0
5
Most of the debug TCL commands available for
HDL debugging are also available for SystemC
debugging. For instance you can at anytime examine
the current value of sc_signal, sc_mutex or sc_fifo
primitive channel objects using the examine command. This works whether or not you have C debug
enabled. In all cases, examine command gets its
value from the simulator kernel.
Within a particular region (selected by clicking on
an instance in the structure browser) you can type
show to display the declared signals and variable.
For SystemC designs this will be the debuggable
primitive channels objects and SC_Module member
variables for that instance.
6
New GUI in ModelSim 6.0
The design (SyscTB + Verilog, SV & SysC Models) is loaded by typing:
Modelsim> vsim –lib work_sysc –sclib work_sysc top
The prompt will change to VSIM to indicate that a design is loaded into the simulator kernel. Open
the Wave, Signal, Source and Process windows after the design has loaded by typing the command:
VSIM> view s
or
VSIM> view source
Let us set a breakpoint at line 336 in the file tb_rmac_sc.cpp by using the command:
bp –c tb_rmac_sc.cpp :336.
Alternatively, you can use the method described earlier where you open the file in the source
window and click on line number 336.
ModelSim will automatically enable C debugging and set the breakpoint as c.1. Subsequent
breakpoints in C/C++ code will be numbered c.2, c.3, etc. You can also set breakpoints in the
HDL (VHDL and /or Verilog) portions of the design.
Type the ModelSim TCL command bp after setting all your breakpoints and you get a listing
of all breakpoints in C and HDL code.
You can use the bd command to delete breakpoints in SystemC or HDL code.
Using the Structure tab of the Workspace pane in the Main window, you can navigate up or
down the loaded design’s hierarchy. Open the Active Process pane in the Main window to see
current status of all HDL and SystemC processes, SC_THREADS and SC_METHODS. The
Object window shows all signals, wires, variables, generics and parameters that are declared in
the currently selected region in the structure tab of the Workspace pane and their values either
tied to the current cursor position or tied to the current simulation time.
In addition you can see the results of toggle coverage and extended toggle coverage when coverage is enabled in this window. You can force values onto HDL signals from the Object window. To do this, select the signal and click on Edit >Advanced > Force or Edit >Advanced>
Clock in the main menu. In either case an appropriate dialogue box opens to allow configuration of the force command. This GUI feature makes use of the ModelSim TCL force command.
Only HDL (VHDL and Verilog) signals are currently supported.
With the Objects window selected, you can add signals to the List or Wave windows either by
drag and drop or by doing a RMB click to open a popup menu in the Objects window.
Select Add to Wave > [selected signal | signal in region | signals in design] from this popup
menu. There is tight integration between all the debug windows within ModelSim. This integration, allows you to find the sources of bugs faster during debug.
New GUI in ModelSim 6.0
7
You can also add all the signals in a particular region (hierarchical block) to the Wave window.
Select the region e,g top in the Sim tab, do a RMB click to open a popup menu and select
Add > Add to Wave.
This opens the Wave window and adds the signals from the region test_ringbuf. Select block1
in the Sim tab of the Main window. Go to the Objects window and drag and drop the signal
clock to the Wave window. Select block2 in the Sim tab of the Main window and drag and drop
the signal reset from the Object window to the Wave window.
You can also add signals using add wave command. ModelSim uses a proprietary database for
storing simulation information called the wlf database. This information can be used for post
simulation debug in the Wave window or List window or it can be used for interactive debug.
The commands used for logging include add wave, add list, add dataflow and add log. The
first three commands open the appropriate window, add the signals to that window and log
them automatically in the wlf database. The default database created is called vsim.wlf. The
designer has control of how much data to log. Please refer to the Chapter on WLF Files
(datasets) and Virtuals in the ModelSim User’s Manual for more information. ModelSim also
supports VCD file creation.
8
New GUI in ModelSim 6.0
To run the simulation of the example above, type the following in the Transcript window:
VSIM> run -all
The simulation breaks on line 248 of tb_rmac_sc.cpp and we have used step –over command
to step up to line 274. Line 275 will be executed next if we issue another step –over command
in the Transcript window. Also since the breakpoint is in C/C++ code, the ModelSim prompt
changes in the transcript window from VSIM> to CDBG>.
On the CDBG> prompt we can also send gdb commands directly by prefixing the commands
with gdb e.g gdb print mp3sz.
Once we are done with debugging the C/C++ code we can delete the breakpoint using TCL
commands bd command. The command run -continue on CDBG prompt takes us out of
the C debugger and into the simulator kernel.
Alternatively, you can click on the run -continue
icon in the Main, Source or Wave windows.
At any point in the simulation, you can examine the values of SystemC and/or HDL signal
using the examine command. You could also use this command to find out values of SystemC
objects on the CDBG prompt while in c debug mode.
New GUI in ModelSim 6.0
9
You can also enable the ToolTips that show values for C/C++ variables in the Source window
at the current simulation time. To do this, click on Tools > C Debug > C debug setup ... and
click on show balloon button in the dialogue box that appears. The ToolTip appears when your
pointer’s cursor hovers on a SystemC signal in the Source window. Another way of showing
the value of an HDL, SystemC or C/C++ variable or signal at current simulation time is as follows. Select the variable or signal of interest in the Source window. Click on Edit> Advanced
> Examine… in the Main window’s menu bar and a popup window will appear showing the
current value for the signal or variable at current simulation time or in the Source window do a
RMB click and a popup menu will appear. Select Examine… and a popup window will appear
showing the current value for the signal or variable at current simulation time
Using the Wave Window and List Window
The Wave window allows you to view the results of simulation. It also allows you to view
assertion status and PSL cover statement status and count. All objects are indicated as diamonds in the respective language colors.
The exception is for PSL cover statements and associated endpoints which are indicated by
purple chevrons. ModelSim 6.0 expands the SystemC primitive channels that can be visualized
in the Wave window.
In addition to being able to view SystemC sc_signal and ports of sc_signal, you can now view
aggregates of sc_signal including structures, classes and arrays of sc_signal. You can also view
sc_fifo and ports of sc_fifo in this window.
You can view virtual items indicated by orange diamonds and comparison items indicated by
yellow diamonds in this window.
You can drag and drop SystemC supported primitive channels and HDL signals from the
Objects window or the structure browser in the workspace area of the Main window to the
Wave window.
10
New GUI in ModelSim 6.0
sc_fifo object
Most debugging capabilities of the Wave window that apply to HDL signals also apply to
SystemC signals. One exception is the ability to set breakpoints on signals. You can instruct
ModelSim to break or perform any action when a signal gets to a particular value. In the Wave
window, select the signal, then in the Main window menu bar, click on Add > Breakpoint. A
breakpoint is added and will trigger on any change in the value of this signal. Click on Tools >
Breakpoints… to open the Breakpoints Dialogue box where you can now modify all break
points that you have in this design. This GUI is based on ModelSim’s when command. It currently supports HDL signals only. To delete these conditional breakpoints use nowhen command.
In ModelSim 6.0 the Wave window has a new waveform editor. This editor offers functionality
that allows you to quickly verify hierarchical blocks as you develop these blocks. You can
drive simulations directly with the created waveform or you can export the waveform to VCD
or HDL testbench. Chapter 10, Generating Stimulus and Waveform Editor, of the online
ModelSim User’s Manual goes into details on the capabilities of this feature in ModelSim.
The List window displays similar information as the Wave window in tabular format. In addition,
delta cycles are also shown for SystemC, VHDL and Verilog signal updates in the List window.
Please refer to the Graphical User Interface Reference for more detail on all features of the GUI.
New GUI in ModelSim 6.0
11
Summary
ModelSim 6.0 provides a trilingual debug environment. This environment has been enhanced
to facilitate increased verification productivity through support for new verification methodologies such as Assertion Based Verification (ABV). The combined use of methodologies such as
ABV and ModelSim ’s existing debug windows such as the Dataflow window improves debug
productivity.
There is also support for new data types and design structures in the GUI which has been introduced because of new language support in ModelSim for SystemVerilog, SystemC and PSL.
Within this environment, there is source level debug for C/C++ based PLI/VPI/DPI, FLI and
SystemC code just as there has been for HDL. In addition, there is full visibility in the GUI for
SystemC based models. The following SystemC primitive channels can be debugged in the
GUI: sc_signal, aggregates of sc_signal, ports of sc_signal, sc_fifo, ports of sc_fifo, sc_mutex
and sc_semaphore. You can also view these primitive channels in the List and Wave windows.
The familiar ModelSim debug commands such as bp, examine, show, tb, bd, step, etc can be
used for both HDL and SystemC source level debug.
Providing all the debug capabilities within one environment improves verification performance,
reduces the learning curve associated with using multiple tool chains and improves your debug
productivity.
For more information, call us or visit: www.model.com
Copyright © 2004 Mentor Graphics Corporation. This document contains information that is proprietary to Mentor Graphics Corporation and may be duplicated in whole or in part by the original recipient
for internal business purposed only, provided that this entire notice appears in all copies. In accepting this document, the recipient agrees to make every reasonable effort to prevent the unauthorized use of
this information. Mentor Graphics is a registered trademark of Mentor Graphics Corporation. All other trademarks are the property of their respective owners.
Corporate Headquarters
Mentor Graphics Corporation
8005 S.W. Boeckman Road
Wilsonville, Oregon 97070USA
Phone: 503-685-7000
North American Support Center
Phone: 800-547-4303
Fax: 800-684-1795
Silicon Valley
Mentor Graphics Corporation
1001 Ridder Park Drive
San Jose, California 95131 USA
Phone: 408-436-1500
Fax: 408-436-1501
Europe
Mentor Graphics
Deutschland GmbH
Arnulfstrasse 201
80634 Munich
Germany
Phone: +49.89.57096.0
Fax: +49.89.57096.400
Pacific Rim
Mentor Graphics Taiwan
Room 1603, 16F,
International Trade Building
No. 333, Section 1, Keelung Road
Taipei, Taiwan, ROC
Phone: 886-2-27576020
Fax: 886-2-27576027
Japan
Mentor Graphics Japan Co., Ltd.
Gotenyama Hills
7-35, Kita-Shinagawa 4-chome
Shinagawa-Ku, Tokyo 140
Japan
Phone: 81-3-5488-3030
Fax: 81-3-5488-3031
C&A 7-04
TECH6440-w