1
A
P
ModelSim 6.0 SE
Performance Guidelines
www.model.com
P
L
I
C
A
T
I
O
N
N
O
T
E
Table of Contents
General Performance Considerations . . . . . . . . . . . . . . . . . . . . . . . . . . . . . . . . . . . . . . . . 2
Why is This Document Important? . . . . . . . . . . . . . . . . . . . . . . . . . . . . . . . . . . . . . . . . . . . . . . . . 2
What Are You Measuring? . . . . . . . . . . . . . . . . . . . . . . . . . . . . . . . . . . . . . . . . . . . . . . . . . . . . . . 2
How Are You Measuring Performance? . . . . . . . . . . . . . . . . . . . . . . . . . . . . . . . . . . . . . . . . . . . . 3
Measuring Time with Operating System Commands . . . . . . . . . . . . . . . . . . . . . . . . . . . . . . 3
Measuring Time and Memory Usage with ModelSim Commands . . . . . . . . . . . . . . . . . . . . 4
Using the Simulation Profiler . . . . . . . . . . . . . . . . . . . . . . . . . . . . . . . . . . . . . . . . . . . . . . . . . . . . 5
Other Useful Tips . . . . . . . . . . . . . . . . . . . . . . . . . . . . . . . . . . . . . . . . . . . . . . . . . . . . . . . . . . . . . 6
Verilog Designs . . . . . . . . . . . . . . . . . . . . . . . . . . . . . . . . . . . . . . . . . . . . . . . . . . . . . . . . . . . 7
General Verilog Flow . . . . . . . . . . . . . . . . . . . . . . . . . . . . . . . . . . . . . . . . . . . . . . . . . . . . . . . . . . 7
RTL Considerations . . . . . . . . . . . . . . . . . . . . . . . . . . . . . . . . . . . . . . . . . . . . . . . . . . . . . . . . 9
Gate Level Considerations . . . . . . . . . . . . . . . . . . . . . . . . . . . . . . . . . . . . . . . . . . . . . . . . . . 9
Maintaining Design Object Visibility . . . . . . . . . . . . . . . . . . . . . . . . . . . . . . . . . . . . . . . . . . . . . 10
Assessing and Increasing Optimizations . . . . . . . . . . . . . . . . . . . . . . . . . . . . . . . . . . . . . . . . . . 10
Generating an Instance Report . . . . . . . . . . . . . . . . . . . . . . . . . . . . . . . . . . . . . . . . . . . . . . 10
Cross-referencing Reports . . . . . . . . . . . . . . . . . . . . . . . . . . . . . . . . . . . . . . . . . . . . . . . . . . 12
Relaxing Gate Level Cell Optimization Constraints . . . . . . . . . . . . . . . . . . . . . . . . . . . . . . 13
VHDL Designs . . . . . . . . . . . . . . . . . . . . . . . . . . . . . . . . . . . . . . . . . . . . . . . . . . . . . . . . . . . . . . . . 14
Mixed HDL Designs . . . . . . . . . . . . . . . . . . . . . . . . . . . . . . . . . . . . . . . . . . . . . . . . . . . . . . . . . . . 14
Using Elaboration Files to Improve Regression Test Throughput . . . . . . . . . . . . . . . . . . 17
Design Considerations for Use of Elab Option . . . . . . . . . . . . . . . . . . . . . . . . . . . . . . . . . . . . . 17
Improving Gate-level Performance with Simulator Options . . . . . . . . . . . . . . . . . . . . . . 18
Decreasing Memory Footprint . . . . . . . . . . . . . . . . . . . . . . . . . . . . . . . . . . . . . . . . . . . . . . . . . 18
Improving Performance with OS-specific Options . . . . . . . . . . . . . . . . . . . . . . . . . . . . . . . 19
Memory Addressing Above 2GB on an HP Platform . . . . . . . . . . . . . . . . . . . . . . . . . . . . . . . . 19
Enabling Large Pages on Sun/Solaris . . . . . . . . . . . . . . . . . . . . . . . . . . . . . . . . . . . . . . . . . . . . . 19
ModelSim 6.0 SE Performance Guidelines
1
General Performance Considerations
Any discussion about simulator performance should begin with two questions: “What Are You
Measuring?” and “How Are You Measuring It?” This section addresses those questions and
discusses a few other general considerations for analyzing and improving performance.
Why is This Document Important?
The difference in optimizing and not optimizing a simulation is very dramatic. Can your environment run 2x, 4x or even 10x faster? The performance improvement possible is not the same
for every environment. By following the flow described in this document you can maximize
ModelSim® performance for your Simulation environment. There are sections in this document
for Verilog RTL and Gate, VHDL RTL and Mixed environments. In addition, optimizing gate
level libraries can make a significant reduction in memory requirements.
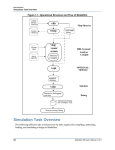
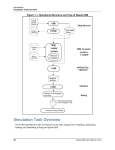
What Are You Measuring?
HDL simulation is only part of verification. You must determine the impact of the entire environment when considering simulation performance. The picture below illustrates the various
flows that may affect your simulation:
Any part of your environment may negatively impact simulation performance. The HDL code
may be inefficient; testbench languages and third party debug tools may slow the simulation;
Third party IP may be un-optimized. Consider that third party testbench implementation alone
can account for greater than 80 percent of the overall simulation performance. If this is the case
you should consider investigating the reason 80 percent of the time is being spent on the testbench and it’s interface. ModelSim has a profiler (discussed below) that may help you identify
which part of your environment is impacting simulation performance the most.
2
ModelSim 6.0 SE Performance Guidelines
Turning to the simulator itself, it’s critical to realize simulators are run in two modes, interactive and batch. Interactive mode is generally associated with debugging where maximum visibility into the design is needed. Batch mode jobs are run in the background without the User
Interface (UI). Performance is generally the highest priority when running in batch mode.
Simulators in optimized performance mode remove visibility into a design.
Prior to the 6.0 release ModelSim required the use of specific Verilog compile options to enable
performance. ModelSim now has an optional flow that facilitates performance mode. The modelsim.ini file is read whenever the compiler or simulator is invoked and has a setting to
enable/disable the default performance mode. This option is VoptFlow = 1. When this is set to
a zero you enable the pre-6.0 ModelSim flow, when this is set to one, you engage a new performance out of box flow. With the 6.0 release the default is zero. Currently this optional performance flow is very useful for pure Verilog designs where you are not interested in debugging, or for Mixed Verilog and VHDL designs. All the Verilog in a design will be optimized,
regardless of where in the hierarchy it is located. Once again this can improve performance up
up to 10x versus non-optimized mode.
Another consideration with the new flow is what part of the simulation you are measuring.
ModelSim has separate compilation, optimization (vopt) and simulation (vsim) steps.
Furthermore vsim can automatically invoke vopt if it has not already been run separately.
Simulation is a two-phase process. During phase 1 (known as elaboration), ModelSim generates
native code for your specific OS. During phase 2, ModelSim runs the native code. You’ll gain
the most accurate performance statistics by measuring the elaboration phase and run phase separately. As discussed below, you can use the –elab switch or the ps command to measure these
two phases independently.
How Are You Measuring Performance?
Different measurement methods may report different simulation times. Simply stop-watching a
simulation does not produce accurate measurements. You can use OS commands or the built-in
simulator command simstats.
Measuring Time with Operating System Commands
There are two types of time: “wall clock time” and “cpu time”. If the ModelSim simulator, vsim,
is the only process running on a machine and there is no network traffic issues the difference in
these two times should be approximately the same. However, if other processes are taking a
large percentage of the machine’s processor time or high network traffic impacts, “wall clock
time” will not accurately represent true simulation time. Measuring cpu time will eliminate
interference from unrelated processes or network influences.
The ps command provides one way of measuring cpu time. The time it reports is the cpu time
of the process. This command:
exec ps -ef | grep vsimk
ModelSim 6.0 SE Performance Guidelines
3
returns the following:
user 25508 25507 48 16:12:09 pts/9
29:13 vsimk top
This example shows a vsimk process that has been running for 29 minutes and 13 seconds.
Note that vsimk is the simulation process name, vsim is the command name.
Unless you are using the vsim –elab option (discussed below), you must execute the ps
command twice to obtain the run time, once after loading the design, and the second after simulation is complete (before exiting). For example the command shown below would report two
times. The first time reflects elaboration time and the second reflects the total time for both
elaboration and simulation. To get the simulation time alone, subtract the first time from the
second time.
vsim –c –L cell_lib top –do “exec ps –ef | grep vsim; run –all; exec ps –ef | grep vsim”
Another way of measuring time is the UNIX time command. However, this command does not
allow you to separate elaboration and run times. This command:
time vsim -c -L cell_lib top -do “run –all”
returns one of two formats depending on the shell:
11.0u 38.0s 1:45 46% 0+0k 0+0io 0pf+0w
or
real
user
sys
1:45.5
0:11.2
0:38.2
The three times in the first example are user (u), system (s), and real. The system time represents the sum of elaboration and run times. The real time is “wall clock time.”
The numbers from the time command may be misleading due to heavy system load. To check
the numbers’ accuracy, sum the user and system times. The total should be pretty close to the
real time. If it is not, there is a large load on the system, and you shouldn’t rely on the numbers.
Measuring Time and Memory Usage with ModelSim Commands
The ModelSim simstats command reports various statistics about the current simulation.
This is the most accurate and easiest method to measure simulation performance. Executing
simstats on the Modelsim command line once a design is loaded returns the following:
# {{elab memory} 28736} {{elab working set} 4300} {{elab time} 1.25337} {{elab cpu time} 0.01}
{{elab context} 0} {{elab page faults} 444} {memory 28744} {{working set} 4652} {time 0.005643}
{{cpu time} 0.01} {context 0} {{page faults} 69}
4
ModelSim 6.0 SE Performance Guidelines
Only a few of the parameters will be discussed:
elab memory = Total memory being allocated when generating native code for the design
elab working set = Total memory allocated when native code generation complete
elab time = Wall clock time needed to generate native code for the design
elab cpu time = CPU clock time needed to generate native code for the design
memory = Total memory being allocated for the ModelSim process
working set = Portion of total memory in use for the current simulation
time = Cumulative “wall clock time” for run commands
cpu time = Cumulative processor time for run commands
context = The number of context swaps that have occurred during the run commands
(vsimk being swapped out for another process)
page faults = The number of page faults the have occurred during the run commands
— a large number can indicate insufficient physical memory
The simstats command uses OS calls for its information. Not all OSes support queries for
every parameter, in which case simstats will return zero for that parameter. If you are using
simstats in batch mode it may be necessary to use the echo command to force the results to be
written to the transcript, instead of simstats use the command echo [simstats].
For Verilog designs you can get similar information if you use the $finish(2), instead of the
$finish().
Using the Simulation Profiler
The Profiler identifies any bottlenecks in your design. Once these bottlenecks are corrected,
you should see substantially faster simulations.
To enable the Performance Analyzer, invoke the profile on command before the simulation run
begins. After the simulation stops, invoke profile report -file profile.rpt to save the results.
These commands can also be used interactively with the UI.
One option of note is the keep–unknown argument. This argument tells the analyzer to keep
statistics about items not found in the HDL code. This helps locate bottlenecks in FLI/PLI
routines, third-party interfaces, and the like. Use this command to enable the argument:
profile option keep_unknown
NOTE: The Performance Analyzer can increase simulation times by up to 10 percent. Therefore, do not use it when
timing simulations. Invoke the analyzer in a separate run.
ModelSim 6.0 SE Performance Guidelines
5
For most accurate line number information when using the +opt or –fast Verilog compile
options also use the +acc=l compile option. This insures that line number information is available
for the Performance Analyzer.
The Profiler can also measure the amount of memory each instance in a design requires.
This may be useful for improving capacity.
See the Profile chapter in the ModelSim SE User’s Manual for further details on these and
other Profiler options.
Other Useful Tips
• Compile and run designs from a local drive/disk whenever possible. Network traffic can
significantly slow processes that require large amounts of file I/O. If you have a large number
of files, you may want to copy them to a local disk prior to compiling and simulating.
• To maximize ModelSim performance, use the flows based on the mix of HDL in your environment. The following sections discuss flows for specific HDL mixes.
• Make sure you are running in the highest simulation resolution possible. For example, do not
run in ps mode if ns resolution is functional.
• Make sure that you have enough physical memory to run the process. Swapping to virtual
memory can significantly impact performance of any run. Choose the right machine for the job.
• Monitor the load of the machine on which you are running. A machine with multiple jobs
competing for CPU and memory resources will impact wall clock run time. Also multi-cpu
machines must compete for the same memory interface and will impact the run time of a job.
• ModelSim has support for 32- and 64-bit OS. The 32-bit OS memory address limit is 4GB. For
simulation jobs that require more than 4Gb of memory, you must use 64-bit OS versions of
ModelSim. The use of 64-bit OS version of ModelSim should be restricted to those jobs that
require more than 4Gb of memory to run. 64-bit OS versions use approximately 30 percent
more memory and are approximately 30 percent slower than 32-bit versions of the same OS.
The need for 64-bit OS is generally an issue with gate level designs. You can significantly
improve the capacity of a gate level design by optimizing it. Use the section on Optimizing
Gate Level Considerations below.
• The use of self-checking testbenches to eliminate the need for file IO can improve performance.
6
ModelSim 6.0 SE Performance Guidelines
Verilog Designs
General Verilog Flow
There are two optimization flows for Verilog design: Verilog RTL and Verilog gate. The general flows are the same with some noted exceptions. For a more complete discussion, see the
Verilog chapter in the ModelSim SE User’s Manual.
It’s critical to realize simulators are run in two modes, interactive and batch. Interactive mode
is generally associated with debugging where maximum visibility into the design is needed.
Batch mode jobs are run the background without the User Interface (UI). The opportunity for
increased performance is generally the highest when running in batch mode since you generally
need less visibility into the design. Simulators in optimized performance mode remove visibility into a design. ModelSim default mode with Verilog is in debug mode, which provides highest visibility. For performance you must employ compiler optimization switches. Therefore, to
improve ModelSim simulation results you must engage the global compiler optimizations.
Improving Verilog performance starts with using compiler optimization arguments. You can
increase simulation speed significantly by compiling with the +opt global optimization compile
argument. This option merges always blocks, in-lines instantiated modules, and performs celllevel optimizations. It also reduces or eliminates events and improves memory management.
ModelSim’s Verilog compiler vlog has two global optimization switches. They are very similar
in that they both engage the same performance algorithms. The main differences are that you
may use +opt to update a previously compiled non-optimized design, as in the example 4
below. The –fast does not allow optimization of previously optimized designs, but does support
incremental compile. If you changed one file in a long list of previously compiled files you can
incrementally compile only the source file that was modified by using -incr option with –fast
(vlog -f list.f –fast -incr ). Remember to use the original full vlog compile options when using
–incr.
The sample compile scripts below demonstrate several methods for compiling a Verilog design
with +opt. The examples use two other compiler arguments: -O5, which optimizes loops and
case statements. All examples are appropriate for designs with RTL, gates, or both.
NOTE: ModelSim recognizes a module as a gate if the module contains a non-empty specify block. Earlier versions
of ModelSim identified gate cells using the compiler directive `celldefine. This is no longer the case.
#### Verilog compile script example 1
#####
#
# +opt option enables the global optimizations
#
vlib work
vlog -O5 +opt tcounter.v counter.v
#
#### end compile script example 1
#####
ModelSim 6.0 SE Performance Guidelines
7
If you have a more extensive list of files, you can use the -f compile argument to specify a text
file that contains a list of your design’s files. In the example below, list.f includes tcounter.v
and counter.v:
#### Verilog compile script example 2
#####
#
# +opt option enables the global optimizations
# -f option will use the file to get list of files to compile
#
vlib work
vlog -O5 +opt -f list.f
#
#### end compile script example 2
#####
If you have multiple, pre-compiled libraries, you can use the -L compiler argument to access
them while using +opt. In the next example, the counter was compiled into a separate library
(dut), and the testbench into the default work library. The -L argument makes the counter
module visible when you compile the testbench.
#### Verilog compile script example 3
#####
#
# The counter module is compiled into the library dut
# The testbench module is compiled into the default work library
# +opt option enables the global optimizations
# -L option will provide access to the counter module
#
vlib work
vlib dut
vlog -O5 -work dut counter.v
vlog -O5 +opt -L dut tcounter.v
#
#### end compile script example 3
#####
Note that counter.v was not compiled with +opt. When the top-level cell in tcounter.v is
compiled with + opt, all instances in the hierarchy are optimized, including any modules in
the dut library.
+opt can also handle designs that were previously compiled without optimizations. This typically
occurs when designers are moving from a debug phase to a regression/performance phase. The
following example uses a variation of the +opt argument to optimize a previously compiled
design. In this example the counter module is compiled in the library dut as in example 3, and the
testbench tcounter is compiled into the default work library. Neither of these modules has been
optimized at this point.
8
ModelSim 6.0 SE Performance Guidelines
#### Verilog compile script example 4
#####
#
# +opt+tcounter option enables the global optimizations
# Note only the top level module name and library references are needed
#
vlog -O5 +opt+tcounter –L dut
#
#### end compile script example 4
#####
RTL Considerations
With RTL designs, verify that the modules are being in-lined by the compiler. When invoked
with the +opt argument, the compiler reports how many modules are in-lined:
# Analyzing design...
# Optimizing 48 modules of which 24 are inlined:
This indicates that +opt in-lined 24 of the 48 modules in the design. Fifty percent module inlining is low. The greater the percentage of in-lined modules, the better the performance. If you
have a low percentage of in-lined modules, please contact your ModelSim support personnel.
You should also try to optimize any gate-level cells in an RTL design. RTL designs often have
gate-level cells, and sometimes you may not even know they have been added. For example it
is typical to add IO pad cells as a project nears completion. Un-optimized gate-level cells significantly impact RTL performance. In addition to using the -debugCellOpt compiler argument
to identify un-optimized cells, you can generate reports on modules and their optimization with
the write cell_report or the write report command. See Assessing and Increasing Optimizations
below for details.
Gate Level Considerations
In most cases the examples presented above will work equally well for both gate-level and
RTL designs. However, multi-million gate netlists may compile slowly with +opt. If netlist
compile time is an issue for a gate-level design, you should use the following modified flow:
• Create a work directory for the cell library and the rest of the design.
• Compile only the cell library using +opt.
• Compile the device under test and testbench without +opt.
• If supported by your platform, reserve system memory, or large memory pages for vsim.
See Improving Performance by Reserving Memory below for details.
However, because this flow does not perform global optimizations on the testbench, you may
see slower simulation performance than when using +opt on the whole design. Consider the
tradeoff between netlist compile time and complete optimization.
ModelSim 6.0 SE Performance Guidelines
9
Another caveat to the modified flow is that it can cause problems if the testbench has hierarchical
references into the cell library. Optimizing the library alone results in unresolved references. In
such cases you must use the original flow. The original flow considers hierarchical cell references
before enacting optimizations.
Finally, if you have a choice between VHDL Vital and Verilog, use Verilog. With Verilog cells
and a Verilog netlist (regardless of testbench language), performance can be 4-8x faster than
the same design in VHDL Vital. The memory footprint will also be 4-8x smaller.
Maintaining Design Object Visibility
Some of the optimizations performed by +opt may impact design visibility of nets, ports, and
registers. If you need to maintain access to these objects for debugging purposes, use the +acc
option in conjunction with +opt. Keep in mind, however, that enabling design object access
may reduce simulation performance.
For example suppose you need to dump nets and registers of a particular instance in the design
using the $dumpvars system task. You would have something like the following $dumpvars
call in your testbench:
initial $dumpvars(1, testbench.u1);
In this case, compile your design as follows to enable net and register access for the module
(assuming testbench.u1 refers to a module design):
% vlog +opt +acc=rn+design testbench.v design.v
For a more detailed discussion of the +acc option, see Enabling Design Object Visibility with
the +acc Option in the Verilog simulation chapter of the ModelSim User’s Manual.
Assessing and Increasing Optimizations
Generating an Instance Report
For designs that contain cells, always verify that cells with the highest instance counts are being
optimized. Use the write cell_report commands to generate a list of all instances in the design
and then cross-reference this with the output from –debugCellOpt (see Cross-referencing Reports
below). It’s possible you can “force” a cell to be optimized, thereby improving performance.
10
ModelSim 6.0 SE Performance Guidelines
For example, consider the compile script below:
###### Verilog Gate Compile Script Example
####
#
# shell commands to help remove directories
# IMPORTANT: gate-level libraries can be enormous
# move them instead of removing as part of the
# script. This will make the scripts run faster
# ANYTHING you can do to make the compile go faster!!!!
# you can remove the *_remove directories as a background task
#
# +opt option is used to enable optimizations
# -debugCellOpt will provide optimization information
# compile.txt will be used as a cross-reference
#
touch work asic_lib_fast
mv work /tmp/work_remove
mv asic_lib_fast /tmp/asic_lib_fast_remove
# compile the asic library
vlib work
vlib asic_lib_fast
vlog -work asic_lib_fast asic_lib_src/*.v
# compile the rest of the design using +opt and reference the library with the -L
vlog +opt –debugCellOpt –L asic_lib_fast ./src/device.v ./src/Testring.v > compile.txt
#
###### End Verilog Gate Compile Script Example ####
The write cell_report command identifies whether cells have or have not been optimized. Once
the design has been compiled, invoke vsim on the top level (tb) as follows:
vsim tb -L asic_lib_fast -do “write cell_report report_cell.txt; quit -f”
The write cell_report output is sorted by instance count. In this example the report_cell.txt file
would contain this type of information:
3600 of FF_PRE are Optimized
1823 of cellA are Optimized
384 of FF are Not Optimized
338 of cellB are Optimized
ModelSim 6.0 SE Performance Guidelines
11
Cross-referencing Reports
Once you have output from write cell_report you can compare it against the information
generated during compilation. If any of the highest instantiate count cells are not optimized,
you should try to optimize them. Suppose that cell FF is instantiated frequently, and it is not
optimized. You might see a message like the following in the compilation output:
— Optimizing module CELL_OR7(fast)
— Optimizing module CELL_OR2(fast)
— Optimizing module FF(fast)
WARNING[10]: asic_lib_src/FF.v(26): Not optimizing library module because the UDP has non-zero delay
WARNING[10]: asic_lib_src/FF.v(10): Module FF could not be compiled as an optimized cell
This type of issue occurs often and can be resolved easily. The extracted code below shows that
line 26 from FF.v has a structural delay (#.01(out_i,clki, input, en, sense, reset);). This type of
delay is not supported with cell library accelerations.
and(clken, rstn, en);
and(reset_enable, rstn, en);
buf(out_e, out_i);
`ifdef func
ff_udp (out_i, clk_i, input, en, sense, reset);
`else
ff_udp #0.01(out_i, clk_i, input, en, sense, reset);
`endif
There are two options for optimizing this cell. The first is to use the vlog compiler argument
+delay_mode_path. This argument causes the compiler to ignore all non-zero delays. The
command below demonstrates the use of this argument:
vlog -work asic_lib_fast +opt -debugCellOpt +delay_mode_path ./asic_lib_src/FF.v
The second option is to define the compile variable func. This variable is used to selectively
instantiate either the delayed or non-delayed version of the UDP. To employ the functional,
non-delayed output version of the UDP instance ff_udp, invoke the following command:
vlog -work asic_lib_fast
12
+opt -debugCellOpt +define+func ./asic_lib_src/FF.v
ModelSim 6.0 SE Performance Guidelines
Regardless of which method you use, the new compile results will look as follows:
Model Technology ModelSim SE vlog 5.5 Compiler 2000.12 Dec 14 2000
— Compiling module FF
— Compiling UDP ffsrce
Top level modules:
FF
Analyzing design...
Optimizing 2 modules of which 0 are inlined:
— Optimizing UDP ff_udp(fast)
— Optimizing module FF(fast)
NOTE: asic_lib_src/FF.v(10): Optimizing cell module FF
NOTE: asic_lib_src/FF.v(10): All path delays specified for module FF were simple
Relaxing Gate Level Cell Optimization Constraints
Another way to gain performance is by reducing optimization constraints. +opt uses fairly
conservative gate level cell algorithms to implement optimizations. This reduces the chance
of incorrect results but also impacts simulation performance and capacity. Most designs can be
simulated correctly with these constraints removed; however, results should always be checked
if the constraints are removed.
The +nocheck arguments described below remove these constraints. For a complete syntax see
the ModelSim Command Reference.
Argument
Description
+nocheckALL
Enables all +nocheck arguments described below.
+nocheckCLUP
Allows connectivity loops in a cell to be optimized.
+nocheckDNET
Allows both the port and the delayed port (created for negative setup/hold) to be used in
the functional section of the cell.
+nocheckOPRD
Allows an output port to be read internally by the cell. Note that if the value read is the
only value contributed to the output by the cell, and if there’s a driver on the net outside
the cell, the value read will not reflect the resolved value.
+nocheckSUDP
Allows a sequential UDP to drive another sequential UDP.
ModelSim 6.0 SE Performance Guidelines
13
VHDL Designs
For most designs, ModelSim VHDL is optimized for performance with the default compiler
options. Some designs with many “for” loops or many arrays may simulate faster if you use
additional compiler arguments. The -O5 option implements additional compiler optimizations,
especially for loops. The -nocheck arguments eliminate checks for out-of-bounds scalar assignments or out-of-bound access to arrays. These arguments are summarized below:
Argument
Description
-nocheck
Disable run-time range and index checks
-noindexcheck
Disable run-time index checks
-norangecheck
Disable run-time range checks
-O5
Enable additional compiler optimizations
Mixed HDL Designs
If you have a very simple mixed hierarchy, like the example illustration below you can use the
+opt command on the top level modules in your designs. If your Mixed HDL environment has
a more complex mixed hierarchy you should consider using the new vopt flow. First let us discuss the traditional +opt flow.
In a mixed HDL environment you can optimize for performance using the +opt on sections of
hierarchy contain Verilog. In the figure below, compiling the top Verilog instances with +opt
will optimize the two areas of Verilog hierarchy.
14
ModelSim 6.0 SE Performance Guidelines
VHDL RTL users find that using Verilog Gate level netlist and Verilog Gate libraries run much
faster than using VHDL and VITAL. Using the existing VHDL testbench and Verilog gates is a
very common Mixed HDL flow. In addition to this Mixed Gate level flow, many projects are
now using both VHDL and Verilog RTL flows. The +opt is well suited for both RTL and Gate
flows.
Prior to release 5.6b you would get this error if there was a VHDL instance in a Verilog
Module you tried to optimize. With the 5.6b release this error is now a Warning.
# WARNING[10]: design.v(1507): Instantiation of VHDL entity “low_level” is not optimized.
If you are having problems identifying the top level modules in your design hierarchy you
should consider using the optional vopt flow described below.
The top level Verilog modules in the diagram above are top_left and top_right, and are initially
compiled into the default work library. They also refer to instances in a spare_parts library.
The –L option is used to refer to this spare_parts library located elsewhere on the network. The
following command will optimize from the two highest Verilog modules.
vlog –work work +opt+top_left +opt+top_right –L /net/host23/export/project/spare_parts
Using this mixed HDL optimization flow can greatly improve your simulation run time. Prior
to the 5.6b release you could optimize only the top_left hierarchy, now with the new flow in
5.6b you can optimize both Verilog hierarchy top_left and top_right.
Now let us discuss the new vopt flow that should be used with more complex Mixed HDL
design hierarchies. This new optional flow facilitates the ModelSim performance mode. The
modelsim.ini file is read whenever the compiler or simulator is invoked and has a setting to
enable/disable the default performance mode. This option is VoptFlow = 1. When this is set to
zero (default) you enable the pre-6.0 ModelSim flow as described above. When the VoptFlow
value is one you engage the new Verilog performance out of box flow. This optional performance flow is very useful for pure Verilog designs where you are not interested in debugging,
and Mixed Verilog and VHDL designs. All the Verilog in the design will be optimized, regardless in where in the hierarchy it is located. Once again this can improve performance up up to
10x versus non-optimized mode. Modify the default setting of the VoptFlow option from zero
to one and compile the design without any optimizations and run vsim as normal. When you
invoke vsim the new global performance optimization vopt will be invoked automatically.
The Mixed HDL design is now fully optimized.
ModelSim 6.0 SE Performance Guidelines
15
For example, if you look at the mixed HDL design in the modeltech/examples/mixedHDL,
you can employ the new vopt flow simply by editing the modelsim.ini file vopt variable:
; vopt flow
; Set to turn on automatic optimization of a design.
; Default is off (pre-6.0 flow without vopt).
0 VoptFlow = 1
And compile the design as normal:
vlib work
vlog *.v
vcom util.vhd set.vhd top.vhd
Once you load the design vsim will invoke the vopt optimization program automatically:
vsim -do ‘view *; add wave *; run -all’ top
In the transcript file you will see vsim message 3812:
# ** Note: (vsim-3812) Design is being optimized...
The message 3812 indicates that the design is being optimized by vsim automatically invoking
vopt.
You may also invoke vopt on your own. For example, once you have compiled all the Verilog
and VHDL in the design you can then invoke vopt on the top level module, this will generate
optimized platform independent code for the entire design. You can then invoke vsim on this
optimized design. For full documentation on this new optional flow please refer to the
ModelSim SE User’s Manual.
This new “performance out of the box” (or vopt) flow can also be used on pure Verilog designs.
16
ModelSim 6.0 SE Performance Guidelines
Using Elaboration Files to Improve Regression Test Throughput
Elaboration refers to the process of generating native code for your platform. The ModelSim
simulator, vsim, elaborates every time you load a design. If elaboration is a significant part
of your overall simulation run time, you can isolate the elaboration phase to improve your
throughput. In other words, you create an elaboration file once, and then simulate it multiple
times. Elaboration files can be used for RTL or gate-level runs.
For example a multi-million, gate-level run may take 20 minutes to elaborate and annotate
SDF timing, and an additional 20 minutes to run. A second run with different testbench stimulus
also takes 20 minutes to load and 20 minutes to run. If you generate an elaboration file on the
first run, you eliminate the 20-minute elaboration and SDF annotation time for the second and
subsequent runs. Loading an elaboration file takes seconds, instead of minutes.
In many cases design-loading time is not that important. For example if you’re doing “iterative
design,” where you simulate the design, modify the source, recompile and re-simulate, the load
time is just a small part of the overall flow. However, if your design is locked down and only
the test vectors are modified between runs, loading time may materially impact overall simulation time, particularly for large designs loading SDF files.
Another reason to use elaboration files is for benchmarking purposes. Other simulator vendors
use elaboration files, and they distinguish between elaboration and run times. If you are benchmarking ModelSim against another simulator that uses elaboration, make sure you use it with
ModelSim as well so you’re comparing like to like.
The vsim arguments for creating and using elaboration files are summarized below. See the
ModelSim Command Reference for complete details.
Argument
Description
-elab <filename>
Creates an elaboration file
-load_elab <filename>
Loads an elaboration file
-compress_elab
Compresses an elaboration file when it is created
-filemap_elab
Establishes a map between files named during the original elaboration file
generation, and alternate file(s) to be used for subsequent runs.
Design Considerations for Use of Elab Option
For gate level designs it is best to specify SDF annotation files on command line. If you use
$sdf_annotate() task, it must be in an init block so that it is included in the elaboration file.
Test vectors should be read from a file. The load elab feature has support for file mapping
(-eab_filemap) so that a single elab image can read different files.
ModelSim 6.0 SE Performance Guidelines
17
Improving Gate-level Performance with Simulator Options
As noted earlier, ModelSim’s default simulation behavior promotes maximum debugging capability. However, you can specify simulator arguments that will promote simulation speed instead.
The following arguments to vsim will improve performance when simulating gate-level Verilog
designs. Keep in mind that you are disabling functionality by using these arguments.
Argument
Description
+notimingchecks Disables Verilog and VITAL timing checks for faster simulation. By default, Verilog
timing check system tasks ($setup, $hold,...) in specify blocks are enabled. For VITAL,
the timing check default is controlled by the ASIC or FPGA vendor, but most default to
enabled.
+nonotifier
Speeds simulation by disabling unknown (X) propagation for timing constraint violations.
Timing messages for the violations are still issued.
Your vsim command might look like this:
vsim tb -L asic_lib_fast +notimingchecks +nonotifier -do run -all; quit -f”
NOTE: +notimingchecks is also a compiler option. Using +notimingchecks at compile time reduces the memory
footprint, since the data structures for the timing information are not generated.
Decreasing Memory Footprint
An optimized Verilog ASIC/FPGA library cell is up to four times smaller memory footprint
than an unoptimized cell. This is the single largest impact to memory footprint of a gate level
run. Some designs may have capacitive load or other “non functional” models that have no
impact to a simulation test. ModelSim can eliminate the memory associated with these cells
while preserving the ports. This means you can eliminate the memory impact of non-functional
cells without modifying your netlists. The vlog command has an “ignore” option. Use this
compile option if the module that has no functional value, in this example the module name is
“capacitive _load”:
vlog +acc=i+capacitive_load
This option may be the difference in being able to fit a design into a 32-bit operating system.
Use only on cells that have no functional impact.
18
ModelSim 6.0 SE Performance Guidelines
Improving Performance with OS-specific Options
HP and Sun OS features allow applications to gain significant performance improvements.
ModelSim is implemented to take advantage of these OS features. The sections below discuss
the details.
Memory Addressing Above 2GB on an HP Platform
By default only ~1.5 GB memory is available for processes on 32-bit HP platforms. You must
change the default attributes of an application in order to access addressing space up to the
4GB limit. As system administrator you can do this with the following HPUX change attribute
command:
chatr +q4p enable +q3p enable ./vsim
The 4p command provides addressing into the 3-4GB block, and the 3p provides addressing
into the 2-3GB block. The 4p command is supported by 11.11 and 11.i. Caution should be used
when using the 4th quadrant (+q4p) since HPUX uses this quadrant for shared memory.
Applications like PLI or FLI may be effected when enabling this quadrant.
Enabling Large Pages on Sun/Solaris
Starting with Solaris 9 and ModelSim 5.7, you can improve simulation performance on
Sun/Solaris by enabling large memory pages. For large process size, up to a 2x improvement
have been measured. Note that the kernel_cage_enable may already be set to a one. Follow
these steps to use this Solaris feature with ModelSim 5.7 and newer:
1. Enable a large memory pages by adding the following line to the /etc/system file:
set kernel_cage_enable=1
2. Reboot your machine.
3. Large memory pages should now be available to vsim.
For more information, call us or visit: www.model.com
Copyright © 2004 Mentor Graphics Corporation. This document contains information that is proprietary to Mentor Graphics Corporation and may be duplicated in whole or in part by the original recipient
for internal business purposed only, provided that this entire notice appears in all copies. In accepting this document, the recipient agrees to make every reasonable effort to prevent the unauthorized use of
this information. Mentor Graphics is a registered trademark of Mentor Graphics Corporation. All other trademarks are the property of their respective owners.
Corporate Headquarters
Mentor Graphics Corporation
8005 S.W. Boeckman Road
Wilsonville, Oregon 97070 USA
Phone: 503-685-7000
North American Support Center
Phone: 800-547-4303
Fax: 800-684-1795
Silicon Valley
Mentor Graphics Corporation
1001 Ridder Park Drive
San Jose, California 95131 USA
Phone: 408-436-1500
Fax: 408-436-1501
Europe
Mentor Graphics
Deutschland GmbH
Arnulfstrasse 201
80634 Munich
Germany
Phone: +49.89.57096.0
Fax: +49.89.57096.400
Pacific Rim
Mentor Graphics Taiwan
Room 1603, 16F,
International Trade Building
No. 333, Section 1, Keelung Road
Taipei, Taiwan, ROC
Phone: 886-2-27576020
Fax: 886-2-27576027
Japan
Mentor Graphics Japan Co., Ltd.
Gotenyama Hills
7-35, Kita-Shinagawa 4-chome
Shinagawa-Ku, Tokyo 140
Japan
Phone: 81-3-5488-3030
Fax: 81-3-5488-3031
C&A 7-04
TECH6450-w