1
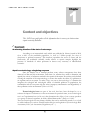
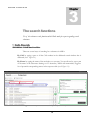
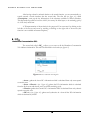
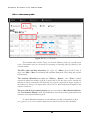
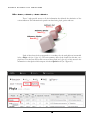
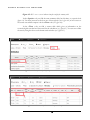
Version 3 .00 TOOLS4ENV AiiDA: Aquatic Impact Indicators DAtabase AiiDA -User manual - TOOLS 4 ENV AiiDA User Manual Version 3.00 Tools for Environment 4, Rue de la Châtellenie 1635 La Tour-de-Trême Switzerland Dr. Jérôme Payet Email: [email protected] Ing Odilon Hugonnot Email: [email protected] Date: May 2014 Language: English Availability: PDF file Foreword The lack and the difficulty of access to ecotoxicological data, as well as the complexity of the implementation of calculation and methods, make the use of the representativity of aquatic ecotoxicity indicators difficult. To overcome this issue, AiiDA provides the seventhy biggest worldwide aquatic ecotoxicity database (OPP, Fathead, Aquire, ECHA, CERC-USGS, EAT, OECD IUCLID). It provides more than 500 000 unique and referenced ecotoxicological tests on more than 8 000 species and 34 phyla. This global database is used to automatically calculate the different aquatic ecotoxicological indicators as well as their uncertainties according to the official Technical Guidance Document (TGD). AiiDA covers 22 000 molecules, including 13 500 with an ecological representativity of 3 phyla or more. The ecotoxicological indicators gathered in AiiDA are: HC50 (Hazardous Concentration 50%) calculated with the AMI (Assessment of Mean Impact) method, an outcome of Dr Jérôme Payet 2004 thesis. The risk assessment is calculated with the help of the Student table. This indicator is used by models such as USEtox to determine the characterisation factors of aquatic ecotoxicity within the frame of a LCA. HC5 and its confidence interval (Hazardous Concentration 5%) calculated with the Aldenberg method (2000) or the SSD (Species Sensitivity Distribution) extrapolation method of US-EPA (2005). PNEC (Predicted no-effect Concentration), calculated with the recommendations of the Technical Guidance Document on Risk Assessment (EU, 2003).This indicator is used within the risk assessment approach and within the legal frame. To learn more on the calculation methodology of indicators and risk assessment, we invite you to read the methodology guide of AiiDA which is available on the AiiDA internet platform and which lists the successive stages for creating data. Table of content Context and Objectives Context ..................................................................................................... 1 Objectives................................................................................................. 2 Software Access Connection ............................................................................................... 4 Home page ............................................................................................... 4 Search Tools Data Search .............................................................................................. 6 Substances search functionalities .................................................................... 7 Results table : advanced search ...................................................................... 7 The Batch mode ............................................. Erreur ! Signet non défini. Substances database .............................................................................. 8 Aquatic ecotoxicity indicators Substance description ............................................................................ 9 HC50 ......................................................................................................... 10 HC50 ALL : summary table ................................................................................ 11 HC50 « Acute », « Chronic », « Acute + Chronic » .......................................... 12 HC5 and HC5-95% ..................................................................................... 14 PNEC ....................................................................................................... 15 SSD Curves and Graphs LPSD and SSD Curves .......................................................................... 17 Comparison Graph ............................................................................... 19 Substances comparaison Comparison of selective substances .................................................. 20 The SSD and PSD comparaison graphs ......................................................... 21 The relative toxicity graphs ............................................................................. 21 Comparison per group .......................................................................... 22 Group relative toxicity graph .......................................................................... 22 Upcoming updates Future evolutions of AiiDA.................................................................... 24 C O N T E X T A N D 1 Chapter O B J E C T I V E S Context and objectives This AiiDA user guide gathers all the information that is necessary to obtain various aquatic ecotoxicity indicators. Context An alarming situation of the state of waterways. According to an international study which was published in Nature journal in 2010, close to 80% of the worldwide population, i.e. close to 5 billion people, live close to deteriorate or polluted waterways. This situation jeopardizes the access to water and the biodiversity. All worldwide scientific studies relative to aquatic samples highlight the presence of hundreds of micro pollutants in almost every waterway of industrialized countries. Aquatic ecotoxicology: a beginning response Since the massive use of chemical products, many adverse consequences have been observed on Man and his environment. From there on, scientists have tried to determine and quantify the toxicity of substances emitted in the aquatic environment. Ecotoxicity can be defined as being the extension of the term toxicology, a science that studies the effects of a pollutant on an organism and an ecosystem. To make it easy, one can say that toxicology is "a domain that integrates the ecological and toxicological effects of chemical pollution on populations, the communities and the ecosystem with the action (transport, transformation and degradation) of these pollutants on the environment"(Forbes et al. 1997) Ecotoxicological tests are part of the tools that have been developed so as to evaluate the impact of substances on the environment. In practical terms, an ecotoxicological test is an "experimental test (or bio test) that determines the effect of one or many products on a group of selected organisms, in clearly defined frameworks" (Keddy et al. 1994). These ecotoxicological tests are primary variables that can be statistically treated so as to lead to usable indicators in various scientific methodologies and regulations (Ecotoxicologic Risk Assessment, Life Cycle Assessment, Regulations, etc …) 1 C O N T E X T A N D O B J E C T I V E S Aquatic impact calculation models HC50 Ecotoxicological tests Impact score in LCA Legislation PNEC Risk assessment models Environment protection mesures HC5 Figure 1.1: Importance of ecotoxicological tests in LCA and in Risk Assessment. Difficulties met in aquatic ecotoxicity The reality as well as the importance of ecotoxicological impacts of industrial chemical substances on waterways have been well proved. Despite this, impacts are rarely considered in the ecodesign context. The methods used to determine the impacts exist and are recognized at the international level and yet are often neglected because of the following 3 black spots: • • • Lack of ecotoxicological data Difficulty of access to data and their lack of traceability Complexity of calculation and methods implementation In this context, Tools for environment has taken the initiative to create a database that puts together all internet free access available ecotoxicological tests by bringing together, amongst other things, present tests on European platforms (ECHA, IUCLID) et American platforms (AQUIRE, OPP, USGS). This allows to obtain a worldwide ecotoxicological database with the most exhaustive data. Objectives of AiiDA The automatic calculation of various ecotoxicological impact indicators AiiDA allows the automatic calculation of various aquatic ecotoxicological indicators, as well as their corresponding uncertainty, using the official TGD (Technical Guidance Document). The objective of this project is to create a source of ecotoxicological test regularly updated, dynamically linked to the calculations of various aquatic indicators. In this way, the ecological representativity is improved as well as the corresponding uncertainty. The update of AiiDA, using the totality of the database available tests, will have a direct influence on the values of the various indicators 2 C O N T E X T A N D O B J E C T I V E S Traceability of the aquatic ecotoxicological indicators Aquatic exotoxicity AiiDA allows the traceability of the calculations and to go back to the entire set of the initial used tests. This traceability, totally inexistent to this day, is a major asset for the ecodesign field. Lack of exotoxicological data REACH Regulation AiiDA database US-EPA Complexicity of methodology Automatic calculation script Difficult data access Distribution platform Figure 1.2: Cycleco’s initiative to resolve the problems linked to aquatic ecotoxicity Public BDD | Global BDD | IT scripts | Internet Site | Actors Entreprises AQUIRE Research ECHA (REACH regulation) AiiDA (treacability) Indicators calculation system Distribution platform Universities IUCLID Consultants ... Institutions Figure 1.3: AiiDA operating principle diagram 3 S O F T W A R E 2 Chapter A C C E S S Software access Connexion and first steps on AiiDA, software handling. Connexion Access to AiiDA To access to AiiDA, you must connect to the following web address (and possess a user license): http://aiida.tools4env.com. Then click on the Login tab top right of the page (see Figure 2.1) Figure 2.1 : AiiDA connexion interface Home page Access to AiiDA In the left drop-down menu, you will find various sections Home: welcome page with AiiDA news. Data Search: allows you to search a substance in particular as well as the substances toxicity comparison function. AiiDA Database: gathers the various AiiDA bases. 4 S O F T W A R E A C C E S S Substances: gives an access to the substances database, classifiable by name, type or QSAR category. Species : gives access to the AiiDA species database, classifiable by kingdom, group, phylum or by name Sources Databases: gives access to the various AiiDA ecotoxicological databases including the tests. All Indicators Table: gives access to an Excel file that includes the indicators’ values and their uncertainty for the whole of the AiiDA inventory substances. A.M.I: gives access to the pdf document that includes the A.M.I. Figure 2.2: Welcome page AiiDA interface The horizontal menu above the page also allows to access to the various sections of the database once you have left the welcome page. In the upper right, the user tab, including the user pseudonym, allows you to have access to your user information (see figure 2.3), the help section and to disconnect. Figure 2.3 : AiiDA user interface 5 S E A R C H 3 Chapter F U N C T I O N S The search functions Use of the substances search function and the Batch mode for requests regarding several substances. Data Search Substances search functionalities There are several ways of searching for a substance in AiiDA: By CAS: by typing a part or all the CAS number in the dedicated search window that is dedicated (see 1 Figure 3.1). By Name: by typing the name of the molecule or a synonym. You are allowed to type a part of the name of the substance. Starting as of 3 characters, AiiDA will automatically suggest a list of potential corresponding names in the response table (see 2 Figure 3.1). Figure 3.1: Search function and substances comparison function interface 6 S E A R C H F U N C T I O N S By Type, Category and by Database: the selection tabs (see 3 Figure 3.1) allow you to filter the results according to the various molecule properties, their QSAR category, their type (Organic, Inorganic and Pesticide) or the source database. Once a molecule is identified, to have access to the aquatic ecotoxicity indicators, click on the magnifying glass on the right of the table. The substances comparison function Molecules comparison: use the « plus » sign on the right of the table (see 4 Figure 3.1) which allows you to select up to 5 molecules so as to compare their toxicity. Once they are selected, the molecules appear in the “Selected Substances” table. You then have to click on the “Compare” button to access to the various comparison graphs. Class comparison: use the « Selected Class » search window (see 5 Figure 3.1) to select a chemical class (of maximum 500 molecules) and compare the toxicity of the class with the entire molecules AiiDA database. Results table: advanced search When a search leads to several responses, AiiDA provides a results table. This results table can be classified by increasing or decreasing CAS order, by molecule name alphabetical order or by phyla number order, represented by simply clicking on the columns headers (see 1 Figure 3.2). Figure 3.2: Results table interface It is also possible to launch an advanced search in the results list by using the magnifying glass in the bottom left corner of the table (see 2 Figure 3.2). A new window then opens up allowing you to launch more precise searches on each parameter (see Figure 3.3). This advanced search function allows you to combine several requests. In the example of figure 3.3, the advanced search function displays only the molecules which do not have “Nitro” in their name, which belong to organics, represented on more than 3 phyla and having Chlorine in their chemical formula. 7 S E A R C H F U N C T I O N S Figure 3.3: Advanced search interface The substances database The chart of all the substances that are available in AiiDA It is also possible to launch a search in the AiiDA substances database where all the molecules are recorded (see Figure 3.5). In order to do this, you just have to fill in the “CAS number” or the “Chemical Name” search windows. This automatically filters the result chart (see 1 Figure 3.5). It is also possible to narrow the search by selecting the “Molecule Type” or the “QSAR Class” (see 2 Figure 3.5). Once the molecule is identified, just click on the right of the table magnifying glass to access to the indicators (see 3 Figure 3.5). Figure 3.5: AiiDA’s substances database Please note that you can launch the same above search in the Species database to find a particular species or to identify a phyla. The species database is directly linked to the IT IS database (Integrated Taxonomic Information System). 8 A Q U A T I C E C O T O X I C I T Y 4 Chapter I N D I C A T O R S The aquatic ecotoxicity indicators Accessing to the various aquatic ecotoxicity indicators, uncertainties and source tests after having selected a substance. Description of the substance The key information on each substance Figure 4.1: Substance’ description 6 A Q U A T I C E C O T O X I C I T Y I N D I C A T O R S After having selected a molecule thanks to the search function, you are automatically rerouted towards a results interface that has several tabs. The first tab (see figure 4.1), called « Description », sums up the key information of the substance available in AiiDA’s database. This data made it possible to have the A.M.I (Assessment of the Mean Impact, see the methodology guide of the AiiDA tool) model run. A 3D representation of the molecule is also proposed. You can rotate it by clicking on the left side of the mouse and zoom by scrolling or clicking on the right side of the mouse (this function is not available on Internet Explorer). HC50 Hazardous Concentration 50% The second tab, called « HC50 », allows you to access to all the Hazardous Concentration 50% indicator information. This tab is itself divided in 4 sub-tabs (see figure 4.2). Figure 4.2: HC50 indicator sub-categories « Acute » gathers the Acute HC50 information which is calculated from only acute aquatic ecotoxicity tests. « Acute + Chronic » (see 3 figure 4.3) gathers the HC50 information which is calculated from the all the acute and chronic tests (see AiiDA methodology guide). « Chronic» gathers the Chronic HC50 information which is calculated from only chronic aquatic ecotoxicity tests. « HC50 All » (see 1 figure 4.3) gathers and synthesizes in a chart all the HC50 information which is calculated by AiiDA. 10 A Q U A T I C E C O T O X I C I T Y I N D I C A T O R S HC50 ALL: the summary table Figure 4.3: HC50 All tab interface This summary table contains 3 lines, one for each indicator, where you can find several levels of information that you can classify by increasing or decreasing order by clicking on the columns headers: The HC50 values and their uncertainty: (see 2 figure 4.3) « Mean » gives the HC50 value in mg/L and « Min » « Max » the minimum and maximum framework values, taking into account the uncertainty. The statistical information on tests: the « Phyla », « Species » and « Tests » columns respectively indicate the number of phyla of species and of tests that were used to calculate the indicator as well as its uncertainty. The blue bars (see 4 figure 4.3) represent the degree of purity of the indicator, by doing a tests report which values have not been extrapolated compared to the number of total tests. The most and the least sensitive phylum: the two last columns « Most Sensitive Phylum » and « Less Sensitive Phylum » allow the identification of the most sensitive phyla and the most resistant to the concerned substance phyla. To obtain additional information on each indicator, just click on the number of phyla (see 3 figure 4.3) so as to be re-routed towards the list of phyla used for the HC50 calculation. . 11 A Q U A T I C E C O T O X I C I T Y I N D I C A T O R S HC50 « Acute », « Chronic », « Acute + Chronic » These 3 tabs provide access to all the information that allowed the calculation of the various indicators. This information is spread over three levels, phyla, species and tests. Each of these three levels corresponds to a secondary tab, the used phyla are inventoried in the « Phyla » tab (see 1 figure 4.3). The same summary table can be found but, this time, on a phyla level. You then just need to click on one of these phyla (see 2 figure 4.3) to have access to the information on the species which compose it in the « Species » tab (see 3 figure 4.3). 12 A Q U A T I C E C O T O X I C I T Y I N D I C A T O R S Figure 4.3: HC50 Acute + Chronic indicator interface and phyla summary table In the « Species » tab, we find the same summary table, but this time, on a species level (figure 4.4). You then just need to click on one of these species (see 1 figure 4.4) to have access to the source tests which compose it in the « Tests » tab (see 2 figure 4.4). In the « Tests » tab, we find a sources table which gives us information on the ecotoxicological tests that have been used for the calculation (see 1 figure 4.5). You can sort or filter the tests by using the above each column search window (see 2 figure 4.5). Figure 4.4: Summary table of the species present in the Nemata phylum Figure 4.5: Sources table for the Prionchulus punctatus species 13 A Q U A T I C E C O T O X I C I T Y I N D I C A T O R S HC5 and HC5-95% Hazardous Concentration 5% Figure 4.6: Summary table and interactive graph of the HC5 indicator 14 A Q U A T I C E C O T O X I C I T Y I N D I C A T O R S The third tab called « HC5 » allows you to have access to information regarding the Hazardous Concentration 5% indicator. AiiDA allows you to calculate this indicator according to two methods (see AiiDA methodology guide): Aldenberg method US-EPA method The summary table contains four lines (see 1 figure 4.6), two for each method. Indeed, the HC5 indicator can be calculated for the phyla and for the species (for more details, see the AiiDA methodology guide). In the summary table, you can find the total number of phyla and species that have been used for the calculation, as well as the 95% confidence intervals. To obtain more information on the source tests used for the calculation of the indicator, just click on the number of species or phyla so as to be re-routed. In order to interpret more easily the various values of the HC5 indicator, AiiDA provides an interactive graph which compares the various values at the logarithmic scale. You may display or hide the confidence intervals to facilitate their comparison (see 2 figure 4.6). PNEC Predicted No-Effect Concentration The « PNEC » tab allows you to access to the Predicted No-Effect Concentration indicator. The Concentration without a predictable effect can be used to evaluate the risks for aquatic organisms. It indicates a concentration for which no effect is expected on the whole of organism. The summary table gives access to the following information: The PNEC in mg/L The safety factor (AF): this parameter depends on the number of acute and chronic tests available in the database for the calculation of the PNEC. It allows to take into account the variability and the uncertainties. It divides the weakest observed concentration so as to prevent the possible risks of an ecological under-representation (further details in the AiiDA methodology guide). The retained species as the most sensitive to the substance, as well as its phylum. The number of acute and chronic tests, as well as their allocation within the species and the phyla used to determine the safety factor. This level of information allows to judge the relevance of the PNEC. To access to information on the source test that was retained to determine the PNEC value, just click on the value of the latter (see 1 figure 4.7). A second table will show up (see 2 figure 4.7), giving access to the details of the test such as, for example the original base, the endpoint, the length, the author, the title, the source, the date of publication, etc … 15 A Q U A T I C E C O T O X I C I T Y I N D I C A T O R S Figure 4.7: PNEC summary table and source 16 S S D C U R V E S A N D 5 Chapter G R A P H S SSD Curves and Graphs So as to facilitate the interpretation of the various aquatic ecotoxicity indicators, AiiDA provides a series of interactive and intuitive graphs. The PSD and SSD Curves Phyla Sensitivity Distribution, Species Sensitivity Distribution Figure 5.1: PSD Curve, Phyla Sensitivity Distribution 6 S S D C U R V E S A N D G R A P H S The SSD curves give a representation of the percentage of the affected species or phyla according to the logarithm of the pollutant’s concentration. Ideally, this effect-concentration relationship follows a lognormal distribution, which gives, for SSD curves, a cumulative display S curve (see figure 5.1). A confidence interval can also be determined, especially narrow as the quantity and the quality of the available data is good. This interval allows to calculate a 95% safety value. The HC5-95%, for example, indicates the pesticide concentration for which 5% of the species will be affected with a probability of 95%. You can also find on the same graph, the various aquatic ecotoxicity indicators provided by AiiDA, PNEC, HC5 and HC50, as well as their 95% safety interval (see 1 figure 5.1). This allows to rapidly bring together the entirety of the available information on a same figure and to use it to analyse the toxicity of the substance. You can display or hide the phyla or the species by simply clicking on their name in the corresponding list (see 2 figure 5.1). It should also be noted that, by pointing with the mouse the various points of the graph, you can display an information box which gives information on the concentration and the percentage of the affected species or phyla. The graphs are printable and downloadable in the form of JPEG images or PDF files and can be customized by displaying or hiding the whole of the Labels or the Phyla/Species (see 3 figure 5.1). Figure 5.2: SSD Curves, Species Sensitivity Distribution 18 S S D C U R V E S A N D G R A P H S Comparison graph Comparison of a substance to the others of the database The « Substance comparison » tab allows you to access to the graph which classifies the various molecules of the AiiDA database by order of increasing toxicities. The coloured point represents the (HC50) log of the molecule that you are studying and the blue curve represents the whole of the (HC50) log of the molecules present in the database (see figure 5.3). With a single glance, this figure allows you to have an idea of the toxicity of this molecule compared to the others. Figure 5.3: Substances distribution curve of the AiiDA database, by increasing toxicity order All the graphs present in AiiDA also offer the possibility to zoom on a particular area. All you have to do is click and hold down the left mouse button and highlight the desired area. To dezoom and go back to the overall view, just click on the « reset zoom » link which appears on the top right during a zoom. 19 S S D C U R V E S A N D G R A P H S 6 Chapter Comparing substances The substances and group comparison module in AiiDA Comparison of chosen substances Comparing the toxicity of selected substances In the « Data Search » section, you can select the molecules that you want and add them in the « Selected Substances » table. You then just have to click on the « Compare » button to access to the various comparison graphs. Note that the substances comparison module only allows to compare a maximum of 5 substances. To compare more substances, you need to carry out a group comparison (please refer to the following paragraph). Figure 6.1: Substances selection table for comparison Once the comparison module is launched, you will have access to a new page which contains 4 tabs (see figure 6.2). Figure 6.2: Comparison module with its 4 tabs 6 U P C O M I N G U P D A T E S The SSD and PSD comparison graphs The first two tabs (see 1 figure 6.2) allow to access to the PSD and SSD comparison graphs (Phyla/Species Sensitivity Distribution). Figure 6.3: 3 pesticides PSD comparison graph These graphs provide the values of the different HC50, HC5 and PNEC indicators (see 2 and 3 figure 6.3) for each of the chosen substances, as well as the number of the represented phyla or species (see 1 figure 6.3). Each value displayed on the graph is clickable and takes you directly to the details of the calculation and to the tests which made it possible to have it determined. These graphs make it possible to identify the least impacting substance for the aquatic environment. The toxicity positioning graphs The two last tabs (see 2 figure 6.2) allow you to access to the molecules toxicity positioning graphs compared to the whole of the present substances in AiiDA. The positioning is calculated either according to the phyla or according to the species and allows you to quickly have a view of the impact of the substances. The 1 and 2 curves in figure 6.4 respectively represent the whole of the HC50 and the HC5 classified by decreasing toxicity order. 21 U P C O M I N G U P D A T E S Figure 6.4: Toxicity positioning graph calculated for the species Comparison by group Comparing the toxicity of substances which have neighbouring molecular properties In the « Data Search » section, you can select a group of molecules thanks to the « Group Filter » search window (see 1,2 figure 6.5). All you have to do then is click on the « Group Compare » button so as to access to the various group comparison graphs. Please note that the group comparison module only allows to compare a maximum of 500 substances. You can also narrow down your group of substances by using the advanced search function and by adding filters on the various parameters. Figure 6.5: Selection of the « aldéhyde » substances group Group toxicity positioning graph Once you have selected your group and the comparison module is run, a positioning graph by decreasing toxicity will be offered to you. This graph will allow you to identify the toxicity of a specific group compared to the whole of the AiiDA database and determine its dangerousness for the aquatic environment. 22 U P C O M I N G U P D A T E S Figure 6.6: « Aldéhyde » substances group positioning graph 23 U P C O M I N G U P D A T E S 7 Chapter Upcoming updates The potential developments of AiiDA and the upcoming udpates AiiDA’s future evolutions Update of the database and improvement of the tool’s functionalities Ecotoxicological tests databases such as AQUIRE and REACH Echa Chem, which make it possible for AiiDA to operate, will be updated annually. The aquatic ecotoxicity indicators will be updated in case of possible regulation changes or calculation methods changes in the technical guidance document. In the long run, the next version of AiiDA may be enriched by the various actors themselves. They will be able to create their own account and directly put forward their own ecotoxicological tests which will be incorporated into the database after the administrator’s verification and validation. These various actors will represent a great source of improvement of the global database. They will also help verify the data coherence. 24