1
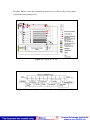
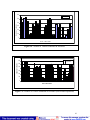
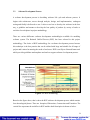
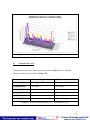
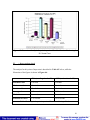
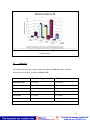
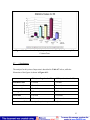
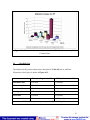
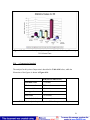
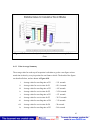
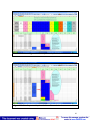
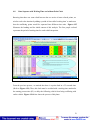
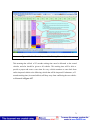
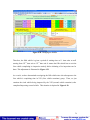
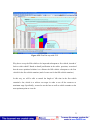
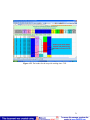
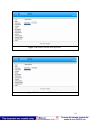
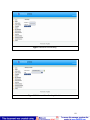
Figure 4.13: Illustration of analysis for point inspection P9 – Under Carriage Test using
3-D Column Chart.
P10
: Computerized Analysis
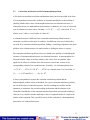
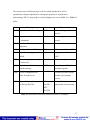
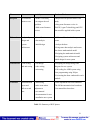
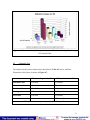
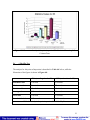
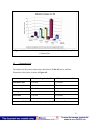
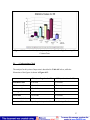
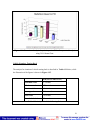
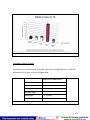
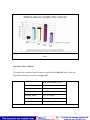
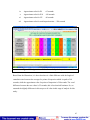
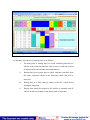
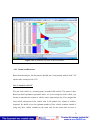
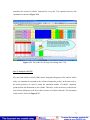
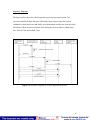
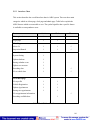
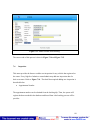
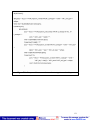
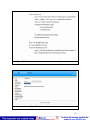
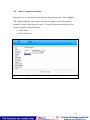
The analysis for this point of inspection is described in Table 4.10 below, while the
illustration of the figures is shown in Figure 4.14.
P1B (service time for P1)
Minimum value
75 seconds
Maximum value
234 seconds
Number of data
65 vehicles
Average value
158 seconds
Mod value
150 seconds
Standard deviation
38.1 seconds
Table 4.10: Analysis for point inspection P10 – Computerized Analysis
58