1
3.6 Definitions of Waterfall Diagrams and
compliance maps
3.6.1 Waterfall diagrams
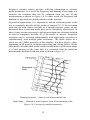
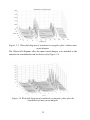
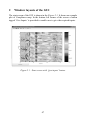
Waterfall diagram is a 3-dimensional representation with frequency on the
x-axis amplitude on the y-axis and nodes of the structure on the z-axis.
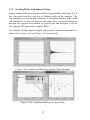
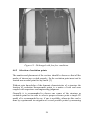
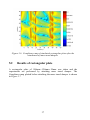
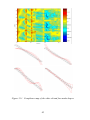
Figure3.7 shows a mobility waterfall diagram created on a simulated
rectangular plate in MATLAB®.
3.6.2 Compliance maps
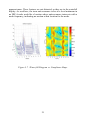
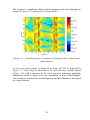
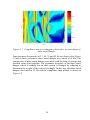
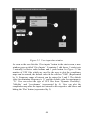
Compliance maps are color diagrams with frequency on the x-axis physical
position on y-axis and color scale represents amplitude.
The FRF magnitudes should usually be scaled logarithmically. This
displays the FRF peaks and dips with equal symmetry. For compliance
color-maps, this means opposite colours equally represent extremes of
stiffness or compliance and deep blue would represent large apparent mass
[1].
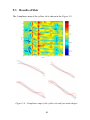
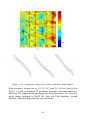
Viewing data in this way gives a depiction of how the dynamic properties
distribute themselves both spectrally and spatially. The peaks of
accelerance line up at constant frequency and vary only in amplitude,
defining the mode shape along the reference line. For drive point FRFs,
every resonance is followed by anti resonance. The anti-resonance do not
line up at a single frequency. Their frequencies wander with position from
the node line at one mode to node line at next mode.
3.6.3 Waterfall diagrams Vs Compliance maps
As an alternative to the waterfall diagram, the data can be displayed as a
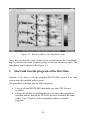
color map shown in the figure3.7 .The color scale now represents amplitude
and the Y direction represents physical position. This type of threedimensional display improves on the waterfall diagram for conceptualizing
the spatial as well as spectral nature of structural dynamic behaviour. The
modes show up as vertical bars of high accelerance (yellow and or red).The
anti-resonance areas are distinguished as dark blue or green valleys of high
20