1
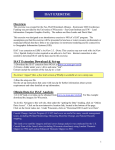
GIS EXTENSION FOR BATHTUB
ARCVIEW INTERFACE -- USERS MANUAL
KBS PUBLICATION NO. 122
30
Riverine
Transition
Mud Creek Cove
Main Basin
Area-Weighted Average
20
Scenario 3
Scenario 2
+
10
5
-1
Management Goal (11 mg L )
proposed by Cityof Whichita
*
15
CURRENT
Chlorophyll a (ppb or mg L-1)
25
*
Scenario 1
0
0
10
20
30
40
50
60
Load reduction (%)
JANUARY 2005
70
80
90
100
GIS EXTENSION FOR BATHTUB
ARCVIEW INTERFACE
USERS MANUAL
KBS PUBLICATION NO. 122
JANUARY 2005
CENTRAL PLAINS CENTER FOR BIOASSESSMENT
KANSAS BIOLOGICAL SURVEY
AND
DEPARTMENT OF GEOGRAPHY
UNIVERSITY OF KANSAS
AND
U.S. ENVIRONMENTAL PROTECTION AGENCY
REGION VII
Table of Contents
Chapter
Title
Page
1.
INTRODUCTION..................................................................................................... 1
2.
LOADING THE EXTENSION ............................................................................... 2
3.
CALCULATING LAKE SEGMENT PARAMETERS ........................................ 4
3.1. Calculating Segment Morphometric Parameters .............................................. 4
3.1.1. Segment Morphology tool ................................................................................ 4
3.1.2. Segment Length tool......................................................................................... 6
3.1.3. Segment Connectivity tool................................................................................ 6
3.2. Calculating Segment Water Quality Parameters............................................... 8
3.2.1. Water sample processing ................................................................................. 8
3.2.2. Calculating segment water quality ................................................................ 10
4.
CALCULATING LAKE TRIBUTARY PARAMETERS .................................. 12
4.1.
4.2.
4.3.
4.4.
4.5.
4.6.
Obtaining Tributary Water Quality Parameters from AnnAGNPS Output 12
Creating Reach ID Shapefile.............................................................................. 14
Tributary within Segments ................................................................................ 16
Editing Tributary Name and Type.................................................................... 18
Calculating Tributary Baseflow ........................................................................ 20
Editing Tributary Table..................................................................................... 22
5.
GENERATING BATHTUB PROJECT FILE..................................................... 24
6.
VISUALIZING BATHTUB OUTPUTS ............................................................... 26
REFERENCE.................................................................................................................. 29
i
Table of Figures
Figure 1.
Figure 2.
Figure 3.
Figure 4.
Figure 5.
Figure 6.
Figure 7.
Figure 8.
Figure 9.
Figure 10.
Figure 11.
Figure 12.
Figure 13.
Figure 14.
Figure 15.
Figure 16.
Figure 17.
Figure 18.
Figure 19.
Figure 20.
Figure 21.
Figure 22.
Figure 23.
Figure 24.
Figure 25.
Figure 26.
Figure 27.
Figure 28.
Figure 29.
Figure 30.
Figure 31.
Figure 32.
Figure 33.
Figure 34.
Figure 35.
Figure 36.
Figure 37.
Figure 38.
Figure 39.
Figure 40.
Figure 41.
Figure 42.
ArcView extensions........................................................................................ 2
ArcView platform after loading the GeoBathtub extension........................... 3
ArcView platform with Segment Morphology menu item highlighted. ........ 5
Dialog with Segment Morphology inputs. ..................................................... 5
Table created by the Segment Morphology tool. ........................................... 6
Dialog when the Segment Length tool is selected.......................................... 6
Dialog when the Segment Connectivity tool is selected. ............................... 7
Segment Connectivity tool with the “from segment” highlighted. ................ 7
Interface with the Segment Water Quality menu item highlighted................ 8
Dialog used to calculate water quality for each sampling location. ............... 9
On-site water quality table.............................................................................. 9
Laboratory water quality table...................................................................... 10
Interface with the Calculate Segment Water Quality menu item highlighted.
...................................................................................................................... 10
Dialog with the Calculate Segment Water Quality tool. .............................. 11
Segment water quality table calculated from water samples........................ 11
Interface with Tributary Water Quality from AnnAGNPS menu item
highlighted. .................................................................................................. 12
AnnAGNPS Event Output File dialog. ........................................................ 13
AnnAGNPS output file................................................................................. 13
Dialog showing the selection of reaches and simulated period.................... 14
Output from the Tributary Water Quality from AnnAGNPS tool. .............. 14
Interface with Tributary ID Calculation menu item highlighted.................. 15
Dialog with the Create Reach ID Shapefile tool. ......................................... 16
The newly created reach ID shapefile highlighted in red............................. 16
Interface with Tributary within Segment menu item highlighted. ............... 17
Tributary within Segments dialog. ............................................................... 17
An example of AnnAGNPS reach file. ........................................................ 18
Interface with Edit Tributary Name and Type menu item highlighted. ....... 19
Dialog with tributary water quality input. .................................................... 19
The Edit Tributary Name and Type Dialog.................................................. 19
Interface with Tributary Baseflow menu item highlighted. ......................... 20
Dialog with Tributary and Baseflow inputs ................................................. 21
Baseflow sample table.................................................................................. 21
The Tributary Baseflow dialog..................................................................... 21
Interface with Edit Tributary Parameters menu item highlighted. ............... 22
Tributary Table dialog.................................................................................. 22
The Edit Tributary Table dialog. .................................................................. 23
Interface with Create Bathtub Input File menu item highlighted................. 24
Dialog with Create Bathtub Input Text File inputs. ..................................... 25
An example BATHTUB project file. ........................................................... 25
Interface with BATHTUB Visualization menu item highlighted. ............... 26
The BATHTUB Profile Output. ................................................................... 26
BATHTUB profile output text file. .............................................................. 27
ii
Figure 43. The BATHTUB Profile Visualization dialog............................................... 27
Figure 44. Visualization of simulated turbidity in BATHTUB profile output file........ 28
iii
ACKNOWLEDGEMENT
The BATHTUB ArcView 3.x extension (GeoBathtub) is programmed by Matt Harman,
graduate student of the Department of Geography, under the guidance of Dr. Xingong Li
of the Department of Geography, and Dr. Steven Wang of the Kansas Biological Survey,
University of Kansas. Special thanks are given to Drs. Edward Martinko, Frank
deNoyelles, Jr., and Donald Huggins, and research assistant, Jude Kastens, of the Kansas
Biological Survey for their kind support in the development of this BATHTUB GIS
interface. This project is funded by the U.S. Environmental Protection Agency with
award number X-99797001-0 to the University of Kansas Center for Research and a
partly assistance from the general fund of the Kansas Biological Survey.
iv
GIS Extension for BATHTUB
1. INTRODUCTION
Unlike natural lakes, reservoirs are relatively new and complex aquatic ecosystems that
are constructed by the human with a life span of approximately 100-200 years
(deNoyelles, et al., 2003; Mankin et al., 2003). In general, there are a number of
significant differences exist between reservoirs and natural lakes. First, construction of a
reservoir greatly disturbs the abiotic and biotic environment. Second, reservoirs tend to
have relatively large contributing watersheds. Coupled, these two factors create a highly
unstable aquatic environment. As a result, watershed conditions and stressors greatly
influence the artificial ecosystems associated with reservoirs. This in turn directly affects
reservoir health and stability (e.g., nutrient enrichment and sedimentation).
With passage of the Clean Water Act of 1972 and Safe Drinking Water Act of 1974,
nonpoint sources are the single largest remaining source of reservoir water quality
impairments in the Central Plains of the United States. Excess nutrients and siltation,
both of which result from intensive agricultural activities, contribute most to
eutrophication. According to the National Water Quality Report to Congress, 50% of
assessed U.S. lakes and a higher percentage of reservoirs in the Midwest were considered
eutrophic (USEPA, 2000). In Kansas, 193 of the 240 publicly owned reservoirs
evaluated were eutrophic and frequently showed symptoms of eutrophication, including
nuisance algal blooms, reduced water transparency, and depleted levels of hypolimnetic
dissolved oxygen.
To predict eutrophication and derive nutrient criteria for lake management, a variety of
modeling tools have been used to evaluate in-lake trophic conditions and estimate loading
from a watershed. Of which, BATHTUB has proven to be an effective tool for water
quality assessment and management (Ernst et al., 1994), and been used in many states
(e.g., MN, SD, KS). BATHTUB is an empirical model designed to assess eutrophication
for morphometrically complex reservoirs (Walker, 1996). Major advantages of
BATHTUB over other models in the Midwest are 1) its use of simple steady-state
calculations to address eutrophication processes, which reduces data demands greatly;
and 2) the windy, relatively flat agricultural landscape of the Central Plains creates well
mixed and turbid lentic waterbodies (O’Brien, 1975; Randtke and deNoyelles, 1985),
thus rendering the comparatively simple BATHTUB model as more appropriate to use
than the more complex two or three dimensional models (Cole and Buchak, 1995).
Though BATHTUB is an effective tool for reservoir water quality assessment, data
preparation and modeling procedures make its application tedious and time consuming.
Therefore, automation of the data preparation and processing becomes necessary.
ArcView® BATHTUB extension (GeoBathtub) is a user-friendly tool developed to assist
modelers and decision-makers to conduct easier, effective reservoir water quality
assessments. The extension assists users to extract required segment and tributary data
from field water samples and AnnAGNPS modeling outputs, generates BATHTUB
project file, and visualizes BATHTUB modeling results. This manual documents the
functionality of the BATHTUB extension.
1
GIS Extension for BATHTUB
2. LOADING THE EXTENSION
All ArcView extensions have the .avx file extension and are located under ArcView
extension folder EXT32, which is under your ArcView installation folder. A typical
default ArcView installation folder is C:\ESRI\AV_GIS30\ARCVIEW. The Bathtub
ArcView extension is called GeoBathtub.avx. To use the extension, it needs to be copied
to the EXT32 folder.
Once the extension is in the EXT32 folder, then open View (version 3.3) GIS program.
Click on File menu and then click on Extensions. Figure 1 shows the Extensions dialog
with the GeoBathtub extension checked. Because the GeoBathtub extension uses some
functions of the Spatial Analyst extension, the Spatial Analyst extension will be
automatically added while the GeoBathtub extension is loading.
Figure 1. ArcView extensions
2
GIS Extension for BATHTUB
After loading the GeoBathtub extension, a menu bar and several buttons will appear on
standard ArcView platform. Figure 2 shows what the ArcView platform will look like
after the GeoBathtub extension has been loaded. The Bathtub menu serves as an
alternate means to accessing the functionality in the extension. The first row of buttons
provides several dialog boxes to manipulate BATHTUB data, while the bottom two tools
on the tool bar allow user to interact with the data.
Figure 2. ArcView platform after loading the GeoBathtub extension.
3
GIS Extension for BATHTUB
3. CALCULATING LAKE SEGMENT PARAMETERS
BATHTUB divides a complex lake into several connected segments. Two types of
segment parameters are needed in BATHTUB model. The first set of parameters
includes segment morphometric measurements such as segment area and length, while
the second group of parameters requires water quality measurements in the segments. To
calculate segment parameters, segment and sampling location shapefiles are needed,
along with the two water-quality tables. One table holds temperature-depth information
measured in the field while the other holds water quality measurements analyzed in
laboratory. The outputs of segment processing are two tables, one stores segment
morphometric data while the other contains segment water quality variables.
3.1. Calculating Segment Morphometric Parameters
Three tools, segment morphology, segment length, and segment connectivity, could be
used to calculate segment morphometric parameters. The segment morphology tool
creates a table and populates it with basic segment attributes, such as segment surface
area, ID, name, and group number. The connectivity and length tool allow a user to
interactively define segment connectivity and length.
3.1.1. Segment Morphology tool
The first step in creating Bathtub input file is to calculate morphometric information from
the lake segment shapefile. At this point, the lake segment shapefile should be added to
ArcView. The segment shapefile must have an attribute table that contains at least two
fields -- SID and SName. The SID field stores the unique number assigned to each
segment while the SName field stores segment names. To calculate segment
morphology, select either the Segment Morphology menu item under the Bathtub menu
(Figure 3) or click on the Segment Morphology button
4
.
GIS Extension for BATHTUB
Figure 3. ArcView platform with Segment Morphology menu item highlighted.
A dialog box will open (Figure 4) and asks for the segment shapefile and the path as well
as the name of segment morphology output table. The segment shapefile can be selected
from the drop down list that includes only polygon shapefiles. The output table name can
either be typed directly into the box or the Browse button can be clicked to navigate to a
specific location. The default name for the output table is segmorph.dbf. Once the
segment shapefile and the output table have been specified, click the OK button.
Figure 4. Dialog with Segment Morphology inputs.
A new table is created (Figure 5) and will be added into the current ArcView project.
The table contains basic information (ID, name, group number, and surface area) for the
5
GIS Extension for BATHTUB
segments. The Length and OutflowSegmentID fields in the table can be populated by the
segment length and connectivity tool.
Figure 5. Table created by the Segment Morphology tool.
3.1.2. Segment Length tool
The Segment Length tool allows a user to interactively define the length of each segment.
This process requires that the user is knowledgeable of the approximate flow path in a
segment. To use the tool, click the Segment Length button
. A dialog box (Figure 6)
will be open and promptly asks for the path and name of the table in which the Length
field is defined and will be updated.
Figure 6. Dialog when the Segment Length tool is selected.
Once the table is specified and the OK button is clicked, the cursor will change to a
crosshair while within the map window. To define segment length, start at one end of a
segment and click along its approximate flow path. Once the end of the segment has
been reached, double click to end the line. The flow path (line) will flash and then
disappears. The length of the flow path is calculated and the length of the segment that
contains the flow path will be updated in the specified table.
3.1.3. Segment Connectivity tool
Segment connectivity represents the water flow between segments. Again, the user must
have the knowledge of how the water flows in a lake to ensure proper hydrologic
connectivity. To use the tool, click on the
button. Similar to the Segment Length
tool, this will bring up a dialog box (Figure 7), which will ask for the path and name of
the table in which the flow to field is defined and will be updated.
6
GIS Extension for BATHTUB
Figure 7. Dialog when the Segment Connectivity tool is selected.
Once the table is specified and the OK button is clicked, the cursor will change to a finger
when within the map window. To define segment connectivity, click inside a segment,
which will become highlighted, and then click inside another segment into which the first
segment flows. Figure 8 shows the highlighted segment after the first click. The
connectivity for the segment that flows out of the lake is defined by default.
Figure 8. Segment Connectivity tool with the “from segment” highlighted.
At this point, segment morphometric calculation is completed. Segment morphometric
parameters are saved in the segment morphology table (Figure 5). The next step is to
calculate segment water quality parameters from water samples.
7
GIS Extension for BATHTUB
3.2. Calculating Segment Water Quality Parameters
Tools in this section calculate segment water quality parameters based on water samples
taken within the lake. Water samples may be taken at different locations and depths
within a lake and on different dates. BATHTUB model requires segment water quality
above what is called Mixed Layer Depth (MLD), which reflects a significant vertical
water temperature change in the lake. The Water Sample Processing tool calculates a
MLD for each sampling location and date. The MLDs are then used to calculate the
average water quality at each sample point for all the dates. The segment water quality
tool first averages all the averaged sample water quality inside a segment and then
assigns the average values to the segment.
3.2.1. Water sample processing
The Water Sample Processing menu item (Figure 9) or the button
can be used to
calculate MLD and to average water quality at each sample point for all dates.
Figure 9. Interface with the Segment Water Quality menu item highlighted.
The Water Sample Processing dialog (Figure 10) requires several input tables from users.
The first input table contains water quality information directly measured in the field. An
example table is shown in Figure 11. This table must have several required fields. The
“Station” field holds the unique number for each water sample. The “Date” field holds
the date of sampling. The “Depth” field holds the depth at which the measurement is
8
GIS Extension for BATHTUB
taken. The “Temperatur”, “Turbidity”, and “Secchitran” fields store the temperature,
turbidity, and Sechhi depth measurement, respectively. The Depth and Temperatur fields
are used to calculate MLDs for each sampling point and date. A temperature difference
threshold value is needed to determine significant temperature change while calculating
MLDs. The second table requires an input table of water quality measurements obtained
through the analysis of water samples in laboratory. An example table is shown in Figure
12. This table must have several required fields too. The “Sampleid” field stores the
unique water sample ID. The “Date” and “Depth” fields are the same as the first input
table. The “Ntotal”, “Organicn”, “PO4”, “Ptotal”, “Organicp”, and “Chlorophyll” fields
store total N, organic N, PO4, total P, organic P, and chlorophyll measurement,
respectively. The path and name of the output table, which contains the averaged water
quality for each sample point and date, need to be specified in the dialog.
Figure 10. Dialog used to calculate water quality for each sampling location.
Figure 11. On-site water quality table
9
GIS Extension for BATHTUB
Figure 12. Laboratory water quality table.
3.2.2. Calculating segment water quality
Averaged water quality data has to be associated with segments where sampling points
were located. A sampling point shapefile, which stores the location of each water
sample, is needed. This shapefile’s attribute table must contain the Sid field, which
stores the unique ID number for each water sample. The Calculate Segment Water
Quality tool selects all the points inside a segment, and then averages the water quality
measurements at those points, and assigns the average to the segment. The tool can be
accessed by clicking the Sample Points Within Segments menu item (Figure 13) or the
button
for multiple sampling points in a segment.
Figure 13. Interface with the Calculate Segment Water Quality menu item highlighted.
10
GIS Extension for BATHTUB
After activate the tool, the Calculate Segment Water Quality dialog appears asks for
several user inputs (Figure 14). The processed water sample table, created by the Water
Sample Processing tool, needs to be specified first. The next two inputs (segment and
water sample shapefile) are selected from dropdown list boxes. The output table that
contains segment water quality calculated from the water samples has to be specified.
Figure 15 show an example segment water quality table calculated from water samples.
Figure 14. Dialog with the Calculate Segment Water Quality tool.
Figure 15. Segment water quality table calculated from water samples.
At this point, the calculation of segment parameters required by the BATHTUB model is
accomplished. The next step is to prepare the tributary inputs for the BATHTUB model.
11
GIS Extension for BATHTUB
4. CALCULATING LAKE TRIBUTARY PARAMETERS
Each segment in the BATHTUB model can be connected to one or several tributaries.
Each connected tributary requires several water quality parameters. Tributary water
quality can be either measured in the field or modeled using water quality models such as
AnnAGNPS. This Chapter discusses the tools available in the GeoBathtub extension to
process AnnAGNPS outputs and determine segment-tributary connectivity.
4.1. Obtaining Tributary Water Quality Parameters from AnnAGNPS Output
The Tributary Water Quality from AnnAGNPS tool processes the event output file from
AnnAGNPS (version 2.2). It finds all the reaches and the simulated period in an
AnnAGNPS event output file. A user can select one or several reaches and a time period
to calculate water quality parameters for the selected reaches. To use the tool, select the
Tributary Water Quality menu item (Figure 16) or click the button
.
Figure 16. Interface with Tributary Water Quality from AnnAGNPS menu item highlighted.
The AnnAGNPS Event Output File dialog asks for the AnnAGNPS event output file that
contains all the reaches simulated in the model (Figure 17). The AnnAGNPS event
output file contains header information and is organized by reach ID, as shown in Figure
18.
12
GIS Extension for BATHTUB
Figure 17. AnnAGNPS Event Output File dialog.
Figure 18. AnnAGNPS output file
Once the AnnAGNPS event file is specified, the Tributary Water Quality from
AnnAGNPS dialog box opens up (Figure 19). The list box on the left lists all the reach
IDs found in the AnnAGNPS event file. Users can select one or multiple reaches from
the list. If multiple reaches are desired, simply hold down the Shift key while clicking
the ID numbers. The “From Date” and “’To Date” list boxes on the left provide the
simulated period found in the AnnAGNPS event file. Use the dropdown boxes to select
the target period from which tributary water quality parameters will be derived. The
output table has to be specified too.
13
GIS Extension for BATHTUB
Figure 19. Dialog showing the selection of reaches and simulated period
Because of the large size of the AnnAGNPS event output file, calculating all of the water
quality parameters for the selected reaches from the file may take some time. A progress
bar, which informs how far along the process is, appears at the bottom of the ArcView
platform. Based upon the selected period, the tool scales the water quality parameters to
a yearly basis, which is recommended by the BATHTUB model. All of the water quality
parameters are written to the output table specified in Figure 19. Figure 20 is an example
of the output table.
Figure 20. Output from the Tributary Water Quality from AnnAGNPS tool.
4.2. Creating Reach ID Shapefile
In order to establish the connectivity between reaches and segments, reaches location
must be obtained. Two raster layers (watershed and stream network order) generated by
14
GIS Extension for BATHTUB
AnnAGNPS have to be added into the ArcView project. The Create Reach ID tool will
first generate a raster layer that stores reach IDs in the watershed. The tool re-classifies
the stream network order raster, multiplies the re-classified raster with the watershed
raster, and then divide the multiplication by 10 to obtain reach ID raster. This raster
reach ID is then converted to a shapefile. To use the tool, click on the Tributary
Shapefile ID Calculation menu option (Figure 21) or click the button
.
Figure 21. Interface with Tributary ID Calculation menu item highlighted.
The Create Reach ID Shapefile dialog asks for two raster layers and the path and name of
the reach ID shapefile that will be created (Figure 22). The first dropdown box asks for
the watershed stream order raster layer. The second dropdown box asks for the
watershed raster layer. The textbox at the bottom asks for the path and name of the
output reach ID shapefile. Once the OK button is clicked, the reach ID shapefile is
created and added to the ArcView project, as shown in the red highlight box in Figure 23.
15
GIS Extension for BATHTUB
Figure 22. Dialog with the Create Reach ID Shapefile tool.
Figure 23. The newly created reach ID shapefile highlighted in red.
4.3. Tributary within Segments
The reach ID shapefile is used to establish the linkage between tributaries (reaches in
AnnAGNPS terminology) and segments. The Tributary within Segment tool determines
within which segments the tributaries fall. The tool takes the vectorized reach IDs and
determines which tributaries are contained in the segments. The tool can be accessed by
selecting the Tributary within Segments (Figure 24) or by clicking the button
.
16
GIS Extension for BATHTUB
Figure 24. Interface with Tributary within Segment menu item highlighted.
The Tributary within Segments dialog asks for several inputs (Figure 25). First, the
segment shapefile must be selected from the first dropdown list. Similarly, the newly
created reach ID shapefile should be selected from the list of arc layers in the next
dropdown list. The next input is the AnnAGNPS reach file that contains each reach’s
watershed area. An example of AnnAGNPS reach file is shown in Figure 26. Finally,
the dialog asks for the reach water quality table calculated from AnnAGNPS event output
file in Chapter 4.1.
Figure 25. Tributary within Segments dialog.
17
GIS Extension for BATHTUB
Figure 26. An example of AnnAGNPS reach file.
4.4. Editing Tributary Name and Type
The Edit Tributary Name and Type tool is used to edit tributary name and type. The tool
can be accessed through the Edit Tributary Name and Type menu item (Figure 27) or the
button
. Upon accessing this tool, the tributary water quality table will be needed, as
well as the newly created reach ID shapefile (Figure 28). In the Edit Tributary Name and
Type dialog (Figure 29), users can select a tributary by its ID, enter a new name, and
choose one of the BATHTUB tributary types. Upon selected a tributary ID from the
dropdown list box, the coinciding tributary arc will be highlighted in the ArcView map.
This will assist in naming each of the tributaries.
18
GIS Extension for BATHTUB
Figure 27. Interface with Edit Tributary Name and Type menu item highlighted.
Figure 28. Dialog with tributary water quality input.
Figure 29. The Edit Tributary Name and Type Dialog.
19
GIS Extension for BATHTUB
4.5. Calculating Tributary Baseflow
The tributary water quality parameters calculated from the AnnAGNPS event file are
event runoff. Each tributary also has a base flow associated with it. Although base flow
water quality is typically measured in the field, its flow rate is usually estimated from
simulated tributary event runoff. The Tributary Baseflow tool calculates the base flow
rate based on a user specified event runoff percentage. It also adds a base flow tributary
to the water quality table. To use the tool, select the Tributary Baseflow menu item
(Figure 30) or click on its corresponding button
.
Figure 30. Interface with Tributary Baseflow menu item highlighted.
The Tributary and Baseflow Table dialog will open up (Figure 31). The dialog asks for
the tributary water quality table created in Chapter 4.1 and updated in Chapter 4.3. It also
needs a baseflow table that contains field measured base flow water quality. An example
of the baseflow water quality table is shown in Figure 32. The “Site”, “Organicn”,
“Totaln”, “PO4”, and “Totalp” field in the table stores the name, organic N, total N, PO4,
and total P of the base flow, respectively.
20
GIS Extension for BATHTUB
Figure 31. Dialog with Tributary and Baseflow inputs
Figure 32. Baseflow sample table.
Once the two tables are specified, the Tributary Baseflow dialog (Figure 33) opens up
with two dropdown list boxes and a text box. To calculate the flow rate of baseflow,
select a tributary name from the dropdown list box on the left, and the corresponding
baseflow tributary name from the left, enter the percentage of the reach’s runoff flow rate
that constitutes its baseflow. Click on the Add Baseflow Record button will add the
baseflow tributary to the table.
Figure 33. The Tributary Baseflow dialog.
21
GIS Extension for BATHTUB
4.6. Editing Tributary Table
The Edit Tributary Table tool gives a user the opportunity to edit the values within the
tributary table based on tributary ID and the selected field. This tool can be accessed by
clicking on the Edit Tributary Parameters menu item (Figure 34) or click its
corresponding button,
.
Figure 34. Interface with Edit Tributary Parameters menu item highlighted.
In the Tributary Table dialog (Figure 35), enter the tributary water quality table that has
been created and updated in the previous chapters/sections. Upon clicking OK button,
the Edit Tributary Table dialog will open. This dialog (Figure 36) requires three inputs, a
tributary ID, chosen from the first dropdown list box, a Field in the table to edit, chosen
from the second drop down list box, and a new value for the selected field. This process
can be run multiple times until all necessary changes are made. Clicking on the Done
button will close the dialog.
Figure 35. Tributary Table dialog.
22
GIS Extension for BATHTUB
Figure 36. The Edit Tributary Table dialog.
23
GIS Extension for BATHTUB
5. GENERATING BATHTUB PROJECT FILE
When the calculation of segment and tributary parameters is accomplished, the next step
is to generate the project file for BATHTUB. This step takes the segment morphology
and segment water quality tables created in Chapter 3 and the tributary water quality table
created and updated in Chapter 4 as inputs. It writes an output text file for BATHTUB.
The tool can be accessed by selecting the Create Bathtub Input File menu item (Figure
37) or by clicking its corresponding button
.
Figure 37. Interface with Create Bathtub Input File menu item highlighted.
The Create Bathtub Project File dialog will open and ask for several inputs (Figure 38).
The first two textboxes ask for the segment morphology and segment water quality table.
The third textbox asks for the tributary water quality table. The last one asks for the path
and name of the output BATHTUB project file. The output file will, by default, have the
*.btb extension, as this is the file extension that BATHTUB model accepts.
24
GIS Extension for BATHTUB
Figure 38. Dialog with Create Bathtub Input Text File inputs.
At this point, BATHTUB can be opened and the newly created *.btb file can be read. An
example BATHTUB project file is shown in Figure 39.
Figure 39. An example BATHTUB project file.
25
GIS Extension for BATHTUB
6. VISUALIZING BATHTUB OUTPUTS
After running a project file, the BATHTUB model will create an Excel workbook that
contains several worksheets storing the modeling results for the segments. The last
function that the BATHTUB extension provides is to visualize the profile output from
BATHTUB runs. The Profile worksheet must be saved as a text file before it can be
visualized in ArcView. To access the BATHTUB Visualization tool, select the Bathtub
Visualization menu item (Figure 40) or click on the corresponding button
. The
Bathtub Profile dialog will open up asking for the path and name of the profile output text
file from BATHTUB (Figure 41). The BATHTUB profile output file contains a header,
segment number and name, and simulated segment water quality as shown in Figure 42.
Figure 40. Interface with BATHTUB Visualization menu item highlighted.
Figure 41. The BATHTUB Profile Output.
26
GIS Extension for BATHTUB
Figure 42. BATHTUB profile output text file.
Once the profile output file is specified, the Bathtub Profile Visualization dialog will
open up and ask for the segment shapefile, the BATHTUB profile table to be created, the
output variable type, and the water quality parameters to visualize (Figure 43).
Figure 43. The BATHTUB Profile Visualization dialog.
Once the inputs are specified, a new table is created which holds the segment IDs and the
different variables that were selected. Once the table has been created, it is joined with
27
GIS Extension for BATHTUB
the lake segment shapefile’s attribute table. After joining the two tables, the lake
segment shapefile’s symbology is updated, showing the visualization of the first variable
selected from the Bathtub Profile Visualization dialog, as shown in Figure 44.
Figure 44. Visualization of simulated turbidity in BATHTUB profile output file.
28
GIS Extension for BATHTUB
REFERENCE
Cole, R.W. and E.M. Buchak. 1995. CE-QUAL-W2: A two dimensional, laterally
averaged, hydrodynamic and water quality model. Version 2.0. Instruction Report EL95-1. U.S. Army Engineer Waterways Experiment Station, Vicksburg, Mississippi.
DeNoyelles, F. Jr., M. Jakubauskas, and S. Randtke. 2003. Reservoir management and
renovation: Addressing problems in multipurpose reservoir systems. Kansas Biological
Survey. Lawrence, KS.
Ernst, M.R., W. Frossard, and J.L. Mancini. 1994. Two eutrophication models make the
grade. Water Environment and Technology, November, Pp. 15-16.
Mankin, K. R., S. H. Wang, J.K. Koelliker, D.G. Huggins, and F. deNoyelles, Jr. 2003.
Watershed-lake water quality modeling: verification and application. Journal of Soil and
Water Conservation 58(4): 188-198.
O’Brien, W.J. 1975. Factor limiting primary productivity in turbid Kansas reservoir.
Project Completion Report Number 156. Kansas Water Resources Research Institute,
University of Kansas. Lawrence, Kansas.
U.S. Environmental Protection Agency. 2000. National Water Quality Inventory: 1998
Report to Congress. EPA841-R-00-001. Office of Water. Washington, D.C.
Walker, W.W. Jr. 1996. Simplified procedures for eutrophication assessment and
prediction: user manual. Instructional Report W-96-2 (updated April 1999). U.S. Army
Engineer Waterways Experiment Station. Vicksburg, Mississippi.
29