1
U S E R'S M A N U A L
System Manager Client/Server
Version 3.0
Square D, POWERLOGIC, POWERLINK, MICROLOGIC, LIFEGARD, and
Square D Company. System Manager is a Trademark of Square D Company.
Other names are trademarks or service marks of their respective companies.
are Registered Trademarks of
© 1996 Square D Company, all rights reserved. This bulletin may not be copied in whole or in part, or
transferred to any other media, without the written permission of Square D Company.
Contents
Contents
Chapter 1—Introduction ..................................................................................................................... 1
Register Your Software Now ............................................................................................................ 1
Overview .......................................................................................................................................... 1
Add-On Modules .............................................................................................................................. 2
Notational Conventions .................................................................................................................... 2
Online Help System ......................................................................................................................... 2
About SMS ....................................................................................................................................... 3
Technical Support ............................................................................................................................ 6
What You Should Know Before You Begin ....................................................................................... 6
Start With the SMS-Info.txt File ........................................................................................................ 6
System Requirements ...................................................................................................................... 6
Chapter 2—The SMS Interface ........................................................................................................... 8
Logging on to the System ................................................................................................................ 8
The Online System .......................................................................................................................... 9
The Working System ........................................................................................................................ 9
Parts of a Window ............................................................................................................................ 9
Parts of the Toolbar ........................................................................................................................ 12
Chapter 3—Basic System Setup and Operation ............................................................................ 13
POWERLOGIC Metering Device Models ....................................................................................... 14
Metering Device Feature Comparison ......................................................................................... 14
Input/Output Modules for Series 2000 Circuit Monitors ................................................................. 15
Minimum Setup Requirements ....................................................................................................... 15
Creating a New System ................................................................................................................. 15
Setting Up The PC Interface .......................................................................................................... 16
Adding a New PC Interface ......................................................................................................... 16
SY/LINK Board Setup .................................................................................................................. 18
SY/MAX RS-232 (Serial) Port Setup ........................................................................................... 19
Setting Up Devices and Routes ..................................................................................................... 20
Series 2000 Circuit Monitor Setup ................................................................................................. 24
Series 100/200 Circuit Monitor Setup ............................................................................................ 26
Power Meter Setup ........................................................................................................................ 27
Working with the System ............................................................................................................... 29
Going Online .................................................................................................................................. 29
Going Online with a System ........................................................................................................ 29
Going Online with a Workspace .................................................................................................. 29
Device Status Checks ................................................................................................................. 30
Opening a Working System ......................................................................................................... 30
Changing the Working System .................................................................................................... 31
Closing the Working System ....................................................................................................... 31
Going Offline .................................................................................................................................. 31
Bulletin 3080IM9601
Setting the Sampling Mode ............................................................................................................ 31
Scheduled Update ....................................................................................................................... 32
Manual Update ............................................................................................................................ 32
Chapter 4—Displaying Real-Time Data ........................................................................................... 34
Data Update Rate .......................................................................................................................... 34
Displaying a Table .......................................................................................................................... 35
Displaying a Bar Chart ................................................................................................................... 37
Operating Range Indication ........................................................................................................... 39
Displaying a Meter ......................................................................................................................... 40
Operating Range Indication ........................................................................................................... 41
Displaying a List of Active Functions .......................................................................................... 43
Chapter 5—Advanced On-Board Setup for Series 2000 Circuit Monitors ................................... 44
Setting Up Input/Output Modules ................................................................................................... 45
Setting Up Relay Outputs ............................................................................................................ 45
Setting Up Analog Inputs ............................................................................................................. 48
Setting Up Analog Outputs .......................................................................................................... 51
Setting Up On-Board Data Storage ............................................................................................... 54
Circuit Monitor Storage Considerations ....................................................................................... 54
Setting Up the Circuit Monitor On-Board Event Log .................................................................... 56
Setting Up the Circuit Monitor On-Board Waveform Capture Logs ............................................. 56
Setting Up the Circuit Monitor On-Board Data Logs ................................................................... 57
Organizing Data Log Files ........................................................................................................... 59
The Default Logging Template .................................................................................................... 59
Setting Up On-Board Alarms/Events .............................................................................................. 60
Assigning a PC Action ................................................................................................................. 64
Changing the Onboard Alarm Check Interval .............................................................................. 64
Chapter 6—Setting Up Functions and Alarms ............................................................................... 65
What are Alarms? .......................................................................................................................... 65
The General Alarm Setup Procedure ............................................................................................. 66
Understanding Global Functions .................................................................................................... 67
Creating Global Functions ............................................................................................................. 68
Defining Setpoints for Analog Functions ..................................................................................... 69
Defining Setpoints for Digital Functions ...................................................................................... 74
Setting Up Alarm Severity Levels ................................................................................................ 76
Assigning Functions to Specific Devices ....................................................................................... 77
Editing a Function After You’ve Assigned It to a Device .............................................................. 77
Chapter 7—Using Tasks to Automate Processes .......................................................................... 79
Creating New Tasks ....................................................................................................................... 79
Creating a New Mail Task ............................................................................................................ 80
Creating a New Program Task .................................................................................................... 81
Creating a New Resets Task ....................................................................................................... 82
Contents
Creating a New CM2000 Onboard Data Log/Waveform Upload Task ........................................ 83
Scheduling Tasks ........................................................................................................................... 84
Creating a New Reference Time ................................................................................................. 84
Assigning Tasks to a Reference Time ......................................................................................... 85
Changing and Deleting a Reference Time .................................................................................. 86
Setting the PC’s Clock ................................................................................................................. 86
Chapter 8—Viewing Alarms and Events ......................................................................................... 87
Viewing and Acknowledging Active Alarms .................................................................................... 87
Using Operator Assistance Procedures During an Alarm ............................................................ 88
Remote Acknowledgment .............................................................................................................. 88
Silencing Alarms ............................................................................................................................ 88
Viewing the Alarm Log ................................................................................................................... 88
Purging the Alarm Log ................................................................................................................... 89
Viewing the Event Log ................................................................................................................... 89
Purging the Event Log ................................................................................................................... 90
Chapter 9—Data Logging ................................................................................................................. 91
Circuit Monitor On-Board Data Log Files ....................................................................................... 91
Setting Up Data Logging ................................................................................................................ 92
Creating Log Templates .............................................................................................................. 93
Assigning Log Templates to Specific Devices ............................................................................. 94
Chapter 10—Displaying Historical Data .......................................................................................... 96
Defining a New Query or Table ...................................................................................................... 97
Displaying a History Table or Time Trend Plot ............................................................................... 98
Chapter 11—Resetting Device Data ................................................................................................ 99
Chapter 12—Working with Waveforms ...................................................................................... 101
Acquiring a New Waveform ......................................................................................................... 101
Toolbar Buttons ............................................................................................................................ 103
Copying the Waveform Plot or Data Block to Other Windows Programs .................................... 103
Displaying a 4-Cycle Waveform Data Block ................................................................................ 103
Exporting the Waveform File to Disk ............................................................................................ 105
Retrieving a Stored Waveform File .............................................................................................. 106
Retrieving an On-Board Waveform File ..................................................................................... 107
Importing a Stored Waveform File (Import Option).................................................................... 107
Retrieving a Stored Waveform File (File Option) ....................................................................... 108
Chapter 13—Control Outputs ........................................................................................................ 110
Example Applications and Definitions of Terms ........................................................................... 110
Override Control Output example: ............................................................................................... 110
More About the Series 2000 Circuit Monitors ............................................................................... 111
Control Outputs Setup Flow Chart ............................................................................................... 112
Before Setting Up Manual Control Outputs .................................................................................. 113
Bulletin 3080IM9601
Before Setting Up Override Control Outputs ................................................................................ 113
Setting Up Control Outputs .......................................................................................................... 115
Associating an Input with a Control Output .................................................................................. 117
Executing Manual Control Outputs .............................................................................................. 120
Executing an Override Control Output ......................................................................................... 121
Chapter 14—Reports ...................................................................................................................... 123
Creating a Report and Scheduling It for Automatic Printing ......................................................... 123
Manually Printing a Report ........................................................................................................... 125
Chapter 15—Getting Data To and From Other Places ................................................................. 126
Copying Waveforms Using the Clipboard .................................................................................... 126
Printing ......................................................................................................................................... 126
Saving Data from Tables and Trend Plots to a File ...................................................................... 127
Chapter 16—Customizing the Software ........................................................................................ 128
Setting Up Groups ....................................................................................................................... 128
Saving a Workspace .................................................................................................................... 129
Creating Custom Tables ............................................................................................................... 130
Defining Custom Quantities ......................................................................................................... 131
Chapter 17—Diagnostics ................................................................................................................ 136
Performing a System Communications Test ................................................................................ 136
System Device Status .................................................................................................................. 136
Correcting Mismatches in Device Setup Data ............................................................................. 137
Reestablishing Communication with Devices .............................................................................. 138
Placing Devices In and Out of Service ......................................................................................... 139
Reading and Writing Registers .................................................................................................... 140
Displaying Circuit Monitor Onboard Data ..................................................................................... 141
Seeing Who’s Connected to the Server ....................................................................................... 142
Chapter 18—Using Dynamic Data Exchange (DDE) .................................................................... 143
SMS Serving Data to Microsoft Excel (SMS as a DDE Server) ................................................... 143
Changing the DDE Update Interval ........................................................................................... 145
Appendix A—Viewing and Printing System Information ............................................................. 146
Appendix B—Abbreviations for Quantities .................................................................................. 147
Appendix C—Entering Pickup and Dropout Setpoints and Delays for
Series 2000 Circuit Monitor On-Board Alarms ............................................................................. 165
Appendix D—Control Output Examples ....................................................................................... 174
Appendix E—SMS Client Command Line Parameters ................................................................ 182
Appendix F—Error Codes .............................................................................................................. 184
Chapter 1—Introduction
Chapter 1—Introduction
Register Your Software Now
Included in your installation package is a registration card for POWERLOGIC® and
POWERLINK® products.. Complete the information on this card and send it in today.
Registering your software provides you with the following benefits:
• notice of software product upgrades
• 6 months free technical phone support (See Technical Support in this chapter)
• information on POWERLOGIC products
• information on POWERLOGIC training schools
• free subscription to POWERLOGIC Solutions newsletter
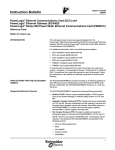
Overview
Circuit Monitor
Power Meter
MICROLOGIC Circuit Breaker
Model 85 Trnsfrmr Temp Cntrl
SY/MAX PLC
Digitrip 810D Trip Unit
Digital Relay
POWERLINK AS Panelboard
POWERLOGIC Compatible
X
X
X
X
X
X
X
X
X
X
X
X
X
X
X
X
X
X
X
X
X
X
X
X
X
X
X
X
X
X
X
X
X
X
X
Manual Control
Alarming
Logging/Trending
Waveform Cap.
Resets
Setup
Device
Table Display
System Manager Software 3000 (SMS-3000) is compatible with existing circuit monitors,
power meters, product interfaces for MICROLOGIC circuit breakers, LIFEGARD
Model-85 transformer temperature controllers, and SY/MAX programmable logic
controllers (PLCs). The following table lists the features that SMS supports, by device:
X
X
X
X
X
The two SMS-3000 instruction bulletins (SMS-3000 System User’s Guide and
SMS-3000 System Administrator’s Guide) provide all of the information you will need
to operate SMS-3000. You can read them in their entirety, or use them for reference.
To locate information on a specific topic, see the table of contents or the index of
each bulletin. The System Administrator's Guide tells how to install the software. It also
describes other administrative tasks including working with the SMS database and
setting up user accounts. The SMS User’s Manual describes the tasks involved with
using the software on a daily basis. It does not include installation instructions.
© 1996 Square D All Rights Reserved
1
Bulletin 3080IM9601
Add-On Modules
You can expand the functionality of SMS-3000 by using add-on modules.
POWERLOGIC currently offers two add-on modules that enhance the capabilities of
SMS-3000. They are:
• Interactive Graphics Client (GFX-1000)
• Additional SMS Client software packages (SMS-1000)
This bulletin does not provide detailed instructions for using these packages with
SMS-3000. For instructions on using the add-on modules, see to the instruction bulletins
included with the modules.
Notational Conventions
This bulletin uses the following notational conventions:
• Bullets—Bulleted lists, like this one, provide information but not procedural steps.
• Multiple Step Procedures—Each procedure is presented as a numbered list of steps.
• Angle brackets (>)—Angle brackets are used to denote a sub-menu for a command
in a pull-down menu. For example, in the Setup menu, under the “Administrative”
command, there is a sub-menu that contains the “User Accounts…” command. This is
written as “Administrative > User Accounts.”
• SMS/SMS-3000—This version of the System Manager Software is named SMS-3000.
However, throughout this bulletin, we’ll refer to the software as SMS.
Online Help System
SMS provides an online help system to aid you in using the program. To view an index
of help topics, click F1 or click Help > SMS 3000 Help on the SMS main menu. The Help
Topics window displays. You can access help information through three tabs:
• The Contents tab lists information in “books.” These books are listed in logical
sequence (for example, “Getting Started,” “Setting Up Your System,” and “Going
Online with your System.” Each book contains chapters that break down the information into the procedures.
• The Index tab lists topics in alphabetic order. Double-click the topic you want to view.
• The Find tab uses “key words” to search for information. The Find option uses a
Windows database that includes all key words in the help system.
2
© 1996 Square D All Rights Reserved
Chapter 1—Introduction
About SMS
SMS-3000 is a client/server PC-based software package that provides real-time circuit
information from POWERLOGIC Circuit Monitors, MICROLOGIC circuit breakers,
Model-85 transformer temperature controllers, and other compatible devices. SMS
provides comprehensive information at a single computer or at multiple personal
computers.
Something for Everyone
SMS provides useful information to anyone involved with the efficiency, reliability, cost,
or operation of an electrical distribution system. Plant engineers, maintenance personnel, machine operators, and many others can benefit from this powerful, easy-to-use
software without extensive software training. Whether your goal is to minimize energy
usage, avoid peak demand levels, analyze equipment loading, or simply keep your
electrical system up and running, SMS provides the information you need in the format
you want.
The Flexibility of Microsoft Windows
SMS takes full advantage of the powerful graphical environment of the Microsoft
Windows multi-tasking environment. Commands are entered by simple point-and-click
operations or keyboard entry.
Since the SMS software package is specifically designed as a Microsoft Windows multitasking environment, it can run concurrently with spreadsheet, database, word processing, or other Windows applications. This allows the program to log data, check for alarm
conditions, and more while you work in another application. If system conditions
should go outside user-defined operating limits, SMS notifies the operator so action can
be taken.
The powerful networking ability of Microsoft Windows lets you perform multi-tasked
procedures with speed and accuracy. Using NT, SMS can access power information and
distribute it wherever it is needed. Clients are not limited to a single machine: clients can
reside with the server or any other PC within your LAN. The Microsoft Remote Access
Services makes it much easier for you to access the system from any remote location.
© 1996 Square D All Rights Reserved
3
Bulletin 3080IM9601
Variety of Display Formats
SMS provides a wide variety of display formats. These include:
• instantaneous data tables
• function tables
• historical data tables
• bar charts
• analog meters
• time trend plots
• waveform plots
• custom tables
• event history/alarm history
• active alarms
• interactive diagrams
(requires Interactive Graphics Client—GFX-1000 add-on module)
Data Logging
SMS can log historical data to a computer hard disk. To allow complete flexibility, you
define the time interval between log samples. You can view logged data in a history
table or as a time trend plot.
CM-2000 onboard data can be auto-uploaded. SMS offers predefined log templates. You
can also define your own log templates with their own quantities and intervals.
Report Generation
SMS allows you to generate reports for a variety of information, and to print the
reports at regular intervals. SMS offers the additional flexibility to customize
reports as necessary.
Alarms
SMS allows you to define alarms based on an analog quantity (such as current, voltage,
or power factor), or on a digital quantity (such as a status input or relay output). Alarms
may be assigned one of ten severity levels and any of three types of indication —
audible, visual, and/or required acknowledgment. When alarms occur, SMS notifies you
immediately and logs the occurrence in the Alarm Log. An alarm window allows you to
view a summary of active alarms at any time. You have the additional option of performing an e-mail or launching a programmed task (such as sending a message to a
specific system user when an alarm occurs). SMS integrates and automatically uploads
onboard event logs from Series 2000 Circuit Monitors into one central alarm log.
4
© 1996 Square D All Rights Reserved
Chapter 1—Introduction
Event Logging of System Information
The Event Log file is constantly updated and can be viewed, printed, or cleared at any
time, from anywhere on the network or from remote access. The log includes operator
activities such as changing setup, resets, and placing the system online or offline. The
number of events recorded is limited only by disk space.
Remote Control
SMS allows manual control of circuit monitor relay outputs and other SY/MAX compatible devices. Using this feature, you can apply and operate control options using SMS.
Password entry is required to perform control operations. You must configure circuit
monitor relay outputs at the circuit monitor
Share Data with Other Applications
SMS provides a powerful export feature that lets you export data in a variety of file
formats. You can then import these data files into the appropriate application for additional analysis. Included in SMS is the Dynamic Data Exchange (DDE) module, which
enables SMS to dynamically export data to other Windows applications.
Network Communications
SMS can use a variety of backbone network options. These include Square D’s
SY/NET network, TCP/IP-based networks, or combinations as applications require.
The SY/NET network offers a variety of communication options including local and
remote access, multi-user access, and speeds up to 500 kbaud. It supports virtually
limitless connections of power monitoring and control devices and is designed for
industrial applications.
For Ethernet-TCP/IP networks, POWERLOGIC Ethernet Gateways provide the best
networking performance and allow use of existing TCP/IP networking technologies,
including the Internet. When used with Ethernet-TCP/IP networks, SMS can be used in
a client/server arrangement to provide users (clients) real-time and historical information as needed.
© 1996 Square D All Rights Reserved
5
Bulletin 3080IM9601
Technical Support
When you register your software, you are entitled to 6 months of free technical phone
support. If you have any questions about this instruction bulletin, or other
POWERLOGIC products, contact the POWERLOGIC Technical Support Center.
Hours are Monday—Friday, 7:30 AM–4:30 PM (CST). The fax number is available seven
days a week, 24 hours a day.
Phone: (615) 287-3400
Fax: (615) 287–3404
Before you call, have the product serial number ready. The serial number is located on
the label of your original program diskettes.
What You Should Know Before You Begin
This manual assumes that you:
• know how to use Microsoft Windows NT
• are familiar with Windows terminology
• know how to use a mouse and are familiar with mouse terminology, such as “pointing” and “clicking”
• have already successfully installed SMS (see the SMS-3000 System Administrator’s
Guide, chapter 4)
If you need help using Windows or a mouse, refer to the Microsoft Windows
documentation.
Start With the SMS-Info.txt File
Read the SMS-INFO.TXT file included on the program diskette before you install System
Manager. You can open this file using any program capable of reading a standard ASCII
text file, such as the Notepad program included with Windows. This file contains
important installation tips.
System Requirements
The following table lists the minimum system requirements. Specifications in brackets
“[]” are recommended for superior performance. The hard disk requirements for
Windows, a swap file, the software, and logging memory should also be considered
when choosing a computer.
6
© 1996 Square D All Rights Reserved
Chapter 1—Introduction
Minimum System Requirements
Operating System
Display Mode
Model
RAM
Hard Disk
Program Size
SY/LINK Card
RS-232 Port
Network Card
Modem
Sound Card
3.5" Drive
CD Drive
Windows NT/95
SMS-3000
SMS-1000
PMX-1500
PMX-1000
SMS-1500
GFX-1000
SMS-121➀
Windows NT
Windows NT
Windows 95
VGA
VGA
(recommend Super VGA) (recommend Super VGA)
486/66
Pentium
(recommend Pentium)
32M
32M
500M➁
500M ➁
15M
8M
optional
➂
➂
➂
14.4 or 28.8 (optional)
optional
optional
➂
➂
recommended
recommended
➀ System Manager One-To-One (SMS-121) uses the serial port to
communicate, so the SY/LINK requirements listed in the table do not apply.
➁ The amount of memory on the hard disk depends on whether logging data
is stored on the same computer.
➂ Required
Where to Next?
For
See Chapter
Program Installation
System Administrator’s Guide
Basic System and Device Setup
3
Setting Up CM-2000 Onboard Functions
5
Setting Up Functions and Alarms
6
Resetting Device Data
11
Displaying On-Board Log Files
17
Creating and Executing Control Outputs
13
Displaying Waveforms
12
Displaying Real-Time Data (meters, bar charts, tables)
4
Displaying Historical Data (history tables, trend plots)
10
Using Tasks to Automate Processes
7
Viewing Alarms and Events
8
Setting up Data Logging (devices without onboard memory)
9
Creating and Printing Reports
14
Performing Diagnostics
17
Customizing Software
16
Using Dynamic Data Exchange
18
© 1996 Square D All Rights Reserved
7
Bulletin 3080IM9601
Chapter 2—The SMS Interface
Logging on to the System
Before you can log on to SMS, you must first start the server and client. If you are not
sure how to do this, see SMS-3000 Startup in chapter 4 of the SMS-3000 System
Administrator’s Guide.
If SMS has lost communication with a device, or if device setup information has been
changed so it does not match the SMS setup information, the System Device Status
dialog box displays. The procedures for bringing devices and SMS back into communication are covered in Chapter 17—Diagnostics.
SMS displays the SMS client main window:
Control Box
Sizing
Boxes
Sampling
Mode Line
Title Bar
Menu Bar
Dockable
Toolbar
Minimized
Windows
System
Information Line
Online
System
8
Working
System
© 1996 Square D All Rights Reserved
LED
indicators
Chapter 2—The SMS Interface
The Online System
If this computer has been logged on before, and there was an online system when SMS
was last closed, that system will still be online. The ONLINE field at the bottom of the
window displays the system name.
If this is the first time this computer has logged onto SMS, or if there was no online
system the previous time, this field reads No online system. Going online and offline is
discussed in Chapter 3—Basic System Setup and Operation.
The Working System
The working system, sometimes called the edit system, is the system that is open for
editing (changing device configurations, defining functions, etc.). SMS can be online to
one system while you are editing another system. You need to open a working system
only when you want to change device or system setup information.
The working system name displays to the right of the online system, at the bottom of
the screen. When you first log on, there will be no working system. The procedure
for opening a working system is covered in Chapter 3—Basic System Setup
and Operation.
Parts of a Window
SMS is completely interactive, using descriptive menus for all program functions. The
program takes full advantage of the powerful graphics-oriented Microsoft Windows
interface.
The SMS main window is shown on the previous page. A description of the main
window follows.
Control Box. The Control Box has seven commands which involve resizing, moving,
closing, and switching to other Windows applications.
Menu Bar. The Menu Bar displays all of the pull-down menus available in an application. Each menu item can be accessed either by clicking on a menu item name or by
holding the ALT key down and then pressing the key that corresponds to the underlined
letter in the menu item name. Once the menu is open, choose a command either by
clicking the command name or by pressing the key that corresponds to the underlined
letter in the name.
© 1996 Square D All Rights Reserved
9
Bulletin 3080IM9601
Parts of a Window (cont.)
Title Bar. The Title Bar displays the name of the application or window. You can display
more than one window at a time, but only one of them can be active. To avoid confusion, the title bar of the active window is a different color than the rest of the windows
on the screen. To activate a window, you can do one of two things:
• click the window to bring it to the front
• from the Window menu, click the name of the window to be displayed
Sizing Boxes. Click these boxes to minimize/maximize the active window, or to close
the window.
Toolbar. The toolbar includes two parts, the toolbar icons and the sampling mode line.
Each of these parts is “dockable,” meaning the user can click on it and move it to
various positions on the screen (for example, along the left side).
• The Toolbar Icons allow you to access commands more quickly by simply clicking on
an icon. The icons correspond to commands in the pull down menus. For a description of each icon and its use, see Parts of the Toolbar later in this chapter.
• Use the Sampling Mode Line to set the rate at which SMS updates and displays new
real-time data (such as meter displays). .
List Box. A list box displays a list of selections. You can choose one item in the list.
To use, click the arrow button (the list drops down), then click an item from the list to
select it.
List. A list displays the available selections. You can usually select more than one item
from a list.
• Tree Structure Lists. Many lists in SMS (for example, lists of groups with their
devices), are compressed when first viewed: you can see only the first level. To
expand the tree structure, click the “+” beside first level entry; the “+” changes
to a “–” and the second level entries display. To close the tree, click the “–.”
• Add and Delete Buttons. Many dialog boxes allow you to add or delete information
from lists. To add or delete a single item, click the item name, then click “>” to add
or “<” to delete. To add or delete the entire list, click “ >>” to add all or “<<” to
delete all.
• Drag-and-Drop. Another way to move or copy an item from one list to another. To
use this feature, click an item in the list; still holding the mouse button, drag the item
to the other list. Let go of the mouse button to complete the move.
Edit Box. In an edit box, you type your own value (unlike the list, from which you must
select a predetermined value). To enter a value in an edit box, click the box, then type
the value.
10
© 1996 Square D All Rights Reserved
Chapter 2—The SMS Interface
Minimized Windows. Use minimized windows to display the SMS logs (such as the
Event Log) that have been reduced or minimized. To restore the log to its original size,
click the middle sizing box of the corresponding minimized window.
System Information Line. The System Information Line indicates several things:
• When you pull down a menu and move the pointer over a command, SMS displays
text that describes the command.
• The online system displays in the middle of the line. This is the SMS system for which
you are currently displaying data.
• The working system (the system for which system setup data can be entered) displays
to the right of the online system. You need to open a working system only when you
want to make setup changes to that system.
Option Buttons. Click option buttons to make selections within dialog boxes. Only one
option button for each choice can be selected at a time.
Check Box. Click the check boxes to make multiple selections in a dialog box. Unlike
option buttons, you can select as many check boxes as you like in each dialog box.
Named Push Buttons. Push buttons are used to confirm, cancel, or perform other
functions in dialog boxes. In many cases, clicking a push button will cause you to exit
the dialog box containing that push button. Each push button is referred to by its name
only. For instance, the instructions will say “Click Add,” not “Click the Add button.”
LED Indicators. The LED Indicators are two colored “lights” that alert you to the status
of communications activity. The left-hand light flashes to indicate the health of the
POWERLOGIC network server communication; when flashing, the client is communicating with the server. The right-hand light flashes to indicate that the alarm/event
manager is communicating.
© 1996 Square D All Rights Reserved
11
Bulletin 3080IM9601
Parts of the Toolbar
To access commands quickly, click on a toolbar icon. Each icon corresponds to
a command in the menus. The toolbar is shown on the first page of this chapter. A
description of each icon follows.
Note: When SMS is offline, most of the toolbar icons are grayed out (disabled). To activate the
icons, go online using the “Online” command in the File menu. The Diagrams icon is only active
when you have installed the Interactive Graphics add-on module.
Icon
12
Name
Function
Print
Prints the window that is currently
displayed.
Scheduled Update
Toggles from “Scheduled Update” to “Manual Update”
sampling mode.
Take Sample
Takes a single data sample when in “Manual Update”
mode.
Silence All Alarms
Silences all active audible alarms until the next
alarm occurs.
Open Workspace
Opens the “Workspace” dialog box to open a
previously defined workspace.
Display Tables
Opens the “Tables” dialog box to display
real-time tables.
Display Bar Charts
Opens the “Bar Charts” dialog box to display real-time
bar charts.
Display Meters
Opens the “Meters” dialog box to display real-time
meter panels.
Function Tables
Opens the “Function Tables” dialog box to display the
status/condition of digital and analog functions.
Display Waveform Plots
Opens the “Waveform Plots” dialog box to display system
voltage and current waveforms.
Historical Data
Opens the “History Tables” and “Time Trend Plots” dialog
box to display history tables and time trend plots from the
history log file.
Display Diagrams
Opens the “Diagrams” dialog box to display diagrams
created with POWERLOGIC Interactive Graphics software.
Help
Invokes context-sensitive help with how-to and
example screens.
© 1996 Square D All Rights Reserved
Chapter 3—Basic System Setup and Operation
Chapter 3—Basic System Setup and Operation
SMS supports and communicates with several types of devices. (See chapter 1 for an
overview of device support.)
• Circuit Monitors. Series 100/200 and Series 2000. See circuit monitor instruction
bulletin you received with your equipment for the features and capabilities of your
circuit monitor(s).
• POWERLOGIC Power Meter. Compact meter for basic industrial power monitoring.
See power meter instruction bulletin for features and capabilities.
• POWERLOGIC Digital Relay. Three-phase and ground overcurrent protection for
application on medium voltage circuit breakers.
• POWERLOGIC Trip Unit for low voltage power circuit breakers (Digitrip RMS810D).
• MICROLOGIC Circuit Breakers. Square D molded case circuit breakers with the
MICROLOGIC full-function trip system and the “PIF-3” product interface to
POWERLOGIC.
• Model 85 Transformer Temperature Controller. Life-Gard Model 85A Transformer
Temperature Controller with “PIF-85” product interface to POWERLOGIC; for
Square D PowerCast or conventional dry-type power transformers.
• POWERLINK AS Remote Power Switching System. Lighting control for Square D
NQOD or NEHB panelboards.
• POWERLOGIC Compatible Devices. Other devices used with custom quantities
to create a custom device type. This device type allows you to communicate with
devices that are compatible with POWERLOGIC devices (the quantities for
monitoring the device must be manually defined):
— SY/MAX programmable logic controller (PLC) or SY/MAX
compatible device
— other third party devices with compatible protocol
© 1996 Square D All Rights Reserved
13
Bulletin 3080IM9601
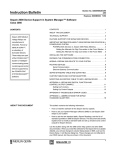
POWERLOGIC Metering Device Models
POWERLOGIC metering device models contain some or all of the features shown in the
table below. The device model determines which features are active in SMS.
It is important to know which features your device model supports as you use SMS,
especially when setting up a Series 2000 circuit monitor. Refer to this table to identify
which features apply to your system.
Metering Device Feature Comparison
Series 100
Series 200
Feature
Series 2000
Power Meter
CM100 CM108 CM144 CM150 CM200 CM208 CM244 CM250 CM2050 CM2150 CM2250 CM2350 CM2450 PM600
Full Instrumentation
X
X
X
X
X
X
X
X
X
X
X
X
X
X
Front Panel LED Display
X
X
X
X
X
X
X
@
RS-485 Comm Port
X
X
X
X
X
X
X
X
X
X
X
X
X
X
Front Pnl Optical Comm Port
X
X
X
X
X
X
1% Accuracy Class
X
X
X
X
X
X
X
X
X
0.2% Accuracy Class
X
X
X
X
0.3% Accuracy Class
X
Status Inputs
8
4
8
4
#
#
#
#
#
Relay Outputs
4
4
#
#
#
#
#
Analog Inputs
#
#
#
#
#
Analog Outputs
#
#
#
#
#
On-board Relay Functions
X
X
X
X
On-board Data Logging
X
X
X
X
Downloadable Firmware
X
X
X
X
X
Date/Time for each Min/Max
X
X
X
X
4-Cycle Waveform Capture
X
X
X
X
X
X
X
Extended Waveform Capture
X
X
Extended Memory
X
X
Sag/Swell Detection
X
X
CM Programming Language
X
PM620
X
@
X
X
X
@ Optional
# Hardware Input/Output Module required. Refer to Input/Output Modules for Series 2000 Circuit Monitors on the next
page for more information on I/O Modules.
14
© 1996 Square D All Rights Reserved
Chapter 3—Basic System Setup and Operation
Input/Output Modules for Series 2000 Circuit Monitors
The following table presents the various Class 3020 input/output modules available for
Series 2000 Circuit Monitors.
Class 3020 Input/Output Modules
Type
IOM-11
IOM-18
IOM-44
IOM-4411-01
IOM-4411-20
IOM-4444-01
IOM-4444-20
Description
1 status IN, 1 KYZ pulse OUT
8 status IN, 1 KYZ pulse OUT
4 status IN, 1 KYZ pulse OUT, 3 Form-C relay OUT
4 status IN, 1 KYZ pulse OUT, 3 Form-C relay OUT, 1 Analog IN➀, 1 Analog OUT (0–1 mA)
4 status IN, 1 KYZ pulse OUT, 3 Form-C relay OUT, 1 Analog IN➀, 1 Analog OUT (4–20 mA)
4 status IN, 1 KYZ pulse OUT, 3 Form-C relay OUT, 4 Analog IN➀, 4 Analog OUT (0–1 mA)
4 status IN, 1 KYZ pulse OUT, 3 Form-C relay OUT, 4 Analog IN➀, 4 Analog OUT (4–20 mA)
➀ Analog inputs are 0–5 Vdc. Each analog input can be independently configured to accept a 4–20 mA input by
connecting an external jumper wire.
Minimum Setup Requirements
There are several setup procedures that must be completed before SMS can communicate to devices. Each of these procedures establishes important file information that SMS
uses to process data. The setup procedures are:
• Creating a new system
• User account setup
• PC interface setup
• Device and route setup
The remainder of this section discusses each of these setup procedures in detail. Also
included in this section are instructions for going online and offline, and setting the
sampling mode (the interval at which SMS takes data samples for such things as realtime tables and meters).
Creating a New System
Creating a new system means you create a logical name for the collection of devices that
you will be defining. Before you can use a system, you must first fill it with system
configuration information, such as PC interface (SY/LINK or serial), device routes, and
device configuration information.
For flexibility, you may choose to have multiple systems. Data from all systems is stored
in the SMS-3000 database, though each system will have its own device data. All systems share the same user account setup.
© 1996 Square D All Rights Reserved
15
Bulletin 3080IM9601
Creating a New System (cont.)
Follow these steps to create a new system file.
1. On the SMS main menu, click File > New > System.
The New System dialog box displays:
2. Type a unique System Name (50 alphanumeric characters).
3. Click OK.
The system name is added. Note that this new system becomes the working system. The
system name is displayed at the bottom right of the screen after the word EDIT.
At this point, you might want to add new user accounts. The administrator account was
added when SMS was installed, but a unique account should be created for each person
who will use the system. For help setting up new user accounts, see chapter 5 of the
SMS-3000 System Administrator’s Guide.
Setting Up The PC Interface
Your computer’s communications interface to POWERLOGIC devices can be either a
SY/LINK Network Interface Board or one of the serial ports on your machine. The
SY/LINK board requires that your computer have an “AT” bus structure and a spare
long expansion slot.
Adding a New PC Interface
Before you can establish a PC interface, you must take the system offline. The first
step in establishing a new PC interface is adding the interface, defining the name and
interface type (SY/LINK or RS-232).
16
© 1996 Square D All Rights Reserved
Chapter 3—Basic System Setup and Operation
Follow these steps to add the PC interface:
1. On the SMS main menu, click Setup > PC Interface… .
The Setup Comm Server Interface dialog box displays:
2. Click Add to display the New Communications Port dialog box:
3. Type a unique name for the communication connection, up to 31 characters, such as
SY/LINK CARD. This name will be assigned to this SY/LINK card when it is referenced in later system operations.
4. Select an interface type from the Protocol pulldown box:
•DDE Requestor to set up communication between SMS and the Dynamic Data
Exchange (DDE) application
•SY/LINK Driver to set up communication for a SY/LINK card
•SY/MAX RS-232 Driver to set up serial communication
You can have multiple SY/LINK cards in a computer, but you must follow the
complete setup procedure for each card.
5. Click Continue to proceed with setup. For each type of setup—DDE Requestor,
SY/LINK Board, or SY/MAX RS-232—see the appropriate section in the
following paragraphs.
© 1996 Square D All Rights Reserved
17
Bulletin 3080IM9601
SY/LINK Board Setup
If you chose the SY/LINK driver protocol in step 4 of the procedure on the previous
page, SMS displays the PC Interface - SY/LINK Cards dialog box:
To set up the SY/LINK board, enter the appropriate information in each step below.
1. The PC Interface Connection Name displays the default name entered on the
previous dialog box.
2. Memory Address. This is the SY/LINK memory address. This value tells SMS which
memory address range the SY/LINK board will use. The memory address range is set
by a group of DIP switches located on the SY/LINK board. The address that appears
in this dialog box was entered during SMS-3000 installation. It must match the
SY/LINK board’s DIP switch setting. The SY/LINK board’s default switch setting is
CA00. Unless you changed the DIP switches on the SY/LINK board and during
installation, CA00 displays here.
3. Network Baud Rate. This sets the baud rate of the SY/LINK board’s network port.
This value must match the baud rate of all other network devices (NIMs, PNIMs, and
SY/LINK boards) on the network.
4. RS-422 Baud Rate. This sets the baud rate of the SY/LINK board’s RS-422 port. This
value must match the baud rate of the device connected to the SY/LINK board’s
RS-422 port. For example, if the device connected to the RS-422 port is set to 9600
baud, then choose 9600 here.
5. Network Address. This sets the network address of the SY/LINK board. If the
“Network Size” (described in step 6) is 100, then this value must be an integer from
0–99. If the “Network Size” is 31, then this value must be an integer from 0–30. Each
network device on a common network must be assigned a unique network address.
For example, a SY/LINK board cannot have the same address as a PNIM on the
same network.
18
© 1996 Square D All Rights Reserved
Chapter 3—Basic System Setup and Operation
6. Network Size. This number indicates the maximum number of network interfaces
(SY/LINK boards and NIMs) on a single network. If the network contains 31 or
fewer network interfaces, select 31. If the network contains more than 31 network
interfaces, select 100. This number must match the DIP switch settings on all PNIMs
to enable communication.
7. Click Test Port.
If the test fails, examine the Memory Address box to verify that you have selected the
correct SY/LINK memory address. The address selected in the Memory Address list
box must match the SY/LINK board’s DIP switch setting. If the test still fails, open
your computer and check the DIP switch setting on the SY/LINK board. If the setting
is correct, either the SY/LINK board is bad, or the PC has already allocated memory
in this location or another device is using the location.
If no address appears in the Memory Address box, start the Smscfg program located
in the /SMS-3000/BIN directory, then click the SY/LINK tab and enter the memory
address that matches the SY/LINK board’s DIP switch setting. Restart the PC to cause
the changes to take effect.
8. When you have updated all items, and the memory address test has passed, click OK
to return to the Setup Comm Server Interface dialog box. Click Close to return to the
SMS main window.
9. Repeat the steps for any additional SY/LINK card(s) or click Close to return to the
SMS main window.
To add SY/LINK cards, you must use the Smscfg utility. Remember to restart the PC.
SY/MAX RS-232 (Serial) Port Setup
After selecting SY/MAX RS-232 Driver in step 4 and completing step 5 in Adding a New
PC Interface, SMS displays the PC Interface - SY/MAX - RS232 dialog box:
To set up serial communications, complete the following steps:
1. Parity. Click Even or None to match the parity of the devices to which you
are connecting.
2. Serial Port. Click the port to which the cable is attached.
© 1996 Square D All Rights Reserved
19
Bulletin 3080IM9601
SY/MAX RS-232 (Serial) Port Setup (cont.)
3. Baud Rate. Click the baud rate that the serial port will use. This value must match the
baud rate of all other devices on the network.
4. PC Connected to NIM/PNIM. If the PC is connected to a NIM or PNIM, check this box.
5. Timeout. Enter the amount of time SMS waits before retrying to communicate with
the devices. Default 5000 msec.
6. Network Address. This sets the network address for the PC on which the
POWERLOGIC network server is installed. This value must be an integer from 0–99.
Each network device on a common network must be assigned a unique network
address. For example, a PC cannot have the same address as a PNIM on the same
network.
7. To test the port, click Test Port. This ensures that the communications port passes the
system’s internal test. If the test fails, examine the Network Address box to verify that
you have selected a valid number.
8. Click OK to return to the Setup Comm Server Interface dialog box.
Setting Up Devices and Routes
1. Adding a Device
You must set up a PC interface (see previous section) before you can add a device. You
can add devices when online or offline.
Note: DDE device setup is described in Chapter 18—Using Dynamic Data Exchange
(DDE). See chapter 18 for instructions on setting up a DDE device.
On the Setup menu, click Devices/Routing… to display the Device Setup dialog box.
This dialog box lists all previously defined devices along with their device types and
routes. Follow these steps to add and route a device.
Note: You can sort the information in this box, listing it in an order that is convenient for you.
To sort, click the title bar (Device, Type, or Route).
20
© 1996 Square D All Rights Reserved
Chapter 3—Basic System Setup and Operation
To add a new device, click Add to display the Add Device dialog box:
Add the following device information:
At this field…
Add Device table
Do this…
1. Device Name:
Type a descriptive name for this device, maximum 32 characters, no apostrophes; for example, Stamping Line Feeder 1.
2. Device Type:
3. Connection Name:
Click the type of device you are adding.
Click the PC port to which this device connects. The connection name is the
name you assigned when adding the new PC port.
Click OK to save the device information you just typed.
2. Adding a Route
A route statement defines the path from the personal computer to one specific device.
You must assign a unique route statement for each device in a POWERLOGIC system.
Route statements are stored in the SMS database, along with the rest of the setup
information.
© 1996 Square D All Rights Reserved
21
Bulletin 3080IM9601
Adding a SY/LINK Route
1. After you add a device with a SY/LINK connection name, SMS displays the SY/LINK
dialog box:
2. Add the SY/LINK route information:
At this field…
1. Connection Name:
2. Rt1–Rt8:
Add SY/LINK table
Do this…
SMS displays the name of the PC port to which this device connects. This
name was established when adding the device.
Enter the route. For help in creating routes, refer to the Power Monitoring and
Control System Planning Guide (order no. 3000CT9601).
3. Click OK to save the route information and return to the Device Setup dialog box.
The information entered to this point allows you to access information collected from
devices. However, you can perform additional setup that you would otherwise perform
at the device. This feature allows you to set up devices from one PC, within SMS, rather
than having to waste time entering setup information at each device. For this setup
information, see Additional Device Setup, later in this chapter.
Adding a Serial Port Route
1. After you add a device with an RS-232 (serial port) connection name, SMS displays
the SY/MAX RS232 Route dialog box:
22
© 1996 Square D All Rights Reserved
Chapter 3—Basic System Setup and Operation
2. Add the serial port route information:
At this field…
Add Serial Port table
Do this…
1. Connection Name:
SMS displays the name of the PC port to which this device connects. This name
was established when adding the device.
2. Phone #:
Enter the phone number for auto-dial applications (allowing SMS to automatically poll remote devices). Include any characters that must be entered when
connecting with the modem. If you must enter a ‘9’ to get an outside line, enter
the ‘9’ here. If you need to allow for a delay getting an outside line, enter a
comma (,) for each second of delay time. You can enter the phone number with
dashes. If you are connecting to an internal extension, enter only that extension.
An example of an outside connection is 9,,555-1212 (using ‘9’ to get an outside
line and two commas for a two-second delay).
3. Rt1–Rt8:
Enter the route. For help in creating routes, refer to the Power Monitoring and
Control System Planning Guide (order no. 3000CT9601).
3. Click OK to save the route information and return to the Device Setup dialog box.
The information entered to this point allows you to access information collected from
devices. You can perform additional setup that you would otherwise perform locally at
the front panel of that device. This feature allows you to set up devices from one PC,
within SMS, rather than having to waste time entering setup information at each device.
For this setup information, see Device Setup, below.
3. Device Setup
To perform device setup, click the device name, then click Configure (or double-click the
device name). The appropriate dialog box displays, depending on the device type you
selected. For example, if you click a Series 2000 Circuit Monitor, you will see a Device
Setup dialog box that allows you to enter Series 2000 Circuit Monitor data. The setup for
each device type is described in the following pages.
© 1996 Square D All Rights Reserved
23
Bulletin 3080IM9601
Series 2000 Circuit Monitor Setup
After you select the CM-2000 device type, SMS displays the CM2000 Basic Setup tab
(after you establish the route):
Follow the steps below to set up the CM 2000 series circuit monitor.
At this field…
1. Label:
Enter a 1- to 4-character alphanumeric label to identify the circuit monitor. The
label typically is different for each circuit monitor; it is used for system displays.
This is not the device name, which is defined using the “Routing” command.
SMS displays the device name, not the label, when listing devices.
2. Nameplate:
Enter a 1- to 16-character alphanumeric nameplate. Most commonly associated with the monitored circuit, the nameplate should reflect that connection.
For example, if the circuit monitor is monitoring a welder on line 3, the
nameplate might be “Welder Line 3.” SMS uses this name for system displays.
This is the primary turns ratio of the current transformers (CTs) supplying the
circuit monitor with current inputs. Enter the “CT Ratio” in terms of X:5A. For
example, if the CT ratio is 500:5, enter 500.
This is the primary turns ratio of the neutral CT. Enter the “Neutral CT Ratio” in
terms of X:5A. For example, if the neutral CT ratio is 50:5, enter 50.
This is the primary turns ratio of the potential transformers (PTs) supplying
the circuit monitor with the voltage signals. Enter the “PT Ratio” in terms of
X:120V. For example, if the PT ratio is 288:120, enter 288.
SMS uses this feature to automatically create scale factor ratios for
PT/CT/Neutral numbers entered by users. Default = enabled. If you disable
this feature, click Advanced to enter ratios manually.
Circuit monitors can accumulate energy in two modes: absolute or signed.
In “absolute,” the circuit monitor accumulates energy based on the absolute
value of real power, regardless of the direction of power flow. In “signed,” the
circuit monitor accumulates energy with regard to sign; that is, for reverse
power flow, the accumulated energy value is reduced.
3. CT:
5. Neutral CT:
6. PT:
7. Automatic
Scale Factors
From PT/CT
8. Accumulated
Energy
24
CM2000 Basic Setup table
Do this…
© 1996 Square D All Rights Reserved
Chapter 3—Basic System Setup and Operation
At this field…
9. Current/K-Factor
Demand Interval
10. Power Demand
Interval
11. Subinterval
12. Demand Method
Do this…
Used in the average current and K-factor demand power calculations for
Series 2000 Circuit Monitors. Enter a value between 5 and 60 in 5-minute
increments (5, 10,…60). Default is 15.
Used in the average demand power calculations. Enter a value between
5 and 60 in 5-minute increments (5, 10, 15,...60); the default is 15 minutes.
You can also enter a zero, which causes the circuit monitor to look to status
input S1 on the optional attached Input/Output Module for an external
synchronizing pulse for its “block interval” (described below) demand method
calculation. This sync pulse input is commonly used to ensure that the circuit
monitor is in sync with a utility watt-hour meter and can be used to verify the
utility’s peak demand charges.
Used only when the demand method (below) is “block,” to determine the start
point for each new interval. Enter a value between 0 and 60 in 5-minute
increments (this value must be evenly divisible into the value entered in step
10). A setting of 0 yields a 15-second continuous sliding subinterval (starting a
new interval every 15 seconds). A setting of 5 minutes or greater yields a
rolling block subinterval (starting a new interval every 5 minutes).
This box displays the circuit monitor methods for calculating demand power:
Thermal (default). The only method available for Series 100/200 Circuit
Monitors. This method calculates demand based on a thermal response and
updates its demand calculation every 15 seconds on a “sliding window” basis. The
interval can be from 5 to 60 minutes in 5-minute increments.
Block. Applies to Series 2000 Circuit Monitors only. The “Block” demand
method calculates demand based on a fixed block of time equal to the demand
interval selected (5 to 60 minutes in 5-minute increments). The demand
calculations are performed at the end of the interval so the demand values
displayed are the values for the last completed demand interval.
Sync to S1. Applies to Series 2000 Circuit Monitors only. This method is
equivalent to setting the demand interval to zero (step 10). This sync pulse
input is commonly used to ensure that the circuit monitor is in sync with a utility
watt-hour meter and can be used to verify the utility’s peak demand charges.
Sync to Comms. Applies to Series 2000 Circuit Monitors only. The circuit
monitor uses the “Start of Interval” command received over the RS-485
communications chain from an external source, such as a programmable logic
controller (PLC).
13. Wiring
Click to select:
• 4-Wire if the circuit monitor is wired in a 3-phase, 4-wire system
• 3-Wire if the circuit monitor is wired in a 3-phase, 3-wire system
• Neutral CT Installed if a neutral CT is connected
• 2-1/2 Element “Wye” Metering if the circuit monitor is wired in a 3-phase,
4-wire system and there is no B-phase PT installed
When you’ve entered all the information in this tab, the setup for basic operation of the
CM-2000 series circuit monitor is complete. Advanced circuit monitor information is
contained in the remaining three tabs of this dialog box. For instructions on advanced
setup of the CM-2000 series circuit monitor, see Chapter 5—Advanced On-Board Setup
for Series 2000 Circuit Monitors.
© 1996 Square D All Rights Reserved
25
Bulletin 3080IM9601
Series 100/200 Circuit Monitor Setup
When you select the Circuit Monitor 100/200 type, the Device Setup dialog box displays
(after you establish the route):
Follow these steps to set up the CM 100/200 series circuit monitor:
CM 100 Series Setup table
At this field…
Do this…
1. Label:
Enter a 1- to 4-character alphanumeric label to identify the circuit monitor.
The label typically is different for each circuit monitor; it is used for system
displays. This is not the device name, defined using the “Routing” command. SMS displays the device name, not the label, when listing devices.
2. Nameplate:
Enter a 1- to 16-character alphanumeric nameplate. Most commonly
associated with the monitored circuit, the nameplate should reflect that
connection. For example, if the circuit monitor is monitoring a welder on line
3, the nameplate might be “Welder Line 3.” SMS uses this name in systen
displays.
The circuit monitor provides three independent “Energy Management
Alarm” levels for comparison with computed Real Power Average Demand
values. These are alarms levels ranging from 0 to 32,767 kW. If you do not
have the POWERLOGIC Product Communications Software (PSW-101), do
not change the default entries.
This is the primary turns ratio of the current transformers (CTs) supplying
the circuit monitor with current inputs. Enter the “CT Ratio” in terms of X:5A.
For example, if the CT ratio is 500:5, enter 500.
This is the primary turns ratio of the potential transformers (PTs) supplying
the circuit monitor with the voltage signals. Enter the “PT Ratio” in terms of
X:120V. For example, if the PT ratio is 288:120, enter 288.
Circuit monitors can accumulate energy in two modes: absolute or signed.
In “absolute,” the circuit monitor accumulates energy based on the absolute
value of real power, regardless of the direction of power flow. In “signed,”
the circuit monitor accumulates energy with regard to sign; that is, for
reverse power flow, the accumulated energy value is reduced.
3. Energy Management
4. CT Ratio
5. PT Ratio
6. Accumulated Energy
26
© 1996 Square D All Rights Reserved
Chapter 3—Basic System Setup and Operation
At this field…
Do this…
7. Connection
Refers to the system wiring. Click 3-Wire if the circuit monitor is wired in a 3phase, 3-wire system. Click 4 Wire if the circuit monitor is wired in a
3-phase, 4-wire system.
Determines whether all current values are returned in amps or tenths of amps
(Amps/10). Select Amps/10 when greater precision is required.
8. Current Precision
9. Demand Interval
Used in the average demand power calculations, enter a value between
5 and 60 in 5-minute increments (5, 10, 15,...60). Default is 15 minutes.
Power Meter Setup
When you select Power Meter, SMS displays the power meter Device Setup dialog box :
Follow these steps to set up the power meter:
At this field…
1. Label:
2. Nameplate:
3. CT:
Power Meter Device Setup table
Do this…
Enter a 1- to 4-character alphanumeric label to identify the power meter. The
label typically is different for each power meter; it is used for system displays.
This is not the device name, which is defined using the “Routing” command.
SMS displays the device name, not the label, when listing devices.
Enter a 1- to 16-character alphanumeric nameplate. Most commonly associated with the monitored circuit, the nameplate should reflect that connection.
For example, if the power meter is monitoring a welder on line 3, the
nameplate might be “Welder Line 3.” SMS uses this name in system displays.
This is the turns ratio of the current transformers (CTs) supplying the power
meter with the current inputs. Enter the primary and select the secondary.
For example, for a 120:5 ratio, enter 120 in the left box, and select 5 in the
spin box.
© 1996 Square D All Rights Reserved
27
Bulletin 3080IM9601
Power Meter Setup (cont.)
At this field…
Do this…
4. Range:
Select the voltage range: For L-N voltage less than 150 V, select 208/120; for
L-N voltage between 150 V and 346 V, select 480/277; for L-N voltage
between 347 V and 433 V, click 600/347. When the L-N voltage is greater than
433 V, select 208/120 and select the appropriate PT setting.
This is the turns ratio of the potential transformers (PTs) supplying the power
meter with the voltage signals. Enter the primary and select the secondary. For
example, if the PT ratio is 120:100, enter 120 in the left box and select 100 in
the spin box. You need to set this field only when the PT is 208/120 and you
are using a potential transformer.
5. PT:
6. Automatic
Scale Factors
From PT/CT
7. THD/thd
SMS uses this feature to automatically create scale factor ratios for
PT/CT numbers entered by users. Default = enabled. If you disable
this feature, click Advanced to enter ratios manually.
(PM-620 only) This field sets the manner in which the power meter calculates
total harmonic distortion. Select THD (% fundamental) for usage in the U.S., or
select the alternate thd (% rms), which is commonly used in Europe.
Power meters can accumulate energy in four modes: absolute, signed, in
only, and out only.
In “absolute,” the power meter accumulates energy based on the absolute
value of real power, regardless of the direction of power flow.
In “signed,” the power meter accumulates energy with regard to sign; that is,
for reverse power flow, the accumulated energy value is reduced.
8. Accumulated
Energy
In “in only,” the meter accumulates kWh and kVarH as energy into the load
In “out only,” the meter accumulates kWh and kVarH as energy out of the load
(PM-620 only) Used in the average demand power calculations. Enter a value
between 1 and 60 in 1-minute increments (1, 2, 3,...60). This creates a “sliding
block” demand with the following characteristics: from 1–15 minutes, there is a
15-second subinterval; from 16 –60 minutes, there is a 1-minute subinterval.
9. Power Demand
10. Wiring
11. Nominal Frequency
12. Mode
13. kXHr Pulse
28
Click to select:
• 4-Wire if the power meter is wired in a 3-phase, 4-wire system
• 3-Wire w/2CT if the power meter is wired in a 3-phase, 3-wire system,
using 2 CTs
• 3-Wire w/3CT if the power meter is wired in a 3-phase, 3-wire system,
using 3 CTs
Select 60 Hz or 50 Hz, depending on the frequency of the electrical system.
Select the KYZ pulse to correspond with the mode you are using: kWH, kVarH,
kVAH, or disabled.
Disabled if the Mode is disabled. Otherwise, enter the pulse weight that
corresponds with the mode you set.
© 1996 Square D All Rights Reserved
Chapter 3—Basic System Setup and Operation
Working with the System
Going Online
Before you can communicate to the devices in a system, you must load a system file. The
process of loading a system file is referred to as going online. The Online command in
the File menu is used to go online to a system that you have created.
The online system is the system that all clients connected to the same POWERLOGIC
network server will view. Once you place a system online, all clients that connect to that
server will access the same database, with the same devices, logging, etc. A client cannot
view another system’s data unless the current system is taken offline and the new
system is placed online.
Going Online with a System
To go online with a system, follow these steps:
1. Before you place a system online, the online system field, in the center of the bottom
of the SMS main window, displays the message No online system. On the File menu,
click Online > System.
SMS displays the Place System Online dialog box:
2. Click the system name of the system you want to place online. Click OK.
SMS displays a message telling you that the selected system is online.
Notes: All clients connected to this server will go online with this system.
If the server is shut down then started up, the system that was online at the time of shutdown
will automatically be online. You can change the system to another, or to no online system: use
the Diagnostics tab of SMS Configuration (Smscfg). This change will take effect only for the
next startup.
Going Online with a Workspace
The workspace feature lets you save a snapshot of the SMS client window— such as
open windows, data update mode, etc—and reload the snapshot when you go online
with SMS. This gives you quicker access to dialog boxes that you need to access often.
© 1996 Square D All Rights Reserved
29
Bulletin 3080IM9601
To go online with a workspace, you must first save a workspace (File > Save Workspace
As… ; see Chapter 16—Saving a Workspace). Then follow these steps:
1. On the File menu, click Online > Workspace.
The Open dialog box displays.
2. Click the name of the workspace that you want to take on line.
SMS takes the workspace on line.
Device Status Checks
When a system is placed online, SMS checks the status of each device in the system. A
device will fail an SMS device status check if:
• SMS is unable to communicate with it.
• A comparison of the basic settings of the database and the device does not match; for
example, something in the basic setup has been changed since the last time the device
was brought online.
If one or more devices do not pass the SMS device check, the System Device Status
dialog box displays. It gives you information about the working status of the system
devices.
The procedures for bringing devices and SMS back into communication are covered in
Correcting Mismatches in Device Setup Data in Chapter 17—Diagnostics. See this
chapter for instructions on performing a system communications test and restoring
communication between the system and its devices.
Opening a Working System
The working system (“EDIT” system, displayed at the bottom right of the SMS main
window) is the system to which you can make changes. Only one client can open a
working system at one time. Opening a working system puts SMS in edit mode, allowing you to modify setup parameters. When you first go online, there is no working
system.
To open a working system, follow these steps:
1. Click File > Open > System… . The Open System dialog box displays.
2. Click the name of the system you want to open.
3. Click OK.
The working system changes to EDIT: [system name]; any changes you make apply to
that system only.
Note: While online, you cannot edit the PC interface or change device routing, but you can add
devices to the system.
30
© 1996 Square D All Rights Reserved
Chapter 3—Basic System Setup and Operation
Changing the Working System
To change the working system, simply open the second system. SMS closes the first
system and opens the new system for you.
Closing the Working System
To close the working system, click File > Close Working System. SMS closes the working
system.
Going Offline
Once you are online with a system, the Online command (under the File menu) changes
to Offline. To take the online system offline, click Offline.
SMS asks you to verify the action. Click No to leave the system online; click Yes to take
it offline.
Note: When you go offline, the server stops communicating with devices. All logging, alarm
monitoring, and scheduled tasks will stop. All connected clients stop receiving updates.
If SMS is shut down, the last online system before shutdown automatically becomes the online
system after startup. You can change the system to another, or to no online system: use the
Diagnostics tab of SMS Configuration (Smscfg). This change will take effect only for the
next startup.
Setting the Sampling Mode
After you go online with a system, you must tell SMS how often it should update the
client user interface for real-time displays. Each client can set its own update rate. SMS
has two sampling mode options:
• Scheduled. Causes SMS to sample data at a user-defined update interval.
Notes: The number of devices from which you are sampling data can slow this process down.
For example, if you have 50 devices in your facility, SMS may take longer than 10 seconds to
complete a sample. If the sample takes longer than the schedule time, SMS will return the
sample information, and then immediately begin a new sample.
This virtually constant device polling uses up SY/NET and RS-232 resources (on the
POWERLOGIC network server PC), which will slow down other SMS processes. If unattended clients are making unnecessary requests to the server, it is recommended that you stop
the sampling process at these client PCs. You can either go to manual sampling mode, or close
all reports and tables that are drawing information into client PCs. Alarm and event polling
will continue even when in manual sampling mode.
The scheduled mode does not control intervals for logging or alarm data to the history log or
the printer. For these intervals, use the Logging command on the Setup menu. See
Chapter 9—Data Logging for instructions.
© 1996 Square D All Rights Reserved
31
Bulletin 3080IM9601
Setting the Sampling Mode (cont.)
• Manual. Stops SMS from automatically sampling data; to sample data, you must use
the Take Sample command in the Control menu or click √ on the toolbar. SMS defaults
to manual mode when it first goes online with a system.
Scheduled Update
A system must be placed online before you can change the sampling mode. To set a
scheduled sampling mode and update interval, follow these steps:
1. On the Control menu, click Scheduled Update or click the Scheduled Update toolbar
icon . The icon remains depressed, indicating that the system is in a scheduled
sampling mode. The Sampling Mode at the top of the SMS main window changes
from MANUAL (the default) to SCHEDULED:
Scheduled Update icon
Manual Update icon
Select sampling mode
interval here.
2. Select the interval from the window:
• Continuous (SMS samples as often as possible, beginning a new sample as soon as
the previous one is complete)
• 5 seconds
• 10 seconds
• 30 seconds
• 1 minute
The scheduled update interval is set.
Manual Update
To set a manual sampling mode, click Manual Update on the Control menu. SMS takes a
sample only when you click Take A Sample on the Control menu or when you click the
Manual Update toolbar icon .
32
© 1996 Square D All Rights Reserved
Chapter 3—Basic System Setup and Operation
Where To Next?
After completing the procedures described in this chapter, you should have a basic
understanding of how to set up a system and the devices included in it. You should also
know how to go online and offline, and how to take data samples from system devices.
If your system includes Series 2000 Circuit Monitors, you need to read Chapter 5—
Advanced On-Board Setup for Series 2000 Circuit Monitors after you have established
online communications.
Refer to the table of contents or index for information on specific topics for which you
need information.
© 1996 Square D All Rights Reserved
33
Bulletin 3080IM9601
Chapter 4—Displaying Real-Time Data
Real-time data is information that SMS displays as soon as possible after it is collected.
The speed with which SMS can display data depends on such factors as how many
devices are being polled and how many quantities are requested.
Use SMS to display information in a variety of real-time formats:
• tables
• bar charts
• meters
• active function list
To begin any display, click the desired display type on the Display menu (or click the
corresponding toolbar). Follow the steps for the type of display you are creating; instructions for each type of display begin on the next page.
Data Update Rate
You control the rate at which SMS displays new real-time data. You can see updated
data continuously or at scheduled intervals, or you can manually update, seeing only
the sample of data that is taken at the time of update.
For more information on setting update intervals, see Setting the Sampling Mode in
Chapter 3—Basic System Setup and Operation.
34
© 1996 Square D All Rights Reserved
Chapter 4—Displaying Real-time Data
Displaying a Table
SMS lets you display real-time data for the devices that it identifies. The figure below
lists the standard tables, and their characteristics:
Standard Table Types
Devices Supported
Table Name
Instantaneous Readings ➀
Load Current Summary ➁
810D Circuit Breaker Status➀
810D Trip Unit Set-History ➀
Analog Input Readings➀
Basic Reading Summary ➁
Demand Current Summary ➁
Demand Readings ➀
Digital Relay Settings-HIstory ➀
Energy Readings Summary➁
Energy Readings ➀
Fundamental Phasor Readings ➀
MICROLOGIC C.B. Trip Unit Data➀
Phase Unbalance Readings ➀
Power Factor Readings ➀
Power Factor Summary ➁
Power Flow Summary ➁
Power Quality Readings ➀
Power Readings ➀
System Voltage Summary ➁
THD Current Summary ➁
THD Voltage Summary ➁
Transformer Readings ➀
CM2000
X
X
CM1
X
X
Power
Meter
X
X
X
X
X
X
X
X
X
X
X➂
X➂
X
X
X
X
X
X
X
X
X
X
X
X
X
810D
X
X
X
X
Dig.
Relay PIF-3 PIF-85
X
X
X
X
X
X
X
X
X
X
X
X
X
X
X
X
X
X
X
X
X
X
X
X
X
X
X
X➂
X
X
X➂
X➂
Transformer Summary ➁
X
X
X
X
➀ Single device, multiple quantities
➁ Multiple devices, single quantity
➂ Model PM-620 only
© 1996 Square D All Rights Reserved
35
Bulletin 3080IM9601
Displaying a Table (cont.)
You display a table, you must select the device(s) and quantities to include. When a
table supports multiple devices, you can include individual devices or entire groups.
When a table supports a single device only, you can include multiple devices, but the
system displays data for only one device at a time.
To display a standard real-time table, follow these steps:
1. Click Tables… on the Display menu or click the toolbar icon
The Open Table dialog box displays:
.
2. From the Tables Available box, click the standard table you want to display.
3. In the Devices Available box, select the device(s) or group(s) for which you want to
display data; move them to the Devices Selected box.
Notes: Always select the table before you select the device(s).
The table that you select will limit the devices for which you can display information. For
example, if you select 810D Breaker Status, the Devices Available list will include only 810D
circuit breakers that you have set up as devices in your system.
4. Click OK.
5. The table you requested displays.
36
© 1996 Square D All Rights Reserved
Chapter 4—Displaying Real-time Data
A sample table, displaying power factor readings for a single device, is shown below.
If you display a single-device table and select multiple quantities, click a device at the
left of the table to see data for that device. If you select a multiple-device table, data
for each device displays for comparison.
To change the update mode, click the Control menu and set the update to scheduled
or manual. See instructions in Setting the Sampling Mode in Chapter 3—Basic
System Setup and Operation.
Displaying a Bar Chart
SMS can display real-time data in the form of bar charts.
Although only one type of data can be viewed at a time (for example, load phase
currents or power flows, but not both), you can change the displayed data with a single
mouse click. You can display data from more than one device or group of devices. For
example, you might want to view load phase currents for all three feeders in a group.
The bar chart will contain three sets of three bars. Each set will correspond to phase A,
phase B, and phase C of the feeders.
© 1996 Square D All Rights Reserved
37
Bulletin 3080IM9601
Displaying a Bar Chart (cont.)
The following table lists, by device type, the real-time data that SMS can display.
Bar Chart Displays by Device
Data
Load phase currents
Average load current
Demand phase currents
Peak demand phase currents
System phase voltages (L–L)
System phase voltages (L–N)
Power flows
Demand power flows
Phase power factors
Power factor 3-phase total
CM
2000
X
X
X
X
X
X
X
X
X
X
CM
100/200
X
X
X
X
X
X
X
X
X
X
Power
Meter
X
X
X
X
X
X
X
X
X
810D
X
X
X
X
PIF-3
X
Digital
Relay
X
X
X
X
Powerlink
PIF-85
X
X
To display a bar chart, follow these steps:
1. On the Display menu, click Bar Charts… or click the toolbar icon
SMS displays the Open Bar Chart Display dialog box:
.
2. In the Devices Available box, click the device(s) to be included, dragging each icon to
the Devices Selected box.
38
© 1996 Square D All Rights Reserved
Chapter 4—Displaying Real-time Data
3. Click OK to display the Bar Chart window.
A sample window is illustrated below:
Highest Power Flow
(red)
High Power Flow
(yellow)
Lowest Power Flow
(red)
Low Power Flow
(yellow)
Normal Operating Range
(green)
4. From the list on the left of the box, click the data type to display in the bar chart. The
bar chart title changes to match the data type you select; the data displays in rows,
one for each device you selected in step 2.
Operating Range Indication
SMS lets you define the normal, low, and high operating ranges for devices. When the
ranges are established, the bar charts will display color tracking to indicate the limits of
each range for that device. This indication makes it easy for operators to quickly assess
the status of the devices being metered.
The normal operating range displays as a green bar. The yellow bar indicates conditions
that are low or high, outside of the normal range. The red bar indicates the lowest or
highest conditions that are even farther outside of the normal range. If only two
setpoints (high and low) are established, there will be no yellow bar, only green and red.
The figure above illustrates color tracking indication of operating ranges.
© 1996 Square D All Rights Reserved
39
Bulletin 3080IM9601
Operating Range Indication (cont.)
To establish operating range indication for a device, you must:
• add an analog function that you want to monitor (such as voltage A-N or Current B)
• choose the device at which you want to monitor the function
• establish setpoints, with pickup and dropout points, to define the limits of each range.
You must establish at least two setpoints for a function; for example, you might set
high alarm and low alarm, with pickup and dropout points to establish the range.
The pickup values determine when green changes to yellow and yellow changes
to red.
Displaying a Meter
You can display real-time data on analog meters. Although you can view data for only
one device at a time, you can select multiple devices and toggle between them to display
the data.
The four-meter panel includes the following data:
• voltage (each phase, line-line and line-neutral)
• amperage (each phase and 3-phase)
• kilowatts (real, reactive, and apparent)
• power factor (each phase and 3-phase)
To display a meter, follow these steps:
1. On the Display menu, click Meters…. or click the toolbar icon
.
SMS displays the Open Meter Display dialog box:
2. In the Devices Available box, click the device(s) for which you want to see meter data.
Drag the devices or click > to move the devices to the Devices Selected box.
40
© 1996 Square D All Rights Reserved
Chapter 4—Displaying Real-time Data
3. Click OK to display the Meter window:
4. To display meter data for a device, click the desired device in the list at the left of the
window. Meter data displays in the large window on the right. The current reading
for the quantity being logged displays just above the quantity title (located at the
bottom of each meter).
5. To view different phase quantities, double-click the quantity title. For example, on the
voltage meter (upper left), double-click the Voltage Phase AN title, to change between
AN, BN, CN, AB, BC, and CA.
Note: Meter data displays (needles display within the meters) only if the sample that you request
is valid. No needles will display if:
• the wire configuration is not supported; for example, no line-neutral voltages display for
a 3-wire device
• there is a sampling error
The meters update according to the sampling mode (selected on the Control menu; see
Setting the Sampling Mode in Chapter 3—Basic System Setup and Operation). For
example, in scheduled update mode, at 10-second intervals, the meters display new
readings about every ten seconds.
Operating Range Indication
SMS lets you define the normal, low, and high operating ranges for devices. When the
ranges are established, the meters will display color tracking to indicate the limits of
each range for that device. This indication makes it easy for operators to quickly assess
the status of the devices being metered.
© 1996 Square D All Rights Reserved
41
Bulletin 3080IM9601
The normal operating range displays as a green bar along the meter edge. The yellow
bar indicates conditions that are low or high, outside of the normal range. The red bar
indicates the lowest or highest conditions that are even farther outside of the normal
range. If only two setpoints (high and low) are established, there will be no yellow bar,
only green and red.
To establish operating range indication for a device, you must:
• add an analog function that you want to monitor (such as voltage A-N or Current B)
• choose the device at which you want to monitor the function
• establish setpoints, with pickup and dropout points, to define the limits of each range.
You must establish at least two setpoints for a function; for example, you might set
high alarm and low alarm, with pickup and dropout points to establish the range.
The pickup values determine when green changes to yellow and yellow changes
to red.
For instructions, see Creating Global Functions in Chapter 6—Setting Up Functions
and Alarms. The following figure illustrates a C-N voltage meter, indicating the normal,
high, and low ranges established for that function.
Note: If you establish only two setpoints (high and low), you will not see the yellow bar, just
green for normal and red for both low and high.
Normal C-N voltage
(green)
Low C-N voltage
(yellow)
Lowest C-N voltage
(red)
High C-N voltage
(yellow)
Highest C-N voltage
(red)
Present Reading
(matches the needle
indication)
42
© 1996 Square D All Rights Reserved
Chapter 4—Displaying Real-time Data
Displaying a List of Active Functions
You can display a list of all active functions in a system. Active functions are analog or
digital functions that are set up with some level of alarm assigned to them. To view this
list, follow these steps:
1. From the Display menu, click Function Tables… or click the toolbar icon
.
SMS displays the list:
The table columns are:
Device:
the device name
Function:
the function name
Type:
A = analog, D = digital
Last Sample:
the date/time stamp for when this sample was taken
State:
for digital functions, the name given to the Equal or
Non-Equal condition
© 1996 Square D All Rights Reserved
43
Bulletin 3080IM9601
Chapter 5—Advanced On-Board Setup for
Series 2000 Circuit Monitors
This chapter applies only to the Series 2000 Circuit Monitors (CM-2050 and higher).
Before you follow the instructions in this chapter, be sure that you are familiar with the
capabilities of the circuit monitors in your system. You may need to refer to the section
”Circuit Monitor Models Feature Comparison” in Chapter 3–Basic System Setup and
Operation.
The Series 2000 Circuit Monitor setup process consists of four parts:
• Basic setup—Set up basic parameters such as PT and CT ratios, demand interval,
demand type, and system type. Basic setup for circuit monitors is described in
“Chapter 3—Basic System Setup and Operation.” The other three setup tasks are
described in this chapter.
• Input/output module setup—Set up relay outputs, analog inputs and analog outputs. (The circuit monitor must be equipped with an optional input/output module.)
• On-board data storage setup—Set up circuit monitor event log, waveform capture
logs, and data logs.
• On-board alarms/events setup—Set up the circuit monitor’s on-board alarms, and
configure it to perform actions, such as operating a relay, when an alarm occurs.
The setup tasks are on four tabs in the Device Setup dialog box for a Series 2000 Circuit
Monitor.
To access the Device Setup dialog box for a Series 2000 Circuit Monitor, do the
following:
1. On the Setup menu, click Devices/Routing...
SMS displays the Device Setup dialog box.
2. In the Devices box, click the Series 2000 Circuit Monitor to set up, then click
Configure, or double-click on a device.
SMS displays the Device Setup dialog box for a Series 2000 Circuit Monitor. The rest
of this chapter tells how to use the I/O Module, On-Board Data Storage, and
On-Board Alarms/Events tabs.
44
© 1996 Square D All Rights Reserved
Chapter 5—Advanced Series 2000 Circuit Monitor Setup
Setting Up Input/Output Modules
Use the I/O Module tab (shown below) in the Series 2000 Circuit Monitor Device Setup
dialog box to set up circuit monitor inputs and outputs. SMS must be online with your
system to perform I/O Module setup.
If you are not already viewing the I/O Module tab, follow these steps to display the tab:
1. On the File menu, click Online, and go online with the desired system. Click
Manual Update on the Control menu to ensure that SMS is not sampling data.
2. On the Setup menu, click Devices/Routing...
SMS displays the Device Setup dialog box.
3. In the Devices box, click a Series 2000 Circuit Monitor that is equipped with an I/O
module, then click the Configure button.
4. Click the I/O Module tab.
The upper left-hand corner of the tab shows the type of I/O module installed on the
circuit monitor. It also lists the inputs and outputs that the module provides.
The rest of the tab is divided into three boxed areas used to configure relay outputs,
analog inputs, and analog outputs. These are described in the following sections.
Setting Up Relay Outputs
Each relay can be configured independently. For each relay, you can determine the mode
of operation, and whether the relay will be controlled automatically by circuit monitor
on-board functions, or externally (remotely) by a programmable logic controller or
application software such as SMS.
© 1996 Square D All Rights Reserved
45
Bulletin 3080IM9601
To set up a relay output, follow these steps:
1. In the Output box, select a relay to configure.
The Pulse Initiator is the KYZ solid-state Form C relay output, which is rated for
billions of operations at 96 milliamps (suitable for pulse initiator applications).
Relays R1, R2, and R3 are Form C mechanical relays rated for tens of thousands
of operations at 10 amps/120 Vac (suitable for many control applications, such
as switchgear).
2. In the Mode box, select the desired operating mode for the relay you chose in step 1.
Refer to the Circuit Monitor Relay Operation Modes table on the next page for a
description of the 10 modes.
Note that the first three modes—Normal, Latched, and Timed—function differently
when the relay is externally controlled than when it is on-board (or internally) controlled.
The table points out the differences. All pulse initiation modes, modes 4–10, are onboard controlled.
3. If you want the relay to be controlled automatically by the circuit monitor in response
to one or more of the circuit monitor’s on-board alarm conditions—such as “Over
KW Demand” or “Status input S3 transition from OFF to ON”—check the Enable
On-Board Operation box. The circuit monitor will check for alarm conditions and
operate relays even when your computer is turned off. Note: When you receive a new
Series 2000 Circuit Monitor and install an I/O module on it, the default for all relays is Not
Enabled for on-board operation. Also, on-board operation is supported only by circuit
monitor models CM-2150 or higher.
4. If the relay will be controlled by a device external to the circuit monitor—such as a
SY/MAX programmable controller or from a computer using SMS‘s control outputs
feature—do not check the Enable On-Board Operation box.
Note: Before automatic operation can occur, you must enable the desired on-board alarm
conditions, and specify the relays to be automatically operated when each alarm occurs. The
section “Setting Up On-Board Alarms” in this chapter tells how. “Chapter 13—Control
Outputs” has more details on the implications of enabling a relay for on-board operation and
how you can use SMS to override on-board relay operation.
5. If, in step 2, you selected “Timed” mode, enter the desired number of seconds (1 to
32,767) for the relay to stay energized.
6. If, in step 2, you selected any of the pulse initiation modes (modes 4 through 10),
enter the pulse value from 0.0 to 3,276.7.
For example, if the relay mode is “Absolute KWH Pulse” and you determine that
each relay change of state is to signify that an additional 0.5 kilowatthours have been
consumed by the circuit being monitored, enter 0.5 in this box. See “Calculating the
Watthour-Per-Pulse Value” in the Series 2000 Circuit Monitor instruction bulletin for
instructions on calculating the KxHR/Pulse value for your application.
46
© 1996 Square D All Rights Reserved
Chapter 5—Advanced Series 2000 Circuit Monitor Setup
Circuit Monitor Relay Operation Modes
1. Normal.
Externally Controlled. The user must energize the relay by issuing a command from a remote PC
or programmable logic controller. The relay remains energized until a command to de-energize is
issued from a remote PC or programmable logic controller, or until the circuit monitor loses control
power.
On-Board Controlled. When an alarm condition assigned to the relay occurs, the relay is energized.
The relay is not de-energized until all alarm conditions assigned to the relay have dropped out, or
until the circuit monitor loses control power.
2. Latched.
Externally Controlled. The user must energize the relay by issuing a command from a remote PC or
programmable logic controller. The relay remains energized until a command to de-energize is
issued from a remote PC, programmable logic controller, the front panel of the circuit monitor, or
until the circuit monitor loses control power.
On-Board Controlled. When an alarm condition assigned to the relay occurs, the relay is energized.
The relay remains energized—even after all alarm conditions assigned to the relay have dropped
out— until the Priority 1 Log is cleared from the front panel of the circuit monitor, or until the circuit
monitor loses control power. See “Clearing the Priority 1 Log” in Chapter 4 of the Series 2000
Circuit Monitor instruction bulletin.
3. Timed.
Externally Controlled. The user must energize the relay by issuing a command from a remote PC or
programmable logic controller. The relay remains energized until the timer expires, or until the
circuit monitor loses control power. If a new command to energize the relay is issued before the
timer expires, the timer restarts.
On-Board Controlled. When an alarm condition assigned to the relay occurs, the relay is energized.
The relay remains energized until the timer expires, or until the circuit monitor loses control power.
If the alarm condition is still true when the timer expires, the circuit monitor reestablishes the relay,
causing the relay to cycle off and on during a prolonged alarm period.
4. Absolute kWH Pulse.
This mode assigns the relay to operate as a pulse initiator with a user-defined number of kWH per
pulse. In this mode, both forward and reverse energy are treated as additive (as in a tie breaker).
This is the mode that the KYZ relay assumes when watthours-per-pulse is set up from the front
panel of the circuit monitor. The KYZ Pulse Initiator relay output was designed for pulse applications such as this.
5. Absolute kVARH Pulse.
This mode assigns the relay to operate as a pulse initiator with a user-defined number of kVARH
per pulse. In this mode, both forward and reverse energy are treated as additive (as in a tie
breaker). The KYZ Pulse Initiator relay output was designed for pulse applications such as this.
6. kVAH Pulse.
This mode assigns the relay to operate as a pulse initiator with a user-defined number of kVAH per
pulse. Since kVA has no sign, there is only one mode for kVAH pulse. The KYZ Pulse Initiator relay
output was designed for pulse applications such as this.
© 1996 Square D All Rights Reserved
47
Bulletin 3080IM9601
7. kWH In Pulse.
This mode assigns the relay to operate as a pulse initiator with a user-defined number of kWH per
pulse. In this mode, only the kWH flowing into the load is considered. The KYZ Pulse Initiator relay
output was designed for pulse applications such as this.
8. kVARH In Pulse.
This mode assigns the relay to operate as a pulse initiator with a user-defined number of kVARH
per pulse. In this mode, only the kVARH flowing into the load is considered. The KYZ Pulse Initiator
relay output was designed for pulse applications such as this.
9. kWH Out Pulse.
This mode assigns the relay to operate as a pulse initiator with a user-defined number of kWH per
pulse. In this mode, only the kWH flowing out of the load is considered. The KYZ Pulse Initiator
relay output was designed for pulse applications such as this.
10. kVARH Out Pulse.
This mode assigns the relay to operate as a pulse initiator with a user-defined number of kVARH
per pulse. In this mode, only the kVARH flowing out of the load is considered. The KYZ Pulse
Initiator relay output was designed for pulse applications such as this.
Setting Up Analog Inputs
You’ll configure analog inputs in the Analog Inputs box on the I/O Module tab. If the
I/O module you are configuring does not have any analog inputs, the fields in this box
will be greyed out.
Important: Any change to either analog inputs or analog outputs will cause the circuit monitor
to restart. Be aware that any energized relay outputs will de-energize as the circuit monitor
restarts.
To set up an analog input, follow these steps:
1. In the Analog Inputs box, select the analog input to configure, from the drop-down
list box.
2. Select either the 0–5V or 4–20mA radio button. The button you select depends on
how the selected analog input is wired. (Refer to the Series 2000 Circuit Monitor
instruction bulletin for wiring instructions.)
• 0–5V (or other mA external resistor). By default, the circuit monitor’s analog inputs
accept 0–5 volts dc. The phrase “or other mA external resistor” means that you could
apply, for example, a 0–1 mA signal through 5000 ohms of resistance to obtain 0–5
volts.
• 4–20 mA (jumper 250 ohm internal resistor). The 4–20 mA option passes the input
current through a 250 ohm internal resistor resulting in a 1–5 volt dc signal measurement. A user-installed jumper wire is required on the rear of the I/O Module.
48
© 1996 Square D All Rights Reserved
Chapter 5—Advanced Series 2000 Circuit Monitor Setup
3. Enter values in the remaining fields as described in the Analog Inputs table, below.
Analog Inputs Table
At this field…
Do this…
Upper Limit
Enter the value you want SMS to report when the input voltage
is equal to or greater than 5 volts (the maximum input voltage).
Lower Limit
Enter the value you want SMS to report when the input voltage
is equal to the offset voltage, defined below.
Offset Voltage
Enter the lowest input voltage (in hundredths of a volt) that
represents a valid reading. When the input voltage falls below
this value, SMS reports “N/A.”
Precision
Select the desired precision—units, tenths, hundredths, or
thousandths—from the drop down list box.
Units
Enter up to six characters that describe the units of the
monitored analog value (for example, PSI or Deg. C).
© 1996 Square D All Rights Reserved
49
Bulletin 3080IM9601
Analog Input Example
The figure below shows an analog input example. In this example, the analog input has
been configured as follows:
Input Type
Upper Limit
Lower Limit
Offset Voltage
Precision
Units
0–5V
500
100
1 Volt
Units
PSI
The figure below shows the analog input configured as described above.
Circuit Monitor
Reading
( Upper
Limit )
500 PSI
( Lower
)
Limit
100 PSI
5V
1V
Offset
(Voltage
)
Input
Voltage
Input Voltage )
( Maximum
Not User-Definable
The table below shows circuit monitor readings at various input
voltages.
50
Input Voltage
Analog Inputs 2000 Table Reading
0.5 V
N/A (below offset voltage)
1V
100 PSI
2V
200 PSI
2.5 V
250 PSI
5V
500 PSI
5.5 V
500 PSI (above max input voltage)
© 1996 Square D All Rights Reserved
Chapter 5—Advanced Series 2000 Circuit Monitor Setup
Setting Up Analog Outputs
You will configure analog outputs in the Analog Outputs box on the I/O Module tab.
The outputs are either 0–1 mA or 4–20 mA depending on the I/O Module type. SMS
shows the output type in the upper left corner of the I/O module tab. If the
I/O module you are configuring does not have analog outputs, the fields in this box will
be greyed out.
Important: Any change to either analog inputs or analog outputs will cause the circuit monitor
to restart. Be aware that any energized relay outputs will de-energize as the circuit monitor
restarts.
The procedure below tells how to set up analog outputs. An analog output example
follows.
To set up an analog output, follow these steps:
1. In the Analog Outputs box, select the analog output to configure, from the dropdown list box.
2. Check the Enabled checkbox to enable the selected analog output.
3. Enter values in the remaining fields as described in the Analog Outputs table, below.
Analog Outputs Table
At this field…
Do this…
Upper Limit
Enter the register value that is equivalent to the maximum
output current (1 mA or 20 mA).
Lower Limit
Enter the register value that is equivalent to the minimum
output current (0 mA or 4 mA).
Register
Enter the number of the register for which you are creating an
analog output. For example, enter 1001 for Frequency. See the
circuit monitor instruction bulletin for a register listing.
© 1996 Square D All Rights Reserved
51
Bulletin 3080IM9601
Analog Output Examples
The figure below illustrates the relationship between the output range and the upper
and lower limit. In this example, the analog output has been set up as follows:
Output Range➀
0–1 mA or 4–20 mA
Register Number
1042 (Real Power, 3-phase total)
Lower Limit
100 kW
Upper Limit
500 kW
➀ The Output range depends on the type of I/O module installed.
The figure below shows the relationship between the output range and the upper and
lower limit for a 0–1 mA I/O Module.
Output
Current
Maximum
(Output
Current ) 1 mA
Minimum
(Output
Current )
0 mA
100 kW
500 kW
( Lower
Limit )
( Upper
Limit )
Real Power, 3-Phase
Total (from register 1042)
The table below shows the output current at various register readings for a 0–1 mA
I/O Module.
52
Register Reading
Output Current
50 kW
0 mA (below lower limit)
100 kW
0 mA
200 kW
0.25 mA
300 kW
0.5 mA
500 kW
1 mA
550 kW
1 mA (above upper limit)
© 1996 Square D All Rights Reserved
Chapter 5—Advanced Series 2000 Circuit Monitor Setup
The figure below shows the relationship between the output range and the upper and
lower limit for a 4–20 mA I/O Module.
Output
Current
Maximum
(Output
Current ) 20 mA
Minimum
(Output
Current ) 4 mA
100 kW
500 kW
( Lower
Limit )
( Upper
Limit )
Real Power, 3-Phase
Total (from register 1042)
The table below shows the output current at various register readings for a 4–20 mA
I/O Module.
Register Reading
Output Current
50 kW
4 mA (below lower limit)
100 kW
4 mA
200 kW
8 mA
300 kW
12 mA
500 kW
20 mA
550 kW
20 mA (above upper limit)
© 1996 Square D All Rights Reserved
53
Bulletin 3080IM9601
Setting Up On-Board Data Storage
You’ll use the On-Board Data Storage tab (shown below) in the Series 2000 Circuit
Monitor Device Setup dialog box to set up circuit monitor on-board memory including
the circuit monitor’s event log, waveform capture logs, and data logs. (Only circuit
monitor models CM-2150 and higher are equipped with on-board storage.)
Note: SMS must be online to your system to set up On-Board Data Storage. If SMS is not
online, the On-Board Data Storage tab is grayed out. Also, we recommend that you put SMS in
manual update mode while you set up on-board data storage.
If you are not already viewing the On-Board Data Storage tab, follow these steps to
display the tab:
1. On the Setup menu, click Devices/Routing...
SMS displays the Device Setup dialog box.
2. In the Devices box, click a Series 2000 Circuit Monitor (model
CM-2150 or higher), then click the Configure button.
3. Click the On-Board Data Storage tab.
Circuit Monitor Storage Considerations
The amount of memory available for storing events, waveform captures, and historical
data on-board the circuit monitor depends on the circuit monitor model. When you set
up a circuit monitor’s on-board storage, you must allocate the available memory among
54
© 1996 Square D All Rights Reserved
Chapter 5—Advanced Series 2000 Circuit Monitor Setup
the event log, waveform capture logs, and data logs. SMS has two tools that can help as
you set up the circuit monitor’s on-board storage:
• Allocated Memory Color Bar Indicator
• Memory Usage Summary
As you enter values in the On-board Data Storage dialog box, the Allocated Memory
Color Bar Indicator changes to show the percentage of the circuit monitor’s memory that
has been allocated.
The colors in the bar show how the allocated memory is divided among the different log
file types (event, waveform, and data logs) and the portion of the circuit monitor
memory still available.
Bar Color
blue
red
green
black
Indicates the allocated device memory…
Used by the event log
Used by the data logs
Used by the waveform capture logs
Still available
To display the Memory Usage Summary, click the Memory Usage Summary button at
the bottom of the On-board Data Storage tab. The Memory Usage Summary dialog box
contains two tabs:
• Calculated—The Calculated tab shows how the memory allocation choices you’ve
made on the Onboard Data Storage tab will affect memory usage if you choose to
update the circuit monitor. SMS does not send the memory allocation information to
the circuit monitor until you either click Update, or click Close and save the changes.
You can use the Calculated tab to try different memory allocation scenarios before
you update the circuit monitor.
• Actual—The Actual tab shows how the circuit monitor’s memory is presently allocated.
The Calculated and Actual tabs display the following information:
• Status of each file
• Number of records allocated to each file
• Number of registers used by the allocated records
• Percentage of the circuit monitor’s total available memory that is used by each log file
• Percentage of the circuit monitor’s total available memory that is used by all log files
© 1996 Square D All Rights Reserved
55
Bulletin 3080IM9601
Setting Up the Circuit Monitor On-Board Event Log
Each Series 2000 Circuit Monitor (model CM-2150 and higher) has an on-board event log
to record the occurrence of important events. The circuit monitor can be configured to
log the occurrence of any on-board alarm condition as an event. The section “Setting Up
On-Board Alarms/Events” later in this chapter tells how to set up the circuit monitor to
log the occurrence of on-board alarm conditions in the event log.
You’ll set up the circuit monitor’s on-board event log in the Event Log box in the Series
2000 Circuit Monitor On-Board Data Storage dialog box. The number of events the
circuit monitor can store depends on how you allocate the available memory among the
event log, waveform capture logs, and data logs. Refer to the Allocated Memory Color
Bar indicator and the Memory Usage Summary to ensure that you don’t exceed the
available memory.
To set up the event log, follow these steps:
1. In the Events box, enter the maximum number of events that the event log will store.
2. Select either the FIFO (recommended) or Fill/Hold radio button to specify the way
the event log file will store information.
The FIFO (First-In-First-Out) mode stores information continuously and overwrites
the oldest data with the newest data after the maximum has been reached. The Fill/
Hold mode stores new events until the event log file reaches the maximum number
of events; it then stops storing new events until you clear the event log using the
Resets command on the Control menu.
Setting Up the Circuit Monitor On-Board Waveform Capture Logs
The model CM-2250 circuit monitor stores one 4-cycle and one 12-cycle waveform
capture in volatile memory. (Volatile memory means that the waveforms are lost when
the circuit monitor loses control power.) Circuit monitor models CM-2350 and higher
can store multiple waveform captures (from 4 to 60 cycles in length) in non-volatile
memory.
You’ll set up the circuit monitor’s on-board waveform capture logs in the Waveform
Capture Logs box in the Series 2000 Circuit Monitor On-Board Data Storage dialog box.
Keep in mind that the number of waveforms the circuit monitor can store depends on
how you allocate the available memory among the event log, waveform capture logs,
and data logs. Refer to the Allocated Memory Color Bar indicator and the Memory
Usage Summary to ensure that you don’t exceed the available memory.
56
© 1996 Square D All Rights Reserved
Chapter 5—Advanced Series 2000 Circuit Monitor Setup
To set up the Waveform Capture Logs, follow these steps:
1. In the 4-Cycle Captures box, enter the maximum number of 4-cycle waveforms to
store. Then click either the FIFO or Fill/Hold radio button.
If you select FIFO, the circuit monitor logs 4-cycle waveforms until it reaches the
maximum number of 4-cycle waveforms; then, each time it logs a new 4-cycle waveform, it discards the oldest 4-cycle waveform and logs the new. If you select Fill/
Hold, the circuit monitor logs 4-cycle waveforms until it reaches the maximum; it
stops storing new 4-cycle waveforms until you clear the log using the Resets command on the Control menu.
2. In the Type box, select the type of extended waveform capture to log—12-, 24-, 36-,
48-, or 60-cycle. Select the number of extended captures. Then click FIFO or Fill/Hold.
Setting Up the Circuit Monitor On-Board Data Logs
Circuit monitor models CM-2150 and higher can store historical data in on-board data
log files. You can set up the circuit monitor to log data at a user-defined interval. In
addition, you can set up the circuit monitor to automatically force entries into the data
logs when alarm conditions occur; the section “Setting Up On-Board Alarms/Events”
later in this chapter tells how.
You’ll set up the circuit monitor’s on-board data logs in the Data Logs box in the Series
2000 Circuit Monitor On-Board Data Storage dialog box. Keep in mind that the amount
of data the circuit monitor can store depends on how you allocate the available memory
among the event log, waveform capture logs, and data logs. Refer to the Allocated
Memory Color Bar indicator and the Memory Usage Summary to ensure that you don’t
exceed the available memory.
The circuit monitor supports up to 14 data log files. You can use several data log files to
help you organize logged data. For example, you could log current and voltage values
in Log 1, power and energy values in Log 2 , and power quality values in Log 3. (See
“Organizing Data Log Files” following this section for more tips.)
For each circuit monitor, you must assign a log template to each data log you set up. A
log template defines the quantities to be logged, start and end dates and times, and log
interval. You can choose from the available predefined templates, or define your own.
© 1996 Square D All Rights Reserved
57
Bulletin 3080IM9601
Click the Log Templates button to display the dialog box used to define log templates.
This is the same dialog box you’ll use to define log templates for devices that do not
have on-board logging capabilities, such as series 100/200 circuit monitors. “Chapter
9—Data Logging” offers detailed instructions on how to create log templates.
SMS can automatically retrieve the data from circuit monitors’ on-board data log files
and store it in the SMS database on your computer’s hard disk. To allow SMS to do this,
you must create an Onboard Data Log Upload task for each circuit monitor and schedule
it to upload data at the desired interval. The Onboard Data Log Upload task combines
the data logged by the circuit monitor with the data logged by SMS so that you can view
the data in history tables and as time trend plots. For devices that do not have on-board
logging capabilities, such as series 100/200 circuit monitors, you will need to set up SMS
to log data directly to the SMS database. See “Chapter 9—Data Logging” for instructions
on how to set up data logging for devices that do not have on-board logging capabilities.
See “Chapter 7—Using Tasks to Automate Processes” for instructions on how to create
and schedule an Onboard Data Log Upload task.
To set up a data log, follow these steps:
1. In the list of data logs (Log 1–Log 14), click a data log to set up.
2. In the Selected Template box, click a log template to assign to the data log, or if you
want to define a new log template, click the Log Templates button. (See “Creating
Log Templates” in Chapter 9 for instructions on defining log templates.)
3. If you want to define a task that automatically retrieves data from the circuit
monitor’s on-board data log files and combines it with the SMS database, click the
Automatic Upload button. See “Chapter 7—Using Tasks to Automate Processes” for
instructions on creating and scheduling an Onboard Data Log Upload task.
4. In the Log Interval box, enter the number of minutes, from 0–1440, between log entries.
5. Click either the FIFO (recommended) or Fill/Hold radio button.
If you select FIFO, the circuit monitor logs data until it reaches the maximum number
of records; then, each time it logs a new record, it discards the oldest record and logs
the new. If you select Fill/Hold, the circuit monitor logs data until it reaches the
58
© 1996 Square D All Rights Reserved
Chapter 5—Advanced Series 2000 Circuit Monitor Setup
maximum; it then stops logging new data until you clear the data log using the
Resets command on the Control menu.
6. Check the Enabled checkbox to enable the selected data log.
When the Enabled box is checked, the circuit monitor begins logging data at the date
and time specified in the log template. The circuit monitor will not log data to the
selected data log unless the Enabled box is checked. Note: The date and time are
7. In the Records box, enter the maximum number of records (from 1 to 472) to be
stored in the selected data log.
A record is one set of the quantities that are specified in the log template. For example, assume a log template is set up to begin logging current and voltage values
hourly, beginning at 8:00 AM the following day. At 8:00 AM, the circuit monitor logs
the current and voltage values—record 1. At 9:00 AM, the circuit monitor logs the
second set of current and voltage values—record 2. The circuit monitor continues
logging records of data at the specified interval until it reaches the maximum number
of records that you specify. When it reaches the maximum, it either stops logging
new data (if you selected Fill/Hold in step 4) or continues logging by discarding the
oldest record and storing the newest (if you selected FIFO).
Organizing Data Log Files
There are many ways to organize data log files. One possible way is to organize log files
according to the logging interval. You might also define a log file for entries forced by
alarm conditions. For example, you could set up four data log files as follows:
Data Log 1:
Voltage logged every minute. File is large enough to hold 60 entries so
you can look back over the last hour’s voltage readings.
Data Log 2:
Voltage, current, and power logged hourly for a historical record over
a longer period.
Data Log 3:
Energy logged once daily. File is large enough to hold 31 entries so you
can look back over the last month and see daily energy use (kilowatt
hours, for example).
Data Log 4:
Report by exception file. File contains data log entries that are forced
by the occurrence of an alarm condition. Set the log interval in the log
template to zero for this purpose.
The Default Logging Template
Series 2000 circuit monitors that have on-board logging memory are shipped with data
log 1 pre-configured and enabled to log basic metered values. SMS is shipped with a
default logging template named Basic Values that matches the circuit monitor’s default
data log 1 configuration. Therefore, in order to import basic values from circuit monitors
into SMS, you need only define an auto upload task to get data log 1 from the circuit
monitors. See “Creating a New CM2000 Onboard Data Log/Waveform Upload Task” in
Chapter 7 for instructions on defining a task to automatically retrieve on-board data logs.
© 1996 Square D All Rights Reserved
59
Bulletin 3080IM9601
Setting Up On-Board Alarms/Events
Series 2000 circuit monitors (models CM-2150 and higher) can detect over 100 alarm
conditions, including over/under conditions and status input changes. The circuit
monitor can perform actions in response to these alarm conditions. The available
actions are:
• Force data log entries in up to 14 circuit monitor data log files
• Operate one or more mechanical relays
• Perform a 4-cycle waveform capture (CM-2250 and higher)
• Perform an extended (12-, 24-, 36-, 48-, or 60-cycle) waveform capture (CM-2250
and higher)
The Onboard Alarms/Events tab of the Series 2000 Circuit Monitor device setup dialog
box is used to set up the circuit monitor’s onboard alarms. On this tab you’ll enable the
desired alarm conditions, assign a priority level to each, define pickup and dropout
setpoints, and assign actions to be executed when the alarm condition occurs.
Notes:
• SMS must be online to your system to perform Onboard Alarm/Event setup. If SMS is not
online, the Onboard Alarms/Events tab is grayed out.
• By default, SMS checks for onboard alarms at 60 second intervals. You can change the
Onboard Alarm Check interval using the SMS configuration program, called Smscfg. For
instructions on using Smscfg to change the Onboard Alarm Check Interval, see “Changing
the Onboard Alarm Check Interval” at the end of this chapter.
Important: When you make any changes to the circuit monitor’s on-board alarms, the circuit
monitor restarts when you exit online setup. Be aware that any energized relay outputs will deenergize as the circuit monitor restarts.
If you are not already viewing the Onboard Alarm/Events tab, follow these steps to
display the tab:
1. On the Setup menu, click Devices/Routing...
SMS displays the Device Setup dialog box.
2. In the Devices box, select a Series 2000 Circuit Monitor (model CM-2150 or higher),
then click the Configure button.
3. Click the Onboard Alarms/Events tab.
60
© 1996 Square D All Rights Reserved
Chapter 5—Advanced Series 2000 Circuit Monitor Setup
To set up an alarm condition, follow these steps:
1. In the Alarm/Event Condition box, click the number of the alarm condition to set up.
SMS updates the dialog box to show the current settings for the selected alarm
condition.
2. Enter information on the Onboard Alarms/Events tab as described in the Onboard
Alarm Events Tab table on the next page.
© 1996 Square D All Rights Reserved
61
Bulletin 3080IM9601
Onboard Alarms/Events Tab
At this field…
Do this…
Enable
Check this box to enable the selected alarm condition, or uncheck this box to disable the
alarm condition. When the Enable check box is first checked, the prefix “[enab]” and an
asterisk (*) appear in the Enabled column next to the selected alarm condition. When you
disable a previously enabled alarm condition, the [enab] prefix disappears, but the asterisk
stays to indicate that changes were made to the alarm condition during the setup session.
Priority
Click a radio button to Select a priority (0, 1, 2, or 3) for the selected alarm condition. The
priority levels 1, 2, 3, and 0 correspond to High, Medium, Low, and Action Only. Refer to
the table below for a description of the operator notification provided by each priority level.
Note: Any priority level (including Priority 0) can trigger waveform captures, force data log
entries, and operate relay outputs. Priority level selection affects only the methods by
which the operator is informed that an alarm condition has occurred.
Pickup & Dropout
Setpoints/Delays
Priority 1
SMS
Software
Alarm
Operation
Level 1
SMS
Software
Event Log
Entry
Yes
Priority 2
Level 2
Yes
Priority 3
Priority 0
Level 3
No Alarm
Yes
No
Circuit
Monitor
Front Panel
Alarm LED
Operation
LED flashes upon
occurrence of event,
continues to flash
after event condition
clears until operator
clears the P1 Log
from the front panel
of the circuit monitor
LED flashes upon
occurrence of event,
stops flashing when
event condition clears
Same as Priority 2
No operation
Circuit
Monitor
On-Board
Event Log
Entry
Yes
Yes
Yes
No
For each alarm/condition that you set up, you must specify pickup and dropout
setpoints and delays. An analog alarm becomes active when the metered value exceeds
the setpoint for the specified pickup delay. The alarm becomes inactive when the
metered value falls below the dropout setpoint for the specified dropout delay. See
Appendix C
for a guide to entering pickup and dropout setpoints and delays.
Note: When defining pickup and dropout setpoints for high-speed alarms
(alarm numbers 200–214), be sure to define a reasonable hysteresis between the pickup
and dropout setpoints. If a reasonable hysteresis is not used, alarms might occur
continually. When the circuit monitor detects that this is happening, it may suspend the
operation of all high-speed alarms. If you suspect that the high-speed alarms have been
62
© 1996 Square D All Rights Reserved
Chapter 5—Advanced Series 2000 Circuit Monitor Setup
disabled, use SMS’s register read/write feature to read register 2038. If register 2038
contains a nonzero value, high-speed alarms have been disabled. To re-enable highspeed alarms, write a zero to register 2038, then go to the Onboard Alarms/Events tab in
the Device Setup dialog box and check the Enable checkbox for each high-speed alarm
that was disabled. To prevent them from being disabled in the future, change the pickup
and dropout setpoints on the high-speed alarms to include additional hysteresis.
Relative
For tracking high-speed events (numbered 201–214) that are available for the CM-2350
or higher, you can check the Relative box to provide an alarm. Each time the average
value is exceeded by the pickup percentage, an alarm occurs. The delay entered is in
cycles. The percent relative average is calculated over a five-metering-cycle interval.
This checkbox is only available for alarm conditions 201–214. For all other alarm
conditions it is grayed out.
PC Action…
Click this button to assign a task that automatically executes when the selected alarm
condition becomes true. See “Assigning a PC Action” on the next page for instructions.
Note: This button is only available when the Enable box is checked, and you’ve selected
priority 1, 2, or 3. If you select priority 0, the button is grayed out.
Force Data Log
Entries on Event
These 14 check boxes correspond to the circuit monitor’s 14 data logs. Check
the desired boxes for each alarm condition. Each time the alarm condition occurs, the
circuit monitor forces an entry into the checked data log files. This provides information
that helps characterize the circuit conditions at the time of the event.
Operate Relays
on Event
Check the desired relay(s). Each time the alarm condition occurs, the circuit
monitor operates (energizes) the specified relays. For example, you could check boxes
R1, R2, and R3 for the alarm condition Under Voltage Phase A. Each time the Under
Voltage Phase A condition occurs, the circuit monitor operates relays R1, R2, and R3.
These relays must be present on the device, enabled for on-board operation, and be in
normal, timed, or latched mode. (See “Setting Up Relay Outputs” in this chapter for
instructions on setting up circuit monitor relays.)
Note: For models CM-2350 and higher, you cannot configure high speed event numbers
201–214 to operate the same relays used for normal events.
Capture Waveforms Check the 4-Cycle checkbox if you want the circuit monitor to perform a 4-cycle
on Event
waveform capture each time the alarm condition occurs. Check the Extended checkbox
if you want the circuit monitor to perform an extended waveform capture—12, 24, 36, 48,
or 60 cycles—each time the alarm condition occurs. If you check the Extended
checkbox, you can enter the number of pre-event cycles (CM-2350 and higher only). The
number of pre-event cycles you enter applies to all extended waveforms captured by this
device. Only the high-speed input events and event numbers 201–214 use the pre-event
cycle selection and allow date/time stamping to the millisecond. For I/O modules IOM-18
and IOM-44, status input S2 is the high-speed input. For any of the four I/O modules with
analog I/O, all four status inputs, S1 through S4, are high-speed inputs.
Note: A CM-2250 can store only one 4-cycle and one 12-cycle waveform capture in
volatile memory. If the circuit monitor is a CM-2350 or higher, you can specify multiple
waveform captures in nonvolatile memory. See “Setting Up the Circuit Monitor On-Board
Waveform Capture Logs” in this chapter for instructions on setting up a waveform log file.
© 1996 Square D All Rights Reserved
63
Bulletin 3080IM9601
Assigning a PC Action
The PC Action button lets you assign a task to automatically execute when the selected
alarm condition becomes true. Note: By default, SMS checks for onboard alarms at 60 second
intervals. For instructions on using the SMS configuration program Smscfg to change the
Onboard Alarm Check Interval, see “Changing the Onboard Alarm Check Interval” below.
To assign a task to the selected alarm condition, follow these steps:
1. Click the PC Action button.
SMS displays the PC Action dialog box. SMS automatically assigns the alarm severity
level (1, 2, or 3) that matches the priority you selected in the Alarms Setpoints/
Delays box. To view or change the defined alarm severity level, click the Severity
button.
2. In the Tasks box, select the desired task.
To define a new task, or to view existing task definitions, click the Tasks button. SMS
displays the Tasks dialog box. See “Chapter 7—Using Tasks to Automate Processes”
for instructions on defining tasks.
3. Click OK.
SMS returns to the Onboard Alarms/Events tab.
Changing the Onboard Alarm Check Interval
By default, SMS checks for on-board alarms every 60 seconds. You can change the
Onboard Alarm Check interval using the SMS-3000 Configuration program. The
SMS-3000 Configuration program, called Smscfg, is located in the SMS-3000 directory on
the server machine.) To change the onboard alarm check interval, do the following:
1. Locate the Smscfg program in the SMS-3000 directory and start the program.
2. Click the Intervals tab.
3. In the Onboard Alarm Check box, enter the desired interval in seconds.
4. Click OK to save your changes and exit the configuration program.
64
© 1996 Square D All Rights Reserved
Chapter 6—Setting Up Functions and Alarms
Chapter 6—Setting Up Functions and Alarms
What are Alarms?
One of the System Manager software’s most powerful features is its ability to generate
alarms. Alarms are how SMS warns you that an event of interest has occurred in your
power system. You can define an alarm based on any quantity provided by your power
monitoring system. Here are a few examples:
Quantity
Alarm defined to…
Benefit
Current
Warn you of an overcurrent condition.
Prevent costly shutdowns and damage
to equipment.
Voltage unbalance
Warn you that phase voltages are
not balanced.
Voltage unbalance over 3% can cause
premature failure of induction motors.
Voltage
Warn you of an undervoltage condition Low voltage can make equipment more
susceptible to shutdown during voltage
sags.
Demand
Warn you of high peak demands.
Transformer Temperature
Warn you of overly high temperatures. Prevents transformer overloading and
damage
Circuit breaker status
Warn you that a circuit breaker
has tripped.
Enables you to quickly locate
a power problem and repair it.
Total harmonic distortion
Warns you of high levels of
harmonic distortion.
Can identify harmonic resonance
before fuse failures or capacitor can
ruptures occur.
Warn you in advance of peak demands
so that you can shed loads and avoid
costly peak demand charges.
Alarms are Based On Functions
Each alarm is based on one of two types of functions: analog or digital. You’ll define
analog functions when you want to define an alarm based on an analog quantity. Analog
quantities are expressed over a continuous range of values; current, voltage, temperature,
frequency, and pressure are examples of analog quantities. You’ll define digital functions
when you want to define an alarm based on a digital quantity. Digital quantities are
expressed in only two discrete states, for example on/off. Examples of digital quantities
include circuit breaker status (open or closed), cooling fan status (on or off), and the state
of a bit (0 or 1) in a register.
When you define an analog or digital function, you select a quantity, then define the
conditions under which SMS generates the alarm. For example, to define an alarm that
© 1996 Square D All Rights Reserved
65
Bulletin 3080IM9601
warns you of an overheating transformer, you would define an analog function that
specifies:
• the desired quantity—transformer temperature
• the alarm conditions (called pickup and dropout setpoints) —the temperature values
at which you want the alarm to become active and inactive, along with any desired
time delays
The General Alarm Setup Procedure
There are two general tasks you must complete to set up alarms. You’ll perform all
alarm setup tasks in the Functions Setup dialog box. You access the Functions Setup
dialog box by clicking Functions/Alarms on the Setup menu. The Functions setup
dialog box has two tabs—Functions and Function Assignment.
The two general tasks that you must complete to set up alarms are:
1. Create global analog and digital functions for a device type, such as the Series 2000
Circuit Monitor.
This is the heart of the alarm definition process. In this step you will choose the
quantities to alarm upon, define the setpoints, assign severity levels, and assign
tasks to execute when alarms occur. The section “Creating Global Functions” in this
chapter tells how.
2. Assign the global functions you created in step 1 to specific devices.
After you’ve created global functions for each device type, you must assign them to
specific devices in your system so that they can warn you of alarm conditions. The
section “Assigning Functions to Specific Devices” in this chapter tells how.
Note: It is important to understand the concept of global functions and how they are assigned
to specific devices. The next section “Understanding Global Functions” provides further
explanation.
66
© 1996 Square D All Rights Reserved
Chapter 6—Setting Up Functions and Alarms
Understanding Global Functions
The illustration below helps to clarify the concept of global functions. For the purpose of
clarity, the example POWERLOGIC system shown includes only three devices. Refer to
the illustration as you read the following points.
• When setting up functions for alarms, you first define global functions by device
type. In the illustration, the user has defined 13 global functions: 6 global functions
(3 analog and 3 digital) for the device type CM-2000, 4 for the device type Digital
Relay, and 3 for the device type PIF-3.
• Global functions are called global because you can assign a copy to any device (of the
correct device type) in the system. For example, in the illustration, the user could
assign a copy of the global function CM2 Analog 1 to any Series 2000 Circuit Monitor
in the system. If the system had three circuit monitors instead of one, the user could
assign the global function CM2 Analog 1 to one, two, or all three circuit monitors.
The global function offers tremendous time savings when setting up large systems.
Global Functions
CM-2000
Analog
You first define
global functions
per device type.
Digital Relay
Analog
PIF-3
Analog
CM2 Analog 1
DR Analog 1
PIF3 Analog 1
CM2 Analog 2
DR Analog 2
PIF3 Analog 2
CM2 Analog 3
Digital
CM2 Digital 1
CM2 Digital 2
Digital
Digital
DR Digital 1
PC
To create alarms
you must assign
copies of global
functions to
specific devices.
PIF-3
Fdr 2
Dig.
Relay
Fdr 1
CM
Main 1
PIF3 Analog 2
DR Analog 1
CM2 Analog 1
PIF3 Digital 1
DR Digital 1
CM2 Analog 2
DR Digital 2
CM2 Digital 2
PIF3 Digital 1
DR Digital 2
CM2 Digital 3
Copies of global functions assigned to specific
devices in your system. Once you’ve assigned these
copies, you can edit their setpoints and the original
global functions will not change.
© 1996 Square D All Rights Reserved
67
Bulletin 3080IM9601
• When you assign a global function to a specific device, SMS makes a copy of the
global function and associates it with the device. After you’ve assigned a copy, you
can edit the copy; the original global function will not change.
In the illustration, the user has assigned three functions to the device CM Main 1.
When the user assigned the functions (using the Function Assignment tab of the
Functions Setup dialog box) SMS made copies of the global functions. If the setpoints
of any copied function were not exactly right for the device CM Main 1, the user
could edit the copied function’s setpoints; the original global function’s setpoints
would not change. The section “Assigning Functions to Specific Devices” in this
chapter tells how to assign copies of global functions to specific devices, and how to
edit the copied functions’ setpoints.
Creating Global Functions
When you define functions, you first define global functions for a device type—for
example a Series 2000 Circuit Monitor. Later, you’ll choose from the list of global functions you’ve defined for that type of device, and assign functions to specific devices—
for example, the circuit monitor on Unit Substation Main 1. The section “Assigning
Functions to Devices” in this chapter tells how to assign functions to specific devices.
To create a new function, follow these steps:
1. On the Setup menu, click Functions/Alarms.
SMS displays the Functions Setup dialog box.
2. Click the Functions tab.
3. Click the Add button.
SMS displays the Functions Edit dialog box.
4. In the Device Types box, select the desired type of device.
5. Select the type of function: Analog or Digital.
68
© 1996 Square D All Rights Reserved
Chapter 6—Setting Up Functions and Alarms
6. If you’re creating an analog or digital function, click the desired quantity in the
Quantity list box. The Name defaults to the quantity name. Edit the name if desired.
If you wish to create a custom quantity, click Quantities. See “Defining Custom
Quantities” in Chapter 16 for instructions on creating a custom quantity.
7. Click OK.
SMS returns to the Functions tab and adds the new function name to the Functions
list.
Once you’ve completed the steps above to create a new function and assign the desired
quantity, you’re ready to define the function’s setpoints. The setpoints are the conditions
under which SMS generates alarms and executes tasks. For example, if you’ve defined
an analog function called Overcurrent Phase A so that you can monitor your Main 1
circuit breaker for abnormal current levels, you’ll need to define setpoints that define the
abnormal levels. In other words, just how high do you want the current to rise before
SMS activates an alarm to notify you.
Defining Setpoints for Analog Functions
After you have created an analog function (see “Creating Functions” above), you must
define its setpoints. The setpoints are the conditions under which SMS generates alarms
and executes tasks. The procedure below tells how to define setpoints for an analog
function. The section following this one shows an example analog function definition.
To define the setpoints for an analog function, follow these steps:
1. In the Functions Setup dialog box, click the Functions tab.
2. In the Functions box, click the desired analog function, then click Setpoints.
SMS displays the Analog Setpoint Edit dialog box.
For each analog function, there are five conditions: highest, high, normal, low, and
lowest. You can define condition settings for each of the five conditions, although you
cannot enter pickup and dropout setpoints and delays for the Normal condition. You
are not required to define condition settings for all five conditions; for example, you
may only want to define settings for the High and Low conditions.
3. In the Condition box, click the desired condition.
4. Enter the desired settings in the Condition Settings box as described in the Analog
Function Condition Settings table on the next page.
5. Repeat steps 3 and 4 for the desired conditions. When you’ve finished defining
settings for each of the conditions, click Close.
© 1996 Square D All Rights Reserved
69
Bulletin 3080IM9601
At this field …
Analog Function Condition Settings Table
Do this…
Name
Enter a descriptive name for the selected condition. For example, if you’ve
defined an analog function based on Phase A Voltage, you might name the
Highest condition “Phase A Overvoltage.”
Pickup
Enter the level at which the condition becomes true. The High and Highest
conditions become true when the metered value equals or exceeds the pickup
level for the time specified in the Pickup Delay box. The Low and Lowest
conditions become true when the metered value equals or falls below the
pickup level for the time specified in the Pickup Delay box. The pickup level
does not apply to the Normal condition.
Pickup Delay
SMS multiplies the number you enter in the Pickup Delay box by the number of
seconds in the Poll Interval box to determine how long the metered value must
equal or exceed the Pickup setpoint before the selected Condition becomes
true. For example, assume that you are defining setpoints for the High condition. If the Poll Interval = 10 seconds, and the Pickup Delay = 2, the metered
value must equal or exceed the Pickup setpoint for a full 20 seconds before the
High condition becomes true.
Dropout
Enter the level at which the selected condition ceases to be true. The High and
Highest conditions cease to be true when the metered value equals or falls
below the dropout level for the time specified in the Dropout Delay box. The
Low and Lowest conditions cease to be true when the metered value equals or
exceeds the dropout level for the time specified in the Dropout Delay box. The
dropout level does not apply to the Normal condition.
Dropout Delay
SMS multiplies the number you enter in the Dropout Delay box by the number
of seconds in the Poll Interval box to determine how long the metered value
must equal or fall below the Dropout setpoint before the selected Condition is
no longer true. For example, assume that you are defining setpoints for the
High condition. If the Poll Interval = 10 seconds, and the Dropout Delay = 2, the
metered value must equal or fall below the Dropout setpoint for a full 20
seconds before the High condition returns to Normal.
Severity
Click to assign an alarm severity level (from 0 to 9) to the selected condition.
When the selected condition becomes true (that is, when the Pickup setpoint
70
© 1996 Square D All Rights Reserved
Chapter 6—Setting Up Functions and Alarms
and delay have been satisfied) SMS generates an alarm. If you do not want the
software to generate an alarm when the condition becomes true, click No
Alarm. The manner in which SMS notifies you of an alarm—for example, visual,
audible, and so on—depends on the severity level you choose. To edit the
severity levels, click the Severity button. System
Manager displays the Severity dialog box. See “Setting Up Alarm Severity
Levels” in this chapter for instructions on editing severity levels.
Annotation
Click this button to attach an annotation to the alarm. A user can read the
annotation when viewing the active alarms list. You might use this feature to
record written instructions that an operator could follow when an alarm occurs.
Tasks
Select a task if you want SMS to execute the task when the monitored value
exceeds the Pickup setpoint and Pickup delay. Choose from the list of predefined tasks, or click the Task pushbutton to create a new task. For instructions on creating tasks, see “Chapter 7—Using Tasks to Automate Processes.”
Poll Interval
Enter a poll interval (in seconds) at which SMS will check for the alarm
condition. You can enter unique poll intervals for each function. The poll interval
is also used in calculating delays; see the descriptions of Pickup Delay and
Dropout Delay above. To enter a poll interval at least one condition must be set
to an alarm level other than “No Alarm.” Note: If you do not enter a poll interval,
SMS will not check for alarms. A function with no poll interval is useful only for
control outputs and for use with the Interactive Graphics software.
Analog Function Example
Assume that you have a circuit monitor equipped with an analog input/output module.
One analog input is monitoring the fluid level in a tank. If the fluid level in the tank
rises too high, there is danger of a spill. If the fluid level falls too low, there is risk of
damage to equipment.
You want SMS to generate alarms that warn you of dangerously high or low fluid levels,
so you define an analog function called “Tank Level.” In the Analog Setpoints Edit
dialog box, you define condition settings for each condition. The table on the next page
shows the values you enter.
The five condition levels allow you to set up alarms that warn you before the tank level
becomes critically high or low (using the high and low condition levels), and when the
tank level is critically high or low (using the highest and lowest condition levels).
Your plant operator asks you to explain what you’ve done. You offer the following
explanation:
When the fluid level in the tank rises above 32 feet (the Tank High pickup level) and remains
above 32 feet for 20 seconds (the Tank High pickup delay), SMS generates a level 5 alarm and
logs the alarm in the alarm log. If the fluid level continues to rise and exceeds 38 feet (the Spill
Imminent pickup level) and remains above 38 feet for 10 seconds (the Spill Imminent pickup
© 1996 Square D All Rights Reserved
71
Bulletin 3080IM9601
delay) SMS generates a level 1 alarm, logs the alarm in the alarm log, and executes the task
E-mail Boss, which automatically sends an e-mail message to the plant operations manager
warning him of the dangerously high fluid level.
When the fluid level in the tank drops below 22 feet (the Tank Low pickup level) and remains
below 22 feet for 20 seconds (the Tank Low pickup delay), SMS generates a level 5 alarm and logs
the alarm in the alarm log. If the fluid level continues to drop and falls below 16 feet (the Critically Low pickup level) and remains below 16 feet for 10 seconds (the Critically Low pickup
delay) SMS generates a level 1 alarm, logs the alarm in the alarm log, and executes the task
E-mail Boss.
To clarify, you draw the sketch on the following page.
Analog Function Name
Tank Level
Condition Settings
Condition
Condition Name
Pickup
Pickup
Delay
Dropout
Dropout
Delay
Alarm
Task
Poll
Interval
Highest
Spill Imminent
38
2
36
2
Level 1
E-mail Boss
5
High
Tank High
32
4
30
0
Level 5
None
5
Normal
Level OK
n/a
n/a
n/a
n/a
No Alarm
None
Low
Tank Low
22
4
24
0
Level 5
None
5
Lowest
Critically Low
16
2
18
2
Level 1
E-mail Boss
5
72
© 1996 Square D All Rights Reserved
Chapter 6—Setting Up Functions and Alarms
10 sec.
40
10 sec.
Highest Pickup
Highest Dropout
20 sec.
High Pickup
High Dropout
Tank
Level
Low Pickup
20
Lowest Pickup
10
Level OK
Tank High
Alarm Logged
Level 5 Alarm
Spill Imminent
Alarm Logged
Level 1 Alarm
E-Mail Boss
Tank High
Level OK
Alarm Logged
Level 5 Alarm
Time
Analog Function Tank Level Example
© 1996 Square D All Rights Reserved
73
Bulletin 3080IM9601
Defining Setpoints for Digital Functions
After you have created a digital function (see “Creating Functions” earlier in this
chapter), you must define its setpoints. The setpoints are the conditions under which
SMS generates alarms and executes tasks. The procedure below tells how to define
setpoints for a digital function. An example digital function definition follows.
To define the setpoints for a digital function, follow these steps:
1. In the Functions Setup dialog box, click the Functions tab.
2. In the Functions box, click the desired digital function, then click Setpoints.
SMS displays the Digital Setpoint Edit dialog box.
3. Enter the desired settings in the dialog box.
See the Digital Function Setpoint table on the next page for a description of each item
in the dialog box.
Note: If you defined the function using a pre-defined digital quantity, the Equal
condition is true when the monitored bit is On (bit = 1), and the Non-Equal condition
is true when the monitored bit is Off (bit = 0). If you defined the function using a
digital custom quantity, the Equal condition is true when the bits in the monitored
register match (are equal to) the bitmap you defined when creating the custom
quantity. For example, assume that you‘ve defined the custom quantity bitmap
as follows:
74
© 1996 Square D All Rights Reserved
Chapter 6—Setting Up Functions and Alarms
When bit 0 of the monitored register = 1, the Equal condition is true. When bit 0 = 0,
the Non-Equal condition is true. If you had set the bitmap as shown below, then
when bit 0 = 0, the Equal condition would be true. When bit 0 = 1, the Non-Equal
condition would be true.
Note: The time delay must also be satisfied before a condition becomes true. See the
description of Delay in the table below.
4. When you’ve finished defining settings, click close.
At this field…
Digital Function Setpoint Table
Do this…
Name
Enter descriptive names for the Equal and Non-Equal conditions. For example,
if you’ve chosen the quantity “Input 1 Status,” and input 1 monitors the status of
a cooling fan, you might assign the name “Fan On” to the Equal condition, and
the name “Fan Off” to the Non-Equal condition.
Delay
SMS multiplies the number you enter in the Delay box by the number of
seconds in the Poll Interval box to determine the time delay before a condition
becomes true. For example, if the Poll Interval = 10 seconds, and the Delay =
2, the Equal condition will be true only after the bit(s) in the monitored quantity
are in the Equal state for a full 20 seconds.
Poll Interval
Enter a poll interval (in seconds) at which SMS will check the state of the bit.
The poll interval is also used in calculating the delay. See the description of
Delay above. The default poll interval is 10 seconds.
Severity
Click to assign an alarm severity level (from 0 to 9) to the selected condition.
When the selected condition becomes true—that is when the bit is in the
desired state for the specified time delay—SMS generates an alarm. If you do
not want the software to generate an alarm when the condition becomes true,
click No Alarm. The manner in which SMS notifies you of an alarm—for example, visual, audible, and so on—depends on the severity level you choose.
To edit the severity levels, click the Alarms button. SMS displays the Alarms
dialog box. See “Setting Up Alarm Severity Levels” in this chapter for instructions on editing severity levels.
Annotation
Click this button to attach an annotation to the alarm. A user can then read the
annotation when viewing the active alarms list. You might use this feature to
record written instructions that an operator could follow when an alarm occurs.
Tasks
Select a task if you want SMS to execute the task when the condition becomes
true. Choose from the list of predefined tasks, or click the Tasks button to
create a new task. For instructions on creating tasks, see “Chapter 7—Using
Tasks to Automate Processes.”
© 1996 Square D All Rights Reserved
75
Bulletin 3080IM9601
Setting Up Alarm Severity Levels
Follow these steps to set up alarm severity levels:
1. In the Analog Setpoint Edit or Digital Setpoint Edit dialog box, click the Severity
button.
SMS displays the Severity dialog box.
2. Enter alarm information for up to ten levels as described in the Alarm Level table below.
For each severity level, there are six characteristics that you can apply. To select a
characteristic, click the corresponding checkbox or choose from the drop down list box.
Alarm Level table
76
At this field…
Do this…
Audible
Check this box to make the PC sound when the alarm occurs. The sound alerts
the user to examine the Alarms List window. A sound can be any wave file (.wav).
Select a specific sound from the Sound list box, described below.
Visible
Check this box to make the Active Alarms window display when an alarm occurs.
If the Active Alarms window is reduced to an icon, the icon will flash. To assign a
color to the text that appears in the Active Alarms entry, select a color from the
Color drop down list box, described below.
Acknowledge
Check this box to force the user to respond to the alarm. When an alarm occurs,
the Alarm Acknowledgment window displays. To clear the window, the operator
must acknowledge each alarm in the list. The Alarm Log lists the date, time, and
user name of the user who acknowledges an alarm.
Password
Check this box to force the operator to enter a password to acknowledge the
alarm.
Color
Click the color that you want the alarm entry to be in the Active Alarms and Alarm
Acknowledgment windows. To add colors, click the Color button.
Sound
Click the sound that you want to hear when the alarm occurs. To add a sound,
click the Sound button and select a wave (.wav) file. Note: We recommend that
you select sounds that are short because the next alarm in not annunciated until
the current alarm’s sound has finished.
© 1996 Square D All Rights Reserved
Chapter 6—Setting Up Functions and Alarms
Assigning Functions to Specific Devices
After you’ve defined global functions for a device type such as a circuit monitor, you
must assign those functions to specific devices in the system—for example, the circuit
monitor on unit substation 1’s main circuit breaker. This concept is explained in greater
detail in the section “Understanding Global Functions” at the beginning of this chapter.
To assign functions to a device, follow these steps:
1. On the Setup menu, click Functions/Alarms….
2. Click the Function Assignment tab.
3. In the Devices box, click the desired device.
All global functions that you have defined for the selected device type appear in the
Functions Available box (under the groupings Analog and Digital). For example, if
the selected device is a Series 2000 Circuit Monitor, only the analog and digital
functions that you have defined for the device type Series 2000 Circuit Monitor
appear in the Functions Available box.
4. In the Functions Available box, click a function that you want to assign to the selected
device, then drag it to the Functions Selected box, or use the > button.
5. Repeat step 4 to assign additional functions to the selected device.
Editing a Function After You’ve Assigned It to a Device
When you choose a global function from the Functions Available box and assign it to a
specific device, SMS makes an exact copy of the function and associates it with the
selected device. The functions that appear in the Functions Selected box are copies of the
global functions. Because they are copies, you can edit their setpoints without affecting
the original global function.
© 1996 Square D All Rights Reserved
77
Bulletin 3080IM9601
For example, you could assign an analog function called “Overcurrent Phase A” to the
device called “Assmbly CM1.” You could then select the “Overcurrent Phase A” function in the Functions Selected box and edit its setpoints. The changes you make to the
function affect only the copy of the Overcurrent Phase A function that is assigned to the
device Assmbly CM1; the global Overcurrent Phase A function (which appears in the
Functions Available box) remains unchanged. To edit the global Overcurrent Phase A
function, you must go to the Functions tab of the Functions Setup dialog box, since that
is where you defined the original global function. You must then reassign the edited
global function to each device that you want the global function copied to.
To edit the copy of a function after you’ve assigned it to a specific device:
1. On the Function Assignment tab, click the desired device in the Devices box.
The functions that you’ve assigned to the selected device appear in the Functions
Selected box.
2. In the Function Selected box, click a function to edit.
3. Click the Setpoints button.
SMS displays the Setpoints Edit box.
4. Make the desired changes to the setpoints and click OK.
78
© 1996 Square D All Rights Reserved
Chapter 7—Using Tasks to Automate Processes
Chapter 7—Using Tasks to Automate Processes
A task is an automated process that SMS executes. (The Task feature replaces the Macro
feature in earlier versions of SMS.) There are two ways that tasks can be executed:
• Tasks can be launched by an alarm condition.
For example, you could define a task called “GetCMlog” that retrieves the on-board
log files from a circuit monitor and combines them with the SMS
database on your PC’s hard disk. You could then define a function that generates an
alarm and launches the task Getcmlog each time the circuit monitor has an
overcurrent alarm.
• Tasks can be scheduled to execute automatically at a user-defined time.
For example, you might create a scheduled task that automatically performs resets on
the first day of each month.
There are several types of tasks:
• Mail tasks—A mail task uses Microsoft Mail to automatically send an e-mail message. For example, you could create a task that sends an
e-mail message to the plant engineer when an alarm occurs.
• Program tasks—A program task automatically launches an executable program. For
example, you could create a task that launches a program that activates the plant
engineer’s beeper when an alarm occurs.
• Reset tasks—Reset tasks reset device data such as min/max logs, onboard data logs,
waveform capture logs, device clock time, and so on.
• CM2000: Onboard Data Log/Waveform Upload tasks—These tasks automatically
upload onboard data log and/or waveform files from series 2000 circuit monitors
and combine them with the SMS database on your PC’s hard disk.
This chapter has three sections. The first section “Creating New Tasks” tells how to
create new tasks. The second section “Scheduling Tasks” tells how to schedule tasks to
be automatically executed at a user-defined time. The third section “Assigning a Task to
a Function” tells how to assign a task to an analog or digital function’s alarm condition
so that the task executes when the alarm condition becomes true.
Creating New Tasks
You create new tasks using the Tasks dialog box. You can display the Tasks dialog box in
two ways:
• Click Scheduled Tasks on the Setup menu, then click the Tasks pushbutton
• Click the Tasks button in the Analog Setpoint Edit or Digital Setpoint edit dialog box
© 1996 Square D All Rights Reserved
79
Bulletin 3080IM9601
In both cases, SMS displays the Tasks dialog box shown below. Use the Tasks dialog to
create new tasks as described in the following sections.
Creating a New Mail Task
The following instructions assume that Microsoft Mail is already installed and working
properly. See your Microsoft documentation for instructions on installing and using
Microsoft Mail.
To create a new mail task, follow these steps:
1. Click Add. The New Task dialog box displays.
2. Type the Task Name, up to 255 ASCII characters (no spaces).
3. In the Task Type box, select Mail then click Continue.
SMS displays the Mail Task Type Edit dialog box.
80
© 1996 Square D All Rights Reserved
Chapter 7—Using Tasks to Automate Processes
4. Enter information in the dialog box as described in the Mail Task Edit table. Click OK
when done.
SMS returns to the Tasks dialog box.
At this field…
Mail Subject
Mail Task Edit Table
Do this…
Type a brief description of the e-mail.
Mail Note:
Type the message you want to send.
Addresses
Click to display the Addresses dialog box. Then select the users to whom the
message will be sent.
Attachments
Click to display the Mail Attachments dialog box. Then select the files to send
as Mail Attachments.
Mail Logon
Click to enter your Microsoft Mail User ID & Password. If Mail is not running
when the Mail Task is be launched, SMS will launch Mail and use the User ID
& Password to log on.
OK
Click when you’ve finished defining the mail task.
Cancel
Click to leave the screen without saving changes.
Creating a New Program Task
Note: Program tasks are executed on the PowerLogic Network Server PC only. The program
being executed must be located on the hard drive of the Network Server PC. For this reason, you
should create the tasks on the Server PC. Scheduled program tasks execute based on the server
PC’s clock.
To create a new program task, follow these steps:
1. Click Add. The New Task dialog box displays.
2. Type the Task Name, up to 255 ASCII characters (no spaces).
3. In the Task Type box click Program, then click Continue.
SMS displays the EXE Task Type Edit dialog box.
© 1996 Square D All Rights Reserved
81
Bulletin 3080IM9601
4. Enter information in the dialog box as described in the EXE Task Type Edit table.
Click Finish when done.
SMS returns to the Tasks dialog box.
At this field…
Command:
Working Directory:
EXE Task Type Edit Table
Do this…
Type the command line which includes the location and name of the executable program and any optional command line parameters, or click in the
Command box, then click the Browse button to locate the executable.
Type the working directory that the executable program will use.
Wait On Completion: When you check this box, the task will not be logged in the event log until the
executable program has finished running.
OK
Click when you’ve finished defining the program task.
Cancel
Click to leave the screen without saving changes.
Creating a New Resets T
ask
To create a new reset task, follow these steps:
1. Click Add. The New Task dialog box displays.
2. Type the Task Name, up to 255 ASCII characters (no spaces).
3. In the Task Type box click Resets, then click Continue.
SMS displays the Reset Task dialog box.
4. In the Device Type box, select the type of device.
82
© 1996 Square D All Rights Reserved
Chapter 7—Using Tasks to Automate Processes
5. In the Devices Available box, click the desired devices and drag them to the Devices
Chosen box, or use the < > buttons.
6. In the Resets Available box, click the desired resets and drag them to the Resets
Chosen box (or use the arrow buttons).
7. Click OK when done.
SMS returns to the Tasks dialog box. The new Resets task appears in the Tasks list.
Creating a New CM2000 Onboard Data Log/Waveform Upload Task
Note: Before creating an onboard data log/waveform upload task, reset the waveform log using
the Resets command on the Control menu. This prevents old waveform data from being uploaded
when the waveform upload task executes.
To create an onboard data log/waveform upload task, follow these steps:
1. Click Add. The New Task dialog box displays.
2. Type the Task Name, up to 255 ASCII characters (no spaces).
3. In the Task Type box click CM2000 Onboard Data Log Upload, then click Continue.
SMS displays the Upload Onboard Data Logs dialog box.
4. In the Device box, select a Series 2000 Circuit Monitor (CM-2150 or higher).
5. In the Log Files box, check the data logs to upload.
6. If you want to upload the 4-cycle waveform log, check the 4-cycle waveforms box. If
you want to upload the extended waveform log, check the Extended waveforms box.
7. Click OK.
SMS returns to the Tasks dialog box. The new task appears in the Tasks list.
© 1996 Square D All Rights Reserved
83
Bulletin 3080IM9601
Scheduling Tasks
After you’ve created tasks, you can schedule them so that SMS automatically executes
them at a user-defined time and interval. Except for tasks setup to execute only once,
scheduled tasks run repeatedly at the scheduled time and interval until you stop them.
To schedule tasks, you must first create reference times—the time and interval at which
you want the task to run—then assign tasks to run at specific reference times.
Creating a New Reference Time
To create a new reference time, follow these steps:
1. On the Setup menu, click Scheduled Tasks.
SMS displays the Scheduled Tasks dialog box.
2. Click Add to display the Scheduled Task Edit dialog box. Enter information in the
dialog box as described in the Scheduled Task Edit table, on the next page.
3. Click OK when you’ve finished entering information in the Scheduled Task Edit box.
The new reference time appears in the Reference Time list box.
4. Assign one or more tasks to the reference time as described on the next page.
84
© 1996 Square D All Rights Reserved
Chapter 7—Using Tasks to Automate Processes
At this field…
Date
Scheduled Task Edit Table
Do this…
Enter the date (MM/DD/YY format) on which the task will begin running. If you
start a monthly task on the 31st of a month, the task will not execute on a month
with 29 or 30 days.
Time
Enter the time of day at which the task will run. SMS executes tasks based on the
POWERLOGIC Network Server PC’s clock.
Interval
Click the button for the desired interval:
Log Event
once
=
one time only at the specified time
daily
=
seven days a week at the specified time
weekly
=
once a week, the same day every week, beginning
with the specified date
monthly
=
once a month, on the same day, beginning with the
specified date
other
=
enter a number and choose an interval from the
drop down list box; for example “3 Days”
Check this box to cause the task to be logged in the event log each time it runs.
Assigning Tasks to a Reference ime
T
To assign tasks to a reference time, follow these steps:
1. In the Reference Time box, click the desired Reference Time.
2. In the Tasks Available box, click a Task you want to assign to the selected Reference
Time and drag it to the Tasks Selected box (or use the > button).
3. Repeat step 2 to assign additional tasks to the reference time.
© 1996 Square D All Rights Reserved
85
Bulletin 3080IM9601
Changing and Deleting a Reference T
ime
To change a reference time, follow these steps:
1. Click the reference time, then click Change.
2. Make the desired changes in the Scheduled Task Edit dialog box, then click OK.
Any tasks that you’ve assigned to the reference time will now run at the new time
and interval.
To delete a reference time, follow these steps:
1. Click the reference time in the Reference Time box, then click Delete.
Any tasks that you had assigned to the reference time will no longer run at the
reference time. Note: This does not delete the task, it only stops the selected tasks
from automatically executing at the deleted reference time.
Setting the PC’s Clock
SMS executes scheduled tasks based on the POWERLOGIC Network Server PC’s clock.
To set the clock on the Network Server PC, use the Windows NT control panel called
Date/Time. If the Network Server is running when you advance the PC clock past a
task’s schedule execution time, the task executes immediately. To avoid this, shut down
the POWERLOGIC Network Server while setting the PC’s clock.
86
© 1996 Square D All Rights Reserved
Chapter 8—Viewing Alarms and Events
Chapter 8—Viewing Alarms and Events
Viewing and Acknowledging Active Alarms
When an alarm becomes active, SMS adds it to the Active Alarms list. Depending on the
selections you made when setting up the alarm levels, SMS may also do any or all of the
following:
• sound an audible signal
• flash the alarm list icon
• automatically display the active alarms list and force you to acknowledge the alarm
• require you to enter a password to acknowledge the alarm
To view the active alarms list at any time, click Active Alarms on the Window menu.
SMS displays the Active Alarms list, shown below. The top part of the alarm list shows
all active alarms. The bottom part shows required acknowledgment alarms that have not
yet been acknowledged.
If an alarm becomes active, and its assigned alarm level has been set up for required
acknowledgment and/or visible, you won’t need to display the alarm list; SMS will
display it automatically. It will even interrupt you and display the alarm list if you are
working in another Microsoft Windows application, such as Microsoft Excel or
Microsoft Word.
To acknowledge an active alarm, follow these steps:
1. Click the alarm in the Unacknowledged Alarms list.
2. Click the eye glasses icon to acknowledge only one active alarm (or click the double
eye glasses icon to acknowledge all active alarms). If the alarm requires a password,
enter your assigned user id and password.
The alarm disappears from the Unacknowledged Alarms list. It will remain in the
Active Alarms list as long as the alarm condition is true. When the alarm condition is
no longer true, it will disappear from the Active Alarms list. To view a history of
alarms, see “Viewing the Alarm Log” below.
© 1996 Square D All Rights Reserved
87
Bulletin 3080IM9601
Using Operator Assistance Procedures During an Alarm
When defining functions, you can enter text (called an annotation) that is saved with the
function definition. The text can include step-by-step procedures telling an operator
what to do when the alarm is active. To view the annotation, double-click the desired
.
alarm, or click the alarm then click
Remote Acknowledgment
One of the benefits of SMS’s client/server architecture is that a remote PC equipped
with a modem and a client version of SMS can dial in to the server PC and acknowledge
alarms. For example, a plant engineer could install a client version of SMS on a PC in his
home. Using a modem, he could dial in to the server at the plant. The engineer could
then view the alarm list and acknowledge active alarms exactly as he would if he were
at the plant.
Silencing Alarms
If an alarm has been set up for audible notification, SMS sounds the audible when the
alarm becomes active. The audible plays repeatedly until you do one of the following:
• Acknowledge the alarm as described in “Viewing and Acknowledging Active
Alarms,” or
• Silence the alarm
If multiple audible alarms are active at one time, SMS plays the audibles alternately in a
repeating cycle.
To silence all active alarms, follow these steps:
1. Click the Silence All Alarms icon
on the toolbar.
This will not clear the unacknowledged alarms from the alarm list, or make the
alarms inactive, it only stops the audible portion of the alarm.
Viewing the Alarm Log
Each time an alarm occurs, SMS records the alarm occurrence in the alarm log.
To view the alarm log, follow these steps:
1. On the Windows menu, click Alarm Log.
SMS displays the Alarm Log Window.
88
© 1996 Square D All Rights Reserved
Chapter 8—Viewing Alarms and Events
To view the alarm detail window, double-click the desired alarm, or click the alarm
then click
.
Purging the Alarm Log
Periodically, you may wish to purge the alarm log . When you purge the alarm log, SMS
deletes the specified alarms from the SMS database. This will not delete any other
information, such as historical data, stored in the database. Use this feature with caution—once you purge the alarm log, you cannot recover the deleted alarm data.
To purge the alarm log, follow these steps:
1. On the Windows menu, click Alarm Log to view the alarm log.
2. Click the purge button
.
SMS asks for your username and password.
3. Enter your username and password, and click OK.
SMS displays the Log Delete Options dialog box.
4. Select All to delete all entries, or enter a date range, then click OK.
SMS deletes the specified data.
Viewing the Event Log
The event log stores events that are related to the operation of SMS. Some of the events
that are stored in the event log include: user log in, changes to system setup, system
taken offline, system placed online, tasks executed, and devices that have lost
communications.
To view the event log, follow these steps:
1. On the Windows menu, click Event Log.
SMS displays the Event Log window.
© 1996 Square D All Rights Reserved
89
Bulletin 3080IM9601
To view the event detail window, double-click the desired event, or click the event
then click
.
Purging the Event Log
Periodically, you may wish to purge the event log. When you purge the event log, SMS
deletes the specified events from the SMS database. This does not delete other information, such as historical data, stored in the database. Use this feature with caution—once
you purge the event log, you cannot recover the deleted events.
To purge the event log, follow these steps:
1. On the Windows menu, click Event Log to view the event log.
2. Click the delete button
.
SMS asks for your username and password.
3. Enter your username and password, and click OK.
SMS displays the Log Delete Options dialog box.
4. Select All to delete all entries, or enter a date range, then click OK.
SMS deletes the specified data.
90
© 1996 Square D All Rights Reserved
Chapter 9—Data Logging
Chapter 9—Data Logging
SMS can log historical data to a computer’s hard disk. You can view historical data in
table format or as a time trend plot. “Chapter 10—Displaying Historical Data” tells how
to display history tables and time trend plots. Historical data is useful for troubleshooting problems, identifying trends in usage, tracking equipment loading to identify excess
capacity, and more.
SMS logs all historical data to the SMS database on your computer’s hard disk. This is
the same database that stores all of the device setup information, function definitions,
and other user-defined data. Depending on the choices made during installation, the
database may be stored on the server computer, or on any other computer on the local
area network. The computer on which the database is installed must have enough
available hard disk space for data logging. The amount of disk space needed depends
on the limits you’ve set for the data log—such as the maximum number of quantities
selected, the polling interval (10 minutes, 15 minutes, etc.), and the total number of days
to store in the database. For instructions on database configuration, see the System
Administrator’s Guide. The guide also offers instructions on archiving historical data and
deleting it from the database.
The table below summarizes the locations of information related to setting up, logging,
and displaying historical data.
To learn how to:
See the section:
Set up data logging
Set up circuit monitor on-board memory
Setting Up Data Logging
Setting Up On-board Data Storage
9
5
Display historical data in a table or trend plot
Display circuit monitor on-board data
Displaying a History Table or Time Trend Plot
Displaying Circuit Monitor On-board Data
10
17
Delete historical data from the SMS database System Administrator’s Guide
Archive historical data from the SMS database System Administrator’s Guide
In chapter:
—
—
Circuit Monitor On-Board Data Log Files
Series 2000 POWERLOGIC Circuit Monitors have on-board memory for logging historical data. The amount of memory available depends on the circuit monitor model. You
can set up a circuit monitor’s on-board memory using SMS; the section “Setting Up OnBoard Data Storage” in Chapter 5 tells how.
SMS can automatically retrieve the data from circuit monitor on-board data log files and
store it in the SMS database on the computer’s hard disk. This combines the data logged
by the circuit monitor with the data logged from devices that do not have on-board
logging capabilities. When you view a history table or time trend plot, SMS retrieves the
© 1996 Square D All Rights Reserved
91
Bulletin 3080IM9601
historical data from the database; the data retrieved includes both data automatically
retrieved from circuit monitor on-board memory, and data logged directly to the database by SMS. The figure below illustrates this concept.
Trend Plot
History Table
Database
Data logged by SMS
Combined
historical data
Data from CM
on-board memory
For each series 2000 circuit monitor with onboard memory, you must define an Onboard
Data Log Upload task that specifies which log files to retrieve and how often to retrieve
them. See “Chapter 7—Using Tasks to Automate Processes” for instructions on defining
Onboard Data Log Upload tasks.
Although SMS can automatically retrieve data from circuit monitor on-board memory
and combine it with the database, there may be times when you want to retrieve onboard data directly from a circuit monitor and view it. SMS provides this capability as
well. The section “Displaying Circuit Monitor On-Board Data” in Chapter 17
tells how.
Setting Up Data Logging
To set up data logging, you must do two things:
1. Create log templates.
In creating a log template, you’ll specify the dates and times to start and stop logging, the logging interval (for example, do you want to log data hourly, daily?), and
the quantities to be logged. Since each device type supports different quantities,
you’ll create device-specific log templates; that is, you’ll create one set of templates
for series 2000 circuit monitors, one set for POWERLOGIC Digital Relays, and so on.
2. Assign the templates to specific devices.
92
© 1996 Square D All Rights Reserved
Chapter 9—Data Logging
Creating Log Templates
To create a new log template, follow these steps:
1. On the Setup menu, click Logging…
SMS displays the Logging Setup dialog box.
2. Click the Logger Templates tab.
3. Click Add.
SMS displays the Template Name dialog box.
4. Enter a template name.
5. In the Device Type box, click the device type for which you’ll create a template.
Click OK.
6. In the Date Range box, enter the dates you want data logging to start and end.
For example, if you want to log data for a period of one month starting today, enter
the present date in the start box, and the date one month from present in the end box.
If you don’t enter an end date, SMS keeps logging until your computer’s disk is full,
or until you deactivate the logging template. The next section “Assigning Log
Templates to Specific Devices” tells how to assign and activate log templates.
7. In the Time of Day box, enter the times for data logging to start and end each day, or
check All Day.
For example, you might only want to log data from 8 a.m. to 4:00 p.m. daily. To log
continuously, do not enter anything in the date/time fields.
© 1996 Square D All Rights Reserved
93
Bulletin 3080IM9601
8. In the Interval box, enter the time interval at which you want data to be logged (for
example, every 15 minutes, hourly, daily, etc.).
Keep in mind that the smaller the log interval, the quicker you’ll consume hard disk
space on your computer. Be sure that you have adequate hard disk space for data
logging.
9. In the Quantities Available box, click the desired quantities and drag them to the
quantities selected box, or use the > button.
10.Repeat steps 3–9 to create additional templates.
After you’ve created templates, you’ll need to assign them to specific devices and
activate them. You’ll do this on the Template Assignment tab. The next section tells how.
Note: We recommend that you assign only one log template to each device. Assigning multiple
templates to a single device can slow system communications. For example, assume that you had
a “Mains” group and a “Feeders” group, and that you want to log voltages and currents on the
Mains, but only currents on the Feeders. Do not create a “Voltages” template and a “Currents”
template and apply both to the Mains, and only the currents template to the Feeders. Instead,
create a template called “Mains” that includes voltages and currents, and a template called
“Feeders” that has only currents.
Assigning Log Templates to Specific Devices
After you’ve created log templates as described above, you must assign them to specific
devices; you assign templates on the Template Assignment tab of the Logging Setup
dialog box. If you are not already viewing the Logging Setup dialog box, click
Logging… on the Setup menu to display it.
When you assign log templates on the Template Assignment tab, you are preparing SMS
to log data directly to the System Manager database on a computer’s hard disk. You can
also assign log templates to Series 2000 Circuit Monitors to configure their on-board
memory, see “Setting Up Circuit Monitor On-Board Memory” in Chapter 5 for
instructions.
To assign log templates to one or more devices that do not have onboard logging
capability, follow these steps:
1. In the Logger Setup dialog box, click the Template Assignment tab, shown on the
next page.
94
© 1996 Square D All Rights Reserved
Chapter 9—Data Logging
2. In the Templates box, click a template to assign to the devices.
The available devices appear in the Devices Available box; only the devices that
match the device type for which the logging template was created are listed.
3. In the Devices Available box, click the devices that you want to assign the template to
and drag them to the Devices Selected box, or use the > button.
4. Check the Enabled checkbox to enable the template.
If the system you are editing is online, and you did not enter a start time and date,
SMS starts logging immediately after you close the Log Setup dialog box. If the
system you are editing is not online, SMS starts logging the next time you place the
system online.
5. To assign another template, repeat steps 2–4. Be sure to check the Enabled checkbox
for each template.
After assigning all templates, click Close. SMS prompts you to save the changes
you’ve made.
© 1996 Square D All Rights Reserved
95
Bulletin 3080IM9601
Chapter 10—Displaying Historical Data
SMS lets you view historical data in table format or as a time trend plot. This chapter
tells how to display history tables and time trend plots. Note that before you can
display history tables or time trend plots, you must have already logged data. “Chapter 9—Data Logging” tells how to set up and activate data logging.
To display historical data, click Historical Data on the Display menu. SMS displays the
Historical Data dialog box.
To display a history table or time trend plot, you’ll select from the pre-defined history
tables or create your own tables from the historical data that has been logged. You can
also define a query. Queries are similar to tables except that the device names you
select are saved with the query; the next time you want to display the query, you won’t
need to select devices. For a table, you must pick the device (or devices) each time.
Note: Tables and queries can be used to display historical data in table format or as a trend plot.
For example, you can select a Table w/Multiple Devices in the Tables/Queries box then display
either a table or a trend plot.
How do you decide if you need to define queries or tables? It depends on the application. Assume the following:
• You have a system of five circuit monitors, one monitoring a main and four monitoring feeders
• You have logged power quality values for the main circuit monitor only
• You have logged per-phase and three-phase current values for all circuit monitors
96
© 1996 Square D All Rights Reserved
Chapter 10—Displaying Historical Data
Since you’ve logged power quality values for the main circuit monitor only, you’d
probably define a Query w/Single Device to display power quality values. A query is
related to a specific device—in this case the main circuit monitor. But, since you’ve
logged current values for all five circuit monitors, you’d probably define a Table w/
Single Device, selecting per-phase and three-phase currents as your quantities. You
could then use the defined Table w/Single Device to display a table or trend plot for any
one of the five circuit monitors.
Defining a New Query or Table
To define a query or table, follow these steps:
1. On the Display menu, click Historical Data.
2. In the Historical Data dialog box, click Add.
SMS displays the Add dialog box.
3. In the Type box, select the desired type of query or table.
4. In the Name box, type a descriptive name for the query or table.
5. Click Continue.
The dialog box that appears next depends on the type of query or table you selected.
If you selected a Table, the dialog box allows you to select a quantity (or quantities)
only. If you selected a Query, the dialog box allows you to select a quantity (or
quantities) and device (or devices).
6. Select the devices and/or quantities as required, then click Finish.
SMS returns to the Historical Data dialog box. You can now use the newly defined
query or table to display a history table or time trend plot.
© 1996 Square D All Rights Reserved
97
Bulletin 3080IM9601
Displaying a History Table or Time Trend Plot
Before you can display a history or time trend plot, you must have defined tables and/
or queries as described in the previous section. You must also have logged the desired
data to the SMS database. For example, if you have defined a query to display historical
voltage values from a circuit monitor called Main 1, you must have already logged
voltage values for Main 1. (See Chapter 9 for instructions on logging.)
To display a history table or time trend plot, follow these steps:
1. On the Display menu, click Historical Data.
SMS displays the Historical Data dialog box.
2. In the Tables/Queries box, select the desired query or table.
3. The Available Range box shows the entire range of logged data for all devices available in the SMS database. If you want to limit the range of data displayed, enter the
desired start and end dates and times in the Available Range box.
4. If you picked a Table in step 2, select the desired device (or devices) in the Devices
Available box.
Only devices for which you’ve logged data appear in the list.
5. In the Display box, click either Table or Trend plot.
6. Click OK.
SMS displays the table or trend plot.
98
© 1996 Square D All Rights Reserved
Chapter 11—Resetting Device Data
Chapter 11—Resetting Device Data
The Resets feature provides the capability to reset data for a device or group of devices.
The resets available will vary, depending on the device type. You can perform a reset
manually, using the instructions in this chapter, or as a scheduled task (see “Chapter 7—
Using Tasks to Automate Processes”).
Note: Resets are logged in the Event Log.
The following table lists the available resets for each type of device.
Reset
Accumulated Energy
Device Date/Time
Min/Max
Peak Demand Current
Peak Demand Power
4-Cycle Waveform Log
Extended Waveform Log
Energy Mgmt Level1
Energy Mgmt Level2
Energy Mgmt Level3
Conditional Energy
Incremental Energy Interval
Onboard Data Logs (1–14)
Trip Counters
810D
Trip Unit
CM
100
CM
2000
X
X
X
X
X
X
X
X
X
X
X
X
X
X
X
X
X
X
Device Type
Digital
Relay
Power
Meter
Powerlink
Panel
PIF-3
PIF-85
X
X
X
X
X
X
X
X
X
X
X
X
X
X
X
X
X
X
X
© 1996 Square D All Rights Reserved
99
Bulletin 3080IM9601
To reset device data, follow these steps:
1. On the Control menu, click Resets… .
The Device Resets dialog box displays:
2. From the Device Types box, click the type of device you want to reset. Note that the
resets that can be made are listed in the Resets Available box at the bottom left of the
dialog box.
3. From the Devices Available list, click the specific device(s) that you want to reset. You
can reset:
• any set of individual devices (of the type selected in step 2)
• any group of devices (of the type selected in step 2)
• all devices (resetting all devices in the system that are the type selected in step 2)
Click > or drag the devices to the Devices Chosen box.
4. From the Resets Available box, click the reset(s) you want to include.
Click > or drag the devices to the Devices Chosen box.
5. Click Reset.
The message Reset Operation(s) passed displays.
6. Click Close to return to the SMS main window.
100
© 1996 Square D All Rights Reserved
Chapter 12—Working with Waveforms
Chapter 12—Working with Waveforms
POWERLOGIC circuit monitors have an optional waveform capture feature, which
allows the circuit monitor to capture current and voltage waveforms and store the data
in registers. SMS also provides data for troubleshooting harmonic problems, such as
THD, telephone interference factor, and harmonic magnitudes.
SMS can:
• acquire new waveform plots from a circuit monitor and display them on your PC
• export waveform files to disk
• retrieve and display waveform files that are stored in onboard circuit
monitor memory
• import and display waveform files that have been exported to disk (import option)
• retrieve and display device-specific waveform files that have been exported to disk
(file option)
Acquiring a New Waveform
To acquire a new waveform plot and display it for viewing, follow these steps:
1. On the Display menu, click Waveform Plots… or click the Waveform toolbar icon
SMS displays the Waveform Source dialog box:
.
2. Select and click the circuit monitor from which you want view the waveform.
Click OK.
© 1996 Square D All Rights Reserved
101
Bulletin 3080IM9601
Acquiring a New Waveform (cont.)
The Acquire Waveform dialog box displays:
3. Click Acquire New, then click whether you want a 4-cycle or extended capture. (The
size of the extended waveform—12, 24, 36, 48, or 60 cycles—is established in the
Onboard Data Storage tab, when setting up a Series 2000 Circuit Monitor. The default
is 12 cycles.)
Click OK. SMS captures the waveform data and then displays it. The figure below
illustrates a 4-cycle waveform for the device named CM main.
Waveforms display with the date and time of capture (from the circuit monitor clock).
To view additional information, or to export the waveform to a data file in your SMS
network, see Toolbar Buttons, Displaying a 4-Cycle Waveform Data Block, and
Exporting the Waveform to Disk, later in this chapter.
102
© 1996 Square D All Rights Reserved
Chapter 12—Working with Waveforms
Toolbar Buttons
The toolbar at the top of the waveform window contains buttons that you can click to
change the view, to acquire, and to export. The figure below illustrates these buttons.
Show All Graphs
(all 3 voltage
phases and all 3
current phases)
Show current by
phase: a, b, c
Zoom out
Export (displays
Export Waveform
dialog box)
{
{
Acquire Waveform
(displays Acquire
Waveform dialog box)
Zoom in
Show voltage by
phase: a, b, c
Scroll graph
to the left
Scroll graph
to the right
Display
online help
For example, click All to display all voltage and current phases, click Va to display only
phase A voltage. Click the magnifying glass buttons to zoom in and out of the waveform, alternately lengthening or shortening the x-axis of the waveform.
Copying the Waveform Plot or Data Block to Other Windows Programs
You can copy the waveform data block or waveform plots to the clipboard for export
into other Windows programs.
Displaying a 4-Cycle Waveform Data Block
You can view a waveform data block for any 4-cycle waveform plot. The data block
lists several items of data about that waveform (see the table later in this section for a
description of this data).
To access a waveform, see Acquiring a New Waveform and Retrieving a Stored
Waveform File, both in this chapter.
© 1996 Square D All Rights Reserved
103
Bulletin 3080IM9601
Displaying a 4-Cycle Waveform Data Block (cont.)
To display the waveform data block, complete the following steps:
1. Acquire or retrieve a 4-cycle waveform plot.
SMS displays the selected waveform plots.
2. Place the cursor on the title (Phase A Current, for example) of a single waveform plot.
3 Double-click the title of the single waveform plot.
SMS displays the waveform data block for the selected waveform plot (shown in the
figure below). The waveform and the data block can be printed at this point. Separate
printouts of each will print automatically.
104
© 1996 Square D All Rights Reserved
Chapter 12—Working with Waveforms
The following table lists definitions of the data illustrated in the data block on the
previous page.
Waveform Data Block
Fundamental
RMS
RMS-H
Peak
CF
ASUM
THD
IT
H1, H2,...H31
Fundamental Frequency Component Magnitude (60 Hz)—The rms magnitude or
root-mean-square (rms) value of the fundamental component; the fundamental
value for 60Hz systems is 60Hz.
RMS Magnitude—The magnitude of the waveform, including effects from the
fundamental and harmonic components.
RMS Magnitude of Harmonic Components—The magnitude of the square-root of
the sum-of-the-squares of the magnitudes of the individual harmonic components
of the waveform.
Peak Magnitude—The largest value (absolute value) the waveform reaches in
the acquired sample.
Crest Factor—The peak magnitude of the waveform divided by the rms value of
the waveform.
Arithmetic Sum—The arithmetic sum of the magnitudes of the fundamental and
individual harmonics as opposed to the vectorial sum.
Total Harmonic Distortion (% of Fundamental)—The square-root of the sum-ofthe-squares of the individual harmonic magnitudes divided by the magnitude of
the fundamental.
Telephone Interference Factor (I•T)—A calculated value which gives a measure
of the power circuit’s ability to cause interference with communications circuitry in
proximity to the power circuit.
Fundamental (H1) Harmonic Magnitudes through the 31st
Exporting the Waveform File to Disk
You can save any displayed waveform to a data file on your PC or on any other PC in
your network. At a later time, you can retrieve the file for reference.
To save a waveform capture, storing it in an SMS data file, follow these steps:
1. Acquire a new waveform, following steps on the previous pages. (Or retrieve a
previously captured waveform file that has been saved in on-board storage of a
circuit monitor.)
© 1996 Square D All Rights Reserved
105
Bulletin 3080IM9601
Exporting the Waveform File to Disk (cont.)
2. Click E on the waveform toolbar. The Export Waveform dialog box displays:
3. The default directory, Export, is located in the SMS-3000 data file. To enable clients to
easily access exported waveform files, we recommend that you export all waveform
files to a common file on the server PC. See the note under Retrieving a Stored
Waveform at the beginning of this chapter.
4. Type the file name you want to use for this waveform.
5. Choose the data type: .dat or .csv.
6. Click Save.
SMS exports a copy of the waveform file to the location you specified.
Retrieving a Stored Waveform File
Previously acquired waveforms can be stored on board the circuit monitor (see the
waveform capture section in your circuit monitor instruction bulletin) or in system data
files (see Exporting the Waveform File to Disk, earlier in this chapter).
Note: When you export waveform files, SMS assumes a default destination directory of
c:\sms-3000\export. If you accept this default, you will be able to retrieve these stored files
only from the PC on which they are stored. Thus, we recommend that you store all waveforms
on a common file on the server PC. This will ensure that all clients can retrieve all stored
waveform files.
Also note that SMS saves waveforms, captured in automated tasks, in the Export file of
SMS-3000 (on the server PC). Although these filenames will display when using the File option,
they are only accessible through the Import option.
You can retrieve stored waveform files according to the following instructions.
106
© 1996 Square D All Rights Reserved
Chapter 12—Working with Waveforms
Retrieving an On-Board Waveform File
To view a waveform that is stored on board the circuit monitor, follow these steps:
1. Following steps 1–2 on the previous pages, display the Acquire Waveform dialog box:
2. Click Onboard. SMS lists the waveforms that have been stored on board the circuit
monitor. If both 4-cycle and extended waveforms are stored, they are listed separately,
by the date and time of their capture.
3. Double-click the name of the waveform file that you want to view.
SMS displays the waveform file.
Importing a Stored Waveform File (Import Option)
Note: Be sure that all waveforms, from all client PCs, are exported to a common location on the
server PC. This ensures that all clients will be able to retrieve all waveforms, regardless of the
location from which they were acquired and stored. Waveforms that are stored on one client PC
are not retrievable from other client PCs.
To view a waveform that is stored in an SMS data system file, follow these steps:
1. On the Display menu, click Waveform Plots… or click the Waveform toolbar icon
.
SMS displays the Waveform Source dialog box.
2. Double-click Import Waveform.
© 1996 Square D All Rights Reserved
107
Bulletin 3080IM9601
SMS displays the Import Waveform dialog box:
3. Double-click the name of the waveform you want to view.
SMS displays the waveform.
Retrieving a Stored Waveform File (File Option)
Clients should not use this option because it does not provide a path for retrieving files
from other computers. Clients should use the following option, Importing a Stored
Waveform File.
To retrieve a stored waveform file, follow these steps:
1. On the Display menu, click Waveform Plots… or click the Waveform toolbar icon
SMS displays the Waveform Source dialog box.
2. Select the device from which you want to view a waveform file: open the group to
which the device belongs. Then double-click the device name.
108
© 1996 Square D All Rights Reserved
.
Chapter 12—Working with Waveforms
SMS displays the Acquire Waveform dialog box:
3. Click File.
SMS displays the stored waveform files that you can view.
4. Double-click the name of the waveform file that you want to view.
SMS displays the file.
© 1996 Square D All Rights Reserved
109
Bulletin 3080IM9601
Chapter 13—Control Outputs
This chapter tells how to apply and operate control outputs using SMS; it does not tell
how to configure circuit monitor relay outputs. See “Setting Up Relay Outputs” in
Chapter 5 for instructions on configuring relay outputs.
Overview
Control outputs allow manually-initiated, password-protected control of the following:
• Relay outputs for Series 2000 Circuit Monitors (an additional add-on Input/Output
Module must be mounted to the rear of the circuit monitor)
• Relay outputs for Series 100/200 Circuit Monitor models CM-144
and CM-244
• Bit control for a given register in a SY/MAX programmable logic controller (PLC)
from Square D, or other SY/MAX-compatible device. In a PLC system, this bit is
typically used in custom programmable logic to perform some other action.
Example Applications and Definitions of Terms
A Manual Control Output is a control output for:
• any series 2000 Circuit Monitor relay that is not enabled for
on-board operation
• a CM-144 or CM-244 relay
• a SY/MAX PLC (or other SY/MAX-compatible device)
• Manual control output examples:
– manually close and open circuit breakers (see example in Appendix D)
– manually energize and de-energize contactors
An Override Control Output is a control output for a CM-2150 (or higher) relay that is
enabled for on-board operation. See the next section “More About the Series 2000 Circuit
Monitors” for more information.
Override Control Output example:
If you use “Over KW Demand Level 1” (Alarm Number 67 in Appendix C) to
automatically energize relay R1, the R1 contact might be wired to an automatic transfer
switch to start a generator, and transfer some load from utility power to your generator.
Your motive for doing this may be to reduce peak demand charges from the utility, for
example. (See Appendix D for more details on this example.)
110
© 1996 Square D All Rights Reserved
Chapter 13—Control Outputs
Suppose that the generator in the example was scheduled to be out of commission for
maintenance. During the maintenance period, you might not want relay R1 to energize,
even if the “Over KW Demand Level 1” alarm were to occur. This is a situation in which
an Override Control Output may be used to temporarily “freeze” R1 open during
maintenance, then place R1 back into automatic operation when maintenance is
complete. Also, if you wanted to test generator operation after completing the
maintenance, you could temporarily force (override) R1 ON or OFF even though KW
Demand is below the pickup setpoint at the time of the test.
More About the Series 2000 Circuit Monitors
For the Series 2000 Circuit Monitor relay outputs, it is important to understand the
concepts of on-board operation and overrides.
Each Series 2000 Circuit Monitor relay output can be configured for onboard operation.
The section “Setting Up Relay Outputs” in Chapter 5 tells how to set up relay outputs.
Chapter 5 says that to configure a relay for onboard operation you must check the Enable
Onboard Operation checkbox on the I/O module tab in the Series 2000 Circuit Monitor
Device Setup dialog box.
If Enable Onboard Operation is checked—
The associated relay is controlled automatically by the circuit monitor (even if your
computer is turned off), in response to onboard alarm conditions internal to the circuit
monitor. (Appendix C lists the circuit monitor’s on-board alarm conditions. The section
“Setting Up On-board Alarms/Events” in Chapter 5 tells how to assign on-board alarm
conditions to operate relays.) When a relay is configured for onboard operation, you
cannot control the relay using SMS unless you first override the relay. When you override
the relay, you temporarily take away the circuit monitor’s ability to automatically
operate the relay in response to on-board alarm conditions; the circuit monitor simply
ignores the alarms conditions that would cause the relay to change state if it were not
overridden. While a relay is overridden, you can operate it manually (force it On and
Off) using SMS. It may help to think of overriding a relay as taking the relay out of
“auto” mode and putting into “manual” mode. The relay stays in manual mode until
you release the override using SMS.
If Enable Onboard Operation is not checked—
The associated relay is controlled by a source external to the circuit monitor via
communications. This external source could be either a person using SMS to control
outputs, or a SY/MAX programmable controller or other SY/MAX compatible device.
“Override,” as described in the previous paragraph, does not apply because the relay is
not enabled for on-board operation. (In SMS, when you select a control output that is
not enabled for onboard operation, the Override and Release buttons are grayed out.)
When you receive a new Series 2000 Circuit Monitor and install an Input/Output
Module on it, the default for all relays is not enabled for on-board operation.
© 1996 Square D All Rights Reserved
111
Bulletin 3080IM9601
Control Outputs Setup Flow Chart
Refer to the flow chart below for a representation of the setup requirements described in
previous sections of this chapter.
The flow chart requires CM-2000 relays to be configured for normal, latched, or timed
mode. Control outputs cannot function correctly if the controlled relay is operating in
one of the seven pulse modes (such as “Absolute KWH Pulse”) listed in the “Setting Up
Relay Outputs” section in Chapter 5.
We recommend that you use relays R1, R2, and R3 for Series 2000 Circuit Monitor
control outputs. The KYZ relay output is designed for the billions of operations required
in the pulse modes. The KYZ relay can also be configured for normal, latched, or timed
mode and used for a control output, but the low contact current rating of the KYZ relay
makes it unsuitable for some control outputs applications.
Device
Type
CM-2150
or higher
Yes
Online I/O
Module Setup
Requirements
(CM2000 relays only)
(See Chapt. 5)
Are you
setting up the
relay to operate
automatically based on
Circuit Monitor
onboard Alarm
Code(s)?
1. Enable Onboard Operation
box must be checked
2. Relay Mode must be
Normal, Latched,
or Timed
No
Do you
want to have
capability to
temporarily override
relay operation
from your
computer?
STOP
Do not set up
a Control Output
for the relay
CM-2050
CM-144
or
CM-244
SY/MAX
Device
No
1. Enable Onboard Operation
box must not be checked
2. Relay Mode must be
Normal, Latched,
or Timed
Relay Mode must be
Normal, Latched,
or Timed
Yes
Follow the instructions in
“Before Setting Up Override
Control Outputs”
Follow the instructions in
“Before Setting Up Manual
Control Outputs”
Follow the instructions in
“Setting Up Control Outputs”
112
© 1996 Square D All Rights Reserved
Chapter 13—Control Outputs
Before Setting Up Manual Control Outputs
If you are defining a control output for a CM-144, CM-244, or SY/MAX PLC, go straight
to the section “Setting Up Control Outputs.”
If you are defining a manual control output for a Series 2000 Circuit Monitor, you must
first perform the required I/O module setup as described in the control outputs setup
flowchart and summarized below.
For a CM-2050 you must,
• Select a mode (normal, latched, or timed) for the relay
For a CM-2150 or higher, you must do two things:
• Select a mode (normal, latched, or timed) for the relay
• Verify that the Enable Onboard Operation checkbox on the I/O module tab in the
CM-2000 Device Setup dialog box is not checked
If you have not previously completed these setup tasks, see “Setting Up Relay Outputs”
in Chapter 5 for instructions. After you’ve completed the required I/O module setup,
follow the instructions in the section “Setting Up Control Outputs” in this chapter to
define control outputs.
Before Setting Up Override Control Outputs
Before you can define an override control output for a CM-2150 or higher, you must
follow these steps:
• Select a mode (normal, latched, or timed) for the relay
• Verify that the Enable Onboard Operation checkbox on the I/O module tab in the
CM-2000 Device Setup dialog box is checked
• Set up the desired alarm conditions to operate the relay output
If you have not previously completed these setup tasks, see “Setting Up Relay Outputs”
in Chapter 5 for instructions on completing the first two tasks in the list above. See
“Setting Up Onboard Alarm/Events” in Chapter 5 for instructions on completing the
third task.
In addition to the required setup tasks described above, we recommend that you define
two digital functions for the relay—one for relay on/off status and one for relay override status. By defining these digital functions and setting them to log state changes and
generate alarms, you’ll ensure comprehensive system event logging and alarming.
© 1996 Square D All Rights Reserved
113
Bulletin 3080IM9601
Digital Functions for Relay On/Off Status:
Note: For the four following digital functions, choose an alarm level that is not set up for visual,
acknowledge, or audible. Factory default level 9 is appropriate.
Function Name:
Quantity:
Equal Condition Name:
Non-Equal Condition Name:
Alarm:
KYZ Status
KYZ Relay Status
On
Off
Yes
Function Name:
Quantity:
Equal Condition Name:
Non-Equal Condition Name:
Alarm:
R1 Status
R1 Relay Status
On
Off
Yes
Function Name:
Quantity:
Equal Condition Name:
Non-Equal Condition Name:
Alarm:
R2 Status
R2 Relay Status
On
Off
Yes
Function Name:
Quantity:
Equal Condition Name:
Non-Equal Condition Name:
Alarm:
R3 Status
R3 Relay Status
On
Off
Yes
Digital Functions for Relay Override Status:
Note: For the four following override digital functions, choose an alarm level that is set up for
visual indication and requires user acknowledgment.
114
Function Name:
Quantity:
Equal Condition Name:
Non-Equal Condition Name:
Alarm:
KYZ Override Status
KYZ Relay Override State
Overridden
Not Overridden
Yes
Function Name:
Quantity:
Equal Condition Name:
Non-Equal Condition Name:
Alarm:
R1 Override Status
R1 Relay Override State
Overridden
Not Overridden
Yes
© 1996 Square D All Rights Reserved
Chapter 13—Control Outputs
Function Name:
Quantity:
Equal Condition Name:
Non-Equal Condition Name:
Alarm:
R2 Override Status
R2 Relay Override State
Overridden
Not Overridden
Yes
Function Name:
Quantity:
Equal Condition Name:
Non-Equal Condition Name:
Alarm:
R3 Override Status
R3 Relay Override State
Overridden
Not Overridden
Yes
After you’ve completed the required setup, follow the instructions in the section “Setting Up Control Outputs” below to define control outputs.
Setting Up Control Outputs
It may be helpful for you to read “Appendix D—Control Output Examples” before
setting up control outputs.
To define a new control output, follow these steps:
1. On the File menu, click Open>System, then select the system to edit.
2. On the Setup menu, click Control Outputs.
SMS displays the Defined Control Outputs dialog box, shown below.
3. In the Devices box, select the desired device.
The Control Names box updates to show any previously defined control outputs for
the selected device.
4. Click the Add pushbutton.
SMS displays the Add Control Output dialog box.
© 1996 Square D All Rights Reserved
115
Bulletin 3080IM9601
5. In the Control Output Name box, type a descriptive name.
For example, if the control output will be used to turn a chiller fan On and Off, you
might name the control output “Chiller Fan 1.”
6. If you are defining a control output for a circuit monitor relay, click the Pre-defined
option button, then select the relay to control from the drop down list box.
For the CM-2000, relays R1, R2, and R3 are recommended for control outputs. The
KYZ relay can also be used, but the KYZ relay has a low current rating since it is
designed for pulse applications.
7. If the control output is for a SY/MAX device or a circuit monitor output other than a
relay, click the User-Defined option button, then select the digital function to control
from the drop down
list box. User-defined control outputs require that you define a custom quantity that
is set up as digital and writable. See Chapter 16 for instructions on defining custom
quantities.
8. In the On (1) Action and Off (0) Action boxes, type names that describes the On and
Off actions.
For the “Chiller Fan 1” example in step 5, you might enter “Fan On” and “Fan Off”
for the On (1) and Off (0) actions, respectively. If the control output were to control a
contactor, the condition names might be “Energize” and “De-energize.”
9. If you want to associate an input with the control output, click the Associate button
and follow the instructions in the next section.
The Associate function lets you verify the success or failure of a control output
operation by associating an input with a control output. For example, you could
associate a control output to close a circuit breaker with the operation of the circuit
breaker auxiliary switch via a digital function.
10.After completing any desired associations, click OK.
The new control name appears in the Control Names list box.
116
© 1996 Square D All Rights Reserved
Chapter 13—Control Outputs
Associating an Input with a Control Output
Power equipment applications often require external feedback from control circuitry to
verify not only that the control command was successfully communicated to the device,
but also that the desired result was actually achieved.
Note: We strongly recommend that you create associations for each POWERLINK circuit
breaker control output that you define. The association ensures that you will be properly notified
of the success or failure of a control attempt.
Using SMS, you can associate the response of a discrete input with a control output
operation. In other words, you can wire contact feedback to a circuit monitor input or
SY/MAX digital input and monitor for change in state as a result of the control action.
Success or failure of the operation is then based on whether the input achieves the
desired state after a user-defined time delay.
The figure below is a simple example in which the Associate function would be useful.
The figure shows a circuit monitor with optional inputs and outputs. One of the circuit
monitor’s control outputs is used to activate a coil that closes a contactor. The contactor
is then wired to one of the circuit monitor’s inputs.
In the example, when output R1 is Off, S1 should be Off (“Open”). When output R1 is
On, the contactor coil should pick up, thereby closing the contactor auxiliary contact;
input S1 should therefore be On (“Closed”). If the contactor fuse was blown, a wire was
loose, the contactor coil failed, or some other malfunction occurred, the SMS Associate
function would inform the operator that the desired result was not achieved—even
though the R1 contact may have operated properly.
Fuse
Co ntactor
Coil
Contactor
Auxiliary
Co ntact
(N.O.)
Co il
120
VAC
33
12
R1
Out put
Circuit Monitor
11
S1
I nput
25
Before you can create an association to a control output, you must define a digital
function. In order to associate a control output with the status of circuit monitor input
S1, as shown in the example above, you would have to define a digital function based
on the pre-defined digital quantity Input 1 Status. The Digital Setpoint Edit dialog box
on the next page shows the digital function definition for our example.
© 1996 Square D All Rights Reserved
117
Bulletin 3080IM9601
The procedure that follows tells how to create an association. It uses the illustration
above as an example. For the example, assume that we have already create a control
output called Contactor 1 Open/Close that is used to operate relay R1, and that we have
defined a digital function called Input 1 Status as shown in the dialog box above.
To associate an input with a control output, follow these steps:
1. On the File menu, click Open>System and select a system to edit.
2. On the Setup menu, click Control Outputs.
SMS displays the Defined Control Outputs dialog box.
6. In the Devices box, select the desired device.
7. In the Control Names box, select the control output for which you will create an
association.
For our example, we selected the control output called Contac. 1 Open/Close.
8. Click Configure...
SMS displays the Configure Control Output dialog box.
118
© 1996 Square D All Rights Reserved
Chapter 13—Control Outputs
9. In the On (1) Action box, click the Associate… button.
SMS displays the Associated Condition dialog box.
10.In the Devices box, select a device.
SMS updates the Conditions Defined box to show all digital functions that you’ve
assigned to the selected device.
11. In the Conditions Defined box, select the desired digital function.
When you select a function, option buttons appear in the Properties box. The option
buttons correspond to the names you defined for the Equal and Non-Equal conditions in the Digital Function Setpoint Edit dialog box.
12.In the Properties box, enter the appropriate time delay (from 5 to 60 seconds).
Be sure that the time delay you enter is long enough to ensure a state change. If the
time delay is not long enough, the message SMS displays indicating success or failure
could be incorrect. Be sure that your equipment responds in the time you specify and
allow two seconds or more for communicating to the device for verification.
© 1996 Square D All Rights Reserved
119
Bulletin 3080IM9601
13.In the Properties box, select the option button for the condition that you want to
associate with the On (1) Action.
In the Associated Condition dialog box above, we have selected the Input 1 On
option button. We did this because, in our example, when relay R1 is On, input S1
should be On.
14.Click OK. SMS returns to the Configure Control Output dialog box.
15.In the Off (0) Action box, click the Associate… button.
16 Repeat steps 10–14 to create an association with the Off (0) Action, except at step 13
select the option button for the condition that you want to associate with the
Off (0) Action. (For our example, we would select the Input 1 Off option button.)
Executing Manual Control Outputs
SMS must be online to execute control outputs. You execute a control output using the
Control Outputs command on the Control menu. If you are using the Interactive
Graphics Interface (GFX-700), you can also execute a control output using a control
block. For instructions on executing control outputs from a diagram, refer to the
Interactive Graphics Interface instruction bulletin.
To execute a manual control output, follow these steps:
1. If SMS is not online to your system, click the Online>System command on the File
menu to go online.
2. On the Control menu, click Control Outputs.
SMS displays the Control Outputs dialog box.
3. In the Devices box, select the desired device.
The Control Names box updates to show all control outputs defined for the device.
120
© 1996 Square D All Rights Reserved
Chapter 13—Control Outputs
4. In the Control Names box, select a control output to execute.
Note: The Override and Release buttons are grayed out if you selected a manual control
output. If the Override and Release buttons are not grayed out, you are operating a CM-2000
relay that is enabled for on-board operation. If you do not understand why the relay is enabled
for on-board operation, click the Close button at the top of the dialog box and review the
preceding sections of this chapter.
5. Click the button to the right of the Control Names box that corresponds to the action
you desire. Enter your Username and Password, then click OK.
SMS displays a message telling you whether the control action has succeeded or
failed.
6. Click OK to acknowledge the action.
SMS records the control action in the event log.
Executing an Override Control Output
SMS must be online to execute control outputs. You execute a control output using the
Control Outputs command on the Control menu. If you are using the Interactive
Graphics Interface (GFX-700), you can also execute a control output using a control
block. For instructions on executing control outputs from a diagram, refer to the
Interactive Graphics Interface instruction bulletin.
To execute an override control output, follow these steps:
1. If SMS is not online to your system, click the Online>System command on the File
menu to go online. Then set the sampling mode to Scheduled Update.
2. On the Control menu, click Control Outputs.
SMS displays the Control Outputs dialog box.
3. In the Devices box, select the desired device.
The Control Names box shows all control outputs defined for the selected device.
© 1996 Square D All Rights Reserved
121
Bulletin 3080IM9601
4. In the Control Names box, select a control output to execute.
5. Click a button corresponding to your intent, based on the table below. SMS displays
the security box. Enter your username and password, then click OK.
Override can be thought of as taking the relay out of auto operation mode and putting
it into manual operation mode. After you have placed a relay in Override, you can force
it On and Off using the On Action and Off Action buttons. While in override, the
relay will not respond to automatic control requests based on the circuit monitor’s
on-board alarm conditions; the relay stays in its current state until you force it into
the opposite state.
The relay stays in Override until you click the Release Override button to place it
back into auto mode. Once you’ve released the relay, it will again respond to automatic control requests based on the circuit monitor’s on-board alarm conditions.
Note: When you release an overridden relay, the relay may unintentionally operate. For
example, if the relay is overridden off and you click Release while a controlling alarm condition is true, the relay energizes.
6. Click OK to acknowledge the action.
SMS records the control action in the event log.
Override
Button
Available
Grayed
Grayed
Grayed
Grayed
Release
Override
Button
Grayed
Available
Available
Grayed
Grayed
ON Action
Button ¿
Grayed
Available
Grayed
Available
Grayed
OFF Action
Button ¿
Grayed
Grayed
Available
Grayed
Available
Relay is not
presently
overridden.
On-board
CM2000
control is in
effect.
Relay is
presently
overridden.
Relay is
OFF.
Relay is
presently
overridden.
Relay is
ON.
Relay is
not enabled
for on-board
operation.
Relay is
OFF. ¡
Relay is
not enabled
for on-board
operation
Relay is
ON. ¡
Relay
Status
¿ The text that appears on the ON Action and OFF Action buttons depends on the names you
assigned to the output actions when defining the control output. The OFF Action button is the
bottom button in the dialog box. The ON Action button is immediately above it.
¡ If the Override and Release buttons are both grayed out, then you have selected a manual control
output. You cannot override the relay; you can only turn it ON and OFF.
122
© 1996 Square D All Rights Reserved
Chapter 14—Reports
Chapter 14—Reports
SMS allows you to create and print custom data reports. You can print reports manually,
and you can schedule reports to print automatically, at a user-defined interval. For
example, you might create a report that includes energy usage for the past month, then
schedule it to print monthly.
The following are important points about the report feature:
• Report definitions are specific to the client software and PC you used to define them.
For example, assume that you’ve installed SMS client software on three PCs in your
facility, including the plant engineer’s PC. If you define reports using the SMS client
software installed on the plant engineer’s PC, the following things are true:
– The report definitions are stored on the plant engineer’s PC
– You can only view or edit the report definitions using the SMS client installed on
the plant engineer’s PC
– Any scheduled reports that you define using the plant engineer’s PC will print
automatically only if the SMS client on the plant engineer’s PC is running. If the SMS
client on the plant engineer’s PC is not running at the time a report is scheduled to
print, the report will not print; the next time you start the SMS client, the report will
print immediately.
• When SMS automatically prints a scheduled report that contains historical data (for
example, historical data tables), the report includes historical data from present to the
last time the scheduled report printed. For example, if the report were printed a
month ago, SMS would print only the last month’s data (even if the SMS database
contained many months of historical data).
Creating a Report and Scheduling It for Automatic Printing
To create a report, follow these steps:
1. On the Reports menu, click Schedule/Print.
SMS displays the Report dialog box.
2. Click Add.
SMS displays the Create Report dialog box.
© 1996 Square D All Rights Reserved
123
Bulletin 3080IM9601
3. In the Report Name box, type a name for the new report.
4. At this point, you must select the information to be included in the report. You do
this by adding displays. To add a display, click Add Display.
SMS displays the Add Display dialog box.
5. Select the desired display, then click OK.
6. What happens next depends on the type of display you select.
• If you select the Alarm Log or Event Log, SMS returns to the Create Report dialog
box and adds your selection to the list of displays in the report.
• If you select Historical Data Table or Historical Trend Plot, SMS displays the
Historical Data dialog box. Select the desired query or table from the Tables/Queries
box. If you select a table, select the device(s) then click OK.
• If you select SMS-3000 Table, SMS displays the Open Table Display dialog box.
Select the desired SMS-3000 table and device(s), then click OK.
7. Repeat steps 4–6 to add additional displays to your report.
8. In the Schedule Interval box, select how often you want the report to print.
If you do not want the report to print automatically at a regular interval, select the
Manual option button. If you select Manual, you’ll need to manually print the report
when you want it. See the next section, “Manually Printing a Report” for instructions.
124
© 1996 Square D All Rights Reserved
Chapter 14—Reports
9. In the Report Start Time box, enter the date and time on which the report will first
print.
For example, if you selected the Monthly option button and entered the date 6/1/96
and time 5:00 PM in the Report Start Time box, the report would print first on 6/1/96
at 5:00 PM. The report would then print on the first day of each month at 5:00 PM.
10.Click Close when you’re done creating the report.
SMS returns to the Report dialog box. Repeat steps 2–10 to create additional reports.
Manually Printing a Report
To manually print a report, follow these steps:
1. On the SMS menu bar, click Reports.
SMS displays the Report dialog box.
2. Select a report from the list of defined reports, then click Print.
Even if you’ve scheduled a report to print automatically, you can still print it manually.
For example, you might schedule a report to print at the first of each month, then decide
you’d like a mid-month printout. Simply print the scheduled report manually as described above. If the report contains historical data, SMS includes historical data from
the last time the report printed automatically to present. When you manually print a
report that is not scheduled for automatic printing, SMS prints the data from the last
time the you manually printed the report to present.
© 1996 Square D All Rights Reserved
125
Bulletin 3080IM9601
Chapter 15—Getting Data To and From Other Places
This chapter describes ways to get SMS data to and from other places using the clipboard, printing, and saving to a file.
Copying Waveforms Using the Clipboard
The clipboard is a standard feature of virtually all Windows applications. The clipboard
allows you to copy waveforms and paste them into other Windows applications that
support the clipboard format.
To use the clipboard, follow these steps:
1. Display the waveform to be copied.
2. Click in the waveform window to make it the active window.
3. On the Edit menu, click Copy.
4. Switch to the destination document, and click Paste on the Edit menu.
You may need to place an insertion point before you click Paste. For specific instructions on pasting into a particular application program, refer to the instruction material for the application program.
Clearing the Clipboard
To clear the clipboard, click Clear on the Edit menu. This clears
unwanted information from memory.
Printing
The SMS print feature allows you to print data displayed in open document windows.
Any data that you can display in an SMS document window can be printed. This
includes tables, bar charts, meters, time trends, waveform plots, and so on.
Preparing to Print
Before you can print, you must set up the target printer. The Windows control program
handles the interface to different types of printers. This section offers basic instructions
for printer setup. For detailed instructions on printer setup, refer to your Windows
documentation.
126
© 1996 Square D All Rights Reserved
Chapter 15—Getting Data To and From Other Places
To set up the target printer, follow these steps:
1. On the File menu, click Printer Setup.
SMS displays the Printer Setup dialog box.
2. From the Available Printers list, select the desired printer.
3. To change a printer’s setup, click the Setup button and edit the values in the dialog
box to meet your needs.
Click the Help button for more on setting up printers.
4. Click OK.
Printing a Window
If you want to print the contents of the active window, use the Print command.
To print the active window, follow these steps:
1. Click inside the window to make it active.
2. On the File menu, click Print.
3. Enter the desired settings in the Print dialog box and click OK.
Saving Data from Tables and Trend Plots to a File
To save data from an instantaneous data table, history table, or trend plot to a file on
your PC's hard disk, follow these steps:
1. Display the table or trend plot.
2. Move the pointer over the table or trend plot, then double-click using the right mouse
button.
SMS starts Formula One, the tool used to create tables and trend plots.
3. On the Formula One File menu, click Write.
Formula One displays the Write File dialog box.
4. In the Write File dialog box, choose a location, enter a filename, and select a Save As
Type. Then click Save.
Formula One saves the data to a file in the selected format.
© 1996 Square D All Rights Reserved
127
Bulletin 3080IM9601
Chapter 16—Customizing the Software
Setting Up Groups
To make it easier to select devices, SMS lets you define groups. A group is a number of
devices that have something in common; for example:
• devices that have a common voltage, such as feeders
• devices that are grouped for billing purposes, such as
individual departments
For example, you might create a group consisting of all devices in Substation 1, or all
devices on the paint line, or all devices in building 1. Then, when you need to select a
specific device from a list box, you can shorten the list of devices by selecting only the
needed groups. A device can belong to more than one group.
Adding a Group
To add a group, follow these steps:
1. On the Setup menu, click Groups…. to display the Group Setup dialog box.
2. Click Add to display the Add Group dialog box. Enter the name of the group you are
adding, then click OK to return to the Group Setup dialog box.
3. In the Devices Available menu, click the devices to be included in the group and drag
them to the Devices Selected box, then click Update.
4. Click Close.
128
© 1996 Square D All Rights Reserved
Chapter 16—Customizing the Software
Saving a Workspace
A workspace is a picture of the following things:
• The data update mode (manual, scheduled, or continuous)
• The type and position of open document windows (tables, charts, and so on)
When you save a workspace, SMS stores the above information in a workspace file on
the hard disk of the client PC. Then, when you open the workspace at a later date, SMS
automatically restores the workspace. That is, the windows that were open when you
saved the workspace are reopened, and the data update mode is restored. For example,
let’s say that the following conditions were true:
• SMS was in scheduled update mode with a 5-second update interval
• You were viewing a table of instantaneous current data for Feeder 1
You could then save the workspace, exit SMS, reenter SMS, and open the workspace.
SMS would automatically display the table of instantaneous current data for Feeder 1,
and begin taking data samples at 5-second intervals.
To save a workspace, follow these steps:
1. On the File menu click Save Workspace As.
SMS displays the Save As dialog box.
2. Type a name for the workspace.
Be sure to use the file extension .WKS.
3. Click Save.
To open a workspace, follow these steps:
1. On the File menu click Open>Workspace, or click
on the toolbar.
SMS displays the Open dialog box.
2. Select the workspace to open.
3. Click Open.
© 1996 Square D All Rights Reserved
129
Bulletin 3080IM9601
Creating Custom Tables
SMS provides a wide variety of pre-defined tables. In addition, SMS allows you to
define custom tables. There are two ways you can create custom tables:
• You can use the New>Quick Table command on the File menu to create a table with
multiple quantities from a singe device. You can then use the Save As command to
save the table. After you’ve saved the table you can display it using the Tables
command on the Display menu.
• You can use the New>Table command on the File menu to start the table editing
program, SMSTable.exe, included with SMS. The SMSTable.exe program allows
greater flexibility in how you create tables. You can also use the program to customize SMS’s pre-defined tables. Because the SMSTable.exe program is a third-party tool,
it is not documented in the SMS instruction bulletins. However, instruction bulletins
from the software developer are available to you, free of charge. To receive a single
set of the user’s guides, fill out the Custom Table Setup Instruction Bulletins Request
Form included in your SMS package and fax or mail it to us.
To create and save a quick table, follow these steps:
1. On the File menu, click New>Quick Table.
SMS displays the Quick Table dialog box.
2. In the Select Device Type box, select the type of device.
3. In the Select Device box, select the desired device.
4. In the Quantities Available box, click the quantities to include in the table, and drag
them to the Quantities Selected box.
5. Click OK.
SMS displays a table with the selected quantities.
6. To save the table, click Save As on the File menu.
SMS displays the Save As dialog box.
130
© 1996 Square D All Rights Reserved
Chapter 16—Customizing the Software
7. Enter a name for the table and click OK.
Once you have saved your quick table, you can display it like any other standard
SMS table. On the Display menu, click Tables. Your table appears in the list of available tables in the Open Table Display dialog box.
Defining Custom Quantities
For each supported device type, SMS provides a list of standard quantities. SMS lets you
extend the list of quantities for a device type by defining custom quantities. You might
need to define custom quantities when:
• You have a new PowerLogic compatible product
• You‘ve create custom register values in a model CM-2450 circuit monitor
• You want to display individual harmonics from circuit monitor models CM2350 & up
• You want to use DDE to import data from another software package such as Excel
Once you’ve defined a custom quantity, it appears in the Quantities list boxes in SMS
dialog boxes along with the standard quantities. You can log the quantity, alarm upon it,
and use it in custom tables and interactive graphics diagrams. In short, you can use the
custom quantity as you would use a standard quantity of the same type.
To define a new custom quantity, follow these steps:
1. Using the Open>System command on the File menu, open the system to edit.
2. On the Setup menu, click Custom Quantities.
SMS displays the Quantity Edit dialog box. The dialog box has two tabs. You’ll use
the Quantity Setup tab to define custom quantities, and the Apply Quantities tab to
assign custom quantities to specific device types.
3. Click the Quantity Setup tab.
Any custom quantities that you’ve previously defined appear in the Quantities list. If
you’ve not previously defined any custom quantities, the Quantities list is empty. If
you uncheck the Show Custom Quantities Only check box, SMS displays the
standard quantities (preceded by an S) along with the custom quantities (preceded by
a C). You cannot edit predefined quantities, but you can select them to view their
register numbers, units, and format.
© 1996 Square D All Rights Reserved
131
Bulletin 3080IM9601
4. On the Quantity Setup tab, click Add.
SMS displays the Quantity Name dialog box.
5. Enter a name and description for the new quantity, then click OK.
The description appears in the Quantities list on the Quantity Setup tab. The description also appears in other quantities list boxes throughout SMS. The name is used
when creating DDE links and when displaying data from onboard data logs.
6. Check the desired Properties and select a Units Code and Format Code as described
in the Quantity Setup table on the next page.
7. Click Update to save the new quantity’s definition.
After you’ve defined new custom quantities, you will need to assign them to specific
device types. This procedure is described on the next page.
132
© 1996 Square D All Rights Reserved
Chapter 16—Customizing the Software
Custom Quantity Setup Table
Do this…
At this field…
User Defined
SMS checks this box if the selected quantity is user-defined (custom). If the
selected quantity is not custom, this box is not checked.
Writeable
Check this box if you want to be able to write to the custom quantity’s register to
change its contents—for example, if you are creating a digital custom quantity
that will be used to define a control output.
Loggable
Check this box if you want to be able to log the quantity. If the box is checked,
the quantity appears in the dialog box used to define history log templates.
Digital Function
Check this box if you are defining a custom quantity that will be used to define
digital functions. If the box is checked, the quantity appears in the dialog box
used to define digital functions.
Analog Function
Check this box if you are defining a custom quantity that will be used to define
analog functions. If the box is checked, the quantity appears in the dialog box
used to define analog functions.
Units Code
Select the appropriate units code for the quantity.
Format Code
Select the appropriate format code for the quantity.
To assign custom quantities to a specific device type, follow these steps:
1. Using the Open>System command on the File menu, open the desired system.
2. On the Setup menu, click Custom Quantities.
3. Click the Apply Quantities tab.
4. In the Device Type box, select the device type to which you will assign custom
quantities.
SMS lists the available custom quantities in the Available User Defined Quantities
box. To list both custom and standard quantities, uncheck the Show Custom Quantities Only check box.
5. In the Available User Defined Quantities box, select the desired custom quantity and
drag it to the Device Supported Quantities box (or use the > button).
SMS displays the Device Quantity Setup dialog box. In this dialog box, you must
specify the register (or registers) that the custom quantity is stored in.
© 1996 Square D All Rights Reserved
133
Bulletin 3080IM9601
6. If the custom quantity uses multiple registers, and the registers are in sequence, enter
the first register number in the register 1 box. Then check the In Sequence check box
and enter the number of registers used in the Number of Register box.
For example, if the custom quantity is a 3 register date/time, and it is stored in device
registers 150, 151, and 152, you would enter 150 in the box for register 1, check the In
Sequence check box, and enter 3 in the Number of Registers box.
7. If the custom quantity uses multiple registers, and the registers are not in sequence,
enter the register numbers in the Non-Sequential Register Numbers boxes.
For example, if the custom quantity is a 3 register date/time, and it is stored in device
registers 150, 155, and 156, you would enter 150 in the box for register 1, 155 in the
box for register 2, and 156 in the box for register 3.
8. If, when you defined the custom quantity, you chose the Scaled Register Value
format, select a scale multiplier from the Scale (Multiplier) box.
9. Click OK.
If the custom quantity is a digital function format, SMS displays the Setup Bitmask
dialog box. Complete the rest of this procedure. If the custom quantity is not a digital
function, skip to step 13.
Note: Steps 10-12 apply only if the custom quantity is a digital function format quantity.
10.In the Status Names box, select the pair of status names that accurately describes the
purpose of the custom quantity.
For example, if the quantity will be used to define a digital function for fan status,
you would probably select On/Off; for circuit breaker status you would select Open/
Closed.
11. Click the desired bits in the bitmask until they are set to 1 or 0 as required. Leave an
X for any unused bits.
When you set these bits, you are defining the bit pattern that coincides with the True
status. In other words, when the bits in the specified register exactly match the
bitmask you define here, the status is True (this is equivalent to the Equal condition
being true in the Digital Function Setpoint Edit dialog box). When one or more bits in
the device register, excluding the bits you set to X in your bitmask, do not match the
bits in your bitmask, the status is False (this is equivalent to the Non-Equal condition
being true in the Digital Function Setpoint Edit dialog box).
134
© 1996 Square D All Rights Reserved
Chapter 16—Customizing the Software
12.Click OK.
SMS returns to the Apply Quantities tab.
13. If SMS is online, take it offline by clicking the Offline command on the File menu.
Exit the SMS client software, then shut down the POWERLOGIC Network Server.
Restart the POWERLOGIC Network Server. Restart the SMS client software, and put
your system back online. You can now use the newly defined custom quantities.
Note: You must do this last step each time you create a new custom quantity or edit an
existing custom quantity, otherwise your changes will not take effect.
© 1996 Square D All Rights Reserved
135
Bulletin 3080IM9601
Chapter 17—Diagnostics
Performing a System Communications Test
To verify that SMS is communicating to devices, you can perform a system communications test. The system communications test forces SMS to attempt to communicate to
each device in the online system, then returns the status of each device.
To perform a system communications test, follow these steps:
1. On the Control menu, click Diagnostics>System Communications Test.
SMS displays the System Communications Test dialog box.
Click on column titles
to sort by device, type,
route, etc.
2. To start the test, click Start Testing.
If you have a large system, testing may take several minutes. To pause a test in
progress, click Pause.
As SMS tests each device, it lists the device and its status.
System Device Status
SMS automatically displays the System Device Status dialog box when SMS detects,
while going online, that the basic configuration data stored in the device does not match
the basic configuration data stored in the SMS database.
136
© 1996 Square D All Rights Reserved
Chapter 17—Diagnostics
The System Device Status dialog box has three tabs used to perform three functions:
• Database Status tab—This tab lists the devices whose basic configuration data do not
match the configuration data stored in the SMS database; it lets you synchronize the
devices and database. The section “Correcting Mismatches in Device Setup Data”
tells how. (This tab only appears when you are placing a system online and SMS
detects that the basic configuration data stored in the device does not match the basic
configuration data stored in the SMS database.)
• Communication Status tab—This tab lists the devices that have lost communication;
it lets you attempt to reestablish communication with devices. The
section␣ “Reestablishing Communication with Devices” tells how
. (This tab is only
available when the system is online.)
• Service Status tab—This tab lists the devices that are in service, and it lets you place
devices out of service. The section “Placing Devices In and Out of Service” tells how.
Correcting Mismatches in Device Setup Data
When you place a system online, SMS compares the basic device setup information (for
example, device address, baud rate, CT and PT ratios) stored in each device with the
basic device setup information stored in the SMS database on your computer’s hard
disk. If SMS sees that the information in any device does not match the information in
the database, SMS takes the device out of service. To view the devices that are not in
synch with the database, click the Database Status tab.
© 1996 Square D All Rights Reserved
137
Bulletin 3080IM9601
To synchronize one or more devices with the database, follow these steps:
1. In the System Device Status dialog box, click the Database Status tab.
If you are not already viewing the System Device Status dialog box, click
Diagnostics>System Device Status on the Control menu to display it.
2. In the Setup Data Mismatch box, click the desired devices and drag them to the
Selected Devices box (or use the >, >> buttons).
3. If you believe that the information stored in the devices is preferable to the information stored in the SMS database, click the Update Database button. Enter your
username and password, then click OK. SMS copies the information from the devices
to the database.
OR
If you believe that the information in the SMS database is preferable to the information stored in the devices, click the Update Device button. Enter your username and
password, then click OK. SMS copies the information from the
database to the devices.
Reestablishing Communication with Devices
When you perform a system communications test, or when you bring a system online,
SMS attempts to communicate with each device in the system. SMS automatically takes
devices that fail to communicate out of service. Click on the Communication Status tab
to view a list of devices that have lost communications. You can attempt to reestablish
communications with these devices.
To reestablish communication with devices that have lost communications, follow these steps:
1. In the System Device Status dialog box, click the Communication Status tab.
If you are not already viewing the System Device Status dialog box, click
Diagnostics>System Device Status on the Control menu to display it.
138
© 1996 Square D All Rights Reserved
Chapter 17—Diagnostics
2. In the Lost Communication box, click the desired devices and drag them to the
Selected Devices box (or use the >, >> buttons).
3. Click the Bring In Service button.
SMS displays the System Communications Test dialog box.
4. Click the Start Testing button.
SMS attempts to communicate to each of the selected devices and displays the status
of each. If SMS communicates successfully with a device that was previously out of
service due to a communications error, it compares the basic settings configuration of
the device to the information stored in the SMS database. If the data matches, SMS
places the device back in service. If the data does not match, the device remains out
of service. You will need to synchronize the data in the device with the data in the
database. See the previous section “Correcting Mismatches in Device Setup Data” for
instructions.
5. Click Close to return to the System Device Status dialog box.
Note: Periodically, SMS performs a health check at which time it attempts to restore communications to non-communicating devices. You can change the interval at which SMS performs a
health check using the SMSCfg program that is located in the SMS-3000 directory on the server
PC. To change the health check interval, start SMSCfg, click on the Intervals tab, and enter the
desired interval in the Health Check box.
Placing Devices In and Out of Service
SMS allows you to place devices in and out of service. If, for instance, you needed to
perform maintenance on a circuit, you’d likely remove control power from the circuit
monitor. SMS would still try to communicate to the circuit monitor; causing communication errors. To temporarily suspend monitoring functions for the circuit monitor, you
could place it out of service.
To place a device out of service, follow these steps:
1. On the File menu, click Offline to take your system offline.
Note: This takes the SMS network server offline and disconnects all active clients.
2. On the Control menu, click Diagnostics>System Device Status.
SMS displays the System Device Status Dialog box.
3. Click on the Service Status tab.
© 1996 Square D All Rights Reserved
139
Bulletin 3080IM9601
4. In the Devices in Service box, click the devices to take out of service and drag them to
the Devices Out of Service box (or use the > button).
5. Click the Update Database button to update the SMS database.
To place a device back in service, drag the device from the Devices Out of Service box
back into the Devices In Service box, then click the Update Database button. Take the
system offline, then place it back online. SMS places the device back in service.
Reading and Writing Registers
SMS allows you to read from and write directly to device registers. For example, you
could use this feature to read a value that is not supported in SMS’s standard tables.
Refer to the instruction bulletin for a specific device for register numbers.
To read registers, follow these steps:
1. On the Control menu, click Diagnostics>Read/Write Registers (or press CTRL+R).
SMS displays the Diagnostics Registers dialog box.
140
© 1996 Square D All Rights Reserved
Chapter 17—Diagnostics
2. In the Devices box, click a device to read from.
3. In the Register boxes, enter up to 10 register numbers to read.
To automatically enter sequential register numbers, enter the first register number in
the top register box then press the down arrow key on your computer’s keyboard.
4. Click the Read button.
SMS displays the register values in the Value boxes. Click the radio buttons in the
Format box to change the format of the displayed values.
To write registers, follow these steps:
1. On the Control menu, click Diagnostics>Read/Write Registers.
SMS displays the Diagnostics Registers dialog box.
2. In the Devices box, click a device to write to.
3. In the Register boxes, enter up to 10 registers to write.
4. In the Format box, select the format to enter values.
5. In the Value boxes, enter the values to write.
6. Click the Write button.
SMS displays the Security Check dialog box.
7. Enter your user and password, then click OK.
SMS writes the values to the registers.
Displaying Circuit Monitor Onboard Data
Typically, you will view historical data from Series 2000 Circuit Monitor onboard data
log files in the form of a history table or time-trend plot. Chapter 10 tells how to view
history tables and time-trend plots. Occasionally, you may want to retrieve onboard data
directly from a Series 2000 Circuit Monitor and view it. You can do this using the
Onboard Data File command on the Display menu.
The Onboard Data File command lets you retrieve, view, and print the following circuit
monitor onboard files:
• 14 data log files
• Onboard event log file
• Min/max log file
• Maintenance log file
© 1996 Square D All Rights Reserved
141
Bulletin 3080IM9601
To retrieve onboard data from a circuit monitor, follow these steps:
1. On the Display menu, click Onboard Data File.
SMS displays the Onboard File dialog box.
2. In the Devices box, click a series 2000 circuit monitor.
3. In the Onboard Files box, click the file that you want to view.
The file information window at the bottom of the dialog box shows information
about the selected onboard file including the number of records stored in the file, the
logging interval, and more. To view a list of the quantities that are included in the log
file, click View Quantities.
4. Click the Upload pushbutton.
SMS retrieves the data from the circuit monitor and displays it in a window.
5. To print the data, click Print on the File menu.
6. To save the data to a file, click Save As on the File menu. SMS displays the Save
Onboard Data Log dialog box. Choose a location, enter a filename, and select the
desired Save As type. Click Save. SMS saves the data in the selected file format.
Seeing Who’s Connected to the Server
At any time, you can see who is connected to the PowerLogic Network Server. To see
who’s connected, follow these steps:
1. On the Control menu, click Diagnostics>Connected Users.
SMS displays a list of the users currently connected to the server.
142
© 1996 Square D All Rights Reserved
Chapter 18—Using Dynamic Data Exchange (DDE)
Chapter 18—Using Dynamic Data Exchange (DDE)
SMS supports the Windows feature called Dynamic Data Exchange (DDE). DDE allows
SMS to dynamically exchange data with other Windows applications that support DDE.
SMS supports server DDE. Server DDE allows SMS to serve data to another application.
For example, using server DDE, you could setup a Microsoft Excel spreadsheet to
receive data from SMS.
A few of the many benefits you can obtain using DDE are:
• Trend a variety of power system info using Microsoft Excel, Lotus 123, etc.
• Analyze energy costs by department, individual processes, or other criteria
• Create custom reports
• Analyze cost of production based on various energy sources, number of machined
operations, and so on
• Create custom interfaces including menus, macros, and dialog boxes
• Automate your reports to management
SMS Serving Data to Microsoft Excel (SMS as a DDE Server)
The figure SMS Serving Data to Microsoft Excel on the next page shows how SMS
serves POWERLOGIC device data to Microsoft Excel. The POWERLOGIC Network
Server reads data directly from registers in POWERLOGIC devices. The PowerLogic
Network Server then serves the data to the SMS DDE Server, which serves the data to
the Microsoft Excel spreadsheet.
The following are some important facts to know about using SMS as a DDE server.
• You must install a copy of the DDE server on each computer that you want to serve
data to. In the illustration on the next page, data is being served to Microsoft Excel
spreadsheets on two PCs, therefore the DDE server is installed on each PC.
• The maximum number of DDE servers that can serve data from one POWERLOGIC
Network Server is equal to the number of licensed SMS clients. For example, if the
PowerLogic network server is licensed for 5 SMS clients, the maximum number of
DDE servers is 5.
• The SMS client software does not need to be installed on the DDE Server PCs (see
PC 1 in the illustration). This is because the SMS client is not involved in the transfer
of data. Data flows from the devices, to the PowerLogic Network Server, to the DDE
Server, to Microsoft Excel.
When would you not want to install the SMS client on a PC? In the illustration, PC 1
is located in the accounting department. DDE is used to bring energy usage data into
© 1996 Square D All Rights Reserved
143
Bulletin 3080IM9601
the Microsoft Excel spreadsheet where it is totalled and used to calculated energy
costs. The accountant needs only the energy data and has no need for the SMS client
software.
PC 1
Excel
DDE Server
PC 2
SMS Client
PC 3
SMS Client
Excel
PowerLogic Server
DDE Server
DDE Server must be
installed on each PC that
will receive DDE data.
PowerLogic Devices
SMS Serving Data to Microsoft Excel (SMS as a DDE Server)
To use DDE to export data to Microsoft Excel, you will need to create a Microsoft Excel
spreadsheet with DDE links. The following procedure tells how.
To use DDE to export data from SMS into a Microsoft Excel spreadsheet, do the following:
1. Take SMS offline, close the SMS client, and close the DDE server.
2. Open Microsoft Excel and create a spreadsheet.
3. Click in a cell, and enter the link text as described below.
The link text describes the SMS system name, the device, and the
quantity to import to the cell.
144
© 1996 Square D All Rights Reserved
Chapter 18—Using Dynamic Data Exchange (DDE)
Your system name,
enclosed in single quotes.
The name of the device
(or DDE logical device) that you
assigned in System Manager,
enclosed in single quotes
The quantity—For standard quantities,
use the quantity abbreviation from
Appendix B, or use the register number
preceded by R_. For custom quantities,
enter the exact name of the custom
quantity, enclosed in single quotes.
='systemname' 'devicename'!VLLAvg
A required prefix
for Excel
Pipe symbol used as a
delimiter between the
system name and the device name
(The pipe symbol is located above
the Enter key on most keyboards)
Exclamation
point delimiter
Note: We recommend that you use the quantity abbreviations (from Appendix B) instead of
register numbers in the link text. When you use the quantity abbreviations, SMS returns the
data formatted; when you use register numbers, SMS returns the data unformatted. For
example, if you used the quantity abbreviation “Temp” (for device temperature in degrees C)
in the link text, SMS would return the data with a decimal point in the correct position—for
example, 33.68. But if you used the register number 1002 in the link text, SMS would return
the data without the decimal point—for example, 3368.
4. Repeat step 3 for other cells until you have defined links for all desired quantities.
Save your spreadsheet then close it.
5. Start the PowerLogic Network Server.
6. Start the SMS client software and put your system online.
7. Start the SMS DDE Server that is located on the same computer as your newly
created Microsoft Excel spreadsheet.
8. Open your Microsoft Excel spreadsheet. After several seconds, you should see data in
the cells.
The rate at which data updates depends on the size of the spreadsheet and the DDE
update interval. The next section tells how to change the DDE update interval.
Changing the DDE Update Interval
By default, SMS updates the Microsoft Excel spreadsheet every 15 seconds. You can
change the DDE update interval using the SMSCfg program. (The SMSCfg program is
located in the SMS-3000 directory on the server machine.) To change the update interval,
follow these steps:
1. Start the SMSCfg program.
2. Click on the Intervals tab.
3. In the DDE Update Interval box, enter the desired interval in seconds.
4. Click OK to save your changes and exit the configuration program.
© 1996 Square D All Rights Reserved
145
Bulletin 3080IM9601
Appendix A—Viewing and Printing System Information
Included with SMS is a program called ”File Services.“ The File Services program was
installed in the SMS-3000 directory when you installed SMS. The File Services program
lets you view and print system information such as device configuration, analog and
digital function definitions, data log template definitions, and so on.
Note: A printer must be installed on the PC on which File Services will run. If you need
instructions on installing a printer, see your Windows documentation.
To use the File Services program, do the following:
1. Click File Services on the Tools menu to start the File Services program.
As the program starts, you’ll see the Microsoft Access opening screen (File Services
uses Microsoft Access to generate reports). The SMS-3000 File Service dialog box
displays.
3. In the Report box, select the desired report.
4. If the report requires you to select other options such as a specific device or driver,
additional boxes will appear. Make the appropriate selections.
5. To view the report, click Preview Report. Files Services displays the formatted report.
6. To print the report, click Print on the File menu.
146
© 1996 Square D All Rights Reserved
Appendix B—Abbreviations for Quantities
Appendix B—Abbreviations for Quantities
You will use these abbreviations when creating DDE links in Microsoft
Excel spreadsheets. The abbreviations also appear in tables as column
heads. The abbreviations are case sensitive when being used in Excel
to set up DDE quantities.
Quantity
Update Interval
Frequency
Temperature
Current A
Current B
Current C
Current N
Current G
Current Avg
Current Apparent rms
Current Unbalance A
Current Unbalance B
Current Unbalance C
Current Unbalance Worst
Voltage A-B
Voltage B-C
Voltage C-A
Voltage L-L Avg
Voltage A-N
Voltage B-N
Voltage C-N
Voltage L-N Avg
Voltage Unbalance A-B
Voltage Unbalance B-C
Voltage Unbalance C-A
Voltage Unbalance L-L Worst
Voltage Unbalance A-N
Voltage Unbalance B-N
Voltage Unbalance C-N
Voltage Unbalance L-N Worst
Power Factor A
Power Factor B
Power Factor C
Power Factor Total
Displacement Power Factor A
Displacement Power Factor B
© 1996 Square D All Rights Reserved
Abbreviation
Updateint
Hz
Temp
IA
IB
IC
IN
IG
IAvg
IApp
IUnbalA
IUnbalB
IUnbalC
IUnbalW
VAB
VBC
VCA
VLLAvg
VAN
VBN
VCN
VLNAvg
VUnbalAB
VUnbalBC
VUnbalCA
VUnbalLLW
VUnbalAN
VUnbalBN
VUnbalCN
VUnbalLNW
PFA
PFB
PFC
PFTtl
DPFA
DPFB
147
Bulletin 3080IM9601
Quantity
Displacement Power Factor C
Displacement Power Factor Total
Real Power A
Real Power B
Real Power C
Real Power Total
Reactive Power A
Reactive Power B
Reactive Power C
Reactive Power Total
Apparent Power A
Apparent Power B
Apparent Power C
Apparent Power Total
THD Current A
THD Current B
THD Current C
THD Current N
THD Voltage A-N
THD Voltage B-N
THD Voltage C-N
THD Voltage A-B
THD Voltage B-C
THD Voltage C-A
thd Current A
thd Current B
thd Current C
thd Current N
thd Voltage A-N
thd Voltage B-N
thd Voltage C-N
thd Voltage A-B
thd Voltage B-C
thd Voltage C-A
K-Factor A
K-Factor B
K-Factor C
Crest Factor A
Crest Factor B
Crest Factor C
Crest Factor N
Fundamental Current Mag A
Fundamental Current Ang A
Fundamental Current Mag B
Fundamental Current Ang B
148
© 1996 Square D All Rights Reserved
Abbreviation
DPFC
DPFTtl
kWA
kWB
kWC
kWTtl
kVARA
kVARB
kVARC
kVARTtl
kVAA
kVAB
kVAC
kVATtl
THDIA
THDIB
THDIC
THDIN
THDVAN
THDVBN
THDVCN
THDVAB
THDVBC
THDVCA
thd_IA
thd_IB
thd_IC
thd_IN
thd_VAN
thd_VBN
thd_VCN
thd_VAB
thd_VBC
thd_VCA
KFA
KFB
KFC
CFA
CFB
CFC
CFN
fIMagA
fIAngA
IMagB
fIAngB
Appendix B—Abbreviations for Quantities
Quantity
Fundamental Current Mag C
Fundamental Current Ang C
Fundamental Current Mag N
Fundamental Current Ang N
Fundamental Current Mag G
Fundamental Current Ang G
Fundamental Voltage Mag A-N
Fundamental Voltage Ang A-N
Fundamental Voltage Mag B-N
Fundamental Voltage Ang B-N
Fundamental Voltage Mag C-N
Fundamental Voltage Ang C-N
Fundamental Voltage Mag A-B
Fundamental Voltage Ang A-B
Fundamental Voltage Mag B-C
Fundamental Voltage Ang B-C
Fundamental Voltage Mag C-A
Fundamental Voltage Ang C-A
Fundamental Real Power A
Fundamental Real Power B
Fundamental Real Power C
Fundamental Real Power Total
Fundamental Reactive Power A
Fundamental Reactive Power B
Fundamental Reactive Power C
Fundamental Reactive Power Total
Harmonic Factor A
Harmonic Factor B
Harmonic Factor C
Harmonic Factor Total
Harmonic Real Power A
Harmonic Real Power B
Harmonic Real Power C
Harmonic Real Power Total
Analog Input 1 Value
Analog Input 2 Value
Analog Input 3 Value
Analog Input 4 Value
Min Update Interval
Min Frequency
Min Temperature
Min Current A
Min Current B
Min Current C
Min Current N
© 1996 Square D All Rights Reserved
Abbreviation
fIMagC
fIAngC
fIMagN
fIAngN
fIMagG
fIAngG
fVMagAN
fVAngAN
fVMagBN
fVAngBN
fVMagCN
fVAngCN
fVMagAB
fVAngAB
fVMagBC
fVAngBC
fVMagCA
fVAngCA
fkWA
fkWB
fkWC
fkWTtl
fkVARA
fkVARB
fkVARC
fkVARTtl
HFA
HFB
HFC
HFTtl
hkWA
hkWB
hkWC
hkWTtl
AnalogIn1
AnalogIn2
AnalogIn3
AnalogIn4
MinUpdateInt
MinHz
MinTemp
MinIA
MinIB
MinIC
MinIN
149
Bulletin 3080IM9601
Quantity
Min Current G
Min Current Avg
Min Current Apparent rms
Min Current Unbalance A
Min Current Unbalance B
Min Current Unbalance C
Min Current Unbalance Worst
Min Voltage A-B
Min Voltage B-C
Min Voltage C-A
Min Voltage L-L Avg
Min Voltage A-N
Min Voltage B-N
Min Voltage C-N
Min Voltage L-N Avg
Min Voltage Unbalance A-B
Min Voltage Unbalance B-C
Min Voltage Unbalance C-A
Min Voltage Unbalance L-L Worst
Min Voltage Unbalance A-N
Min Voltage Unbalance B-N
Min Voltage Unbalance C-N
Min Voltage Unbalance L-N Worst
Min Power Factor A
Min Power Factor B
Min Power Factor C
Min Power Factor Total
Min Displacement Power Factor A
Min Displacement Power Factor B
Min Displacement Power Factor C
Min Displacement Power Factor Total
Min Real Power A
Min Real Power B
Min Real Power C
Min Real Power Total
Min Reactive Power A
Min Reactive Power B
Min Reactive Power C
Min Reactive Power Total
Min Apparent Power A
Min Apparent Power B
Min Apparent Power C
Min Apparent Power Total
Min THD Current A
Min THD Current B
150
© 1996 Square D All Rights Reserved
Abbreviation
MinIG
MinIAvg
MinIApp
MinUnbalA
MinUnbalB
MinUnbalC
MinUnbalW
MinVAB
MinVBC
MinVCA
MinVLLAvg
MinVAN
MinVBN
MinVCN
MinLNAvg
MinVUnbalAB
MinVUnbalBC
MinVUnbalCA
MinVUnbalLLW
MinVUnbalAN
MinVUnbalBN
MinVUnbalCN
MinVUnbalLNW
MinPFA
MinPFB
MinPFC
MinPFTtl
MinDPFA
MinDPFB
MinDPFC
MinDPFTtl
MinkWA
MinkWB
MinkWC
MinkWTtl
MinkVARA
MinkVARB
MinkVARC
MinkVARTtl
MinkVAA
MinkVAB
MinkVAC
MinkVATtl
MinTHDIA
MinTHDIB
Appendix B—Abbreviations for Quantities
Quantity
Min THD Current C
Min THD Current N
Min THD Voltage A-N
Min THD Voltage B-N
Min THD Voltage C-N
Min THD Voltage A-B
Min THD Voltage B-C
Min THD Voltage C-A
Min thd Current A
Min thd Current B
Min thd Current C
Min thd Current N
Min thd Voltage A-N
Min thd Voltage B-N
Min thd Voltage C-N
Min thd Voltage A-B
Min thd Voltage B-C
Min thd Voltage C-A
Min K-Factor A
Min K-Factor B
Min K-Factor C
Min Crest Factor A
Min Crest Factor B
Min Crest Factor C
Min Crest Factor N
Min Fundamental Real Power A
Min Fundamental Real Power B
Min Fundamental Real Power C
Min Fundamental Real Power Total
Min Fundamental Reactive Power A
Min Fundamental Reactive Power B
Min Fundamental Reactive Power C
Min Fundamental Reactive Power Total
Min Harmonic Factor A
Min Harmonic Factor B
Min Harmonic Factor C
Min Harmonic Factor Total
Min Harmonic Real Power A
Min Harmonic Real Power B
Min Harmonic Real Power C
Min Harmonic Real Power Total
Min Analog Input Value 1
Min Analog Input Value 2
Min Analog Input Value 3
Min Analog Input Value 4
© 1996 Square D All Rights Reserved
Abbreviation
MinTHDIC
MinTHDIN
MinTHDVAN
MinTHDVBN
MinTHDVCN
MinTHDVAB
MinTHDVBC
MinTHDVCA
Minthd_IA
Minthd_IB
Minthd_IC
Minthd_IN
Minthd_VAN
Minthd_VBN
Minthd_VCN
Minthd_VAB
Minthd_VBC
Minthd_VCA
MinKFA
MinKFB
MinKFC
MinCFA
MinCFB
MinCFC
MinCFN
MinfkWA
MinfkWB
MinfkWC
MinfkWTtl
MinfkVARA
MinfkVARB
MinfkVARC
MinfkVARTtl
MinHFA
MinHFB
MinHFC
MinHFTtl
MinhkWA
MinhkWB
MinhkWC
MinhkWTtl
MinAnalogIn1
MinAnalogIn2
MinAnalogIn3
MinAnalogIn4
151
Bulletin 3080IM9601
Quantity
Max Update Interval
Max Frequency
Max Temperature
Max Current A
Max Current B
Max Current C
Max Current N
Max Current G
Max Current Average
Max Current Apparent rms
Max Current Unbalance A
Max Current Unbalance B
Max Current Unbalance C
Max Current Unbalance Worst
Max Voltage A-B
Max Voltage B-C
Max Voltage C-A
Max Voltage L-L Avg
Max Voltage A-N
Max Voltage B-N
Max Voltage C-N
Max Voltage L-N Avg
Max Voltage Unbalance A-B
Max Voltage Unbalance B-C
Max Voltage Unbalance C-A
Max Voltage Unbalance L-L Worst
Max Voltage Unbalance A-N
Max Voltage Unbalance B-N
Max Voltage Unbalance C-N
Max Voltage Unbalance L-N Worst
Max Power Factor A
Max Power Factor B
Max Power Factor C
Max Power Factor Total
Max Displacement Power Factor A
Max Displacement Power Factor B
Max Displacement Power Factor C
Max Displacement PF Total
Max Real Power A
Max Real Power B
Max Real Power C
Max Real Power Total
Max Reactive Power A
Max Reactive Power B
Max Reactive Power C
152
© 1996 Square D All Rights Reserved
Abbreviation
MaxUpdateInt
MaxHz
MaxTemp
MaxIA
MaxIB
MaxIC
MaxIN
MaxIG
MaxIAvg
MaxIApp
MaxIUnbalA
MaxIUnbalB
MaxIUnbalC
MaxIUnbalW
MaxVAB
MaxVBC
MaxVCA
MaxVLLAvg
MaxVAN
MaxVBN
MaxVCN
MaxVLNAvg
MaxVUnbalAB
MaxVUnbalBC
MaxVUnbalCA
MaxVUnbalLL
MaxVUnbalAN
MaxVUnbalBN
MaxVUnbalCN
MaxVUnbalLN
MaxPFA
MaxPFB
MaxPFC
MaxPFTtl
MaxDPFA
MaxDPFB
MaxDPFC
MaxDPFTtl
MaxKWA
MaxKWB
MaxKWC
MaxKWTtl
MaxkVARA
MaxkVARB
MaxkVARC
Appendix B—Abbreviations for Quantities
Quantity
Max Reactive Power Total
Max Apparent Power A
Max Apparent Power B
Max Apparent Power C
Max Apparent Power Total
Max THD Current A
Max THD Current B
Max THD Current C
Max THD Current N
Max THD Voltage A-N
Max THD Voltage B-N
Max THD Voltage C-N
Max THD Voltage A-B
Max THD Voltage B-C
Max THD Voltage C-A
Max thd Current A
Max thd Current B
Max thd Current C
Max thd Current N
Max thd Voltage A-N
Max thd Voltage B-N
Max thd Voltage C-N
Max thd Voltage A-B
Max thd Voltage B-C
Max thd Voltage C-A
Max K-Factor A
Max K-Factor B
Max K-Factor C
Max Crest Factor A
Max Crest Factor B
Max Crest Factor C
Max Crest Factor N
Max Fundamental Real Power A
Max Fundamental Real Power B
Max Fundamental Real Power C
Max Fundamental Real Power Total
Max Fundamental Reactive Power A
Max Fundamental Reactive Power B
Max Fundamental Reactive Power C
Max Fundamental Reactive Power Total
Max Harmonic Factor A
Max Harmonic Factor B
Max Harmonic Factor C
Max Harmonic Factor Total
Max Harmonic Real Power A
© 1996 Square D All Rights Reserved
Abbreviation
MaxkVARTtl
MaxkVAA
MaxkVAB
MaxkVAC
MaxkVATtl
MaxTHDIA
MaxTHDIB
MaxTHDIC
MaxTHDIN
MaxTHDVAN
MaxTHDVBN
MaxTHDVCN
MaxTHDVAB
MaxTHDVBC
MaxTHDVCA
Maxthd_IA
Maxthd_IB
Maxthd_IC
Maxthd_IN
Maxthd_VAN
Maxthd_VBN
Maxthd_VCN
Maxthd_VAB
Maxthd_VBC
Maxthd_VCA
MaxKFA
MaxKFB
MaxKFC
MaxCFA
MaxCFB
MaxCFC
MaxCFN
MaxfkWA
MaxfkWB
MaxfkWC
MaxfkWTtl
MaxfkVARA
MaxfkVARB
MaxfkVARC
MaxfkVARTtl
MaxHFA
MaxHFB
MaxHFC
MaxHFTtl
MaxhkWA
153
Bulletin 3080IM9601
Quantity
Max Harmonic Real Power B
Max Harmonic Real Power C
Max Harmonic Real Power Total
Max Analog Input 1 Value
Max Analog Input 2 Value
Max Analog Input 3 Value
Max Analog Input 4 Value
Real Energy Into the Load
Reactive Energy Into the Load
Real Energy Out of the Load
Reactive Energy Out of the Load
Apparent Energy
Real Energy
Reactive Energy
Conditional Real Energy In
Conditional Reactive Energy In
Conditional Real Energy Out
Conditional Reactive Energy Out
Conditional Apparent Energy
Incremental Real Energy In
Incremental Reactive Energy In
Incremental Real Energy Out
Incremental Reactive Energy Out
Incremental Apparent Energy
Demand Current Avg
Demand Current A
Demand Current B
Demand Current C
Demand Current N
K-Factor Demand A
K-Factor Demand B
K-Factor Demand C
Peak Demand Current Avg
Peak Demand Current A
Peak Demand Current B
Peak Demand Current C
Peak Demand Current N
Coincident K-Factor Demand Pk Prod. A
Coincident Current Demand Pk Prod. A
Coincident K-Factor Demand Pk Prod. B
Coincident Current Demand Pk Prod. B
Coincident K-Factor Demand Pk Prod. C
Coincident Current Demand Pk Prod. C
Power Factor Total Last Dmd Intl
154
© 1996 Square D All Rights Reserved
Abbreviation
MaxhkWB
MaxhkWC
MaxhkWTtl
MaxAnalogIn1
MaxAnalogIn2
MaxAnalogIn3
MaxAnalogIn4
kWHr_I
kVARHr_I
kWHr_O
kVARHr_O
kVAHr
kWHr
kVARHr
CkWHr_I
CkVARHr_I
CkWHr_O
CkVARHr_O
CkVAHr
IkWHr_I
IkVARHr_I
IkWHr_O
IkVARHr_O
IkVAHr
IDAvg
IAD
IBD
ICD
IND
KFDA
KFDB
KFDC
PklDAvg
PklAD
PklBD
PklCD
PklND
CoinKFDA
CoinIAD
CoinKFDB
CoinIBD
CoinKFDC
CoinICD
PF_LDInt
Appendix B—Abbreviations for Quantities
Quantity
Demand Real Power (KWD)
Demand Reactive Power (KVARD)
Demand Apparent Power (KVAD)
Peak Demand Real Power (KWD)
PF Coincident w/Peak KW Demand
KVAR Dmd Coincident w/Peak KW Dmd
KVA Dmd Coincident w/Peak KW Dmd
Peak Demand Reactive Power (KVARD)
PF Coincident w/Peak KVAR Demand
KW Dmd Coincident w/Peak KVAR Dmd
KVA Dmd Coincident w/Peak KVAR Dmd
Peak Demand Apparent Power (KVAD)
PF Coincident w/Peak KVA Demand
KW Dmd Coincident w/Peak KVA Dmd
KAR Dmd Coincident w/Peak KVA Dmd
Predicted KW Demand
Predicted KVAR Demand
Predicted KVA Demand
Max KWD Last Incr. Energy Interval
Max KVARD Last Incr. Energy Interval
Max KVAD Last Incr. Energy Interval
Time Remaing in Dmd SubInterval
D/T Last Restart
D/T Peak Demand Current A
D/T Peak Demand Current B
D/T Peak Demand Current C
D/T Peak Demand Real Power
D/T Last Reset Peak Dmd Currents
D/T Last Reset Min/Max
D/T Last Circuit Tracker Write
D/T Last Reset Peak Dmd Power
D/T Last Reset Accum. Energies
D/T Last Control Power Failure
D/T Energy Mgmt Level 1 Exceeded
D/T Energy Mgmt Level 2 Exceeded
D/T Energy Mgmt Level 3 Exceeded
Device Clock Date/Time
D/T K-Factor Dmd Peak Product A
D/T K-Factor Dmd Peak Product B
D/T K-Factor Dmd Peak Product C
D/T Peak Demand Reactive Power
D/T Peak Demand Apparent Power
Incremental Energy Start Time of Day
D/T Clear of Conditional Energy
D/T Last Increment Energy Update
© 1996 Square D All Rights Reserved
Abbreviation
kWD
kVARD
kVAD
PkkWD
PF_PkkWD
kVARD_PkkWD
kVAD_PkkWD
PkkVARD
PF_PkkVARD
kWD_PkkVARD
kVAD_PkkVARD
PkkVAD
PF_PkkVAD
kWD_PkkVAD
kVARD_PkkVAD
PredkWD
PredkVARD
PredkVAD
MaxkWDLastInt
MaxkVARDLastInt
MaxkVADLastInt
TimeRemSI
DTLastRestart
DTPkIAD
DTPkIBD
DTPkICD
DTPkkWD
DTResetPkID
DTResetMinMax
DTCktTrkr
DTResetPkkWD
DTResetEnerg
DTCPFail
DT_EMLevel1
DT_EMLevel2
DT_EMLevel3
DT_3Regs
DTCoinKFDA
DTCoinKFDB
DTCoinKFDC
DTPkkVARD
DTTPkkVAD
IEStartTOD
DTCEClr
DTIEUpdate
155
Bulletin 3080IM9601
Quantity
D/T Peak Demand Current Avg
D/T Peak Demand Current N
D/T Max KWD in Last Inc. Energy Intvl.
D/T Max KVARD in Last Inc. Energy Intvl.
D/T Max KVAD in Last Inc. Energy Intvl.
D/T Last Write to Registers 2000-2999
Source of Last Write Reg. 2000-2999
D/T Last Write to Registers 5600-6999
Source of Last Write Reg. 5600-6999
D/T Last Write to Registers 7000-7399
Source of Last Write Reg. 7000Label
Nameplate
Incremental Energy Interval
Power Demand Interval
Power Demand Sub-Interval
Current/K-Factor Demand Interval
Input/Output Module Installed
Energy Mgmt Setpoint Level 1
Energy Mgmt Setpoint Level 2
Energy Mgmt Setpoint Level 3
Energy Mgmt Level 1 Highest Demand
Energy Mgmt Level 2 Highest Demand
Energy Mgmt Level 3 Highest Demand
KYZ Relay Mode
R1 Relay Mode
R2 Relay Mode
R3 Relay Mode
Analog Output 1 Label
Analog Output 2 Label
Analog Output 3 Label
Analog Output 4 Label
Analog Input 1 Units
Analog Input 2 Units
Analog Input 3 Units
Analog Input 4 Units
High Speed Event Pickup Mode
Oldest Record Event File
Newest Record Event File
Maximum Current Limit
Maximum Voltage Limit
Maximum Power Limit
Energy Accumulation Mode
Energy Management Level 1 Status
Energy Management Level 2 Status
156
© 1996 Square D All Rights Reserved
Abbreviation
DTPkIDAvg
DTPkIND
DTIEMaxkWD
DTIEMaxkVARD
DTIEMaxkVAD
DTR2000_2999
SourceR2000_2999
DTR5600_6999
SourceR5600_6999
DTR7000_7399
SourceR7000_7399
DeviceLabel
DeviceNP
IncEnergyInt
PowerDmdInt
PowerDmdSubInt
CurrentDmdInt
IOModule
EMLvl1SP
EMLvl2SP
EMLvl3SP
EMLvl1Worst
EMLvl2Worst
EMLvl3Worst
KYZMode
R1Mode
R2Mode
R3Mode
AnalogOutLabel1
AnalogOutLabel2
AnalogOutLabel3
AnalogOutLabel4
AnalogIn1Units
AnalogIn2Units
AnalogIn3Units
AnalogIn4Units
HiSpeedPickupMod
EvntOldRecord
EvntNewRecord
MaxILimit
MaxVLimit
MaxPLimit
AccumMode
EMLvl1Status
EMLvl2Status
Appendix B—Abbreviations for Quantities
Quantity
Energy Management Level 3 Status
Input 1 Status
Input 2 Status
Input 3 Status
Input 4 Status
Input 5 Status
Input 6 Status
Input 7 Status
Input 8 Status
Input 9 Status
Input 10 Status
Input 11 Status
Input 12 Status
Input 13 Status
Input 14 Status
Input 15 Status
Input 16 Status
Input 17 Status
Input 18 Status
Input 19 Status
Input 20 Status
Input 21 Status
Input 22 Status
Input 23 Status
Input 24 Status
Input 25 Status
Input 26 Status
Input 27 Status
Input 28 Status
Input 29 Status
Input 30 Status
Input 31 Status
Input 32 Status
Input 33 Status
Input 34 Status
Input 35 Status
Input 36 Status
Input 37 Status
Input 38 Status
Input 39 Status
Input 40 Status
Input 41 Status
Input 42 Status
Input 43 Status
Input 44 Status
© 1996 Square D All Rights Reserved
Abbreviation
EMLvl3Status
Input1
Input2
Input3
Input4
Input5
Input6
Input7
Input8
Input9
Input10
Input11
Input12
Input13
Input14
Input15
Input16
Input17
Input18
Input19
Input20
Input21
Input22
Input23
Input24
Input25
Input26
Input27
Input28
Input29
Input30
Input31
Input32
Input33
Input34
Input35
Input36
Input37
Input38
Input39
Input40
Input41
Input42
Input43
Input44
157
Bulletin 3080IM9601
Quantity
Input 45 Status
Input 46 Status
Input 47 Status
Input 48 Status
Input 49 Status
Input 50 Status
Input 51 Status
Input 52 Status
Input 53 Status
Input 54 Status
Input 55 Status
Input 56 Status
Input 57 Status
Input 58 Status
Input 59 Status
Input 60 Status
Input 61 Status
Input 62 Status
Input 63 Status
Input 64 Status
KYZ Relay Status
R1 Relay Status
R2 Relay Status
R3 Relay Status
R4 Relay Status
KYZ Relay Control
R1 Relay Control
R2 Relay Control
R3 Relay Control
KYZ Relay Override State
R1 Relay Override State
R2 Relay Override State
R3 Relay Override State
Voltage Swell Ph. A-B/A-N Alarm
Voltage Swell Ph. B-N Alarm
Voltage Swell Ph. C-N/C-B Alarm
Voltage Swell Ph. A Alarm
Voltage Swell Ph. B Alarm
Voltage Swell Ph. C Alarm
Current Swell Neutral Alarm
Voltage Sag Ph. A-B/A-N Alarm
Voltage Sag Ph. B-N Alarm
Voltage Sag Ph. C-N/C-B Alarm
Current Sag Ph. A Alarm
Current Sag Ph. B Alarm
158
© 1996 Square D All Rights Reserved
Abbreviation
Input45
Input46
Input47
Input48
Input49
Input50
Input51
Input52
Input53
Input54
Input55
Input56
Input57
Input58
Input59
Input60
Input61
Input62
Input63
Input64
KYZStatus
R1Status
R2Status
R3Status
R4Status
KYZControl
R1Control
R2Control
R3Control
KYZOverride
R1Override
R2Override
R3Override
Alarm201Status
Alarm202Status
Alarm203Status
Alarm204Status
Alarm205Status
Alarm206Status
Alarm207Status
Alarm208Status
Alarm209Status
Alarm210Status
Alarm211Status
Alarm212Status
Appendix B—Abbreviations for Quantities
Quantity
Current Sag Ph. C Alarm
Current Sag Neutral Alarm
Over Current Ph. A Alarm
Over Current Ph. B Alarm
Over Current Ph. C Alarm
Over Current Neutral Alarm
Over Current Ground Alarm
Under Current Ph. A Alarm
Under Current Ph. B Alarm
Under Current Ph. C Alarm
Current Unbalance Ph. A Alarm
Current Unbalance Ph. B Alarm
Current Unbalance Ph. C Alarm
Current Phase Loss Alarm
Over Voltage Ph. A-N Alarm
Over Voltage Ph. B-N Alarm
Over Voltage Ph. C-N Alarm
Over Voltage Ph. A-B Alarm
Over Voltage Ph. B-C Alarm
Over Voltage Ph. C-A Alarm
Under Voltage Ph. A-N Alarm
Under Voltage Ph. B-N Alarm
Under Voltage Ph. C-N Alarm
Under Voltage Ph. A-B Alarm
Under Voltage Ph. B-C Alarm
Under Voltage Ph. C-A Alarm
Voltage Unbalance Ph. A-N Alarm
Voltage Unbalance Ph. B-N Alarm
Voltage Unbalance Ph. C-N Alarm
Voltage Unbalance Ph. A-B Alarm
Voltage Unbalance Ph. B-C Alarm
Voltage Unbalance Ph. C-A Alarm
Voltage Phase Loss Alarm
Over KVA Alarm
Over KW Into the Load Alarm
Over KW Out of the Load Alarm
Over KVAR Into the Load Alarm
Over KVAR Out of the Load Alarm
Over Demand Current Ph. A Alarm
Over Demand Current Ph. B Alarm
Over Demand Current Ph. C Alarm
Over Demand Current Average
Over Frequency Alarm
Under Frequency Alarm
Lagging Power Factor Alarm
© 1996 Square D All Rights Reserved
Abbreviation
Alarm213Status
Alarm214Status
Alarm1Status
Alarm2Status
Alarm3Status
Alarm4Status
Alarm5Status
Alarm6Status
Alarm7Status
Alarm8Status
Alarm9Status
Alarm10Status
Alarm11Status
Alarm12Status
Alarm13Status
Alarm14Status
Alarm15Status
Alarm16Status
Alarm17Status
Alarm18Status
Alarm19Status
Alarm20Status
Alarm21Status
Alarm22Status
Alarm23Status
Alarm24Status
Alarm25Status
Alarm26Status
Alarm27Status
Alarm28Status
Alarm29Status
Alarm30Status
Alarm31Status
Alarm32Status
Alarm33Status
Alarm34Status
Alarm35Status
Alarm36Status
Alarm37Status
Alarm38Status
Alarm39Status
Alarm40Status
Alarm41Status
Alarm42Status
Alarm43Status
159
Bulletin 3080IM9601
Quantity
Leading Power Factor Alarm
Lagging Displacement P.F. Alarm
Leading Displacement P.F. Alarm
Over THD Current Ph. A Alarm
Over THD Current Ph. B Alarm
Over THD Current Ph. C Alarm
Over THD Voltage Ph. A-N Alarm
Over THD Voltage Ph. B-N Alarm
Over THD Voltage Ph. C-N Alarm
Over THD Voltage Ph. A-B Alarm
Over THD Voltage Ph. B-C Alarm
Over THD Voltage Ph. C-A Alarm
Over K-Factor Ph. A Alarm
Over K-Factor Ph. B Alarm
Over K-Factor Ph. C Alarm
Over Predicted KVA Demand Alarm
Over Predicted KW Demand Alarm
Over Predicted KVAR Demand Alarm
Over KVA Demand Level 1 Alarm
Over KVA Demand Level 2 Alarm
Over KVA Demand Level 3 Alarm
Over KW Demand Level 1 Alarm
Over KW Demand Level 2 Alarm
Over KW Demand Level 3 Alarm
Over KVAR Demand Alarm
Over Lagging Power Factor Alarm
Under KW Alarm
Reverse Power Alarm
Phase Reversal Alarm
Input 1 Off to On Alarm
Input 2 Off to On Alarm
Input 3 Off to On Alarm
Input 4 Off to On Alarm
Input 5 Off to On Alarm
Input 6 Off to On Alarm
Input 7 Off to On Alarm
Input 8 Off to On Alarm
Input 1 On to Off Alarm
Input 2 On to Off Alarm
Input 3 On to Off Alarm
Input 4 On to Off Alarm
Input 5 On to Off Alarm
Input 6 On to Off Alarm
Input 7 On to Off Alarm
Input 8 On to Off Alarm
160
© 1996 Square D All Rights Reserved
Abbreviation
Alarm44Status
Alarm45Status
Alarm46Status
Alarm49Status
Alarm50Status
Alarm51Status
Alarm52Status
Alarm53Status
Alarm54Status
Alarm55Status
Alarm56Status
Alarm57Status
Alarm58Status
Alarm59Status
Alarm60Status
Alarm61Status
Alarm62Status
Alarm63Status
Alarm64Status
Alarm65Status
Alarm66Status
Alarm67Status
Alarm68Status
Alarm69Status
Alarm70Status
Alarm71Status
Alarm72Status
Alarm73Status
Alarm74Status
Alarm75Status
Alarm76Status
Alarm77Status
Alarm78Status
Alarm79Status
Alarm80Status
Alarm81Status
Alarm82Status
Alarm83Status
Alarm84Status
Alarm85Status
Alarm86Status
Alarm87Status
Alarm88Status
Alarm89Status
Alarm90Status
Appendix B—Abbreviations for Quantities
Quantity
End of Incr. Energy Interval Event
Power-Up/Reset Event
End of Demand Interval Event
End of Update Cycle Event
Over Analog Input 1 Alarm
Over Analog Input 2 Alarm
Over Analog Input 3 Alarm
Over Analog Input 4 Alarm
Under Analog Input 1 Alarm
Under Analog Input 2 Alarm
Under Analog Input 3 Alarm
Under Analog Input 4 Alarm
Breaker 9 Status/Control
Breaker 10 Status/Control
Breaker 11 Status/Control
Breaker 12 Status/Control
Breaker 13 Status/Control
Breaker 14 Status/Control
Breaker 15 Status/Control
Breaker 16 Status/Control
Breaker 1 Status/Control
Breaker 2 Status/Control
Breaker 3 Status/Control
Breaker 4 Status/Control
Breaker 5 Status/Control
Breaker 6 Status/Control
Breaker 7 Status/Control
Breaker 8 Status/Control
Breaker 25 Status/Control
Breaker 26 Status/Control
Breaker 27 Status/Control
Breaker 28 Status/Control
Breaker 29 Status/Control
Breaker 30 Status/Control
Breaker 31 Status/Control
Breaker 32 Status/Control
Breaker 17 Status/Control
Breaker 18 Status/Control
Breaker 19 Status/Control
Breaker 20 Status/Control
Breaker 21 Status/Control
Breaker 22 Status/Control
Breaker 23 Status/Control
Breaker 24 Status/Control
Breaker 41 Status/Control
© 1996 Square D All Rights Reserved
Abbreviation
Alarm99Status
Alarm100Statu
Alarm101Statu
Alarm102Statu
Alarm103Statu
Alarm104Statu
Alarm105Statu
Alarm106Statu
Alarm107Statu
Alarm108Statu
Alarm109Statu
Alarm110Statu
BKR9
BKR10
BKR11
BKR12
BKR13
BKR14
BKR15
BKR16
BKR1
BKR2
BKR3
BKR4
BKR5
BKR6
BKR7
BKR8
BKR25
BKR26
BKR27
BKR28
BKR29
BKR30
BKR31
BKR32
BKR17
BKR18
BKR19
BKR20
BKR21
BKR22
BKR23
BKR24
BKR41
161
Bulletin 3080IM9601
Quantity
Breaker 42 Status/Control
Breaker 33 Status/Control
Breaker 34 Status/Control
Breaker 35 Status/Control
Breaker 36 Status/Control
Breaker 37 Status/Control
Breaker 38 Status/Control
Breaker 39 Status/Control
Breaker 40 Status/Control
Demand Current % Capacity
Peak Demand Current % Capacity
Breaker Status
Breaker Trip Unit Status
Breaker Load Relative to 85% LDPU
Breaker LDPU in Progress
Breaker Reverse Power Status
Relay Trip Status
Relay Pickup Status
D/T Last Phase Inst. O/C Pickup
D/T Last Phase Time O/C Pickup
D/T Last Ground Fault Inst. O/C Pickup
D/T Last Ground Fault Time O/C Pickup
Cause of Last Trip
D/T of Last Trip
Phase A Current at Last Trip
Phase B Current at Last Trip
Phase C Current at Last Trip
Neutral Current at Last Trip
Ground Current at Last Trip
Average Current at Last Trip
Real Power (KW) at Last Trip
Real Energy (KWH) at Last Trip
Demand Current Avg. at Last Trip
Demand Current A at Last Trip
Demand Current B at Last Trip
Demand Current C at Last Trip
Demand Real Power at Last Trip
Cause of 2nd Last Trip
D/T of 2nd Last Trip
Phase A Current at 2nd Last Trip
Phase B Current at 2nd Last Trip
Phase C Current at 2nd Last Trip
Ground Current at 2nd Last Trip
Average Current at 2nd Last Trip
Demand Current Avg. at 2nd Last Trip
162
© 1996 Square D All Rights Reserved
Abbreviation
BKR42
BKR33
BKR34
BKR35
BKR36
BKR37
BKR38
BKR39
BKR40
DmdCap
PkDmdCap
810DBrkrStatus
810DBrkrTripStat
810DHiLoad
810D_LDPU
810DNegPwr
DRTripStat
DR_PU
DTPhInstPU
DTPhTimePU
DTGFInstPU
DTGFTimePU
CauseTrip
DTLastTrip
IA_Trip
IB_Trip
IC_Trip
IN_Trip
IG_Trip
IAvg_Trip
kW_Trip
kWHr_Trip
IDAvg_Trip
IAD_Trip
IBD_Trip
ICD_Trip
kWD_Trip
CauseTrip2
DTLastTrip2
IA_Trip2
IB_Trip2
IC_Trip2
IG_Trip2
IAvg_Trip2
IDAvg_Trip2
Appendix B—Abbreviations for Quantities
Quantity
Demand Current A at 2nd Last Trip
Demand Current B at 2nd Last Trip
Demand Current C at 2nd Last Trip
Cause of 3rd Last Trip
D/T of 3rd Last Trip
Phase A Current at 3rd Last Trip
Phase B Current at 3rd Last Trip
Phase C Current at 3rd Last Trip
Ground Current at 3rd Last Trip
Average Current at 3rd Last Trip
Demand Current Avg. at 3rd Last Trip
Demand Current A at 3rd Last Trip
Demand Current B at 3rd Last Trip
Demand Current C at 3rd Last Trip
Breaker Sensor/Rating Plug Size
Breaker Rating Plug Multiplier
Long Delay Pickup Slope
Long Delay Pickup Amp Setting
Long Delay Pickup Time Delay
Short Delay Pickup Slope
Short Delay Pickup Amp Setting
Short Delay Pickup Time Delay
Instantaneous Pickup Amp Setting
Ground Fault Pickup Slope
Ground Fault Pickup Amp Setting
Ground Fault Pickup Time Delay
Fourth Pole Protection Option
Frequency Select Option
Long Delay Memory Option
Long Delay Option
Ground Fault Option
Short Delay Option
Discriminator Option
Instantaneous Protection Option
Phase CT Ratio:5
Ground CT Ratio:5
Phase Pickup Time Delay
Phase Inst. Pickup Time Delay
Ground Pickup Time Delay
Phase Pickup Amp Setting
Ground Inst. Pickup Time Delay
Phase Inst. Pickup Amp Setting
Ground Inst. Pickup Amp Setting
Phase Relay Time Current Curv
Ground Relay Time Current Curve
© 1996 Square D All Rights Reserved
Abbreviation
IAD_Trip2
IBD_Trip2
ICD_Trip2
CauseTrip3
DTLastTrip3
IA_Trip3
IB_Trip3
IC_Trip3
IG_Trip3
IAvg_Trip3
IDAvg_Trip3
IAD_Trip3
IBD_Trip3
ICD_Trip3
PlugSize
PlugMult
LDPUSlope
LDPUAmps
LDPUDelay
SDPUSlope
SDPUAmps
SDPUDelay
InstPUAmps
GFPUSlope
GFPUAmps
GFPUDelay
810DFourthPole
810DFreqSel
810DLDMem
810DLD
810DGF
810DSD
810DDisc
810DInst
PhCTRatio
GFCTRatio
PhPUTD
PhInstPUTD
GFPUTD
PhPUAmps
GFInstPUTD
PhInstPUAmps
GFInstPUAmps
PhTCC
GFTCC
163
Bulletin 3080IM9601
Quantity
Total Breaker Trips Since Counter Reset
Number Long Delay Trips Since Reset
Number Short Delay Trips Since Reset
Number Inst. Trips Since Reset
Number G.F. Trips Since Reset
Number Discriminator Trips Since Reset
Number Override Trips Since Reset
D/T Last Reset of 810D Trip Counters
D/T Last Breaker Operation
Total Relay Trips Since Counter Reset
Phase Time O/C Trips Since Reset
Phase Inst. O/C Trips Since Reset
G.F. Time O/C Trips Since Reset
G.F. Inst. O.C. Trips Since Reset
D/T Last Reset of DR Trip Counters
PIF3 Battery Status
MicroLogic Breaker Trip Status
Breaker Plug Rating
Breaker Type
External Ground Fault System Option
Short Time Option
Ground Fault Option
Instantaneous Pickup Option
Number Overload Trips
Number Short Circuit Trips
Number Ground Fault Trips
Hottest Coil Temperature
Coil 1 (A) Temperature
Coil 2 (B) Temperature
Coil 3 (C) Temperature
Transformer Fans Status
Transformer Fans Mode
Transformer Type
Fans On Setpoint
Fans Off Setpoint
Temperature Alarm Pickup Setpoint
Temperature Alarm Dropout Setpoint
Hi-Temp Shutdown Setpoint
Fans-On Setpoint Status
Alarm Setpoint Status
Shutdown Setpoint Status
164
© 1996 Square D All Rights Reserved
Abbreviation
N810DTrips
NLDTrips
NSDTrips
NInstTrips
N810DGFTrips
N810DDiscTrips
N810DOvrideTrips
DTRstTripCtr810D
DTLastBrkrOp
NDRTrips
NPhTrips
NPhInstTrips
NDRGFTrips
NGFInstTrips
DTRstTripCtrD
PIF3BattStat
PIF3TripStatus
PIF3PlugRating
PIF3BrkrType
PIF3ExtGF
PIF3SD
PIF3GF
PIF3Inst
NOverloadTrips
NSCTrips
NGFTrips
HotCoilTemp
Coil1Temp
Coil2Temp
Coil3Temp
FanStatus
FanMode
TransformerType
FansOnTemp
FansOffTemp
AlarmOnTemp
AlarmOffTemp
ShutdownTemp
FansTempStatus
AlarmTempStatus
ShutdownStatus
Appendix C—Entering Pickup and Dropout Setpoints and Delays…
Appendix C—Entering Pickup and Dropout Setpoints and
Time Delays for CM2000 On-Board Alarms
This appendix lists permissible values for pickup and dropout setpoints and time delays for
CM-2150 and higher on-board alarms and events with Version 14 firmware and later. Exact
values must be determined by the user based on the application. The Series 2000 Circuit
Monitor instruction bulletin lists detailed definitions for alarms and events.
The following tables list more specific guidelines for entering pickup and dropout setpoints
and time delays from this software.
General Rules
The following are general rules for entering the setpoints and time delays:
• Do not enter commas for any value. For example, enter 10000, not 10,000.
• Time delays can be set from zero to 32767 seconds, in whole second increments, except as
noted for the Swell and Sag events, which are in cycles.
Differences Between Software and Front Panel Displays
Important: The pickup and dropout setpoints downloaded to the circuit monitor from the software
may differ from the setpoints viewed from the front panel LED display on the circuit monitor itself.
This is because the software displays scaled values while the circuit monitor displays register values.
Two examples of this:
• With PT ratio set at 138000:120 and an undervoltage alarm set at 130000 volts, a pickup
value of 130000 is entered and downloaded from the software to the circuit monitor. From
the circuit monitor front panel, the pickup value displays as 13000, because the maximum
raw register value allowed in the circuit monitor is 32767; the circuit monitor then applies
a “scale factor” of 10 to the 13000 register value for actual pickup at 130000 volts.
• For any alarm codes that are set in tenths of percent (such as Alarm 9—Current Unbalance Phase A), you can enter, for example, 16.2 percent pickup from the software and
download that value to the circuit monitor. However, the circuit monitor front panel will
display a value of 162.
Any perceived conflict such as those between the software settings and the circuit monitor
front panel displayed settings can be resolved by referring to the Series 2000 Circuit
Monitor instruction bulletin.
© 1996 Square D All Rights Reserved
165
166
Current Phase Loss (Any 1)
Over Voltage Phase A-N
Over Voltage Phase B-N
Over Voltage Phase C-N
Over Voltage Phase A-B
Over Voltage Phase B-C
Over Voltage Phase C-A
Under Voltage Phase A-N
Under Voltage Phase B-N
Under Voltage Phase C-N
Under Voltage Phase A-B
Under Voltage Phase B-C
Under Voltage Phase C-A
Voltage Unbalance Phase A-N
Voltage Unbalance Phase B-N
Voltage Unbalance Phase C-N
Voltage Unbalance Phase A-B
Voltage Unbalance Phase B-C
Voltage Unbalance Phase C-A
Voltage Phase Loss (Any 1)
12
13
14
15
16
17
18
19
20
21
22
23
24
25
26
27
28
29
30
31
Description
Over Current Phase A
Over Current Phase B
Over Current Phase C
Over Current Neutral
Over Current Ground
Under Current Phase A
Under Current Phase B
Under Current Phase C
Current Unbalance Phase A
Current Unbalance Phase B
Current Unbalance Phase C
1
2
3
4
5
6
7
8
9
10
11
Alarm No.
© 1996 Square D All Rights Reserved
Volts
Tenths %
Volts
Volts
Tenths %
Tenths %
Enter positive integer values. Pickup value lower than dropout.
Example: 100 volt pickup, 475 volt dropout. Alarm will not pick up on
simultaneous undervoltage or loss on all three phases.
Enter positive decimal value (to tenths if needed).
Pickup value higher than dropout.
Example: 10% pickup, 2.5% dropout. Alarm pickup is based on the
percentage difference between the phase voltage with respect to the
average of all three phase voltages.
Enter positive integer values.
Pickup value lower than dropout.
Example: 460 volt pickup, 475 volt dropout.
Enter positive integer values.
Pickup value lower than dropout.
Example: 425 amp pickup, 500 amp dropout.
Enter positive decimal values (to tenths if needed). Pickup value higher
than dropout. Example: 20% pickup, 7.5% dropout. Alarm pickup is based
on the percentage difference between the phase current with respect to the
average of all three phase currents.
Enter positive decimal values (to tenths if needed). Pickup value lower than
dropout. Example: 80% pickup, 92.5% dropout. Alarm pickup is based on
ratio of smallest phase current to largest phase current.
Enter positive integer values.
Pickup value higher than dropout.
Example: 495 volt pickup, 485 volt dropout.
Amps
Remarks/Comments/Examples
Enter positive integer values.
Pickup value higher than dropout.
Example: 500 amp pickup, 425 amp dropout.
Amps
Pickup/Dropout Units
Bulletin 3080IM9601
Over Current Demand Phase A
Over Current Demand Phase B
Over Current Demand Phase C
Over Demand Current Average
Over Frequency
Under Frequency
Lagging Power Factor Total
Leading Power Factor Total
42
43
44
Over KVAR Into the Load
35
37
38
39
40
41
Over KW Out of the Load
34
Over KVAR Out of the Load
Over KW Into the Load
33
36
Over KVA
Description
32
Alarm No.
© 1996 Square D All Rights Reserved
Power Factor
in thousandths
Power Factor
in thousandths
Hertz in
hundredths
Hertz in
hundredths
Amps
KVAR
KVAR
KW
KW
KVA
Pickup/Dropout Units
Enter positive integer values (to hundredths if needed).
Pickup value higher than dropout.
Example: 60.25 Hz pickup, 60 Hz dropout.
Enter positive integer values (to hundredths if needed).
Pickup value lower than dropout.
Example: 59.75 Hz pickup, 60 Hz dropout.
Enter decimal values (to thousandths if needed). Pickup value must be negative (lagging) and more lagging than dropout. Dropout value can be positive (leading) or negative (lagging) and must be less lagging than pickup.
Example: -.85 pickup, -.925 dropout.
Example: -.9 pickup, .975 dropout.
Enter decimal values (to thousandths if needed). Pickup value must be
positive (leading) and more leading than dropout. Dropout value can be
positive (leading) or negative (lagging) and must be less leading than pickup.
Example: .95 pickup, -.95 dropout.
Example: .9 pickup, .975 dropout.
Enter positive integer values. Pickup value higher than dropout.
Example: 2000 KVA pickup, 1750 KVA dropout.
Enter positive integer values. Pickup value higher than dropout.
Example: 2000 KW pickup, 1750 KW dropout. Think of this alarm as "overpositive" KW whereas Alarm 34 below is "over-negative" KW.
Enter positive integer values. Pickup value higher than dropout.
Example: 2000 KW pickup, 1750 KW dropout. Think of this alarm as "overnegative" KW; note that setpoints are, however, entered as positive values.
Enter positive integer values. Pickup value higher than dropout.
Example: 2000 KVAR pickup, 1750 KVAR dropout. Think of this alarm as
"over-positive" or "over-leading" KVAR whereas Alarm 36 below is "overnegative" or "over-lagging" KVAR.
Enter positive integer values. Pickup value higher than dropout.
Example: 2000 KVAR pickup, 1750 KVAR dropout. Think of this alarm as
"over-negative" or "over-lagging" KVAR; note that setpoints are, however,
entered as positive values.
Enter positive decimal values.
Pickup value higher than dropout.
Example: 500 amp pickup, 425 amp dropout.
Remarks/Comments/Examples
Appendix C—Entering Pickup and Dropout Setpoints and Delays…
167
168
Over THD Current Phase A
Over THD Current Phase B
Over THD Current Phase C
Over THD Voltage Phase A-N
Over THD Voltage Phase B-N
Over THD Voltage Phase C-N
Over THD Voltage Phase A-B
Over THD Voltage Phase B-C
Over THD Voltage Phase C-A
Over K-Factor Phase A
Over K-Factor Phase B
Over K-Factor Phase C
Over Predicted KVA Demand
Over Predicted KW Demand
Over Predicted KVAR Demand
Over KVA Demand Level 1
Over KVA Demand Level 2
Over KVA Demand Level 3
Over KW Demand Level 1
Over KW Demand Level 2
Over KW Demand Level 3
62
63
64
65
66
67
68
69
Lagging Displacement Power
Factor Total
Leading Displacement Power
Factor Total
Reserved
Description
47
48
49
50
51
52
53
54
55
56
57
58
59
60
61
46
45
Alarm No.
© 1996 Square D All Rights Reserved
KW
KVA
KVAR
KW
KVA
Tenths %
Power Factor
in thousandths
Pickup/Dropout Units
Enter positive integer values. Pickup value higher than dropout.
Example: 2000 KVA pickup, 1750 KVA dropout.
Enter positive integer values. Pickup value higher than dropout.
Example: 2000 KW pickup, 1750 KW dropout. Alarm operation is based on
the absolute value of KW demand so ti will pick up on positive or negative
KW demand at the pickup setpoint.
Enter positive integer values. Pickup value higher than dropout.
Example: 2000 KVAR pickup, 1750 KVAR dropout. Alarm operation is
based on the absolute value of KVAR demand so it will pick up on positive
(leading) or negative (lagging) KVAR demand at the pickup setpoint.
Enter positive integer values.
Pickup value higher than dropout.
Example: 2000 KVA pickup, 1750 KVA dropout.
Enter positive integer values. Pickup value higher than dropout.
Example: 2000 KW pickup, 1750 KW dropout. Alarm operation is based on
the absolute value of KW demand so it will pick up on positive or negative
KW demand at the pickup setpoint.
Enter Positive decimal values (to tenths if needed).
Pickup value higher than dropout.
Example: 5% pickup, 2.5% dropout.
Alarms 45 and 46 function the same as alarms 43 and 44, respectively,
except that alarms 45 and 46 are based on displacement power factor
whereas alarms 43 and 44 are based on true RMS power factor.
Remarks/Comments/Examples
Bulletin 3080IM9601
Reverse Power
Phase Reversal
Input 1 Transition Off to On
Input 2 Transition Off to On
Input 3 Transition Off to On
Input 4 Transition Off to On
Input 5 Transition Off to On
Input 6 Transition Off to On
Input 7 Transition Off to On
Input 8 Transition Off to On
73
74
75
76
77
78
79
80
81
82
Over Lagging Power
Factor Total
71
Under KW Total
Over KVAR Demand
70
72
Description
Alarm No.
© 1996 Square D All Rights Reserved
Not Applicable
Not Applicable
KW
KW
Power Factor
in thousandths
KVAR
Pickup/Dropout Units
Note: If C-B-A phase rotation is normal instead of A-B-C, the Circuit Monitor
can be reprogrammed to make C-B-A "normal"; refer to the Series 2000
Circuit Monitor instruction bulletin for direction on how to do this.
Setpoints and time delays do not apply to these alarms. Alarms pick up
when the I/O module digital input status changes from off to on. Alarms
drop out when the input status changes back to the off state.
Enter positive integer values. Pickup higher than dropout.
Example: 2000 KVAR pickup, 1750 KVAR dropout. Alarm operation is
based on the absolute value of KVAR demand so it will pick up on positive
(leading) or negative (lagging) KVAR demand at the pickup setpoint.
Note that this alarm is based on average power factor over the demand
interval therefore it is relatively slow to respond compared to alarms 43
through 46 which are based on instantaneous power factor values.
Enter decimal value (to thousandths if needed). Pickup value can be positive
(leading) or negative (lagging) and must be less leading than dropout.
Dropout value can be positive (leading) or negative (lagging) and must be
more leading than pickup.
Example: .98 pickup, .95 dropout. Example: -.9 pickup, .975 dropout.
Example: -.9 pickup, -.95 dropout.
Enter positive integer values. Pickup value lower than dropout.
Example: 1750 KW pickup, 2000 KW dropout. Alarm operation is based on
the absolute value of KW so it will pick up on positive or negative KW at
the pickup setpoint.
Enter positive integer values. Pickup value higher than dropout.
Example: 200KW pickup, 50KW dropout. Alarm operation will occur only on
reverse or negative power conditions. For the example pickup and drop- out
setpoints, alarm pickup will occur at -200KW, dropout will occur at -50KW.
Setpoints and time delays do not apply to this alarm. Alarm operation
occurs when phase voltage waveform phase rotation is not A-B-C.
Remarks/Comments/Examples
Appendix C—Entering Pickup and Dropout Setpoints and Delays…
169
170
End of Demand Interval
End of Update Cycle
Over Analog Input Channel 1
Over Analog Input Channel 2
Over Analog Input Channel 3
Over Analog Input Channel 4
100
101
102
103
104
105
106
Input 1 Transition On to Off
Input 2 Transition On to Off
Input 3 Transition On to Off
Input 4 Transition On to Off
Input 5 Transition On to Off
Input 6 Transition On to Off
Input 7 Transition On to Off
Input 8 Transition On to Off
Reserved
Description
End of Incremental Energy
Interval
Power-Up/Reset
83
84
85
86
87
88
89
90
91
92
93
94
95
96
97
98
99
Alarm No.
Analog value
to thousandths
Not Applicable
Not Applicable
Not Applicable
Not Applicable
Not Applicable
Pickup/Dropout Units
Setpoints and time delays do not apply to this alarm. Refer to the Series 2000
Circuit Monitor instruction bulletin for application of this alarm.
Setpoints and time delays do not apply to this alarm. This alarm marks any
time the Circuit Monitor powers up or resets.
Setpoints and time delays do not apply to this alarm. Refer to the Series 2000
Circuit Monitor instruction bulletin for application of this alarm.
Setpoints and time delays do not apply to this alarm. Refer to the Series 2000
Circuit Monitor instruction bulletin for application of this alarm.
Enter decimal values to match precision chosen in the I/O Module setup
screen (units, tenths, hundredths, or thousandths). Pickup value can be
positive to negative, and must be more positive or less negative than
dropout. Dropout value can be positive or negative. Setpoints will depend
on how you set up the upper and lower limit values and precision for the
analog input.
Example: With upper limit 1000 PSI and lower limit 200 PSI and precision in
units: if you want to alarm at 950 PSI and dropout at 900 PSI, enter 950 for
pickup, 900 for dropout.
Example: With upper limit 5.000V and lower limit 1.000V and precision in
thousandths: if you want to alarm at 4.925V and drop out at 4V, enter 4.925
for pickup, 4 (or 4.0, 4.00, or 4.000) for dropout.
Example: With upper limit 5.00V and lower limit -5.00V and precision in
hundredths: if you want to alarm at 2.5V and drop out at -1V, enter 2.5 (or
2.50) for pickup, -1 (or -1.0, or -1.00) for dropout.
Setpoints and time delays do not apply to these alarms. Alarms pick up
when the I/O module digital input status changes from on to off. Alarms
drop out when the input status changes back to the on state.
Remarks/Comments/Examples
Bulletin 3080IM9601
© 1996 Square D All Rights Reserved
111
112
113
114
115
116
117
118
119
120
107
108
109
110
Alarm No.
Description
Reserved
Under Analog Input Channel 1
Under Analog Input Channel 2
Under Analog Input Channel 3
Under Analog Input Channel 4
Analog value
to thousandths
Pickup/Dropout Units
Remarks/Comments/Examples
Enter decimal values to match precision chosen in the I/O Module setup
screen (units, tenths, hundredths, or thousandths). Pickup value can be
positive or negative, and must be less positive or more negative than
dropout. Dropout value can be positive or negative. Setpoints will depend
on how you set up the upper and lower limit values and precision for the
analog input.
Example: With upper limit 1000 PSI and lower limit 200 PSI and precision in
units: if you want to alarm at 500 PSI and dropout at 600 PSI, enter 500 for
pickup, 600 for dropout.
Example: With upper limit 5.000V and lower limit 1.000V and precision in
thousandths: if you want to alarm at 4.125V and drop out at 4.5V, enter 4.125
for pickup, 4.5 (or 4.50, or 4.500) for dropout.
Example: With upper limit 5.00V and lower limit -5.00V and precision in
hundredths: if you want to alarm at -1V and drop out at 2.5V, enter -1 (or
-1.0, or -1.00) for pickup, 2.5 (or 2.50) for dropout.
Appendix C—Entering Pickup and Dropout Setpoints and Delays…
© 1996 Square D All Rights Reserved
171
172
204
205
206
207
201
202
203
Alarm No.
Current Phase A Swell
Current Phase B Swell
Current Phase C Swell
Current Neutral Swell
Voltage Phase A-N/A-B Swell
Voltage Phase B-N Swell
Voltage Phase C-N/C-B Swell
Description
Amps or
Tenths %
Volts or
Tenths %
Pickup/Dropout Units
© 1996 Square D All Rights Reserved
Note: CM2350 or higher is required to use these alarms. Alarm operation is
based on continuous RMS calculations.
Enter time delays in cycles.
If you want to have the alarm pick up based on the percent difference
between the present RMS current and the average current calculated over the
last 5 metering cycle intervals: Check the "Relative" check box.
Enter positive decimal values for percent (to tenths if needed).
Pickup value higher than dropout.
Example: 7.5% pickup, 5% dropout.
Note: CM2350 or higher is required to use these alarms. Alarm operation is
based on continuous RMS calculations.
If you want to have the alarm pick up based on the magnitude of the
current: Do not check the "Relative" check box.
Enter positive integer values. Pickup value higher than dropout.
Example: 500 amp pickup, 425 amp dropout.
Enter time delays in cycles.
If you want to have the alarm pick up based on the percent difference
between the present RMS voltage and the average voltage calculated over
the last 5 metering cycle intervals: Check the "Relative" check box.
Enter positive decimal values for percent (to tenths if needed).
Pickup value higher than dropout.
Example: 7.5% pickup, 5% dropout.
If you want to have the alarm pick up based on the magnitude of the
voltage: Do not check the "Relative" check box.
Enter positive integer values. Pickup value higher than dropout.
Example: 495 volt pickup, 480 volt dropout.
Remarks/Comments/Examples
Bulletin 3080IM9601
Current Phase A Sag
Current Phase B Sag
Current Phase C Sag
Current Neutral Sag
Reserved
215
216
Voltage Phase A-N/A-B Sag
Voltage Phase B-N Sag
Voltage Phase C-N/C-B Sag
Description
211
212
213
214
208
209
210
Alarm No.
Amps or
Tenths %
Volts or
Tenths %
Pickup/Dropout Units
© 1996 Square D All Rights Reserved
Note: CM2350 or higher is required to use these alarms. Alarm operation is
based on continuous RMS calculations.
Enter time delays in cycles.
If you want to have the alarm pick up based on the percent difference
between the present RMS current and the average current calculated over the
last 5 metering cycle intervals: Check the "Relative" check box.
Enter positive decimal values for percent (to tenths if needed).
Pickup value higher than dropout.
Example: 7.5% pickup, 5% dropout.
Note: CM2350 or higher is required to use these alarms. Alarm operation is
based on continuous RMS calculations.
If you want to have the alarm pick up based on the magnitude of the
current: Do not check the "Relative" check box.
Enter positive integer values. Pickup value lower than dropout.
Example: 425 amp pickup, 500 amp dropout.
Enter time delays in cycles.
If you want to have the alarm pick up based on the percent difference
between the present RMS voltage and the average voltage calculated over
the last 5 metering cycle intervals: Check the "Relative" check box.
Enter positive decimal values for percent (to tenths if needed).
Pickup value higher than dropout.
Example: 7.5% pickup, 5% dropout.
If you want to have the alarm pick up based on the magnitude of the
voltage: Do not check the "Relative" check box.
Enter positive integer values. Pickup value lower than dropout.
Example: 465 volt pickup, 480 volt dropout.
Remarks/Comments/Examples
Appendix C—Entering Pickup and Dropout Setpoints and Delays…
173
Bulletin 3080IM9601
Appendix D—Control Output Examples
This appendix contains examples for both manual and override control outputs. The
examples are presented simply to help illustrate the differences between manual and
override control outputs.
Manual Control Output Example
The following example is for motor-operated circuit breaker control using circuit monitor relays. The figure below is an example of a simplified control schematic of a motor
operated circuit breaker, called Feeder 1.
CS/ C
Cont rol
Switch
CLOSE
contact
R1
Circuit
Monitor
CLOSE
relay
Control
Power
Breaker Close
and
Spring Charging
52/A
N.O .
Breaker
Aux.
Contact
Ci rcuit
Monit or
R1 and R2
must be
Timed mode
R2
Circuit
Monitor
OPEN
relay
CS/T
Control
Switch
TRIP
cont act
Protective
Trip
Signals,
other trip
signals
S1
(Input 1
on Circuit
Monitor)
Breaker Trip
Circuit monitors can be used for this type of control. Using the procedures in “Chapter
13—Control Outputs”, two manual control outputs (one to close the breaker, one to
open the breaker) can be set up for separate circuit monitor relays.
Note: This example control schematic cannot take into account considerations such as circuit
monitor relay contact voltage and current ratings versus the installed system, integration into
complex control schemes, etc.
174
© 1996 Square D All Rights Reserved
Appendix D—Control Output Examples
Setup
To set up the example manual control output you should first define a digital function
called Feeder 1 Status as described below, then assign the function to the circuit monitor
that is being used to perform control. The function can then be used for association.
Digital Function Name: Feeder 1 Status
Quantity: Input 1 Status
Equal condition name: Closed
Non-Equal condition name: Open
Delay: 0
Alarm: None
After defining the digital function and assigning it to the circuit monitor, you must
define two manual control outputs as described in the following table. The dialog boxes
on the next page illustrate the defined control outputs and associations.
Control
Output
Name
ON
Action
Name
OFF
Action
Name
Relay R1
Close
Feeder 1
Close
N/A
To associate with the On state of the 52/A
auxiliary contact: In the Add Control Output dialog
box, click the Associate button in the On(1) Action
box. In the Associated Condition dialog box:
• Select the Feeder 1 Status digital function
• Enter a 5 second delay and select the Closed
option button.
Relay R2
Open
Feeder 1
Open
N/A
To associate with the Off state of the 52/A
auxiliary contact: In the Add Control Output dialog
box, click the Associate button in the Off(0) Action
box. In the Associated Condition dialog box:
• Select the Feeder 1 Status digital function
• Enter a 5 second delay and select the Open
option button.
Association
© 1996 Square D All Rights Reserved
175
Bulletin 3080IM9601
Setup (continued)
The circuit monitor relays must behave like a momentary push button or a spring return
breaker control switch, so the relays need to be set for “timed” mode.
Series 2000 Circuit Monitor relays:
• Both relays not enabled for on-board control
• Both relay modes “Timed” with hold time set to 1 second (breaker close and open
operations are usually much faster than this)
CM-144/CM-244 relays:
• Both relays must be set up for “fail-safe” mode, with a fail-safe duration of 1 second
(breaker close and open operations are usually much faster than this). This requires
taking the circuit monitor key switch to SETUP, establishing communications with
the unit, and writing values to registers 400 and 401. See the circuit monitor instruction bulletin for more details.
176
© 1996 Square D All Rights Reserved
Appendix D—Control Output Examples
Override Control Output Example
The following example describes how you could transfer load to a generator for the
“Over KW Demand Level 1” alarm condition.
Situation—You have a CM-2350 metering your incoming utility service. You have named
this circuit monitor “Utility Main.” You are using “Over KW Demand Level 1” (Alarm
Number 67 in Appendix C) to automatically energize relay R1 when KW Demand on the
utility exceeds 2000 KW for 5 minutes. The normally open R1 contact is wired to an automatic transfer switch. Upon R1 contact closure, the transfer switch controls start a generator and the transfer switch switches to the emergency position. Load is thereby automatically transferred from utility power to your generator when KW Demand exceeds the 2000
KW pickup setpoint for 5 minutes.
When utility KW Demand subsequently decreases below a dropout setpoint of 1500 KW
for 10 minutes, the R1 relay de-energizes and opens its contact. The transfer switch
controls then cause the transfer switch to switch back to the normal position, and the
transfer switch controls handle generator cooldown and shutdown. Load is thereby
automatically transferred back to the utility when KW Demand drops below the 1500
KW dropout setpoint for 10 minutes.
You define an Override Control Output named “Gen Load Xfer” for two reasons:
• Maintenance or unplanned down time on the generator or transfer switch—During
the maintenance or down time period you do not want relay R1 to close even if the
Over KW Demand Level 1 alarm were to occur.
• Testing provisions for the system—You want the ability to test system operation by
overriding the state of relay R1.
To accomplish this, the setup steps are summarized in this section, followed by a
hypothetical chain of events.
Setup
Circuit Monitor Input/Output Module Setup:
Set up relay R1 on your “Utility Main” Circuit Monitor for “Normal” mode, and
check the “Enable Onboard Operation” check box.
Circuit Monitor On-board Alarms/Events Setup:
On your “Utility Main” Circuit Monitor, enable alarm number 67 “Over KW Demand
Level 1” and set it up as follows:
Pickup: 2000 KW
Pickup time delay: 300 seconds
Dropout: 1500 KW
Dropout time delay: 600 seconds
© 1996 Square D All Rights Reserved
177
Bulletin 3080IM9601
Setup (continued)
Priority: 2
Operate relay R1 upon occurrence of the event
Note: Forced data log entries, forced 4-cycle and 12-cycle waveform captures, and priority levels
are discussed in more detail in Chapter 5—Advanced On-Board Setup for Series 2000
Circuit Monitors.
Using the Functions/Alarms... command on the Setup menu, define three global digital
functions for the device type Series 2000 Circuit Monitor as described below. After
defining the functions, assign all three to the circuit monitor “Utility Main.”
Digital function name: R1 Status
Quantity: R1 Relay Status
Equal condition name: On
Non-Equal condition name: Off
Delay: 0
Alarm: Visual and acknowledge not necessary; use factory default Level 9.
Digital function name: R1 Ovride Status
Quantity: R1 Relay Override State
Equal condition name: Overridden
Equal condition alarm: Choose an alarm level that is set up for visual and
acknowledge required
Non-Equal condition name: Not Overridden
Non-Equal condition alarm: Level 9 factory default
Poll Interval: 0
Note: This next function is based on the assumption that you have a transfer switch auxiliary
contact, closed when the switch is in emergency position, open when the switch is in normal
position, to physically wire to input 1.
Digital function name: “Xfer Sw Position”
Quantity: Input 1 Status
Equal condition name: Emergency
Non-Equal condition name: Normal
Delay: 0
Alarm: Not necessary, but most users would likely alarm on the Emergency condition
178
© 1996 Square D All Rights Reserved
Appendix D—Control Output Examples
After defining and assigning the digital functions, you must use the Control Outputs
command on the Setup menu to set up an Override Control Output named “Gen Load
Xfer” for the circuit monitor “Utility Main” as described below. The dialog boxes below
illustrate the defined control output and associations.
Predefined: Relay 1
On (1) Action name: Gen Xfer On
Off (0) Action name: Gen Xfer Off
Association for On (1) Action (Gen Xfer On):
Device: Utility Main
Digital Function: Xfer Sw Position
Delay: 15 seconds (to allow time for generator start and transfer to
generator power)
Select option button for “Emergency” condition
Association for Off (0) Action (Gen Xfer Off):
Device: Utility Main
Digital Function: Xfer Sw Position
Delay: 15 seconds (to allow time for transfer back to utility power)
Select option button for “Normal” condition
© 1996 Square D All Rights Reserved
179
Bulletin 3080IM9601
Hypothetical Chain of Events
Situation: You are online with your system. KW Demand is presently below 2000 KW.
Therefore, relay R1 is off, the transfer switch is in the “Normal” position, and the
generator is shut down in automatic standby. You intend to conduct a system test by
forcing relay R1 to energize.
To conduct the system test as described in the scenario above, follow these steps:
1. On the Control menu, click Control Outputs.
2. In the Devices box, select Utility Main.
3. In the Control Names box, select Gen Load Xfer.
4. Click the Override button.
SMS prompts you for your username and password.
5. Enter your username and password then click OK.
SMS displays a message asking for confirmation.
6. Click OK.
Relay R1 is overridden in its present (OFF) state. You will have to acknowledge the
“R1 Ovride Status - Overridden” alarm. This alarm stays active until the relay is
released from “Override.”
7. Click the Gen Xfer On button to force relay R1 on.
8. Enter your username and password, then click OK.
SMS asks you to confirm your action.
9. Click OK.
Relay R1 energizes and closes its contact. The transfer switch controls should start the
generator and the transfer switch should switch to the “Emergency” position. You
will have to acknowledge the success or failure of this control action (the criteria
being that the transfer switch actually switched to the “Emergency” position as you
set up in the Control Output “Associate” function).
Load has been automatically transferred from utility power to the generator. You let the
generator run for some period of time.
After the generator run period, you want to return load to the utility source and shut
down the generator. You can do this in one of two ways:
• Since KW Demand is presently below the 2000 KW pickup setpoint, you can release
the Override on relay R1 and be assured that R1 will not pick up again automatically
when on-board control is restored.
180
© 1996 Square D All Rights Reserved
Appendix D—Control Output Examples
• You can first force relay R1 off by executing the Gen Xfer Off Control Output, and
then release the Override at some later time. You might want to use this method to
ensure that the generator did not start regardless of KW Demand level on the Utility
Main Circuit Monitor.
You choose to use the first method from the preceding list, because KW Demand is
presently below the 2000 KW pickup setpoint and you are satisfied that the system is
fully ready to operate automatically.
To end the system test described in the preceding paragraph, follow these steps:
1. On the Control menu, click Control Outputs.
2. In the Devices box, choose Utility Main.
3. In the Control Names box, choose Gen Load Xfer.
4. Click the Release Override button, enter your username and password, and click OK.
SMS displays a warning message. Click OK to continue.
Relay R1 will now de-energize and open its contact because the circuit monitor’s onboard controls detect that the KW Demand is below the pickup setpoint. The transfer
switch controls then cause the transfer switch to switch back to the “Normal” position, and the transfer switch controls handle generator cooldown and shutdown.
Your system is back in automatic mode of operation.
5. Click Close to exit the Control Outputs dialog box.
© 1996 Square D All Rights Reserved
181
Bulletin 3080IM9601
Appendix E—SMS Client Command Line Parameters
The SMS-3000 client program supports three optional command line parameters:
• /LOGON — causes the SMS client to bypass the usual login dialog by providing the
username and password at the command line
• /WORKSPACE — causes the SMS client to automatically open a workspace file on
program startup
• /DELAY — causes the SMS client to wait for a specified number of seconds before
attempting to connect to the POWERLOGIC Network Server
Two notes about using command line parameters:
• The parameters are case sensitive. Always enter /LOGON, /WORKSPACE, and
/DELAY using capital letters.
• Follow each parameter with a space, then a data string. If the data string contains
spaces, enclose the data string in double quotes. If the data string does not contain
spaces, quotes are not required. For example:
/WORKSPACE c:myworkspace.wks
(No space in data string—quotes not required)
/WORKSPACE "c:my workspace.wks"
(Space in data string after my—quotes required)
Using the /LOGON Parameter
The /LOGON parameter causes the SMS client to bypass the usual login dialog by
providing the username and password at the command line as follows:
/LOGON username,password
Separate the username and password by a comma with no spaces. If the username or
password is invalid, SMS displays the login dialog box.
Example:
c:\SMS-3000\bin\sms3000.exe /LOGON JohnDoe,powerguy
Note: When you use this parameter, you are disabling the login security feature. Any person
could start the SMS client without a password or username. Also, a person could look at the
command line and find out the username and password.
182
© 1996 Square D All Rights Reserved
Appendix E—SMS Client Command Line Parameters
Using the /WORKSPACE Parameter
The /WORKSPACE parameter causes the SMS client to automatically open a workspace
on program startup. Enter the parameter as follows:
/WORKSPACE workspace_file
where workspace_file is the complete path statement to the workspace file.
Examples:
c:\SMS-3000\bin\sms3000.exe /WORKSPACE c:\basicviews.wks
c:\SMS-3000\bin\sms3000.exe /LOGON JohnDoe,powerguy /WORKSPACE "c:\basic views.wks"
Note: If the workspace file was saved with an online system, the same system must be online
before the workspace can be opened. If the system is not online, SMS issues a warning message
and the workspace is not opened.
Using the /DELAY Parameter
The /DELAY parameter causes the SMS client to wait for a specified number of seconds
before attempting to connect to the POWERLOGIC Network Server. You will use this
parameter only if you have set up the POWERLOGIC Network Server and the SMS
client to start up automatically after a computer power loss. The delay gives the
POWERLOGIC Network Server time to start up and place a system online. Enter the
parameter as follows:
/DELAY time_delay
where time_delay is the number of seconds of delay before the client starts.
Example:
c:\SMS-3000\bin\sms3000.exe /LOGON JohnDoe,powerguy /DELAY 30
© 1996 Square D All Rights Reserved
183
Bulletin 3000IM9601
Appendix F—Error Codes
This appendix contains the most common error codes that occur in
SMS-3000. Beside each code is a brief description of what happened to
cause the error. The code number only displays in the Event Log.
Code
015
017
029
101
107
230
231
232
233
234
256
258
259
260
261
262
263
1100
1101
1102
1103
1104
1105
1106
1107
1108
1109
1110
1111
1112
1113
1114
1115
1116
1117
184
Description
Communications overflow
Remote device inactive
Attempt to send a message with illegal route
File already open
Record out of range
Pipe state is invalid
All pipe instances are busy
Pipe is being closed
No process is on the other end of pipe
More data is available
Time-out - COM port
SY/LINK invalid parameter
SY/LINK device not initialized
SY/LINK device time-out
SY/LINK invalid route
SY/LINK invalid register list
SY/LINK reset time-out
No system exists in database
A device was not found in database
Unable to load a DLL
The DLL does not support this function
Operation failed for unknown reason
Operation failed because system is offline
Invalid user
Invalid password
Create failed
Out of service
Out of database sync
Insufficient authority
Time-out
Lookup failed
No driver
Device not connected
User has terminated/canceled online
Invalid system specified
© 1996 Square D All Rights Reserved
Appendix F—Error Codes
Code
1118
1119
1120
1121
1122
1123
4008
4201
4202
4300
4301
4302
4303
4304
4305
4306
43683
43684
43685
Description
Sample request to CommServer failed
No hardware key attached to computer
System already locked
Sample storage problem
Network error
Max connections
SquareD ID # is not valid for this device type
Semaphore is not the active device
Could not get the semaphore
Invalid record number
Invalid file number
File status error
File is not enabled or file size is zero
File is in Fill and Hold and it is full
Not all the records requested were uploaded
Unable to verify the waveform was triggered
RS-232 bad channel
RS-232 device not responding
RS-232 unable to comply
© 1996 Square D All Rights Reserved
185
Index
Index
A
Acknowledging alarms 87
Add-on modules 2
Adding
devices 20
routes 21
Alarms
defined 65
entering setpoints for cm-2000 on-board 165
examples 65
setting up 65
setting up circuit monitor on-board 60
setting up severity levels 76
silencing 88
viewing and acknowledging 87
viewing the alarm log 88
Analog functions
defining setpoints for 69
example 71
Analog inputs
example 50
setting up 48
Analog outputs
examples 52
setting up 51
Assigning
functions to devices 77
log templates to devices 94
Associating an input with a control output 117
B
Bar charts
displaying 37
C
Circuit monitor
feature comparison 14
I/O modules comparison 15
series 100/200 setup 26
series 2000 basic setup 24
Circuit monitor alarms
entering setpoints for 165
Clipboard
using the 126
Command line parameters 182
Communications
re-establishing 138
testing 136
Control box 9
Control output 110
associating with an input 117
definitions 110
manual
example 174
executing 120
override
example 177
executing 121
setting up 115
setup flow chart 112
Custom quantities 131
Custom tables 130
D
Data logging 91
creating log templates 93
default data log template 59
organizing log files 59
setting up circuit monitor on-board 57
setting up PC-based 92
DDE 143
abbreviations for creating DDE links 147, 184
changing the DDE update interval 145
setting up SMS as a DDE server 144
Devices
adding 20
setting up 20
Diagnostics 136
Digital functions
defining setpoints for 74
Bulletin 3080IM9601
Displaying
a 4-cycle waveform data block 103, 104
active functions 43
bar charts 37
history tables 96
meters 40
on-board data 141
real-time data 34
tables 35
time trend plots 96
Dynamic Data Exchange. See DDE
E
Edit system. See Working System
Enable on-board operation 111
Event log
setting up the circuit monitor 56
viewing 89
Executing
a manual control output 120
an override control output 121
Exporting
waveforms to an SMS data file 105
F
File services 146
Functions
assigning to specific devices 77
defining setpoints for analog 69
defining setpoints for digital 74
displaying active 43
editing 77
setting up 65
G
Global functions
creating 68
defined 67
Going Offline 31
Going Online
with a system 29
with a workspace 29
Groups 128
H
Help
using online 2
History tables
displaying 96
saving data to a file 127
I
Input/output module
feature comparison 15
setting up 45
Inputs
setting up circuit monitor analog 48
L
Log templates
assigning to devices 94
Logging. See Data logging
Logging on to SMS 8
M
Mail tasks
creating new 80
Manual control output
example 174
executing a 120
Manual update 32
Memory usage summary 55
Menu bar 9
Meters
displaying 40
Mode
setting the sampling 31
O
Offline. See Going Offline
On-board alarms
entering setpoints for 165
setting up circuit monitor 60
On-board data
displaying circuit monitor 141
On-board data logs 91
setting up 57
Index
On-board data storage
setting up 54
Online help 2
Opening
a working system 30
Operating range indication
for bar charts 39
for meters 41
Option buttons 11
Outputs. See Relay outputs
setting up analog 51
Override control output
example 110, 177
executing 121
setting up 45
Reports
creating and scheduling 123
manually printing 125
Resets tasks
creating new 82
Resetting device data 99
Routes
adding 21
a serial port route 22
a SY/LINK route 22
setting up 20
RS-232 port
setting up 19
P
S
PC Interface
setting up 16
SY/LINK board setup 18
Placing devices in/out of service 139
Power meter
models feature comparison 14
setting up 27, 28
Printing
an open window 126
reports 125
Program tasks
creating new 81
Push Buttons 11
Sampling mode
manual update 32
scheduled update 32
setting 31
Saving
table or trend plot data to a file 127
Saving a workspace 129
Scheduled update 32
Scheduling reports 123
Scheduling tasks 84
Serial port
setting up 19
Setpoints
entering pickup and dropout 165
for analog functions 69
for digital functions 74
Setting up
alarm severity levels 76
alarms 65
control outputs 115
custom quantities 131
custom tables 130
data logging 92
devices and routes 20
functions 65
global functions 68
groups 128
log templates 93
PC interface 16
Q
Query
defining a new historical data 97
Quick tables 130
R
Re-establishing communications with devices
138
Reading and writing registers 140
Real-time data
displaying 34
Registering your software 1
Relay outputs
operation modes 47
Bulletin 3080IM9601
power meter 27, 28
quick tables 130
reports 123
RS-232 port 19
serial port 19
series 100/200 circuit monitors 26
Series 2000 circuit monitor 24, 44
analog inputs 48
analog outputs 51
I/O modules 45
on-board alarms/events 60
on-board data logs 57
on-board data storage 54
on-board event log 56
on-board waveform log 56
SMS as a DDE server 144
SY/LINK board 18
tasks 79
mail tasks 80
on-board data log/waveform upload 83
program tasks 81
resets tasks 82
Silencing alarms 88
Sizing Boxes 10
SY/LINK board
setting up 18
System
creating a new 15
going offline 31
going online with 29
System communications test 136
System information
viewing and printing 146
System information line 11
System requirements 6
T
Table
saving data to a file 127
Tables
column head abbreviations 147, 184
displaying 35
Tasks
assigning to an on-board alarm 64
creating new 79
CM 2000 on-board log/waveform upload 83
mail task 80
program tasks 81
resets tasks 82
scheduling 84
using 79
Technical support 6
Template
assigning data log templates to devices 94
creating data log templates 93
default data log template 59
Testing system communications 136
Time delays
entering 165
Time trend plots
displaying 96
Title bar 10
Toolbar 10
icon descriptions 12
Trend plot
saving data to a file 127
U
Update interval
setting 32
V
Viewing
active alarms 87
active functions 43
alarm log 88
bar charts 37
event log 89
history tables 98
meters 40
on-board data 141
tables 35
time trend plots 98
waveforms 101
W
Waveform log
setting up circuit monitor 56
Waveform upload tasks 83
Index
Waveforms
acquiring new 101
changing the view 103
displaying a 4-cycle waveform data block
103, 104
exporting to an SMS data file 105
retrieving stored 106
from circuit monitor 107
Working system 9
changing 31
closing 31
opening 30
Workspace 129
automatically opening at startup 183
going online using 29
Writing and reading registers 140