1
Introduction to Lab Instruments — 4/5
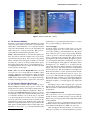
But the scan mode can, however, be a blessing if you want
to observe sudden changes that happen in your input. By
using the scan mode, your display will show the signal very
slowly and you will be able to observe changes that would
be imperceptible if it were running in normal mode. In the
exercise section (below) you will play with this mode a little.
2.3 Spectrum Analyzer
The spectrum analyzers found in the Communications Lab are
a standard model which for many years has been used in the
industry: the HP8590L. Rather than detailing the capabilities
of the instrument, you will go through an exercise to facilitate
your practical understanding of it. There are some copies of
the manual in the lab, so feel free to refer to it as well if you
need to explore further.
In general, there are three basic buttons and a main rotating
knob in spectrum analyzers. The buttons are labelled:
• Frequency;
oscilloscope (if you want a sine wave and you see a square
wave, something is wrong).
3.1 With a Sine Wave and the Oscilloscope
Set your signal generator to output a 1Vpp , 1KHz sine wave,
and connect its output to the inputs of the oscilloscope using
a T connector and BNC-to-BNC coaxial cables. On your
oscilloscope, do the following tasks:
• Make the sine wave display on the screen, then make it
stop using the trigger;
• Measure its amplitude and frequency in the old fashioned way (i.e. ”eye-balling”), by using the per division
numbers shown on the display. Write your reading
down;
• Measure amplitude and frequency using the Cursors
(horizontal and vertical);
• Measure amplitude and frequency using the Measure
function of the scope;
• Amplitude;
• Span.
• Compare the numbers.
The FREQUENCY button will allow you to select the
beginning and the end of the spectrum to be displayed, or to
centre it at a particular frequency. With the frequency interval
selected or centred, you can use the SPAN capability as a
”zoom” function, which will allow you to see features present
within a certain – usually finer – interval of frequencies. For
instance, when you find a channel you want to see within
a frequency range, you centre our spectrum on that channel
and use the SPAN to zoom in and out of it. Finally, the
AMPLITUDE button will allow you to set the threshold of
sensitivity of the instrument to the incoming radio frequency
signal.
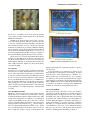
In this section, your objective will be to visualize the
FM broadcast spectrum using the spectrum analyzer. FM
broadcast radio in North America is allotted frequencies in the
VHF band between 88 and 108 MHz (100 channels). This is
between the low and high TV VHF bands (after August 2011,
all TV signals are digital). For comparison, the standard AM
broadcast radio is allotted frequencies between 535 and 1605
KHz (107 channels).
You will use a BNC-to-aligator cable as your antenna.
Signal strength depends on many factors, and the fact that
the laboratory is in the middle of the building is not a very
favourable one. However, you will see that you will be able
to receive (or see) FM in the lab without a problem.
3. Exercises
Now that you are an expert in the use of the signal generator
and the oscilloscope, you must do a few exercises to consolidate what you have learned so far. Start by connecting
the signal generator directly to the oscilloscope. Make sure
you connect the proper output of the signal generator to the
Now set your oscilloscope to display the frequency domain by pressing the MATH button. From now on, the amplitude is displayed in dB, with 1Vrms as the reference. Now do
the following:
• Measure the amplitude and frequency of the sinusoid
by inspection (eye-balling);
• Measure the amplitude and frequency using cursors;
• Calculate which amplitude value of the sinusoid would
give you 0dB. Change the amplitude on the signal generator to the value you have calculated and verify that
the amplitude on the oscilloscope is 0dB;
Just for your own entertainment, turn the trigger off (or
set it to a wrong value) and make the signal run across the
display. Now press the Run/Stop button. Great; the signal has
stopped. Now disconnect the input to the scope, or turn the
signal generator off altogether. You will see that your signal
is supposedly still there, when it no longer exists. This is why
you should avoid this button, unless you are trying the ”catch”
a feature that happens every once in a while on your signal,
such as a glitch, a sudden variation or a spurious noise burst.
Your option to observe sudden changes on your signal is
to use the Scan mode. With your trigger on Auto Mode, put
on the display three cycles of your friend, the 1Vpp , 1KHz
Sine wave. Your horizontal sweep should be around 250µs
per division. Now rotate the horizontal sweep knob (the one
labeled SEC/DIV)) to 250ms. You are into scan mode now,
with the display running very slowly. At the top of your display, you will see a yellow square with Scan written beside it.
Now change the frequency to 100KHz. You will notice that