1
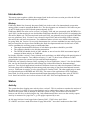
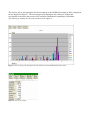
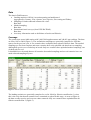
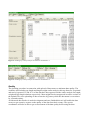
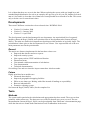
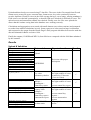
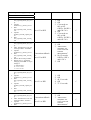
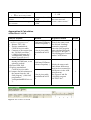
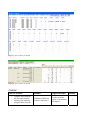
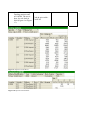
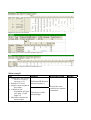
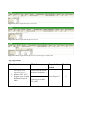
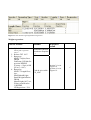
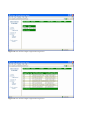
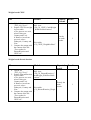
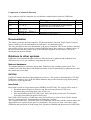
Working Paper to the Baltic Fisheries Assessment Working Group Meeting, April 2005
FishFrame Baltic Sea
Status and documentation of web application, tests and calculations.
Teunis Jansen & Henrik Degel
Danish Institute for Fisheries Research
Charlottenlund Castle, 2920 Charlottenlund, Denmark
Abstract
FishFrame has since WGBFAS 2004 been tested, documented, presented and developed further to meet
the requests put forward by the working group and users from the Baltic Sea countries. This work is
presented herein and ideas and recommendations for future use and work are discussed.
The system has been used extensively by the users for uploading historic and 2004 data, resulting in
46,206 page hits. Three releases (3.0, 3.1 and 3.2) has added new functionality and fixed bugs. The
system now stores 8648 station with 2,649,386 length measures and 340,803 age readings.
The testing is finished and documented. The testing was successful and FishFrame is now ready to be
used in full scale. I.e as data provider to the assessments delivering sets of commercial data (discard,
retained, CANUM, WECA etc.). The authors do however recommend that a review should be conducted
by scientists that have not been taking active part of the development. The calculation procedures have
been documented to meet such a review.
The relations to other international fisheries datawarehouses are discussed.
Recommendations are given in relation to using FishFrame for estimating assessment input, and as
basis for other analysis.
Introduction
This status paper together with the documents listed in the references section provides the full and
updated documentation and description of FishFrame.
History
FishFrame Baltic Sea (formerly known as BaltCom) is the result of an international cooperation
among all the countries around the Baltic Sea. The development was initiated in 1999 and was part
of an EU Study project (98/024) and sponsored partly by EU.
FishFrame Baltic Sea came out in version 1 in January 2002 and was presented at the WGBFAS in
April 2002. At that meeting it was decided that FishFrame should be used in 2003 for estimating the
discard for Baltic cod. The intersessional work until 2003 was primarily used to upgrade FishFrame
to a new platform (.Net). Version 2 was released in April 2003 and successfully used to estimate
discard for the cod stock assessments. Two additional minor releases were rolled out during 2003.
In spring 2004, the Version 3.0 was only demonstrated as a release candidate because other projects
had prevented the developers from finishing the final development and tests. On the basis of this
release candidate the working group recommended that:
• Thorough documentation and tests of calculation procedures should be provided.
• The countries should review this documentation.
• The WGBFAS should decide in 2005 whether or not to base the 2006 assessment input of
commercial data entirely on FishFrame.
In October 2004 the version 3.0 was released and a workshop was held in Riga with participation of
all the Baltic Sea countries. Two addition releases (3.1 and 3.2) have been rolled out in 2005
preparing the system for external revision and full implementation.
FishFrame was cloned in January 2005, resulting in several FishFrame “clones”: One for the Baltic
Sea, one for the North Sea and one called Fanta Sea with artificial data for demonstrational
purposes. Two derived applications based on FishFrame clones are under development: FishFrame
Acoustics that will be handling the data storage and processing of data from international acoustic
surveys. FishFrame Acoustics is to be released before October 2005. The other application is made
in cooperation between DIFRES and ICES HQ. The name of the application will be FishFrame
InterCatch. It will be used to document national input data and processing done at the ICES WG
level. InterCatch will be out in a beta-release for the ASC 2005 and implemented in 2006.
Status
Activity
The system has been logging user activity since version 2. This is not done to monitor the actions of
the single users. It is done so user action analysis can be conducted to improve the user interface.
Abuse of the system such as attempts to hack the system of copy all raw data out of the data
browser can also be revealed using the log. Only administrators have access to the activity reports.
Activity is measured in “page hits” e.g. web pages requested by a user.
46,206 page hits have been logged since January 2003. 35,483 since April 2004.
33 of the 45 users have made more than 30 page hits while 7 users have made more than 1000.
The activity day by day during the last four month up to the WGBFAS meeting in 2005 is displayed
on the diagram on Figure 1. The increasing activity during the last 14 days is evident and
corresponds to the dates where most of the countries finished their uploading of 2004 data.
The activity by country for all years can be seen in Figure 2.
Figure 1. Activity day by day during the last four months up to the WGBFAS meeting in 2005.
Figure 2. Activity by country.
Data
The data in FishFrame are:
• Landing statistics: Official, Area misreporting and unallocated.
Aggregated by Country, Year, Quarter, Area, Species, Size sorting and Fishery.
• Sampling of catches onboard commercial vessel.
Raw data.
• Marked sampling.
Raw data.
• International trawl surveys (from ICES DATRAS).
Raw data.
• Accessory information such as definitions of stocks and fisheries.
Coverage
The system now stores 8648 station with 2,649,386 length measures and 340,803 age readings. The data
are from 1995 to 2004 (Figure 3). The sea/harbour samplings are practically complete for 2004 but
sparser for the previous year. A few countries have completed their upload of historic data. The marked
samplings are far from complete and some countries have only uploaded cod data from sea sampling
although all species were worked up on board. Only two countries have uploaded marked samplings, one
of them only for cod.
It should however be noted that not all countries do marked samplings and several countries have not
made onboard sampling all years.
Figure 3. Stations (Sea+Harbour+Marked) by country and year.
The landing statistics are practically complete for cod in 2004 (by fisheries stratification 1), since
this is the only data that all countries have committed to upload at this stage. As seen on Figure 4;
the data on other species and years are rather scattered. Only two countries have uploaded data for
fisheries stratification 2 (Figure 5).
Figure 4. Landings by country and year for fisheries stratification 1.
Figure 5. Landings by country and year for fisheries stratification 2.
Quality
The checking procedure in connection with upload of data ensures a minimum data quality. The
workflow also includes age-length and length-weight outlier analysis, this step however is optional
and can by bypassed. 35 and 36 % of the data have been approved in the outlier analysis for lengthweight and age-length relations respectively. More might have been approved in earlier versions of
the upload files, since uploading of data overwrites by journey while the data status is overwritten
by year and country.
An advanced data checker is under development and once finished this tool will enable the data
owners to get extensive reports on the quality of the data from their country. The species
coordinators will also be able to get an assessment of the data quality before using the data.
It is evident that there are errors in the data. When exploring the reports with age-length keys and
standard length distribution for cod as an example; the ages are up to 99 year, the lengths are from 8
mm to 9.6 m and it is clear that a lot of data have been uploaded in cm instead of in mm. This seems
only to be the case for some historic data.
Developments
Three new FishFrame versions have been released since WGBFAS 2004:
•
•
•
Version 3.0: October 2004
Version 3.1: January 2005
Version 3.2: April 2005
The development is tracked and managed in two documents: An unprioritized list of requested
modules (Jansen & Degel, 2005d) and a prioritized list of development tasks (Jansen & Degel,
2005e). The tasks are smaller development work packages while modules are typically larger. The
prioritization is done prior to the development of a new release. User requests and cost is the two
main parameters used in the prioritization.
Recent
The major new features implemented in the last three releases are:
• Improved data checker and error reports
• Improved security system
• New reports such as CPUE and discard fraction.
• Discussion forum
• User manual with documentation of calculations
• Test documentation
• Technical documentation
Several bug fixes and user interface improvement have also been made.
Future
Highly prioritized new modules are:
• Advanced data checker.
• Improved geographical mapping facilities.
• Effort as new data type. Raising with effort instead of landings as a possibility.
• Browser independence.
• Extensive reporting system.
See Jansen & Degel (2005d, 2005e) for the complete list.
Tests
Methods
The system and in particular the calculations and aggregations has been tested. The test was done
primarily with test data sets. The data sets were created so that all cases were covered. The test
documentation (Jansen & Degel, 2005c) can be downloaded from FishFrame’s documentation page,
while the data sets are found under DataAction/Tools/TestDataSets in the menu.
Upload and data checks were tested using 27 data files. The errors in the files ranged from file and
format errors (wrong file types, nonsense data, format errors, key value consistency between
records, duplicate records) to errors in the fields (wrong data type, out of range, missing mandatory).
Field errors were checked systematically, so that all fields were checked for all kinds of errors. The
upload security and transaction rollback was checked. Finally error-free files were uploaded to
ensure that the routines saving data in the database were working correctly.
Calculations and aggregations were tested with small datasets (one to three stations) and compared
to results from manual calculations in excel. Some reports were also tested on larger real datasets
and compared to the output from the Henrik Degel’s SAS program which has been used to make the
discard estimated for Baltic cod since 1996.
Finally the outputs (CANUM and WECA) from 2004 were compared with the 2004 data submitted
by the countries.
Results
Upload & Validation
File
WrongExtensionDatafile.xxx
WrongExtensionDatafile.zip
EmptyDataFile_CS.csv
EmptyDataFile_CS.zip
NoSenseDataError_CS.csv
NoSenseDataError_LS.csv
StartingWithASemicolonError_CS.csv
StartingWithASemicolonError_LS.csv
TooFewCollumns_CS.csv
CS_data_in_LS.csv
LS_data_in_CS.csv
TabDelimitedData_CS.csv
KeyValueConsistency_34_Shown_as_
23_Errors_CS.csv
DoublicateRecord_1_Errors_LS.csv
DoublicateRecord_2_Errors_CS.csv
TST011CS_HH_77_Errors_CS.csv
TST011CS_HL_34_Errors_CS.csv
TST011CS_CA_54_Errors_CS.csv
TST011LS_L1_38_Errors_LS.csv
TST011CS_0_Errors_CS.zip
TST011CS_0_Errors_CS.csv
TST011CS_0_Errors_CS.xml
TST011LS_0_Errors_LS.csv
Test module
Expected result
Result
Upload
Rejection with proper
description
√
ASCII2XML
Key value
consistency checker
Duplicate record
checker +
ErrorReport +
Natural key report
Primary XSD
validator +
ErrorReport +
Natural key report +
Enumeration report
Save to DB, DW +
Set data status
Proper error report with
the right number of errors
(counted as 23 because
13 are in 2 lines)
Proper error report with
the right number of errors
+
correct natural key report
Proper error report with
the right number of errors
+
correct natural key
reports +
correct enumeration
reports
Proper performance, no
errors.
√
√
√
√
TST011LS_CommaSep_0_Errors_LS.c
sv
DEN01cs.csv
Denmark 2003LS.csv
1. Run:
Test_Upload_Delete_all_CS.s
ql
2. Upload:
TST011CS_0_Errors_CS.csv
3. Run:
Test_Upload_Count_records_
CS
4. Upload:
TST011_Second_Upload_CS.
csv
5. Run:
Test_Upload_Count_records_
CS
1. Run:
Test_Upload_Delete_all_CS.s
ql
2. Add: “SELECT 0/0” into the
stored procedure “InsertHH”
3. Upload:
TST011CS_0_Errors_CS.csv
4. Run:
Test_Upload_Count_records_
CS
5. Restore the stored procedure
6. Repeat step 1-5. Instead of
changing “InsertHH” in step 2
change to
a. “InsertCruise”
b. “InsertHL”
c. “InsertCA”
1. Run:
Test_Upload_Delete_all_L1.s
ql
2. Upload:
TST011CS_0_Errors_LS.csv
3. Run:
Test_Upload_Count_records_
L1
4. Upload:
TST011_Second_Upload_L1.
csv
5. Run:
Test_Upload_Count_records_
L1
1. Run:
Test_Upload_Delete_all_L1.s
ql
2. Add: “SELECT 0/0” into the
stored procedure “InsertL1”
3. Upload:
TST011CS_0_Errors_LS.csv
4. Run:
Save CS to DW
1. OK
2. OK
3. CI records are
803 to 807.
6 HH’s, 286 HL’s
and 634 CA’s.
4. OK
5. CI records are
803 to 808.
6 HH’s, 295 HL’s
and 643 CA’s.
√
1. OK
2. OK
3. “Data insert
Transaction rollback
in:
Save CS to DW
Save L1 to DW
Transaction rollback
in:
Save L1 to DW
complete: An
error occurred.
Contact
administrator”
4. No CI records.
0 HH’s, 0 HL’s
and 0 CA’s.
5. OK
1.
2.
3.
4.
5.
OK
OK
42 L1 records
OK
37 L1 records
1. OK
2. OK
3. “Data insert
complete: An
error occurred.
Contact
administrator”
√
√
√
Test_Upload_Count_records_
L1
5. Restore the stored procedure
Upload DEN01cs.csv logged on as
testeditor
Upload Denmark 2003LS.csv logged
on as testeditor
4. 0 L1 records
5. OK
Security in: Save CS
to DW
Security in: Save L1
to DW
“Data insert complete:
An error occurred.
Contact administrator”
Module
Expected result
FishFrameVB.Dataw
arehouse.Populate(..)
Exactly the same result
for discard. Landings
cannot be compared,
since the SAS program
only calculates discards.
See Figure 6 & Figure 7.
The landing-part is tested
under CANUM-test.
√
Nearly the same result.
Only minor differences
that can be accounted for
(differences in the ALK
stratification).
See Figure 8 and file
“Old SAS program
OUTPUT.doc”.
√
√
Aggregation & Calculation
Standardized CANUM
Files & Actions
1.
2.
3.
4.
1.
2.
3.
4.
Upload file “TST 99 Two
stations no regression CS.csv”.
Release TST 1999.
Explore standardized
CANUM in pivot table.
Compare to the output from
the “old SAS procedure”
(“Old SAS program.doc”,
“testdataset04_2stations
inputCS version 6.csv”).
Data for DEN 2003 are
already in FishFrame, so no
upload is needed!
Release DEN 2003.
Explore standardized
CANUM in pivot table.
Compare discard estimates to
the output from the “old
SAS program” (“Old SAS
program.doc”,
“testinputdataDEN03v6.csv
”).
Figure 6. Test result for stCANUM
Cube & pivot table:
StandardizedCANU
M
FishFrameVB.Dataw
arehouse.Populate(..)
Cube & pivot table:
StandardizedCANU
M
Result
Figure 7. Test result for stCANUM
Figure 8. Test result for stCANUM
CANUM
Files & Actions
1. Compare and calculate
the discarded and the
retained part manually
using the data from the
Module
Expected result
FishFrameVB.Dataw
arehouse.Populate(..)
Exactly the same
results as the manual
calculation.
Result
√
pivot tables containing
Landing statistics and
stCANUM. The test is
done for sole-kask in
2004 (Figure 9 to Figure
13).
Figure 9. Input for CANUM test.
Figure 10. Input for CANUM test.
Cube & pivot table:
CANUM
Figure 11. Input for CANUM test.
Figure 12. Test result for CANUM (discarded fraction).
Figure 13. Test result for CANUM (retained fraction).
Mean weight
File
Module
Expected result
Result
1. Upload file “TST 99 Three
stations two lengths no
regression CS.csv”.
FishFrameVB.Datawar
ehouse.Populate(..)
2. Release TST 1999.
3. Explore mean weights in
pivot table.
4. Compare to the
screenshots in Figure
Cube & pivot table:
14, Figure 15 and
MeanWeight
Figure 16.
5. Manually calculate the
mean weights
Exactly the same
results as the manual
calculation.
√
Figure 14. Mean weight with Age on row axis
Figure 15. Mean weight with length on row axis
Figure 16. Mean weight with length on row axis and Age on column axis
Age regressions
Files & Actions
1. Upload file “TST 97
Two stations with
regression CS.csv”.
2. Release TST 1997.
3. Explore Age-Length
Relations in pivot
table.
Module
Expected
result
Result
FishFrameVB.Dataw
arehouse.Populate(..)
As in Figure 17
Cube & pivot table:
CS_ALK
√
Figure 17. Test result for age-length relation regression.
Weight regressions
Files & Actions
1. Upload file “TST 97 Two
stations with regression
CS.csv”.
2. Release TST 1997.
3. Run query:
SELECT Alpha, Beta
FROM
FishFrame_DW.dbo.Re
gression WHERE
(Country = N'tst') AND
([Year] = 1997)
4. Run query:
SELECT LengthClass,
Age,
PartOfMeanWeight,
PartOfWeightOfStrata
FROM
MeanWeight(1997, 'tst',
'Fishery stratification
1')WHERE
LWRegression = 'Yes'
Module
Expected
result
FishFrameVB.Data
warehouse.Populate
(..)
Cube & pivot table:
CS_ALK
Action 3: As in
Figure 18
Action 4: As in
Figure 19
√
Figure 18. Test result for length-weight relation regression.
Figure 19. Test result for length-weight relation regression.
Weight based CPUE
File
1. Upload file
“TST_98_CS.csv”.
2. Explore CPUE in weight
in pivot table.
a. Set Area on row axis,
select Fisheryset,
Country and Year.
b. Remove Area from
row axis, select
Fisheryset, Country and
Year.
3. Compare the output with
the content of the file
“Test results for
DiscardFraction and
CPUE.xls”.
Module
Expecte
d result
Result
SQL view:
“AS_CS_CPUE_CatchWeight
_WithZeroObservations”
Exactly
the same
results.
√
Pivot table:
“CS_CPUE_WeightPerHour”
Weight based discard fraction
File
4. Upload file
“TST_98_CS.csv”.
5. Explore DiscardFraction
in pivot table.
a. Set Area on row axis,
select Fisheryset,
Country and Year.
b. Remove Area from
row axis, select
Fisheryset, Country and
Year.
6. Compare the output with
the content of the file
“Test results for
DiscardFraction and
CPUE.xls”.
Module
Expected
result
Result
SQL view:
“AS_CS_DiscardFraction_C
atchWeight_WithZeroObser
vations”
Pivot table:
“CS_DiscardFraction_Weigh
t”
Exactly the
same
results.
√
Comparison of submitted 2004 data
Four countries could be compared; the rest had not completed their upload to FishFrame.
Country
Difference
GFR
POL
1-2 %
13 – 28 %
LAT
28 – 135 %
Submit age = FF age +1
23 – 74 %
DEN
Raising procedure differences1
Result
Calculation of overall mean weight explains
exactly the observed differences.
?
Handling of size sorting + ?
Note 1. Apart from differences in regression procedures and stratification of age-length keys.
√
√
?
?
Documentation
The whole system has been documented. The documentation (Jansen & Degel, 2005a; Degel &
Jansen, 2005b) can be downloaded from FishFrame’s documentation page.
The only part that has not been documented is the apply-estimation. The reason for this is that this
functionality will be moved into the coming FishFrame InterCatch system (see chapter below). If
the users decide that they want to keep it in FishFrame Regional as well, then it will also be
documented in the user manual.
Relations to other systems
FishFrame is an international datawarehouse where data can be gathered and combined from
different sources. It is not a database containing the source data.
National databases
The national databases contain the source data. FishFrame only contains copies hereof. The
countries still owns their data inside FishFrame and it is their responsibility to update them so that
they match the source data.
DATRAS
DATRAS contains data from international trawl surveys. The system is maintained by ICES HQ.
FishFrame contains a copy of the DATRAS database and provides data browsing and reporting
facilities for exploring the data.
InterCatch
ÍnterCatch is made in cooperation between DIFRES and ICES HQ. The system will be used to:
1. Document national inputs to fisheries and fish stock assessment at ICES level.
2. Document data processing done at the ICES level.
3. Ease data handling at the ICES WG level. InterCatch shall provide tools for complete
processing from national input to final report.
InterCatch will be based on a FishFrame clone and will be out in a beta-release for the Annual
Science Conference 2005. Implementation will take place in 2006.
The “regional FishFrame” can in the future feed FishFrame InterCatch with the national data at the
aggregation level required by the species coordinators. The species to stock conversion, applyestimation and generation of model input files will then be handled and documented in InterCatch.
The same facilities will be available in Regional FishFrame providing the user with a playground or
sandbox for analysing the consequences of applying different applying strategies.
European Fisheries Data Collection (EFDC)
Currently there is no relation between FishFrame and EFDC. It could be considered to provide tools
in FishFrame for easing the member countries reporting of data to EFDC. However EFDC contains
economical and logbook that is not present in FishFrame. Since the requests can require
combination of different types of data, FishFrame can not presently provide facilities for all kinds of
reporting to EFDC.
FishFrame clones
FishFrame has been cloned into three “regional” FishFrame applications:
• FishFrame Baltic Sea
• FishFrame North Sea
• FishFrame Fanta Sea
The three clones only differ in the data content. There is no connection between the clones; the data
are stored and the security is handled separately.
FishFrame Acoustics
FishFrame Acoustics is building on HerSur and FishFrame technology. FFA will be handling the
data storage and processing of data from international acoustic surveys. FishFrame Acoustics is
divided into three stages. Stage 1 is the raw data (now stored in HerSur and BADII), stage 2 is
calculations up to an aggregated level and stage 3 is the final calculation of the global stock size
estimates. Stage 3 is to be released before October 2005.
Discussion & Conclusion
FishFrame has proven to be able to produce the discard fraction of the input data to the assessment
models. In order to expand the use to cover the retained part as well; the system needed properly
testing and documentation. All testing carried out before WGBFAS 2005 was successful. The
testing carried out during WGBFAS 2005 was successful for two countries. Two other countries
data sets deviated substantially from the FishFrame output. These differences should be explored
and explained in corporation with the data submitters as soon as possible, since they might represent
errors in the data sets that the assessment will be based on.
Next step towards full implementation would be to evaluate the calculation procedures. This should
be done by all involved countries.
The use and testing of FishFrame has until now only been on cod and sole. Herring and whitefish
are handled slightly differently because the species to stock conversion not only depends on the area
but also uses the spawning-type information. This case has not been tested separately. It is therefore
recommended that such testing is performed and that relevant assessment biologists evaluate the
handling of stock conversions.
Software that manipulate and calculate data for a scientific purpose, is not to be looked upon as
“black boxes”, that one just have to trust, because it is made by a trustworthy person.
Accepting a “black box” as is not appropriate for scientific purposes. We have therefore chosen to
make the source code public available for review, so that everything can be reproduced and tested.
A scientific piece of software, or rather its output, can be viewed upon as a hypothesis. We would
therefore suggest that scientific software should be reviewed like normal publications.
We would appreciate if a third part would test the application systematically, and we are ready to
put forward everything needed to do so. It should not be necessary to implement the database in
another place, a test on the existing setup would be sufficient.
The upload of data has been successful for all countries in 2004. Several countries however only
finished few days before the WGBFAS meeting. To ensure that the expected level of data quality
will be reached and that the stock coordinators and assessment biologists get time to work on the
data before the meeting, we would recommend that data upload should meet a deadline one month
before the meeting. This deadline also makes the process resistant to unforeseen technical problems.
The late delivery of data by some countries was due to technical problems, mainly because of the
work involved in the creation of national extraction programs. These programs can be expected to
be reused in the future. We therefore expect the national data extraction, exchange file generation
and upload process to be much easies in the coming year, making an earlier deadline possible.
The coverage of historic data is still too poor for most use of these data. We therefore recommend
that the countries should make a coordinated commitment to completion of some or all of the years
1995-2003.
The data quality needs to be thoroughly assessed in the historic data. The species coordinators
should be provided with an advanced data checker that enables them to assess the quality of their
data set prior to the assessment. A tool to cover both of these tasks is under development and will be
implemented in the next release. The tool will also further improve the initial data check that is
performed during upload.
Based on the user feedback we have given priority to the development of some special modules:
Improvement of the existing geographical mapping facility, so that it can also create points, pies,
and bar charts on the maps.
Effort as new data type. Raising with effort instead of landings will be needed in future fisheries
based assessments with focus on effort regulation.
Browser independence. Making the users free to chose the browser software that suits their own
institutes IT-policy.
Extensive reporting system. The growing Baltic Sea data set is getting more and more interesting
for other fisheries scientists than WGBFAS. National institutes and other ICES WG’s performing
ad hoc studies on discard, ecosystem management and area closure have already been wishing to
use the data. This will require more reports and analysis. A system where users can define and save
query reports could be a solution. This would naturally be under the existing data security rules.
All relevant information for giving the background tabulations for the “Technical Reports” and
“Final Report” to the EU Commissions in connection with the Data Regulation is included in
FishFrame and it will be natural to take advantage of this when producing those national reports
every second year.
External data access. Owner ship of the data is by country. Users wishing to use data will have to
get proper permissions. It is in everybody’s interests that the data is used as much as possible and a
smooth procedure for obtaining the required permissions is important. Therefore, it is relevant to
develop a “data library” module, which manages the external use of FishFrame reports as well lend
of data for use outside the database.
References
Jansen T., H. Degel. 2005a. FishFrame User Manual. www.FishFrame.org. 42 pages.
Degel H., T. Jansen. 2005b. FishFrame Exchange Format Specification. www.FishFrame.org. 15
pages.
Jansen T., H. Degel. 2005c. FishFrame Test Documentation. www.FishFrame.org. 12 pages.
Jansen T., H. Degel. 2005d. FishFrame Modules. www.FishFrame.org. 2 pages.
Jansen T., H. Degel. 2005e. FishFrame Tasks. www.FishFrame.org. 5 pages.