1
Users Manual
Version 2.9.4
Seveno Pty Ltd
Canberra, ACT
Seveno Pty Ltd
Printed: May 2013 in Canberra, ACT
Contents
I
Table of Contents
1 Copyright Notice
1
2 Your feedback
2
3 Get the the latest version
3
4 What is new in DataSight version 2.9
4
5 Quick Tour
6
1
2
3
4
5
6
7
8
Quick
...................................................................................................................................
Tour: Layout
7
Quick
...................................................................................................................................
Tour: Database Variables
9
Quick
...................................................................................................................................
Tour: Importing Data
10
Quick
...................................................................................................................................
Tour: Exporting Data
19
Quick
...................................................................................................................................
Tour: Merge
21
Quick
...................................................................................................................................
Tour: Graphs
23
Quick
...................................................................................................................................
Tour: Reports
28
Quick
...................................................................................................................................
Tour: Notes
32
6 Using this Guide
33
1 Who
...................................................................................................................................
this Help file is for
33
2 If you
...................................................................................................................................
are using DataSight Lite
33
3 Typographical
...................................................................................................................................
Conventions
33
7 Getting Started
34
1 Main
...................................................................................................................................
Window Layout
34
2 Toolbars
................................................................................................................................... 35
Menu Bar .........................................................................................................................................................
and DataSight Toolbar
35
Graph Toolbar
......................................................................................................................................................... 36
Floating and
.........................................................................................................................................................
Docking a Toolbar
37
3 Right
...................................................................................................................................
click menus
37
4 Security
................................................................................................................................... 37
Setting Security
......................................................................................................................................................... 38
Adm in Group
.........................................................................................................................................................
perm issions
38
Adding and
..................................................................................................................................................
maintaining Groups and Users
39
Clearing User
..................................................................................................................................................
passw ords
40
Adding User
..................................................................................................................................................
passw ords
40
Setting User
..................................................................................................................................................
permissions w ithin DataSight Enterprise
40
Who's Logged
.........................................................................................................................................................
On
42
8 Setting up the DataSight Database
43
1 Creating
...................................................................................................................................
a new database
43
2 Opening
...................................................................................................................................
a database
43
3 Adding
...................................................................................................................................
or deleting Levels 1,2,3 and 4
44
Audit Log ......................................................................................................................................................... 45
4
5
6
7
Adding
...................................................................................................................................
and Updating variables
Deleting
...................................................................................................................................
variables
Merging
...................................................................................................................................
variables
Audit
...................................................................................................................................
Trail
45
46
47
48
Setting Up.........................................................................................................................................................
the Audit Trail table
50
Level 3 Properties
.................................................................................................................................................. 52
Level 4 Properties
.................................................................................................................................................. 57
Level Control
..................................................................................................................................................
Documents
58
DataSight Users Manual Version 2.9.4
© 2013 Seveno Pty Ltd
Contents
II
8 Control
...................................................................................................................................
Documents
59
9 Options
................................................................................................................................... 61
10 Repairing
...................................................................................................................................
and compacting the Database
68
9 Maps
69
1 Entering
...................................................................................................................................
Map Details
71
10 Data
74
1 Importing
...................................................................................................................................
data
74
Im porting.........................................................................................................................................................
spreadsheet files
74
Im porting.........................................................................................................................................................
other delim ited files
81
Im porting.........................................................................................................................................................
fixed w idth files
88
Receiving .........................................................................................................................................................
a .dsd file
94
2 Manual
...................................................................................................................................
Data Entry (MDE)
95
3 Merging
...................................................................................................................................
a database
97
4 Exporting
...................................................................................................................................
data
99
Exporting .........................................................................................................................................................
data from a datasheet
99
Exporting .........................................................................................................................................................
a Desktop database
99
5 Move
...................................................................................................................................
To / Copy To
101
Move To ......................................................................................................................................................... 102
Copy To ......................................................................................................................................................... 103
11 Viewing/Editing Data
1
2
3
4
5
6
7
Editing
...................................................................................................................................
data in the Datasheet
Manual
...................................................................................................................................
Data Entry (MDE)
Datasheet
...................................................................................................................................
display options
Summary
...................................................................................................................................
statistics
Filtering
...................................................................................................................................
data
Setting
...................................................................................................................................
dates
Saving
...................................................................................................................................
a Datasheet
12 Graphs
1
2
3
4
5
6
7
8
105
105
106
108
110
111
113
113
115
Create/View
...................................................................................................................................
Graphs
Zooming
...................................................................................................................................
Renaming
...................................................................................................................................
and deleting Graph Series
Saving
...................................................................................................................................
a Graph
Copying
...................................................................................................................................
Graphs
Setting
...................................................................................................................................
and Changing Graph Properties
Using
...................................................................................................................................
Advanced Options
Advanced
...................................................................................................................................
Graphs
115
115
116
116
117
117
119
121
Graphing.........................................................................................................................................................
Multiple Variables
121
Wind Rose
......................................................................................................................................................... 132
13 GIS and DataSight
138
14 Reports
140
1 Tabular
...................................................................................................................................
Reports
140
Exam ple .........................................................................................................................................................
Report: Wind Rose
144
2 Report
...................................................................................................................................
Creator
147
15 Scheduler
153
1 Scheduling
...................................................................................................................................
Tasks
154
16 Conversion Tool
157
1 Conversion
...................................................................................................................................
Tool Introduction
157
DataSight Users Manual Version 2.9.4
© 2013 Seveno Pty Ltd
Contents
III
2 Conversion
...................................................................................................................................
Tool Overview
162
3 Using
...................................................................................................................................
the Conversion Tool
169
Com pleting
.........................................................................................................................................................
a Conversion 1
172
Com pleting
.........................................................................................................................................................
a Conversion 2
176
Com pleting
.........................................................................................................................................................
a Conversion 3
178
Com pleting
.........................................................................................................................................................
a Conversion 4
180
4 Conversion
...................................................................................................................................
Formulas
182
17 Conversion Tables
187
1 Applying
...................................................................................................................................
Conversion Table to (Updating) Existing Data
191
2 Using
...................................................................................................................................
Conversion Tables
192
18 Regression Tool
1
2
3
4
194
Regression
...................................................................................................................................
Tool
Analysing
...................................................................................................................................
Water Quality relationships using the Regression Tool
Analysing
...................................................................................................................................
hydrographic relationships using the Regression Tool
Regression
...................................................................................................................................
Models
19 Interpolation Tool
194
194
203
211
219
1 Interpolation
...................................................................................................................................
Tool
219
20 Scientific Standards
222
1 Scientific
...................................................................................................................................
Standards Introduction
222
2 Using
...................................................................................................................................
Scientific Standards
224
21 Flags
230
1 Setting
...................................................................................................................................
Up Flags
230
2 Application
...................................................................................................................................
Flags
232
3 Using
...................................................................................................................................
Flags
233
Flags in the
.........................................................................................................................................................
Datasheet
233
Flags in the
.........................................................................................................................................................
Conversion Tool
235
Flags and.........................................................................................................................................................
Data Quality
235
22 Gaugings
237
1 Gauging
...................................................................................................................................
Calculator
237
2 Gauging
...................................................................................................................................
Reports
242
23 Plug In Modules
244
1 Add
...................................................................................................................................
a Plug In
244
24 Troubleshooting
1
2
3
4
5
245
General
...................................................................................................................................
running issues
Printing
...................................................................................................................................
Issues
Importing
...................................................................................................................................
Issues
Exporting
...................................................................................................................................
Issues
Merge
...................................................................................................................................
Issues
25 Glossary of Terms
Index
DataSight Users Manual Version 2.9.4
245
245
245
246
247
248
250
© 2013 Seveno Pty Ltd
Copyright Notice
1
1
Copyright Notice
Copyright Notice
Copyright © 2013 Seveno Pty Ltd.
All rights reserved.
The softw are contains proprietary information of Seveno Pty Ltd.; it is provided under a license agreement containing
restrictions on use and disclosure and is also protected by copyright law . Reverse engineering of the softw are is
prohibited.
Due to continued product development this information may change w ithout notice. The information and intellectual
property contained herein is confidential betw een Seveno Pty Ltd and the client and remains the exclusive property of
Seveno Pty Ltd. If you find any problems in the documentation, please report them to us in w riting. Seveno Pty Ltd does
not w arrant that this document is error-free.
No part of this publication may be reproduced, stored in a retrieval system, or transmitted in any form or by any means,
electronic, mechanical, photocopying, recording or otherw ise w ithout the prior w ritten permission of Seveno Pty Ltd.
Adobe and Acrobat are trademarks of Adobe Systems Incorporated.
Microsoft Access, Window s®, Window 95™, Window 98™, Window s NT®, Window XP™ and MS-DOS™ are
trademarks of the Microsoft Corporation.
Seveno Pty Ltd
PO Box 1165
Fyshw ick
ACT 2609
Australia
Phone: +61 (2) 6228 1994
Fax: +61 (2) 6228 1996
E-Mail: [email protected]
Website: http://w w w .seveno.com
DataSight Users Manual Version 2.9.4
© 2013 Seveno Pty Ltd
Your feedback
2
2
Your feedback
To help us improve w hat w e offer, w e w ould like your feedback about this Help File, and about any other aspect of
DataSight.
em ail at: [email protected]
or by m ail at:
Seveno Pty Ltd
PO Box 1165
Fyshw ick
ACT 2609
Australia
or by phone/fax on:
Phone: +61 2 6228 1994
Fax: +61 2 6228 1996
Visit our w ebsite at:
w w w .seveno.com
DataSight Users Manual Version 2.9.4
© 2013 Seveno Pty Ltd
Get the the latest version
3
3
Get the the latest version
Check on start up
If your PC is connected to the Internet DataSight can check for updates as it opens to make sure that you have the latest
version. You w ill be prompted to update and taken through the update process if you choose this. If you prefer, you can
turn this option off and then check for any updates on demand. To do this:
Turn off Auto Update on start up
1.
Click T ools, Options on the main menu.
2.
Select General in the left panel directory of the Options dialogue box.
3.
Uncheck the Enable Auto Update checkbox and click OK.
To update on dem and
1.
Click T ools on the main menu
2.
Select Chec k for Update and follow the onscreen instructions.
DataSight Users Manual Version 2.9.4
© 2013 Seveno Pty Ltd
What is new in DataSight version 2.9
4
4
What is new in DataSight version 2.9
DataSight 2.9 has the same user interface as earlier versions but it has plenty of new features.
It is even more reliable and robust than before. Here is the list of the exciting new features.
Maps: DataSight has an in-built link to Google Maps allow ing users to view station locations or important sites w ithin
the database.
Regression Analysis tool for statistical analysis of data and the creation of rating tables and applying rating tables to
existing data (Enterprise edition only).
Flagging feature - assign user-defined flags to specific data/datasets including a freehand graphical interface
(Enterprise edition only). This feature has replaced the Data Quality feature included in earlier versions of DataSight.
Interpolation Tool - provides users w ith the ability to construct new data points w ithin the range of a discrete set of
know n data points. This graphical curve fitting feature expands on DataSight’s existing calculations and analysis
capability, allow ing simple linear spline interpolation along w ith cubic spline and Akima spline to perform interpolation
operations w ith ease.
Scheduler - a tool for scheduling reports, graphs, calculations and datasheets. New features include automated
emailing and a scheduled task log to review completed scheduled tasks. Active property enables users to one click
operation to enable and disable tasks.
Audit Trail provides very efficient audit logging for Import, Conversion, Data Quality, data editing and manual data
entry (Enterprise edition only).
The Audit Trail has an additional Calibration tool w hich allow s for instrument and equipment calibration entries.
Automated raw data storage on Import (Enterprise only).
Control Documents allow s storage of raw data files, reports, PDF files, site documentation, images, videos, maps
and much more. Accessible by every DataSight user, this provides an excellent document management system for
your databases.
DataSight reporting tools:
Tabular Report Wizard provides an extensive range of tabular reports w ithin a few quick and easy steps.
Report Creator is available for both Desktop and Enterprise versions as a built-in tool.
DataSight Conversion Tool has been re-engineered and redesigned from scratch as a built-in tool.
Look-up Conversion Tables provide look-up conversion in the conversion tool.
Scientific Standards to monitor and report on data quality. Be notified w hen data is not complying w ith Scientific
Standards.
Improved Gauging Calculator for gauging measurements and flow calculation. New features include file saving,
measurement units, measurement quality and collector information. Flow calculations can also be entered manually.
Statistical functions, such as Average, Minimum and Maximum for Graphs.
Calculations during Import.
GIS data view s for Station Properties can contain several geographic information types, such as easting and
northings, X and Y co-ordinates, etc.
Construction Details allow s station specific construction information to be stored w ithin DataSight.
SQL view s (w ith Enterprise edition) provides easy connection to MapInfo, ArcGIS and other GIS softw are for spatial
analysis and mapping.
DataSight Enterprise's Database Engine provides a very strong and fast connection to the database server.
DataSight Users Manual Version 2.9.4
© 2013 Seveno Pty Ltd
What is new in DataSight version 2.9
5
Hundreds of minor improvements and bug fixes.
DataSight Users Manual Version 2.9.4
© 2013 Seveno Pty Ltd
Quick Tour
5
6
Quick Tour
W elc ome to the DataSight Quic k T our.
DataSight is a w indow s-based relational database custom-designed for the easy management, storage, retrieval,
profiling and sharing of environmental data. Custom-designed by an environmental scientist, DataSight combines the
management and storage features of a database w ith graphing and filtering functionality to give you a complete postcollection data solution.
Import datasets in common formats like spreadsheets, comma-delimited or text files or even directly from
environmental sensors or probes
Create and send databases to other users
Receive and merge data from other users
Profile data visually w ith full control over formatting
Interrogate data by filtering
Spend the next 5 minutes on the DataSight Quick Tour and check out how DataSight w orks.
DataSight Users Manual Version 2.9.4
© 2013 Seveno Pty Ltd
Quick Tour
5.1
7
Quick Tour: Layout
The main DataSight w indow can be divided into 5 panels. The three panels to the left contain Data List, Saved View s,
and Field List for the database. The main panel contains tw o tabs allow ing you to view the Datasheet and Graph (and
also a saved report). The bottom panel contains the filters.
DataSight Users Manual Version 2.9.4
© 2013 Seveno Pty Ltd
Quick Tour
8
Data List
DataSight comes w ith a sample database so that you can try the range of DataSight features before you import your
ow n data.
The DataSight database is configured in 4 tiers consisting of:
1. Lev el 1 - appropriate Level 1 may be "Geographic Area's", "Project Area's", "Client's", "Catchment Area's" etc.
2. Lev el 2 - in the case of Level 2 "Water Quality Data", "Weather Station Data", or a specific project w ithin an area
w ould be appropriate.
3. Lev el 3 - the name or identification code relating to a particular monitoring site or location e.g. monitoring station
name.
4. Lev el 4 - the date of a Sample Event. A Sample Event is an occurrence of sampling on a particular day. Each
Sample Event consists of data relating to the variables measured. The sample database supplied w ith DataSight
comes configured w ith some common variables. . .
DataSight Users Manual Version 2.9.4
© 2013 Seveno Pty Ltd
Quick Tour
5.2
9
Quick Tour: Database Variables
When you are ready to create your ow n database - simply add your ow n variables to customize the DataSight
database. The DataSight variables correspond to the field names of the data that you w ill be adding or importing. When
you add a variable you can define its unit of measurement, type, size and format. (see 7.4 Adding and Updating
Variables).
Note: Laboratory data that contains or may contain a prefix such as "<" to denote that measured value is below
detection limits should be mapped to an appropriate variable w ith the field type set as TEXT.
DataSight Users Manual Version 2.9.4
© 2013 Seveno Pty Ltd
Quick Tour
5.3
10
Quick Tour: Importing Data
Now you are ready to import your data using DataSight's Import w izard.
Just select your existing data file. In this example it is a spreadsheet.
DataSight Users Manual Version 2.9.4
© 2013 Seveno Pty Ltd
Quick Tour
11
Then set the data formats and w here the data to be imported starts and stops, before selecting Next.
In this example w e are importing a spreadsheet but you can also import text files - both delimited and fixed w idth along
w ith may different raw data logger files.
DataSight Users Manual Version 2.9.4
© 2013 Seveno Pty Ltd
Quick Tour
12
In the above image a txt file is being imported. The user needs to select either delim ited or fixed w idth format for the
file type.
DataSight Users Manual Version 2.9.4
© 2013 Seveno Pty Ltd
Quick Tour
13
Map the spreadsheet fields to your DataSight database fields.
You may need to add Datasight Field Variables to match the Input Field: Click the Variables button and follow the steps
under Quick Tour: Database Variables.
DataSight Users Manual Version 2.9.4
© 2013 Seveno Pty Ltd
Quick Tour
14
You can preview w hat your data w ill look like once it is imported. Then select next to continue...
DataSight Users Manual Version 2.9.4
© 2013 Seveno Pty Ltd
Quick Tour
15
Add your Level information. You can also add audit trail information. Click next...
DataSight Users Manual Version 2.9.4
© 2013 Seveno Pty Ltd
Quick Tour
16
Perform simple calculations on your Input Fields.
Tick the box above the Input Fields to perform a conversion on your input data.
You may also add New Input Fields to store the calculated data in a separate Variable Field from that of the raw data.
Once the conversion has been completed DataSight w ill remember the conversion and w ill deliver the last formulae
used.
DataSight Users Manual Version 2.9.4
© 2013 Seveno Pty Ltd
Quick Tour
17
Standards are used to implement Min and Max settings for variables.
Use the drop-dow n menu to select the desired Standard
Click Next and you're done.
DataSight Users Manual Version 2.9.4
© 2013 Seveno Pty Ltd
Quick Tour
18
You can check the Import Summary Information page before proceeding w ith the import.
DataSight Users Manual Version 2.9.4
© 2013 Seveno Pty Ltd
Quick Tour
5.4
19
Quick Tour: Exporting Data
You can export all, or selected data, in a database format. Select the data you w ould like to export.
Note: The creation of a DataSight.dsd database file is NOT available in DataSight Enterprise. Data Export from the
Enterprise version is direct from the data sheet.
Select some or all variable data . . .
If you select to "Send By Email"...
DataSight creates a zipped database ready for emailing.
DataSight Users Manual Version 2.9.4
© 2013 Seveno Pty Ltd
Quick Tour
DataSight Users Manual Version 2.9.4
20
© 2013 Seveno Pty Ltd
Quick Tour
5.5
21
Quick Tour: Merge
You can also receive a DataSight database from another source and merge the data into your ow n database.
Select any or all of the data for merging - in this case the data for River.
Select the variable fields data to be merged and set the merge links.
DataSight Users Manual Version 2.9.4
© 2013 Seveno Pty Ltd
Quick Tour
DataSight Users Manual Version 2.9.4
22
© 2013 Seveno Pty Ltd
Quick Tour
5.6
23
Quick Tour: Graphs
After your data is in DataSight you can retrieve it, view it, graph it and interrogate it.
DataSight Users Manual Version 2.9.4
© 2013 Seveno Pty Ltd
Quick Tour
24
Especially pow erful is the data profiling functionality. Just drag and drop data fields to use as axes or series onto the
graph panel.
You have full control over the formatting of the graph including being able to stack graphs.
DataSight Users Manual Version 2.9.4
© 2013 Seveno Pty Ltd
Quick Tour
25
You can scroll up and dow n successive sample dates and the graph changes dynamically.
DataSight Users Manual Version 2.9.4
© 2013 Seveno Pty Ltd
Quick Tour
26
You can plot different series for comparison - in this example, overlay tw o different periods of Humidity data for a
w eather station.
DataSight Users Manual Version 2.9.4
© 2013 Seveno Pty Ltd
Quick Tour
27
Use DataSight's filter function to construct data queries. See the results in tabular form or plot as a graph.
DataSight Users Manual Version 2.9.4
© 2013 Seveno Pty Ltd
Quick Tour
5.7
28
Quick Tour: Reports
Use Tabular Reports Wizard to create tabular report in a few clicks.
To start Tabular Report Wizard click button on the main menu.
Then select your report type and the report period depending on the report type you have selected.
DataSight Users Manual Version 2.9.4
© 2013 Seveno Pty Ltd
Quick Tour
29
Select your data location (Level 3 information) to continue. You can select multiple station as w ell as selection same station
more than once.
Next step is selection of Datasight variable(s) you w anted to add your tabular reports. You can double click on the variable
you w ant to add the report or you can use buttons located betw een tw o combo boxes.
DataSight Users Manual Version 2.9.4
© 2013 Seveno Pty Ltd
Quick Tour
30
Your tabular report list is grouped by the Level 3 Information. Tabular Report Wizard w ill show you the list of all the
combinations of the selected Levels and the variables. You may w ant to cancel or remove from the output by using the
corresponding check box. You can also change the report type from Mean (Averages), Cumulative.
The final step is to select output type. You can send your report directly to the printer or you can save your report into
different file formats like PDF, RTF etc.
DataSight Users Manual Version 2.9.4
© 2013 Seveno Pty Ltd
Quick Tour
31
You can see a list of the printed or created reports on the last page of the w izard.
DataSight Users Manual Version 2.9.4
© 2013 Seveno Pty Ltd
Quick Tour
5.8
32
Quick Tour: Notes
Thanks for taking the Quick Tour!
To summarise:
DataSight is Seveno's flagship product, a platform for the management, graphing, communication and reporting of
any natural resource data. DataSight handles information relating to any part of the sector - surface and
groundw ater, atmosphere, soil and others.
Use the advanced pow er of DataSight to connect w ith or import data from acquisition systems such as probes,
sensors, data loggers and laboratory instrumentation into a logical centrally-organized relational database. Legacy
databases, spreadsheets, and existing data files can all be consolidated.
DataSight has built in functionality to track audit trails, perform data validation, data interrogation and graphical
profiling.
With DataSight as a common data communication standard you can send and receive, share and merge data even if
that data is structured differently. You can also output, report and publish data in a variety of formats including w ebbased.
DataSight is GIS and ODBC compliant adding its ow n pow er to your GIS environment and preserving your investment
in existing applications. DataSight is also structured to accept plug-in analysis modules such as Seveno’s
LakeWatch application.
Easy scalability makes DataSight the perfect choice of organizational application. Whether supported by a desktop or
an enterprise-w ide database, DataSight connects the w hole natural resources industry.
To dow nload a fully functional evaluation copy of DataSight go to http://w w w .seveno.com
DataSight Users Manual Version 2.9.4
© 2013 Seveno Pty Ltd
Using this Guide
6
Using this Guide
6.1
Who this Help file is for
33
This Help file is for anyone w ho is using DataSight Desktop, DataSight Enterprise or DataSight Lite. Some features
change betw een products as noted throughout the help file.
6.2
If you are using DataSight Lite
DataSight Lite has few er features than DataSight Desktop and Enterprise, but is free of charge. DataSight Lite can still
be used to import, export and maintain data in a DataSight database and can be used after the 30 day evaluation period
for DataSight has expired. How ever, not all the features described in the Help file w ill be available for DataSight Lite.
6.3
Typographical Conventions
Before you start using this Help File, it is important to understand the terms and typographical conventions used.
For more information on specialized terms used in the documentation, see the Glossary.
The follow ing kinds of formatting in the text identify special information.
Form atting Convention
Type of Inform ation
Numbered List
Step-by-step procedures. You can follow these
instructions to complete a specific task.
Spec ial Bold
Items you must select or interact w ith, such as
menu options, command buttons or dialogue boxes.
Emphasis
Used to emphasize the importance of a point or for
variable expressions such as parameters.
CAPITALS
Names of keys on the keyboard. For example,
SHIFT, CTRL, or ALT.
KEY+KEY
Key combinations w here you must press and hold
dow n one key and then press another, for
example, CTRL+P, or ALT+F4.
DataSight Users Manual Version 2.9.4
© 2013 Seveno Pty Ltd
Getting Started
7
34
Getting Started
This chapter describes the w ork environment and the interface elements you w ill encounter w hile you are using
DataSight.
7.1
Main Window Layout
The main DataSight w indow can be divided into 5 panels. The three panels to the left contain Data List, Saved View s,
and Field List. The main panel contains tw o tabs allow ing you to view the datasheet and graph (and also a saved
report). The bottom panel contains the filters.
To expand your view of the left panels, datasheet/graph panel or filters, hover the cursor over any screen panel
border. The cursor w ill change to
panel.
then hold the left mouse button dow n to drag and drop the border of the screen
To expand the data list, saved view s, or field list w indow s vertically click on the panel header and drag to the
desired height on screen.
DataSight Users Manual Version 2.9.4
© 2013 Seveno Pty Ltd
Getting Started
Panel
Controlled by
Data List Panel
35
Function
Displays a tree list view of your
data in Levels 1, 2, 3 and 4.
Click the arrow s to open and
close the panel.
Datasheet/Graph Panel
Displays selected data in a
Datasheet or Graph
Click tabs to toggle betw een
view s.
Saved View s
Click on the arrow s to open and
close the panel.
Field List Panel
Click the arrow s to open and
close the panel.
Filter Panel
Click
on the
DataSight Toolbar to toggle.
Displays a tree list view of the
saved datasheets, graphs and
imported reports.
Displays the available variables
in your DataSight database.
Displays the current Filters
(conditions) applied to the
selected data.
At the top of the main DataSight w indow is a Toolbar panel.
7.2
Toolbars
The Toolbar panel comprises
The Menu Bar
The DataSight Toolbar
The Graph Toolbar
7.2.1
Menu Bar and DataSight Toolbar
Type
Description
Menu bar
The Menu bar is a special toolbar at the very top of the screen that
contains the menus File, Edit, T ools and Help.
Click any menu name in the bar to see a list of menu commands.
Moving the cursor over any other menus w ill display the options
DataSight Users Manual Version 2.9.4
© 2013 Seveno Pty Ltd
Getting Started
36
w ithout having to click again. Click to select and execute any
command. Any greyed out menu command indicates that it is not
available.
DataSight Toolbar
DataSight Button
The DataSight toolbar, below the menu bar provides shortcuts to the
DataSight functions that you w ill use most often.
Function
Opens a new blank graph w hen the Graph tab is active or adds a new
record w hen the Datasheet tab is active for a Level 3.
Allow s the naming and saving of the current Graph or Datasheet.
Prints either the DataSheet or Graph depending on w hich tab is active.
Preview s the print of either the Datasheet or the Graph depending on
w hich tab is active. From the Preview dialogue box you can change the
Page Setup.
Activates the Import Wizard w hich w ill step you through the import
process.
Toggles the display of current Filters (conditions) applied to the selected
data.
Allow s you to edit data w hen the Datasheet tab is active.
Tabular reports opens a report w izard w indow allow ing you to
generate tabular reports over varying time frames.
MDE stands for Manual Data Entry. By clicking on this icon you can
access an electronic form for data entry. The parameters entered are
chosen so that you can build and save electronic forms to match field
data sheets.
7.2.2
Graph Toolbar
The Graph Toolbar to the right of the DataSight Toolbar provides shortcuts to the view and presentation formats of your
graph.
Button
Function
Resets the normal graph view .
Restores the cursor to Normal functionality. In Normal mode, zoom is
enabled
Enables the graph to be rotated by dragging up and dow n and left and right.
Enables the graph to be moved up and dow n and left and right.
DataSight Users Manual Version 2.9.4
© 2013 Seveno Pty Ltd
Getting Started
37
Enables the depth of the graph to be increased/decreased by dragging left
or right. (3D must be enabled before this option is active).
Toggles a 3D perspective on and off.
Opens the Graph Properties dialogue box.
7.2.3
Floating and Docking a Toolbar
1.
Click in any part of the grey area in the toolbar, then
2.
Keeping your finger on the mouse button, drag and drop the toolbar to a new location w here it w ill float.
or
3.
Drag and drop the toolbar to the extreme right or left of the screen to dock it on that side.
If the toolbar is floating, double clicking the Title Bar at the top of the toolbar panel w ill restore it to its previous
docked location.
7.3
Right click menus
DataSight provides right-click menus for accomplishing your most common and frequently used tasks. The options
displayed on the right-click menu vary depending on w here you are w hen you click.
7.4
Security
The Security feature is imposed by w ay of a passw ord on the DataSight database. This is first allocated by the user
called Admin w ho is alw ays a member of the Admin Group. Only the Admin User has this pow er in addition to the
general Admin Group pow ers. For this reason you are prohibited from deleting the Admin User.
DataSight comes w ith 2 default User Groups: Admin and User. While both Groups can have access to the database,
only members of the Admin group can set up and maintain Groups and Users. For this reason, w e recommend that you
restrict membership of the Admin Group to just the default Admin User in order to better control the integrity of the
system. Despite this, you may still add other members of the Admin Group if you w ish.
The Security features in DataSight are implemented in this hierarchical order:
1.
The Adm in User in the Adm in Group
Who can toggle the Security feature on the DataSight database by allocating an Admin User passw ord. If that
passw ord is subsequently deleted, Security is toggled off and access to the database w ill remain unrestricted
unless, and until, another passw ord is allocated by someone logged in as the Admin User. If no Security is turned
on, the default login is the Admin User.
2.
Mem bers of the Adm in Group
Who can:
Toggle off security by clearing the Admin User passw ord
Add and Delete Groups
Add and Delete Users
Assign Users to Groups
Clear any User passw ords (including the Admin User's)
3.
Users
Who can Add or Change their ow n passw ords
DataSight Users Manual Version 2.9.4
© 2013 Seveno Pty Ltd
Getting Started
7.4.1
38
Setting Security
Setting up Security for the first tim e
The first time that DataSight Security features are set up, the user doing the setup is recognized as having the default
user name of Admin w hich is the only existing member of the Admin Group. The Admin User toggles the DataSight
Security feature on at the highest level by allocating an Admin User passw ord. If that passw ord is subsequently
deleted, Security is toggled off and access to the database w ill remain unrestricted unless, and until, another passw ord
is allocated by someone logged in as the Admin User.
Allocating a Security passw ord
1.
Click T ools, Sec urity, Ac c ounts on the main menu.
2.
The Users and Groups dialogue box opens.
3.
Click the Passw ord tab and note that the current user is Admin.
4.
Type a passw ord in the New Password field then type it again in the Verify field and click OK.
5.
That passw ord w ill then be required for the Admin User the next time that DataSight is opened.
Passw ords are attached to Users and are not case sensitive.
Group Privileges override individual privileges. Individual users w ill continue to have a specific group's privileges
even if the group has been deleted. All users should be transferred to a new group is a group is deleted.
7.4.2
Admin Group permissions
DataSight comes w ith tw o default User Groups Admin and User. There is one existing default member of the Admin
Group (the user called Admin).
While both the Admin and User Groups can have access to the database, only members of the Admin group can set
up and maintain Groups and Users. For this reason, w e recommend that you restrict membership of the Admin Group to
just the default Admin User in order to better control the integrity of the system. Despite this, you may still add other
members of the Admin Group if you w ish.
Adm in Group Users can
Add and Delete Groups
Add and Delete Users
Assign Users to Groups
Clear any User passw ords (including the Admin User's)
DataSight Users Manual Version 2.9.4
© 2013 Seveno Pty Ltd
Getting Started
7.4.2.1
39
Adding and m aintaining Groups and Users
You must be a member of the Admin Group to maintain Groups and Users
Groups
1.
Click T ools, Sec urity, User Ac c ounts on the main menu.
2.
The Users and Groups dialogue box opens.
3.
Click the Groups tab.
4.
Click the Name drop-dow n box to view list of existing Groups.
5.
Selecting any Group w ill display a list of members in the panel below .
then,
To Add a Group
Click New and the Add Groups dialogue box appears.
6.
Type in a Group name and click OK.
7.
or,
To Delete a Group
Select a Group
8.
Click Delete
9.
If the Group has members, a w arning message w ill appear asking for confirmation of the Delete.
10.
If the Delete is confirmed, any members w ill be unallocated from the Group and the Group w ill be deleted.
Users and their m em bership of Groups
Maintain Users
1.
Click T ools, Sec urity, Ac c ounts on the main menu.
2.
The Users and Groups dialogue box opens.
3.
Click the Users tab.
4.
Click the Name drop-dow n box to view a list of existing Users.
Then,
Add a New User
1.
Click the New button and the Add User dialogue appears.
2.
Type in a User name.
3.
4.
Allocate a passw ord to a User at this stage by typing in a passw ord in the passw ord field and again to verify.
You can also leave the passw ord field blank.
Click OK.
Then,
Adding or Rem oving a User to or from a Group
1.
By default, new users are added to the User group but you can also add them to any other Group(s).
2.
With the Users tab active, select the user name from the Name drop-dow n box.
DataSight Users Manual Version 2.9.4
© 2013 Seveno Pty Ltd
Getting Started
Select the relevant Group from the Av ailable Groups list.
3.
4.
7.4.2.2
40
Click the Add or Remov e button. Alternatively, the Clear button w ill clear the user from membership of all
Groups.
Clearing User passw ords
Any member of the Admin Group can clear any User passw ord including that of the Admin User.
1.
Click T ools, Sec urity, Ac c ounts on the main menu.
2.
The Users and Groups dialogue box opens.
3.
Click the Users tab.
Click the Name drop-dow n box to view a list of existing Users.
4.
then,
7.4.2.3
5.
Click to select the relevant user.
6.
Click the Clear Password button.
7.
A confirmation dialogue appears, click Yes.
Adding User passw ords
Any user can add or change their passw ord.
1.
Click T ools, Sec urity, Change Password.
2.
The Change Password dialogue box opens.
then,
To add
Leave the Old Password field blank and type in a passw ord in the New Password and Verify fields.
3.
or,
To change an existing passw ord
7.4.2.4
4.
Type the old passw ord in the Old Password.
5.
Type the new passw ord in the New Password and Verify fields.
6.
Click OK.
Setting User perm issions w ithin DataSight Enterprise
DataSight Enterprise has added security features. The access permissions are the final stage in setting up security on
your database.
The Administrator or Users w ithin the Admin Group can allocate access to specific areas w ithin DataSight Enterprise.
DataSight Users Manual Version 2.9.4
© 2013 Seveno Pty Ltd
Getting Started
1.
Click T ools, Sec urity, Permissions on the main menu.
2.
The Users and Group Permissions dialogue box opens.
3.
Click the User or Group in the User/Group Name w indow .
4.
Set the permissions in the Object Name w indow by ticking the appropriate check boxes.
41
The Administrator should NEVER release the Admin User Name and Passw ord as the Admin User Name and
Passw ord are identical for Microsoft SQL Server. The users should be provided separate passw ords. The users w ill
retain the last group privileges that they have been allocated even if the group has been deleted. All users should be
allocated to groups.
DataSight Users Manual Version 2.9.4
© 2013 Seveno Pty Ltd
Getting Started
7.4.3
42
Who's Logged On
You can identify any current users of a DataSight database by selecting Security > Who's Logged On from the
Tools menu.
This w indow displays the User Name and Logon Time of those currently using the database.
DataSight Users Manual Version 2.9.4
© 2013 Seveno Pty Ltd
Setting up the DataSight Database
8
43
Setting up the DataSight Database
Before importing or entering data into the DataSight database you must first define the structure and nature of the data
fields (variables) you w ish to use for your variables and add these to the Database. You must also decide on your Level
1, Level 2, Level 3 and Level 4 hierarchy.
You can also set a security function on your database and maintain audit trails.
8.1
Creating a new database
DataSight Desktop Edition comes w ith a sample database, but w hen you w ant to import data (or if you have received a
DataSight database from another user) then you can create a blank database or create a database from the dsd file that
you have been sent.
1.
Click File, Database, Create.
2.
The Create Database dialogue box appears.
3.
Choose the location w here you w ant to save your new database.
4.
If you are creating a database from a dsd file then check the Create from DSD file checkbox (not available in
DataSight Enterprise) and select the location of the dsd file.
5.
Click the Create button.
6.
You are now able to import or merge data into the new database.
Datasight Administrator is the database management tool for the Datasight Enterprise Edition. Datasight
Administrator can be used to create new databases for Datasight Enterprise Edition.
8.2
Opening a database
DataSight Desktop Edition
1.
To open an existing DataSight database click File, Database, Open.
2.
The Selec t data loc ation dialogue box appears.
3.
Navigate to the required folder, Click Ok .
DataSight Enterprise Edition
1.
To open an existing DataSight database click File, Database, Open.
2.
Enter the logon information in the dialogue box appears.
3.
To Connect to the Database server and Open the Datasight database click Ok .
The DataSight status bar show s the location of the database w hich is currently open.
DataSight Users Manual Version 2.9.4
© 2013 Seveno Pty Ltd
Setting up the DataSight Database
8.3
44
Adding or deleting Levels 1,2,3 and 4
Add Level 1
1.
With the cursor anyw here in the Data List Panel right-click and select New.
2.
Select Lev el 1 and the Add Lev el 1 dialogue box appears.
3.
Type in a Lev el 1 name.
Add Level 2
1.
2.
With an existing Level 1 selected, right-click and select New, Lev el 2 and the Add Lev el 2 dialogue box
appears.
Type in a Lev el 2 Name.
Add Level 3
1.
2.
With an existing Level 2 selected, right-click and select New, Lev el 3 and the Add Lev el 3 dialogue box
appears.
Type in Lev el 3 name or code.
Add Level 4
1.
2.
With an existing Level 3 selected, right-click and select New, Lev el 4 and the Add Lev el 4 dialogue box
appears.
Set the new date.
Delete Level 1, Level 2, Level 3 or Level 4
With the appropriate item selected, right-click and select Delete. A confirm dialogue w ill display, advising that any child
data attached to that item w ill also be deleted. Click Yes.
DataSight Users Manual Version 2.9.4
© 2013 Seveno Pty Ltd
Setting up the DataSight Database
8.3.1
45
Audit Log
DataSight has an Audit Log of database configuration changes that occur w hen renaming and deleting Levels, Saved
View s and Import Templates. This enables you to track changes you have made to these components.
8.4
Adding and Updating variables
1. Click the Settings button on the menu bar and select Variables.
The Variables dialogue box appears show ing existing DataSight database variables. Tw o default variables must
alw ays be present. These are Date and Time and they w ill alw ays be greyed out so that they cannot be deleted
although you can change their Variable name, Desc ription and Format.
2. To add a variable, click the New button and a new line w ill be added highlighted in yellow .
DataSight Users Manual Version 2.9.4
© 2013 Seveno Pty Ltd
Setting up the DataSight Database
46
3. Click on the new line in the Variable column and name the variable.
4. Click in the Desc ription column and type in a meaningful description.
5. Click in the Units column and type in the appropriate unit of measurement.
6. Click in the Field T ype column and use the drop-dow n menu to select the type of value.
If you have selected Number then skip the Size column and type or select the Format. The number being
formatted is alw ays rounded to as many decimal places as there are digit placeholders ("0" or "#") to the right of
the decimal point. If the number contains no decimal point, the value being formatted is rounded to the nearest
w hole number. Listed number formats are:
##
#,## 0.0
0.00
0.0%
You can choose from this list or type your ow n.
If you have selected T ext then type in the maximum number of characters that w ill make up the string of text in
the Size column.
If you have selected Date as the Field T ype, then you can leave the Format box empty and the default date
w ill be as per your Window s date setting. Otherw ise you can type a different format w hich w ill override the
default.
Data that contains or may contain a prefix such as "<" to denote that measured value is below detection limits
should be mapped to an appropriate variable w ith the field type set as Text. Note: In DataSight Enterprise, once the
field type of a variable is saved as Text it is not possible to changing the variable field type from text to
num eric.
8.5
Deleting variables
1.
Click the T ools button on the DataSight toolbar and select Variables.
2.
The Define Variables dialogue box appears show ing existing DataSight database variables.
3.
Click to check the Delete checkbox(es) against any variable(s) that you w ish to delete.
4.
Click the Delete button.
5.
Click the Sav e button at any point to save changes and continue, otherw ise w hen you click the Close button
you w ill be prompted to save your changes.
If the variable that you intend to delete has been used as a series (dependent) variable or axis (independent)
variable in any created graph, you w ill get a message asking to confirm the delete.
DataSight Users Manual Version 2.9.4
© 2013 Seveno Pty Ltd
Setting up the DataSight Database
8.6
47
Merging variables
1.
Click the T ools button on the DataSight toolbar and select Variables.
2.
The Define Variables dialogue box appears show ing existing DataSight database variables.
3.
Click the Merge button.
4.
Select your Source Variable you w ish to merge from and click Next.
5.
In the follow ing screen select your Target Variable and click Next.
6.
Select the Merge Options you w ish to apply and click Start Merge.
DataSight Users Manual Version 2.9.4
© 2013 Seveno Pty Ltd
Setting up the DataSight Database
48
7. A w indow stating "Merge process completed" w ill be displayed. Click Done.
8.7
Audit Trail
It is inevitable that critical records w ithin your databases w ill get modified or deleted from time to time. If the database
system has more than one user, the frequency of these events increases exponentially. With Audit Trail, DataSight has
incorporated a solution for monitoring and recording changes to a database, such as w hen data has been imported or
modified or w hen data has been deleted by a user. Essentially, Audit Trail is a record w hich tracks and displays w ho has
accessed and edited data, from w hich computer system, and w hat operations the user has performed at that time.
This information can be displayed under Level 3 Properties as an Audit Log.
The Audit Logs tab displays information related to changes to Level 3 data, such as imports, conversions (using the
Conversion tool) and w hen data is deleted.
DataSight Users Manual Version 2.9.4
© 2013 Seveno Pty Ltd
Setting up the DataSight Database
49
As you can see, the Audit Log records the date and time of the event, the user w ho w as logged in to DataSight at the time,
the Computer the user w as using, and the type of activity that user completed. The Audit Log also records details for the
event, including any related variables, conversions, etc.
If you click the Details icon for a specific event a w indow detailing the activity is displayed in the ‘Audit Log Details’
w indow . This can be useful w hen attempting to recover lost or accidentally deleted data, as full details of the data are
retained, such as those show n below , and these can be copied to the clipboard.
DataSight Users Manual Version 2.9.4
© 2013 Seveno Pty Ltd
Setting up the DataSight Database
50
See Also: Database Audit Log
8.7.1
Setting Up the Audit Trail table
Before the Audit Trail can begin recording details for imported data and for data entered manually, all
the equipment and personnel/user details must first be loaded into Audit Trail Setup. To access Audit
Trail Setup in DataSight, select the Tools menu and click on Audit Trail.
From this window you can click New to create New Equipment records, detailing the Brand/Model
and Serial No., and New Person records, entering the Name, Organisation and User Name details.
You can also edit and/or delete current equipment or people within the Audit Trail. The person and
equipment information is now available to attach to data when it is being imported and when data is
being entered into a datasheet using Manual Data Entry.
DataSight Users Manual Version 2.9.4
© 2013 Seveno Pty Ltd
Setting up the DataSight Database
51
Calibration
The Details button next to each of the Equipment can be used to add any calibration details required
for the equipment, such as servicing and maintenance, along with any comments.
Click the Details button and an Equipment Details window will open allowing you to edit equipment
model and serial number, add and delete calibration dates, and enter any comments related to the
equipment. For example, add a link to the equipment manufacturer’s internet address (once linked,
press Ctrl + Left mouse click to follow the link).
When data is imported you can attach an audit trail w hich records the Equipment used to acquire the data and the Person
responsible for collecting it. The Audit Trail details are recorded and may be view ed as (Lev el 4) Properties against the
sample event.
DataSight Users Manual Version 2.9.4
© 2013 Seveno Pty Ltd
Setting up the DataSight Database
52
Before any Audit Trail can be recorded, all the equipment and person details must first be loaded into the Audit Trail
Table.
Maintain Audit Trail Table
1.
On the main menu, click T ools, Audit T rail.
2.
The Audit T rail Setup dialogue box appears.
3.
Any existing Equipment and Person w ill be listed.
To add new Equipm ent or Person
1.
Click File, New and make a selection.
2.
According to the selection, a new line w ill be added.
3.
Type in the details.
4.
Note that for New Person you may also select a User Name if that person has also been added as a User.
5.
Click Sav e then continue to add details or click Close to save and close the dialogue box.
To delete Equipm ent or Person
8.7.1.1
1.
Click anyw here in the row for that equipment or person.
2.
Click Delete.
3.
Note that deleting any Person or Equipment w ill remove them from any existing Audit Trail.
Level 3 Properties
1.
With an existing Level 3 selected, right-click and select Properties.
2.
The Properties dialogue box appears show ing the Level 3 Name.
3.
Under Station Comments. Type any information or copy and past images relevant to the station.
DataSight Users Manual Version 2.9.4
© 2013 Seveno Pty Ltd
Setting up the DataSight Database
4.
53
Click on the
icon. The Add Link dialogue box appears. (Once linked, press Ctrl + Left mouse click to
follow the text link to a w ebpage, file, etc.)
5. Click on the
w indow .
icon. The Find dialogue box appears. Type in the text you w ish to find in the Station Comments
DataSight Users Manual Version 2.9.4
© 2013 Seveno Pty Ltd
Setting up the DataSight Database
6.
54
Input your GIS information for the site. Longitude, Latitude and Altitude information boxes are also present for
additional information relating to the site locality.
This GIS information can be linked to MapInfo (and other GIS softw are) for use in mapping and spatial analysis.
7.
The Construction Details area allow s construction details of individual stations to be recorded.
DataSight Users Manual Version 2.9.4
© 2013 Seveno Pty Ltd
Setting up the DataSight Database
8.
55
The Audit Logs tab displays information related to changes to Level 3 data, such as imports, conversions
(using the Conversion tool) and w hen data is deleted, as w ell as other configuration changes for import
templates and scheduled tasks. They keep date and time, username and computer name information about the
activity as w ell as the all the details of the activity. For data import records, inclusion of the specific w orksheet
w ithin an Excel file that w as the source data sheet.
DataSight Users Manual Version 2.9.4
© 2013 Seveno Pty Ltd
Setting up the DataSight Database
56
As you can see, the Audit Log records the date and time of the event, the user w ho w as logged in to DataSight
at the time, the Computer the user w as using, and the type of activity that user completed.
When you click the Details button you can get details of the activity.
Information in the Audit Log Details screen is in RTF format.
DataSight Users Manual Version 2.9.4
© 2013 Seveno Pty Ltd
Setting up the DataSight Database
57
This can be useful w hen attempting to recover lost or accidentally deleted data, as full details of the data are
retained. You can copy this information into to Clipboard and use somew here else.
8.7.1.2
Level 4 Properties
1.
With an existing Level 4 selected, right-click and select Properties.
2.
The Ev ent Properties dialogue box appears show ing the Body Type, Body, Station and Events.
3.
Check your Equipment and Collec tor information for the Level 4 Date. If the appropriate choice is not listed in
the drop dow n menus, click on
to open and edit audit trail information.
4.
The Comments box can be used to store other information relating to the Level 4.
5.
Click on the
icon. The Find dialogue box appears.
DataSight Users Manual Version 2.9.4
© 2013 Seveno Pty Ltd
Setting up the DataSight Database
8.7.1.3
6.
Type in the text you w ish to find in the Comments w indow .
7.
Click on the
58
icon. The Add Link dialogue box appears.
Level Control Docum ents
The Control Documents panel provides a comments text box that can be used to store information relevant to all (or the
majority of) data in the database.
1.
Right-click on each level in Data List. A pull-dow n menu w ill appear.
2.
Click on Control Doc uments. The Control Documents w indow appears.
DataSight Users Manual Version 2.9.4
© 2013 Seveno Pty Ltd
Setting up the DataSight Database
3.
8.8
59
Type in your rich text comments in the editor, or create links to other documents on your computer or netw ork.
Control Documents
Control Documents provides an area w ithin DataSight for document management w ithin your database.
It is accessible via the Tools menu (or by right-clicking on a specific Level 3).
Access via the Tools menu
If Control Documents are accessed via the
Tools menu it w ill display the general control
documents for the database you are currently
using.
DataSight Users Manual Version 2.9.4
© 2013 Seveno Pty Ltd
Setting up the DataSight Database
60
Access via Level 3
Control Documents is
Level 3 aw are, so that
if it is opened via a
right-click on Level 3 it
only show s
documents for that
specific Level 3.
The Control Documents screen is show n below .
Each record has a Field Description for entering a document title or the details of the document. The Link column can be
used to attach and open links by right-clicking on the Link area for a particular record. This is a hyperlink and can be a link
to any local or netw ork file, or can be used as an internet link. Each record also has a Start Date and End Date, and these
can be entered to specify the period of applicability for a document, for example. The Details column allow s further details
regarding the documents to be entered (These details are RTF documents, w hich allow text, images and hyperlinks). The
final column provides an area for attaching files: Right-clicking in the Attachment column allow s the user to attach any file
type, as show n below .
Load Attachment is used to add an attachment to that record
Open Attachment opens the attachment using the associated
softw are in Window s.
Save Attachment As saves the file w ith a new name, w ithout
changing the original format. Users can change the name
w hile saving.
Selecting Clear Attachment deletes the attachment (w ithout
deleting the record).
DataSight Users Manual Version 2.9.4
© 2013 Seveno Pty Ltd
Setting up the DataSight Database
61
You can save ICS Outlook Calendar files into Control Documents, w hich can be scheduled for email. Open your Outlook
Calendar, click Save As and select iCalendar format. Once your calendar is saved in this format, open the control
document w indow w here you w ish to attach the calendar and then click on the Brow se icon
. Select the calendar for
attachment and click open. Using the Scheduler you can then disseminate this calendar file to intended recipients. A
possible example w here this might be of use is the emailing of sampling runs to staff members.
An im portant note for users of older versions of DataSight
Old (existing) control documents are kept as a record. That is, DataSight w ill automatically create an initial record and copy
all control documents created for database/s in older DataSight versions into the Details area of the first record.
8.9
Options
Set Default preferences
1.
Click Settings, Options on the main menu.
2.
Select the functional area in w hich to set preferences, from the list in the left panel.
General
Toggle the Enable Auto Update on and off and display the location to check for Updates.
Set default paths for exporting, merging data and/or saving scheduled reports.
Set a new default temporary data pathw ay. DataSight automatically recognizes w hen you are attempting to
import a large file (in excess of 10,000 lines) and assigns a temporary data location in order to make the
importation process faster and more efficient. The default location is C:\TEMP but you can set a new temp data
path at any time or if the C Drive is low on space.
DataSight Users Manual Version 2.9.4
© 2013 Seveno Pty Ltd
Setting up the DataSight Database
62
Im portant
It is essential that a DataSight user has access rights to the drive and folders nominated above. If users are not able to
w rite to the default paths, as displayed in the above w indow , please change the paths in the Options w indow .
DataSight Users Manual Version 2.9.4
© 2013 Seveno Pty Ltd
Setting up the DataSight Database
63
Im port
Set default formats for all import files:
Date format (MDY, DMY, etc)
Date delimiter
Time delimiter
Decimal symbol
The default file type to search for w hen importing files (please note this does not limit the type of files for import,
simply the type of files DataSight w ill see first).
Copy an import summary to the Window s clipboard automatically
Under the Calculations options the user is also able to define the saved defaults for calculations w hich w ill be carried
out during the Import process.
Use previous Level 3 formulas - checking this option w ill allow DataSight to remember the calculations carried out on
the Level 3 previously and present these to the user w hen similar files are imported to this Level 3.
Create new Input Fields automatically - checking this option w ill allow DataSight to remember the Input Fields used
previously for this Level 3 (station).
Sorted formulas list - sorts the Input fields alphabetically.
DataSight Users Manual Version 2.9.4
© 2013 Seveno Pty Ltd
Setting up the DataSight Database
64
Datasheet
Change Filters Reports, Grid Display, Stop Lighting and SQL View s:
Filters
When selecting a saved Datasheet you can elect:
to alw ays use the filters that w ere originally saved w ith that Datasheet or
alw ays to use the new filters that have just been selected or
alw ays to prompt w ith the above options
Reports
Change the page orientation and toggle the Fit to Page options for any Datasheet w hen output as a report.
Grid
Check/uncheck the Fit Columns to W idth checkbox to toggle the auto fitting of the Datasheet columns to the
available w idth of the Datasheet panel.
Check/uncheck the Show Summary checkbox to default the display of a statistical summary on the Datasheet
Check/uncheck the Show Nav igator checkbox to default the display of a statistical summary on the Datasheet
Stop Lighting / Flags
Change the colour of the cell background in a Datasheet to highlight data that is:
less than the Minimum Value listed for that variable
greater than the Maximum Value listed for that variable
equal to the Goal Value listed for that variable
These Stop Lighting colour changes may be applied only to the text in the cells if preferred.
Enabling the use of Flags in the Datasheet allow s the user to assign flags to specific data w hen view ed in the
Datasheet w indow .
DataSight Users Manual Version 2.9.4
© 2013 Seveno Pty Ltd
Setting up the DataSight Database
65
Views
Create SQL Views for Sav ed Datasheet Views: DataSight creates SQL database tables for Saved
DataSheets - allow s integration and referencing from other softw are, such as MapInfo
Create Numeric SQL Views for Sav ed Datasheet Views: DataSight creates SQL database tables w ith
numeric version of text variables - again, for integration w ith other softw are/s.
These features are only available in the DataSight Enterprise Edition.
Graph
Change Filters, Reports and Default appearance of graphs:
Filters
When selecting a saved graph you can elect to alw ays:
use the filters that w ere originally saved w ith that graph or
use the new filters that have just been selected in the filter panel or
prompt w ith the above 2 options
Reports
Change the page orientation and toggle the Fit to Page options for any graph w hen output as a report
Appearance
Alter the graph's appearance, including displaying 3D and Orthogonal effects and the related zoom, rotation,
elevation and offset aspects of these settings
Walls
Alter the colour and visibility of the graph's panels and w alls
Look and Feel
DataSight Users Manual Version 2.9.4
© 2013 Seveno Pty Ltd
Setting up the DataSight Database
66
Change the look and feel of DataSight by changing appearance attributes. The default setting is Nativ e Style w hich
applies your native Window s settings.
To change, uncheck the Nativ e Style checkbox and use the drop dow n menus to choose Appearance, Border and
Button styles.
Filters
Group Field List allow s fields to be selected from a choice of Lev el, Date or Variable pop-up menus w hen applying
filter conditions. When not activated, a single menu w ill be displayed w ith all levels, dates and variables listed together.
Alongside this, checking the Group Variables Alphabetic ally box makes displaying a longs list of variables easy to
sort through.
The default is a simple Popup Field List.
DataSight Users Manual Version 2.9.4
© 2013 Seveno Pty Ltd
Setting up the DataSight Database
67
Tools
Tools allow s the user to set the default settings for Conversions w ithin Datasight including:
opening the program w ith the last saved conversion set;
interpolate, or estimate the values, w ith the master dataset; and
show ing the conversion summary for confirmation before starting conversions.
Tabular Reports
The user can elect to use a selected default format for displaying variables in tabular reports. If this option is left
unchecked the display format w ill be taken from the format selected in the Variable list.
Map
The user can elect to enable/disable Google Maps. This option should be unchecked w here a computer does not have
an internet connection available.
Scheduler
These options are related to the DataSight Scheduler:
Enable/disable the scheduler
Restart application after a period of...
Restart DataSight after a user-defined period: this clears the DataSight cache of past scheduled tasks, allow ing all
DataSight operations to run smoothly. This is useful w here there are several scheduled tasks running and/or regular
scheduled tasks.
Em ail Server Details
Enter the default email settings for sending scheduled output files from DataSight. Email recipients are selected under
individual tasks.
DataSight Users Manual Version 2.9.4
© 2013 Seveno Pty Ltd
Setting up the DataSight Database
8.10
68
Repairing and compacting the Database
DataSight Desktop has a database repair function that scans everything inside your data file and repairs any errors.
Also, over time, your DataSight database w ill increase in size. If you ever remove data, the database file w ill have
unused areas that once contained the deleted data. These unused areas can affect the efficiency w ith w hich DataSight
w orks w ith the database, and they consume space on your hard disk that can be used for other purposes. We
recommend that you use the Compact function to remove the unused areas in the database and keep DataSight
performing efficiently.
1.
Click File, Database, Repair.
2.
Click File, Database, Compac t.
Datasight Administrator is the database management tool for the Datasight Enterprise Edition to carry out
Reindexing, Defragmentation, Shrinking etc.
DataSight Users Manual Version 2.9.4
© 2013 Seveno Pty Ltd
Maps
9
69
Maps
Map Information can be stored in DataSight allowing users to view the location of stations.
Maps are accessible by right-clicking on a Level 2 or Level 3 within the Data List and selecting Map.
DataSight Users Manual Version 2.9.4
© 2013 Seveno Pty Ltd
Maps
70
Maps are also accessible via the Level 3 Properties area as specified on the following pages.
(You will require an internet connection to access the maps).
If you do not have an internet connection and wish to turn Google Maps off, go to the Tools menu in
DataSight and Select Options...
When the Options window opens, select Tools on the left of the window.
DataSight Users Manual Version 2.9.4
© 2013 Seveno Pty Ltd
Maps
71
You can now check the Enable Google Maps checkbox and click Apply.
9.1
Entering Map Details
To display information in the Map w indow of DataSight station details must be entered in the GIS Information area of a
specific Level 3.
Right-click on the Level 3 and select Properties.
In the Level 3 Properties area select the GIS Inform ation tab.
Within this area you may enter the Longitude and Latitude of a Level 3 along w ith any associated information.
DataSight Users Manual Version 2.9.4
© 2013 Seveno Pty Ltd
Maps
72
When you have done this you can select the Map tab and view the location geographically.
DataSight Users Manual Version 2.9.4
© 2013 Seveno Pty Ltd
Maps
DataSight Users Manual Version 2.9.4
73
© 2013 Seveno Pty Ltd
Data
10
74
Data
This Chapter covers importing, adding, merging and exporting data.
10.1
Importing data
Before importing data, ensure you check the default Import options under the Options via the
Settings menu.
10.1.1
Importing spreadsheet files
1.
First, look at the file that you w ish to import (the data source) and check that the data variables you w ish to
import already exist in the DataSight database. If not, you can choose to add them before you begin.
Alternatively you can add them in Step 2 of the Import process. Check that your spreadsheet contains a Title
Row for all the data fields you w ish to import. If not, add titles for your columns, as it w ill make the subsequent
mapping process much easier. Before starting the import process, close the import file.
2.
Click
on the DataSight Toolbar.
Or
Open the File Menu and Click Import.
The Open Dialogue box appears.
3.
In the Look In drop-dow n menu, select the folder containing the data file that you w ish to import. In the Files
of type drop-dow n menu, click to select Excel files (*.xls), then click the file name and click Open.
4.
The Import W izard Step 1 Dialogue box appears.
DataSight Users Manual Version 2.9.4
© 2013 Seveno Pty Ltd
Data
75
5.
In Step 1 you w ill identify how the import data is formatted and define w here the data values start and stop.
When importing a spreadsheet you must import and parse each w orksheet separately so use the Sheet dropdow n menu to select any w orksheet.
6.
If you have already saved an Import Specification for this type of file and w ant to use it, click the Load button.
Click to select the appropriate specification and click Open. This w ill load the parameters (including the mapping
decisions) that have been saved for that specification. Continue to press Next to preview and move through
each subsequent import step.
Otherw ise,
7.
Set the appropriate Date Format, T ime Delimiter, Date Delimiter and the Dec imal Symbol formats.
8.
Use the scroll arrow s to set the First T itle Row and Number of T itle Rows.
w ill appear next to the
first and last Title Row lines in the data panel (if there is no Title Row , leave the Title Row at "0").
9.
Scroll dow n the data panel and identify w here the data starts. Position the cursor on the appropriate line number
in the data panel and left-click. This w ill set the position of the First Data Row and w ill appear next to that
line in the data panel. Any values above this row (apart from any set Title row s) w ill be ignored in the Import
process. Continue to scroll dow n the data panel and identify w here the data stops. Right click on the appropriate
line number in the data panel to set the position of the Last Data Row and
data panel. Any values below this line w ill be ignored in the Import process.
10.
11.
w ill appear next to that line in the
Click the Next button, The Import W izard Step 2 Dialogue box appears.
The Step 2 Dialogue box is divided into upper and low er panels. In the upper panel you can view and filter your
existing data fields. In the low er panel you map those input fields to your DataSight database fields. This
combination of filtering and mapping functionality means that you can accurately define and import all (or a
DataSight Users Manual Version 2.9.4
© 2013 Seveno Pty Ltd
Data
76
subset) of input data values.
Filtering input values
Filtering is a quick and easy w ay to define, then import a subset of data. You can use filtering to import only the
row s that meet the criteria you specify for a particular column or columns.
Click
at the head of any data column to display a list of filter options. Standard options are All, Custom,
Blanks and Non Blanks. The other options are any of the unique data values w ithin that column. (Note that the
Blanks and Non Blanks options are available only if the column you w ant to filter contains a blank cell).
Use
To return
All
all row s
Custom
all row s meeting the criteria you specify for that column
Blanks
only the row s containing blank data values in that column
Non-Blanks
only the row s containing non-blank data values in that
column
Unique data value
all the row s containing the specified data value in that
column
Custom filtering using specified criteria
Click
at the head of any data column and select Custom.
The custom filter dialogue box appears
Click the first arrow to display the drop dow n menu options for filtering either numeric and text values.
Select a filter condition then enter an appropriate value in the box on the right
If you need to find values that share some characters (w hether text or numeric) use the like or not like options
in conjunction w ith either " _ " or "%":
Use
To stand in for
_ (underscore)
any single character
e.g., " 8_ " w ill find "81", "82", "83", "8B" etc
e.g., "8_ _" w ill find "845", "87A" etc
e.g., "T_" w ill find "TP", "TN", "T3" etc
% (percent)
any number of character
e.g. "8%" w ill find "81", "82456", "8B" etc
e.g. "fish%" w ill find "fish", "fished" "fishing", "fishA1"
etc
To add another criteria, click AND or OR, and repeat the previous step.
12.
In the Step 2 Dialogue box low er panel you w ill map your input fields to your DataSight database fields.
DataSight Users Manual Version 2.9.4
© 2013 Seveno Pty Ltd
Data
77
13.
The left column lists your Input field names. Click in each adjacent line in the right column to access the dropdow n list and select an existing DataSight field to map each Input field to. Note that if appropriate the DataSight
field does not already exist, You can click the Variables button and add the variable. Then close the Define
Variable dialogue box to return to Import W izard Step 2 dialogue box. No unmapped fields w ill be imported.
14.
When you have mapped all the fields, click the Next button. The Import W izard Step 3 dialogue box appears.
15.
In Step 3 you w ill be preview ing the data you are importing. This is also w here you may Sav e the Import
Specification to save repeating earlier steps w hen importing similar data.
Saving the Im port Routine
16.
If you are happy w ith the data press Next, otherw ise press Bac k and make the necessary changes.
17.
The Import Wizard Step 4 dialogue box appears.
DataSight Users Manual Version 2.9.4
© 2013 Seveno Pty Ltd
Data
78
18.
Select the appropriate Lev el 1, Lev el 2 and Lev el 3 from the drop-dow n boxes. If you have not already set
these up you may type a name directly into the blank field. In this case, you w ill be asked to confirm that you
w ish to add the new Level 1, Level 2, Level 3. Click Yes.
19.
The fields marked Date, T ime and Inc rement are only used if you have data w hich does not already have
Date and Time values recorded (it is the Date and Time value that makes each data record unique). In this case,
you can use this section of the dialogue box to set default level 4 Date and Start Time values together w ith the
increment at w hich the time values w ill be added.
20.
If you w ish to add an Audit Trail, click the drop-dow n boxes for Equipment and Collector and make a selection.
Note: if security has required that you log on as the current user, it is your name that w ill appear as the default
Collector.
21.
Click Next.
22.
The Wizard Step 5 dialogue box. In Step 5 you can undertake simple conversions on the data during the import.
This feature can be used to add set offsets to data or convert data from raw to scientific units for example.
23.
Step 5 is activated by ticking the box above the Input Fields. The Input Fields column is populated.
24.
Type in the conversion for the given Input Field you w ish to modify in the appropriate Formula cell. This w ill
place the modified data into the variable field that w as mapped for that input field in Step 2. Leave blank if there
are no calculations.
25.
Alternatively add a New Input Field. The Add New Input Field dialogue box appears.
DataSight Users Manual Version 2.9.4
© 2013 Seveno Pty Ltd
Data
79
26.
Type in your new Input Field Name. Choose a variable to map the new data to from the drop dow n menu
for Mapped Variable. Note that a different variable from that of the raw data should be used if both the raw
data and modified data are to be imported. This variable must already exist w ithin the variable table prior to Step
5. If not, please return to Step 2 and create the new variable. Insert a default value if you w ish. Click Ok .
27.
Type in the conversion for the New Input Field in the corresponding Formula cell. Include the input field
name(s) already present in the table and use standard mathematical nomenclature.
28.
Step 6 offers the chance to select a Scientific Standard to check w hether imported data is w ithin the standard
limits or not. If you w ish to use a Standard, check the box and select a Standard from the list. Otherw ise click
Next.
29.
Click the Finish button.
If your import is successful, a confirmation information box w ill display. Alternatively an Import Error Log w ill
be displayed w ith appropriate error messages and options to Sav e, Print, Prev iew, Go Bac k , Continue
or Abort the Import.
When importing data, if the first line in the file is Data and not column header leave “First Title Line” as “0”.
This ensures that the Input Fields (as in the example above) are named as Field 1,2,3,4 etc. If numerical values
are in the Input Fields your calculation w ill be incorrect. The user can also use multiple fields to calculate a new
variable. For example, Flow * Total Dissolved Solids to give an instantaneous discharge of TDS.
In Step 4 the user selects the Level 3 that the data is to be imported too. The mapping of Level 3 allow s
DataSight to link and save the formulas used for that specific site. The Formula area is populated w ith the last
used formula for that specific site. This increases the speed of importing.
You can save your Import Spec to use again w ith the same type of file. Click the Save button and the Save
Spec dialogue box appears. Type in a description and click Ok.
DataSight Users Manual Version 2.9.4
© 2013 Seveno Pty Ltd
Data
DataSight Users Manual Version 2.9.4
80
© 2013 Seveno Pty Ltd
Data
10.1.2
81
Importing other delimited files
1.
First, look at the file that you w ish to import (the data source) and check that the data variables you w ish to
import already exist in the DataSight database. If not, you can choose to add variables before you begin.
Alternatively you can add them in Step 2 of the Import process. Check that your file contains a Title Row for all
the data fields you w ish to import. If not, you may w ish to add titles, as it w ill make the subsequent mapping
process much easier. Before starting the import process, close the file w hich is to be imported.
2.
Click
on the DataSight Toolbar.
Or
Open the File Menu and Click Import.
The Open Dialogue box appears
3.
In the Look In drop-dow n menu, select the folder containing the data file that you w ish to import. In the Files
of type drop-dow n menu, click to select Text files (*.csv, *.txt), then click the file name and click Open.
4.
The Import W izard Step 1 Dialogue box appears.
DataSight Users Manual Version 2.9.4
© 2013 Seveno Pty Ltd
Data
82
5.
In Step 1 you w ill identify how the import data is formatted and define w here the data values start and stop.
6.
If you have already saved an Import Specification for this type of file and w ant to use it, click the Load button.
Click to select the appropriate specification and click Open. This w ill load the parameters (including the mapping
decisions) that have been saved for that specification. Continue to press Next to preview and move through
each subsequent import step.
Otherw ise,
7.
Set the appropriate Date Format, T ime Delimiter, Date Delimiter and the Dec imal Symbol formats.
8.
Use the scroll arrow s to set the First T itle Row and Number of T itle Rows.
w ill appear next to the
first and last Title Row lines in the data panel (if there is no Title Row , leave the Title Row at "0").
9.
Scroll dow n the data panel and identify w here the data starts. Position the cursor on the appropriate line number
in the data panel and left-click. This w ill set the position of the First Data Row and w ill appear next to that
line in the data panel. Any values above this row (apart from any set Title row s) w ill be ignored in the Import
process. Continue to scroll dow n the data panel and identify w here the data stops. Right click on the
appropriate line number in the data panel to set the position of the Last Data Row and w ill appear next to
that line in the data panel. Any values below this line w ill be ignored in the Import process.
10.
Click the Next button, The Import W izard Step 2 Dialogue box appears.
11.
The Step 2 Dialogue box is divided into upper and low er panels. In the upper panel you can view and filter your
existing data fields. In the low er panel you map those input fields to your DataSight database fields. This
combination of filtering and mapping functionality means that you can accurately define and import all (or a
subset) of input data values.
DataSight Users Manual Version 2.9.4
© 2013 Seveno Pty Ltd
Data
83
Filtering input values
Filtering is a quick and easy w ay to define, then import a subset of data. You can use filtering to import only the
row s that meet the criteria you specify for a particular column or columns.
Click
at the head of any data column to display a list of filter options. Standard options are All, Custom,
Blanks, and Non Blanks. The other options are any of the unique data values w ithin that column. (Note that the
Blanks and Non Blanks options are available only if the column you w ant to filter contains a blank cell).
Use
To return
All
all row s
Custom
all row s meeting the criteria you specify for that column
Blanks
only the row s containing blank data values in that column
Non-Blanks
only the row s containing non-blank data values in that
column
Unique data value
all the row s containing the specified data value in that
column
Custom filtering using specified criteria
Click
at the head of any data column and select Custom.
The custom filter dialogue box appears
Click the first arrow to display the drop dow n menu options for filtering either numeric and text values.
Select a filter condition then enter an appropriate value in the box on the right
If you need to find values that share some characters (w hether text or numeric) use the like or not like options
in conjunction w ith either " _ " or "%":
Use
To stand in for
_ (underscore)
any single character
e.g., " 8_ " w ill find "81", "82", "83", "8B" etc
e.g., "8_ _" w ill find "845", "87A" etc
e.g., "T_" w ill find "TP", "TN", "T3" etc
% (percent)
any number of character
e.g. "8%" w ill find "81", "82456", "8B" etc
e.g. "fish%" w ill find "fish", "fished" "fishing", "fishA1"
etc
To add another criteria, click AND or OR, and repeat the previous step.
12.
In the Step 2 Dialogue box low er panel you w ill map your input fields to your DataSight database fields.
DataSight Users Manual Version 2.9.4
© 2013 Seveno Pty Ltd
Data
84
13.
The left column lists your Input field names. Click in each adjacent line in the right column to access the dropdow n list and select an existing DataSight field to map each Input field to. Note that if appropriate the DataSight
field does not already exist, You can click the Variables button and add the variable. Then close the Define
Variable dialogue box to return to Import W izard Step 2 dialogue box. No unmapped fields w ill be imported.
14.
When you have mapped all the fields, click the Next button. The Import W izard Step 3 dialogue box appears.
15.
In Step 3 you w ill be preview ing the data you are importing.
16.
If you are happy w ith the data press Next, otherw ise press Bac k and make the necessary changes.
17.
The Wizard Step 4 dialogue box appears.
DataSight Users Manual Version 2.9.4
© 2013 Seveno Pty Ltd
Data
85
18.
Select the appropriate Lev el 1, Lev el 2 and Lev el 3 from the drop-dow n boxes. If you have not already set
these up you may type a name directly into the blank field. In this case, you w ill be asked to confirm that you
w ish to add the new Level 1, Level 2, Level 3. Click Yes.
19.
The fields marked Date, T ime and Inc rement are only used if you have data w hich does not already have
Date and Time values recorded (it is the Date and Time value that makes each data record unique). In this case,
you can use this section of the dialogue box to set default level 4 Date and Start Time values together w ith the
increment at w hich the time values w ill be added.
20.
If you w ish to add an Audit Trail, click the drop-dow n boxes for Equipment and Collector and make a selection.
Note that if security has required that you log on as the current user, it is your name that w ill appear as the
default Collector. Click Next.
21.
The Wizard Step 5 dialogue box. In Step 5 you can undertake simple conversions on the data during the import.
This feature can be used to add set offsets to data or convert data from raw to scientific units for example.
22.
Step 5 is activated by ticking the box above the Input Fields. The Input Fields column is populated.
23.
Type in the conversion for the given Input Field you w ish to modify in the appropriate Formula cell. This w ill
place the modified data into the variable field that w as mapped for that input field in Step 2. Leave blank if there
are no calculations.
24.
Alternatively add a New Input Field. The Add New Input Field dialogue box appears.
DataSight Users Manual Version 2.9.4
© 2013 Seveno Pty Ltd
Data
86
25.
Type in your new Input Field Name. Choose a variable to map the new data to from the drop dow n menu
for Mapped Variable. Note that a different variable from that of the raw data should be used if both the raw
data and modified data are to be imported. This variable must already exist w ithin the variable table prior to Step
5. If not, please return to Step 2 and create the new variable. Insert a default value if you w ish. Click Ok .
26.
Type in the conversion for the New Input Field in the corresponding Formula cell. Include the input field
name(s) already present in the table and use standard mathematical nomenclature.
27.
Step 6 offers the chance to select a Scientific Standard to check w hether imported data is w ithin the standard
limits or not. If you w ish to use a Standard, check the box and select a Standard from the list. Otherw ise click
Next.
28.
Click the Finish button.
If your import is successful, a confirmation information box w ill display. Alternatively an Import Error Log w ill
be displayed w ith appropriate error messages and options to Sav e, Print, Prev iew, Go Bac k , Continue
or Abort the Import.
When importing data, if the first line in the file is Data and not column header leave “First Title Line” as “0”.
This ensures that the Input Fields (as in the example above) are named as Field 1,2,3,4 etc. If numerical values
are in the Input Fields your calculation w ill be incorrect. The user can also use multiple fields to calculate a new
variable. For example, Flow * Total Dissolved Solids to give an instantaneous discharge of TDS.
In Step 4 the user selects the Level 3 that the data is to be imported too. The mapping of Level 3 allow s
DataSight to link and save the formulas used for that specific site. The Formula area is populated w ith the last
used formula for that specific site. This increases the speed of importing.
You can save your Import Spec to use again w ith the same type of file. Click the Save button and the Save
Spec dialogue box appears. Type in a description and click Ok.
DataSight Users Manual Version 2.9.4
© 2013 Seveno Pty Ltd
Data
DataSight Users Manual Version 2.9.4
87
© 2013 Seveno Pty Ltd
Data
10.1.3
88
Importing fixed width files
1.
First, look at the file that you w ish to import (the data source) and check that the data variables you w ish to
import already exist in the DataSight database. If not, you can choose to add them before you begin.
Alternatively you can add them in Step 2 of the Import process. Before starting the import process, close the
import file.
2.
Click
on the DataSight Toolbar. .
Or
Open the File Menu and Click Import.
The Open Dialogue box appears
3.
In the Look In drop-dow n menu, select the folder containing the data file that you w ish to import. In the Files
of type drop-dow n menu, click to select All Files (*.dat, *.prn) then click the file name and click Open.
4.
The Import W izard Step 1 Dialogue box appears.
DataSight Users Manual Version 2.9.4
© 2013 Seveno Pty Ltd
Data
89
5.
In Step 1 you w ill identify how the import data is formatted and define w here the data values start and stop.
6.
If you have already saved an Import Specification for this type of file and w ant to use it, click the Load button.
Click to select the appropriate specification and click Open. This w ill load the parameters (including the mapping
decisions) that have been saved for that specification. Continue to press Next to preview and move through
each subsequent import step.
Otherw ise,
7.
Click the Fixed W idth radio button. Set the appropriate Date Format, T ime Delimiter, Date Delimiter and
the Dec imal Symbol formats.
8.
Use the scroll arrow s to set the First T itle Row and Number of T itle Rows.
w ill appear next to the
first and last Title Row lines in the data panel (if there is no Title Row , leave the Title Row at "0").
9.
Scroll dow n the data panel and identify w here the data starts. Position the cursor on the appropriate line
number in the data panel and left-click. This w ill set the position of the First Data Row and w ill appear next
to that line in the data panel. Any values above this row (apart from any set Title row s) w ill be ignored in the
Import process. Continue to scroll dow n the data panel and identify w here the data stops. Right click on the
appropriate line number in the data panel to set the position of the Last Data Row and w ill appear next to
that line in the data panel. Any values below this line w ill be ignored in the Import process.
10.
Click the Next button, The Import W izard Step 2 Dialogue box appears.
11.
The Step 2 Dialogue box is divided into upper and low er panels. In the upper panel you can view and filter your
existing data fields. In the low er panel you map those input fields to your DataSight database fields. This
combination of filtering and mapping functionality means that you can accurately define and import all (or a
DataSight Users Manual Version 2.9.4
© 2013 Seveno Pty Ltd
Data
90
subset) of input data values.
Filtering input values
Filtering is a quick and easy w ay to define and then import a subset of data. You can use filtering to import only
the row s that meet the criteria you specify for a particular column or columns.
Click
at the head of any data column to display a list of filter options. Standard options are All, Custom,
Blanks, and Non Blanks. The other options are any of the unique data values w ithin that column. (Note that the
Blanks and Non Blanks options are available only if the column you w ant to filter contains a blank cell).
Use
To return
All
all row s
Custom
all row s meeting the criteria you specify for that column
Blanks
only the row s containing blank data values in that column
Non-Blanks
only the row s containing non-blank data values in that
column
Unique data value
all the row s containing the specified data value in that
column
Custom filtering using specified criteria
Click
at the head of any data column and select Custom.
The custom filter dialogue box appears
Click the first arrow to display the drop dow n menu options for filtering either numeric and text values.
Select a filter condition then enter an appropriate value in the box on the right
If you need to find values that share some characters (w hether text or numeric) use the like or not like options
in conjunction w ith either " _ " or "%":
Use
To stand in for
_ (underscore)
any single character
eg, " 8_ " w ill find "81", "82", "83", "8B" etc
eg, "8_ _" w ill find "845", "87A" etc
eg, "T_" w ill find "TP", "TN", "T3" etc
% (percent)
any number of character
eg "8%" w ill find "81", "82456", "8B" etc
eg "fish%" w ill find "fish", "fished" "fishing", "fishA1" etc
To add another criteria, click AND or OR, and repeat the previous step.
12.
In the Step 2 Dialogue box low er panel DataSight w ill attempt to recognize the fixed w idth parameters of your
input file but you w ill need to review and adjust these. Click in a row of the Start column and type the start
position of the first character relating to that Input Field of data. Click in the corresponding W idth column and
type the number of characters that comprise the w idth of that Input Field.
DataSight Users Manual Version 2.9.4
© 2013 Seveno Pty Ltd
Data
91
13.
The left column lists your Input field names. Click in each adjacent line in the right column to access the dropdow n list and select an existing DataSight field to map each Input field to. Note that if the appropriate DataSight
field does not already exist, you can click the Variables button and add the variable. Then close the Define
Variable dialogue box to return to Import W izard Step 2 dialogue box. No unmapped fields w ill be imported.
14.
When you have mapped all the fields, click the Next button. The Import W izard Step 3 dialogue box appears.
15.
In Step 3 you w ill be preview ing the data you are importing.
16.
If you are happy w ith the data press Next, otherw ise press Bac k and make the necessary changes.
17.
The Wizard Step 4 dialogue box appears.
DataSight Users Manual Version 2.9.4
© 2013 Seveno Pty Ltd
Data
92
18.
Select the appropriate Lev el 1, Lev el 2 and Lev el 3 from the drop-dow n boxes. If you have not already set
these up you may type a name directly into the blank field. In this case, you w ill be asked to confirm that you
w ish to add the new Level 1, Level 2, Level 3. Click Yes.
19.
The fields marked Date, T ime and Inc rement are only used if you have data w hich does not already have
Date and Time values recorded (it is the Date and Time value that makes each data record unique). In this case,
you can use this section of the dialogue box to set default level 4 Date and Start Time values together w ith the
increment at w hich the time values w ill be added.
20.
If you w ish to add an Audit Trail, click the drop-dow n boxes for Equipment and Collector and make a selection.
Note that if security has required that you log on as the current user, it is your name that w ill appear as the
default Collector. Click Next.
21.
The Wizard Step 5 dialogue box. In Step 5 you can undertake simple conversions on the data during the import.
This feature can be used to add set offsets to data or convert data from raw to scientific units for example.
22.
Step 5 is activated by ticking the box above the Input Fields. The Input Fields column is populated.
23.
Type in the conversion for the given Input Field you w ish to modify in the appropriate Formula cell. This w ill
place the modified data into the variable field that w as mapped for that input field in Step 2. Leave blank if there
are no calculations.
24.
Alternatively add a New Input Field. The Add New Input Field dialogue box appears.
DataSight Users Manual Version 2.9.4
© 2013 Seveno Pty Ltd
Data
93
25.
Type in your new Input Field Name. Choose a variable to map the new data to from the drop dow n menu
for Mapped Variable. Note that a different variable from that of the raw data should be used if both the raw
data and modified data are to be imported. This variable must already exist w ithin the variable table prior to Step
5. If not, please return to Step 2 and create the new variable. Insert a default value if you w ish. Click Ok .
26.
Type in the conversion for the New Input Field in the corresponding Formula cell. Include the input field
name(s) already present in the table and use standard mathematical nomenclature.
27.
Step 6 offers the chance to select a Scientific Standard to check w hether imported data is w ithin the standard
limits or not. If you w ish to use a Standard, check the box and select a Standard from the list. Otherw ise click
Next.
28.
Click the Finish button.
If your import is successful, a confirmation information box w ill display. Alternatively an Import Error Log w ill
be displayed w ith appropriate error messages and options to Sav e, Print, Prev iew, Go Bac k , Continue
or Abort the Import.
When importing data, if the first line in the file is Data and not column header leave “First Title Line” as “0”.
This ensures that the Input Fields (as in the example above) are named as Field 1,2,3,4 etc. If numerical values
are in the Input Fields your calculation w ill be incorrect. The user can also use multiple fields to calculate a new
variable. For example, Flow * Total Dissolved Solids to give an instantaneous discharge of TDS.
In Step 4 the user selects the Level 3 that the data is to be imported too. The mapping of Level 3 allow s
DataSight to link and save the formulas used for that specific site. The Formula area is populated w ith the last
used formula for that specific site. This increases the speed of importing.
You can save your Import Spec to use again w ith the same type of file. Click the Save button and the Save
Spec dialogue box appears. Type in a description and click Ok.
DataSight Users Manual Version 2.9.4
© 2013 Seveno Pty Ltd
Data
10.1.4
94
Receiving a .dsd file
If another user has sent you a .dsd file
1.
Right-click on the .dsd file and select Sav e As.
2.
Navigate to the location w here you w ish to save the file and click the Sav e button.
Then, you can either:
Merge the data into your currently open DataSight database.
or
Create a new database from the dsd file.
DataSight .dsd files are only compatible w ith DataSight Desktop and NOT DataSight Enterprise.
DataSight Users Manual Version 2.9.4
© 2013 Seveno Pty Ltd
Data
10.2
95
Manual Data Entry (MDE)
As w ell as importing data you can also manually enter data against an existing Level 3. Manual Data Entry (MDE) can
replicate your field datasheets so data can be keyed in quickly.
To add data
1.
Click
2.
Click on the drop dow n Site menu and choose a Level 3.
3.
Enter the Monitoring Date and Monitoring Time.
4.
Alternatively, you can Create 'Level 4' data if not already created or Update the 'Level 4' inform ation if
it has already been created, by ticking the appropriate check boxes.
5.
Choose the Nam e (Observer) and Equipm ent used for the Audit trail.
6.
If you w ish, you can save your MDE electronic form under Templates. Click on the
forms.
7.
Click on
on the DataSight toolbar and the Manual Data Entry form appears.
DataSight Users Manual Version 2.9.4
to also select saved
to open the Variables Selec tion form.
© 2013 Seveno Pty Ltd
Data
96
8.
Select the Variables from the Variable List that w ill appear on the form using the arrow ed selection buttons.
9.
Define the order of the variables on the form using the Up and Dow n arrow s to the Right of the Selec ted
Variables List.
10.
Click Close and return to the Manual Data Entry Form.
11.
Enter data for each variable in the boxes show n. Click Sav e.
12.
When you have finished entering data click Close.
DataSight Users Manual Version 2.9.4
© 2013 Seveno Pty Ltd
Data
10.3
97
Merging a database
Merging is available in DataSight Desktop only.
You can also receive a DataSight Desk top database from another source and merge the data into your ow n
database.
1.
Click File, Database, Merge.
The Merge W izard dialogue box appears.
2.
Click
and navigate to the folder location containing the DataSight database files you w ish to merge.
3.
If you have a .dsd file, select it from the Selec t DSD File drop-dow n box. Otherw ise leave the Selec t DSD
File blank. Click Next.
4.
Use the checkboxes to select the Level 1, Level 2, Level 3 and Level 4 you w ish to merge and click Next.
DataSight Users Manual Version 2.9.4
© 2013 Seveno Pty Ltd
Data
5.
98
The Merge W izard Select Variables dialogue box appears.
Select Variables
1.
On the left are listed the available variables for merging, and on the right are listed your existing DataSight
variables.
2.
If there are variables in the left panel that do not match existing DataSight variables on the right you can add
them by Clicking the Variables button w hich w ill open the Variables dialogue box.
3.
Link the variables to be merged by clicking on a variable on the left and dragging it across to the same variable
on the right. Drop it w hen appears on the cursor. Note that Date and Time (w hich are required database
variables) w ill be automatically merged as part of the process and w ill not appear in either panel.
4.
Click Finish.
DataSight Users Manual Version 2.9.4
© 2013 Seveno Pty Ltd
Data
99
When you merge a database, the merge data w ill be added to the existing data, unless it has the same Level 1,
Level 2, Level 3 and Level 4 and Time and Variable name. Then, it w ill overwrite the existing data.
This feature is not available w ithin DataSight Enterprise Edition. See DataSight Administrator (Enterprise).
10.4
Exporting data
10.4.1
Exporting data from a datasheet
You can export data from a DataSight Datasheet into Text, Excel or HTML formats.
1.
10.4.2
In the Data List tab, click
or Level 4 level.
on My Data expand your list of Level 1 . You can view data at the Level 2, Level 3
2.
Click to select the Level 2, Level 3 or Level 4 then click the DataSheet tab.
3.
Right-click w ithin the datasheet and select Export.
4.
From the export list, select your format (txt, xls, html, xml) and the Sav e as dialogue box appears.
5.
Navigate to a chosen folder, name your file and click Sav e.
Exporting a Desktop database
You are able to export data in DataSight Desktop database format, and as an MS Access database file (restricted to
version 2000 and later). Before commencing the export process w e recommend that you use the Repair and Com pact
functions to repair any errors and to compact the database.
1.
Click File, Database, Export to start the Export W izard.
2.
The Export W izard Select Data Location dialogue box appears. Use the upper panel to export a DataSight
database and the low er panel to export an MS Access database.
DataSight Users Manual Version 2.9.4
© 2013 Seveno Pty Ltd
Data
100
3.
In the upper panel Sav e T o Loc ation field click
and navigate to the folder in w hich you w ant to save the
DataSight database. The name of the default folder w here the database w ill be saved is Export Data. You
cannot save more than one database to a folder. If you attempt to do this, you w ill be given the option of
overw riting the existing database. You can change the name of the folder by highlighting and typing over a new
name. If the folder does not already exist then one w ill be automatically created.
4.
If you w ant to email the database, then name your data and check the Send Data by Email checkbox.
5.
If you also w ant to export the database in MS Access format (version 2000 or later), then check the Sav e as
MS Ac c ess checkbox in then low er panel. Then, in the low er panel Sav e T o Loc ation field click
. The
Sav e As dialogue box appears. Navigate to the folder in w hich you w ant to save the MS Access database.
Click in the File Name field and name the file. Click Sav e.
6.
Click Next. The Export W izard Select Row s dialogue box appears.
7.
Select the data you w ant to transfer by checking the appropriate checkboxes and click Next.
8.
Select any or all variables (you must include Date and Time) and click Finish.
DataSight Users Manual Version 2.9.4
© 2013 Seveno Pty Ltd
Data
9.
The T ransfer Progress dialogue box appears.
10.
If you had earlier checked the Send Data by Email checkbox, then an email w indow w ill open w ith a
DataSight database as an attachment.
101
Enter the email address of the recipient in the T o field and click Send.
10.5
Move To / Copy To
The Move To and Copy To functions, accessible w ithin the Datasheet, allow the user to move or copy data across levels
w ithin a DataSight database.
Within the datasheet the user can select
individual records
multiple, individual records (using the Ctrl key and selecting individual records)
a group of records (selecting the first record, then press Shift and select the final record)
The Move To and Copy To functions are then available by right-clicking on the selected data w ithin the datasheet.
DataSight Users Manual Version 2.9.4
© 2013 Seveno Pty Ltd
Data
10.5.1
102
Move To
Selecting the Move To function w ill "cut and paste" the selected data from the current level in the database to a selected
destination elsew here in the database.
The first w indow displayed w hen Move To is selected provides the option to either move all values for the selected record
or only non-null values, ignoring those variables w hich contain null data.
The checkbox at the bottom of the option w indow also allow s the user to select to move only data that is currently being
displayed in the datasheet.
When the user selects Next DataSight w ill request a destination location (Level 3) for the data that has been selected.
DataSight Users Manual Version 2.9.4
© 2013 Seveno Pty Ltd
Data
103
Select the destination location and click Finish to move the data.
10.5.2
Copy To
Selecting the Copy To function w ill copy the selected data from the current level in the database to a selected destination
elsew here in the database.
The first w indow displayed w hen Copy To is selected provides the option to either move all values for the selected record
or only non-null values, ignoring those variables w hich contain null data.
The checkbox at the bottom of the option w indow also allow s the user to select to copy only data that is currently being
displayed in the datasheet. This allow s the user to only copy data from selected variables to another location in the
database.
When the user selects Next DataSight w ill request a destination location (Level 3) for the data that has been selected.
DataSight Users Manual Version 2.9.4
© 2013 Seveno Pty Ltd
Data
104
Select the destination location and click Finish to copy the data.
DataSight Users Manual Version 2.9.4
© 2013 Seveno Pty Ltd
View ing/Editing Data
11
105
Viewing/Editing Data
You view data in tabular form in the Datasheet.
To view data in a Datasheet
next to My Data to expand your list of Level 2 . You can view data at the Level
1.
Select the Data List tab. Click
3, or Level 4 level.
2.
Click to select the Level 2, Level 3 or Level 4 then select the DataSheet tab if this is not already selected .
3.
The default Column headings in the DataSheet correspond to the data variables already set up in the DataSight
database. If the Field list panel is not already displayed, click the
button on the DataSight toolbar.
11.1
Editing data in the Datasheet
Data may be changed directly in the datasheet.
To edit data in the datasheet
1.
Click
2.
Click in the appropriate data field and make changes.
in the DataSight toolbar.
3.
Click off the row to save the changes.
The datasheet remains in edit mode until the
button is toggled off.
To delete data in the datasheet
1.
Click anyw here in the data row .
2.
Right click and select Delete Rec ord.
3.
You can delete multiple records by using CTRL in conjunction w ith clicking. To select a range, use SHIFT in
conjunction w ith clicking.
With the development of DataSight Plug In Modules capable of complex data manipulation, it is prudent to add additional
temporary calculation variables e.g. Calc 1, Calc 2, Calc 3. The preliminary results of calculations can be placed into
these columns. When finished w ith these temporary results, you are able to use the Clear Column option to remove
the data.
To clear a colum n of data
1.
Click anyw here in your chosen column.
2.
Right click and select Clear Column.
DataSight Users Manual Version 2.9.4
© 2013 Seveno Pty Ltd
View ing/Editing Data
11.2
106
Manual Data Entry (MDE)
To edit data using the Manual Data Entry form
1.
Highlight the selected Level 4 data point on the Datasheet. Right click on the Datasheet and select Edit Rec ord
with MDE.
2.
The Manual Data Entry Form is opened and is populated w ith the variables that are displayed w ithin the
Datasheet.
DataSight Users Manual Version 2.9.4
© 2013 Seveno Pty Ltd
View ing/Editing Data
107
3.
The user can change the Site and move the data to another monitoring site or just modify the variable values as
required. Click Sav e.
4.
The user also can create Manual Data Entry Templates. To select variables you w ant to show on the Entry Form
click 'Variables'
5.
button.
Left panel show all the variables available to show on the form. Right panel show already selected variables.
Add selected variables to the form.
Removes selected variable from the form.
DataSight Users Manual Version 2.9.4
© 2013 Seveno Pty Ltd
View ing/Editing Data
108
Add all the variables to the form
Removes all the selected variables
Changes order of the variable on the form.
6.
After you selected variables and organized the order of the variables you can click
finalize the selection.
button to
As you can see on the image above some of the variables are faded and some of them have check boxes w ith
them.
Numeric variables are show n faded in the list. Only text variables have check boxes. If the user clicks the
variable, Datasight w ill populate all the previous unique entries for that variable to provide data entry consistency.
11.3
7.
To save the entry form as a template. Click the Template button. Select 'Save'
8.
Close the Manual Data Entry form to update the Datasheet.
Datasheet display options
Display w idth
With the cursor anyw here in the datasheet, right click and select Column Settings
Check/uncheck Fit Columns to W idth to toggle the automatic fitting of the Datasheet
columns to the available w idth of the Datasheet panel.
Check or uncheck the Best Fit to adjust the w idth of each column to accommodate the
maximum w idth of the data in that column
Heading order
Left-click a Column header then drag and drop it to its new position.
Remove columns
Click on the Column header and drag and drop it from the datasheet panel. That variable in the
field list w ill be unchecked.
Add columns
If any variable in the Field list is unchecked, it indicates that the field does not currently appear in
the displayed Datasheet. You can then drag and drop any of these variables from the Field list to
anyw here in the Datasheet (or check the box) to add that column to the Datasheet.
DataSight Users Manual Version 2.9.4
© 2013 Seveno Pty Ltd
View ing/Editing Data
109
Restore columns
To restore all variables in the Field list panel to the Datasheet, right click and select Column
Settings then Restore Column Defaults.
Summary Panel
With the cursor anyw here in the datasheet, right click and toggle on or off Summary Panel to
see the Summary Statistics.
Navigator Panel
With the cursor anyw here in the datasheet, right click and toggle on or off Nav igator Panel.
Scroll backw ards or forw ards through the data, jump to the start or end of the datasheet, or lock
on to a row of data in the datasheet and navigate back to this point at any time.
Stop Lighting
With the cursor anyw here in the datasheet, right click and toggle on or off Stop Lighting.
When you save a Datasheet the column configurations are also saved.
The Datasheet Add/Remove column display should be changed at the Level 2 level and this setting w ill be applied
dow n to the Level 3 and Level 4 level. Column heading order may be changed at any individual level.
DataSight Users Manual Version 2.9.4
© 2013 Seveno Pty Ltd
View ing/Editing Data
11.4
110
Summary statistics
Use DataSight's QA/QC feature to calculate and display the follow ing statistical characteristics of a datasheet:
Available statistics are:
Average value
Count
Minimum value
Maximum value
Standard Deviation
Sum
Display statistical values on a datasheet
1.
Right click anyw here in the Datasheet and check the Summary Panel option.
2.
Right click on the Summary Panel at the bottom of the Datasheet panel and choose a statistical property.
3.
The values are displayed at the bottom of each relevant column of the Datasheet .
Note that Null values are ignored by default in the statistical summary but you can change this by selecting Options,
then unselecting Ignore Nulls. Null values w ill then be treated as zero.
You also have the option of using only selected values for the statistical summary.
1.
Use SHIFT+CLICK to select a range of values or CTRL+CLICK to select individual values on the datasheet.
2.
Right click on the Summary Panel and select Options, Only Selec ted.
DataSight Users Manual Version 2.9.4
© 2013 Seveno Pty Ltd
View ing/Editing Data
11.5
111
Filtering data
1.
Click
on the DataSight toolbar (if it is not already active) to display the current filter conditions. If
you had already selected a particular station using the Data tab for example you w ould see filters relevant to
the Level 1, Level 2 and Level 3 that you had selected.
2.
You can impose more Filters to isolate a subset of data that you are interested in.
Filters comprise tw o options: Condition options and Bracket Options.
Condition Options
Conditions have 3 parts.
1st part is the Field - selected from a list of possible options
2nd part is the Descriptor - a description of the relationship betw een the Field and the Value
3rd part is a Value
For example, in the statement x is less than 3:
x is the Field
is less than is the Descriptor
3 is the Value
To im pose conditions:
1.
Click in the line marked <Click here to add new condition>.
2.
Click the 1st part and select a field.
3.
Click the 2nd part and select a Descriptor.
4.
Click the 3rd part and select or type a value.
Repeat this process to add more conditions.
List of possible conditions.
Conditional Filtering using Relative Date/Tim e values
DataSight Users Manual Version 2.9.4
© 2013 Seveno Pty Ltd
View ing/Editing Data
112
You have the option of filtering using Relative Date/Time values e.g. you could look at Temperature values for the last 3
months
Relative Time options are available by selecting
Date: to w hich you can then apply any of these Descriptors:
last (n) year(s)
last (n) month(s)
last (n) w eek(s)
last (n) day(s)
last calendar year
last calendar month
last calendar day
and/or
Time: to w hich you can then apply any of these Descriptors:
last (n) hour(s)
last (n) minute(s)
last(n) second(s)
Relative Time values are alw ays relative to the current time, day, month and year on w hich you create or open a
saved graph.
Bracket Options
Bracket options are relevant w here you w ant to impose more than 1 condition
Option
Meaning
all
returns data w here all the conditions are true.
any
returns data w here any of the conditions are true.
none
returns data w here none of the conditions are true.
not all
returns data w hen not all of the conditions are true.
To im pose a bracket:
1.
Click on the blue highlighted option on the bracket line and choose from the drop-dow n list.
2.
The Datasheet/Graph w ill update automatically.
If you have selected the Graph tab you can choose to Filter data or all plotted data series by clicking either the
Single Series or All Series radio button. If you click Single series, then select your series name from the
Series drop menu.
DataSight Users Manual Version 2.9.4
© 2013 Seveno Pty Ltd
View ing/Editing Data
11.6
113
Setting dates
There are tw o w ays to set dates:
By Overtyping
1.
Click the day to highlight and overtype new day.
2.
Click the month to highlight and overtype new month.
3.
Click the year to highlight and overtype new year.
Or by using the Calendar Tool
1.
11.7
Click on the dow n arrow to display the calendar w ith today's date highlighted.
2.
Click on the year displayed in the blue panel header on the calendar then click to select a new year from the
display.
3.
Then, click on the backw ard or forw ard arrow s in the blue panel header to navigate back or forw ard through
the months or,
4.
Click on the month displayed in the blue panel and click to select the new month.
5.
Click on the new day w ithin the calendar page.
6.
Click anyw here off the calendar page to set.
Saving a Datasheet
To save the current Datasheet
and the Sav e As dialogue box appears.
1.
Click
2.
Name your datasheet and click Sav e. The Datasheet, together w ith its filters and column configuration w ill be
saved.
DataSight Users Manual Version 2.9.4
© 2013 Seveno Pty Ltd
View ing/Editing Data
114
A Datasheet Properties file is created w ith any saved Datasheet and records the user w ho created the Datasheet and
its creation date. If the saved Datasheet is subsequently modified, the Datasheet Properties w ill be updated to show the
relevant user and date it w as last modified. The Datasheet Properties w ill also show any tasks that are scheduled to
run, using that datasheet.
To view the Datasheet Properties
1.
Right click on the name of the saved datasheet and select Properties.
DataSight Users Manual Version 2.9.4
© 2013 Seveno Pty Ltd
Graphs
12
Graphs
12.1
Create/View Graphs
115
To create and view graphs of your data
on My Data to expand your list of Level 1. You can create graphs at
1.
With the Data List tab selected, click
the Level 2, Level 3 or Level 4 level.
2.
Click to select the Level 2, Level 3 or Level 4 then select the New Graph Tab if this is not already active.
3.
If you do not already see a blank graph template, click
4.
Click
on the DataSight Toolbar to toggle the Fields List view , if
this is not already displayed. A list of the data fields (variables) w ill then be displayed in the Field List panel.
5.
Click to select an independent variable and drag and drop it close to the outside of either the x or y axis. As it
moves, the cursor w ill change to
.
indicating a drop on the x axis or
indicating a drop on the y axis.
6.
Since you can only ever have one independent variable axis active at a time on the same graph, repeating the
process w ith a different variable or to a different axis w ill overw rite your original independent variable
selection.
7.
As soon as your independent variable has been dropped, a grid displays dividing the graph into four area
panels.
8.
Click to select your first dependent variable (series) and drag it onto the graph. If your independent axis is x the
cursor w ill change to
or
indicating that you are about to plot the dependent data series on left or right
y axis. Alternatively, if your independent axis is y the cursor w ill change to
or
indicating that you
are about to plot the dependent data series on the upper or low er x axis. You can continue to plot any number
of dependent variables by dragging and dropping.
9.
The default Graph Type is Line but you can change this by right-clicking on the open Graph and selecting
Adv anc ed Options to display the Advanced Options panel. You can also control a w hole range of Graph
formatting options by right-clicking on the Graph and selecting Properties.
If dependent variables differ markedly in their scale you should use tw o different dependent variable axes to cater
for this (either the 2 x axes (Top and Bottom) or the 2 y axes (Left and Right).
If you are plotting Date as a series value, you w ill need to format it by right-clicking on the Graph and selecting
Properties. Then, select the Series tab and use the drop-dow n menu to select the Date series. Select the
General tab. Select the appropriate axis and check the Date T ime checkbox.
12.2
Zooming
To Zoom
1.
Click
2.
Hold dow n left mouse button and drag mouse tow ards dow n/right. You w ill see a rectangle around the selected
zoom area.
on the Graph toolbar.
3.
Release the left mouse button.
4.
Repeat the action to continue zooming.
To restore view
Hold dow n left mouse button and drag the rectangle in the opposite direction (up/left). This w ill restore the original graph
view .
DataSight Users Manual Version 2.9.4
© 2013 Seveno Pty Ltd
Graphs
116
Change the appearance of your graph using other graph toolbar buttons.
12.3
Renaming and deleting Graph Series
To renam e a series
1.
Right-click on any series on the legend and select Rename.
2.
Overtype the new name and click Ok .
To delete a series
12.4
1.
Right-click on any series on the legend and select Delete.
2.
A Confirm dialogue box appears. Click Yes.
Saving a Graph
Saving a graph
Once you have created your graph you can save its structure and format to use again.
and the Sav e As dialogue box appears.
1.
Click
2.
Name your graph and click Sav e.
3.
A Saved Graph Properties file is created w ith any saved graph, recording the creator and the creation date. If
the saved graph is subsequently modified, the Saved Graph Properties w ill be updated to show the relevant
user and date it w as last modified. The Graph Properties w ill also show any tasks that are scheduled to run,
using that graph.
4.
To view the Saved Graph Properties, right click on the name of the saved graph and select Properties.
Deleting a graph
1.
Right-click on the saved graph.
2.
Select Delete.
If you attempt to delete a graph w ith a task assigned you w ill get a w arning and a request for confirmation. Deleting
the graph w ill delete the task assigned to it.
To use a saved Graph
1.
With the Data List tab selected, click
DataSight Users Manual Version 2.9.4
on My Data to expand your list of Level 2. You can create graphs at
© 2013 Seveno Pty Ltd
Graphs
117
the Level 2, Level 3 or Level 4 level.
12.5
2.
Double click to select a saved graph in Sav ed Views and the Selec t Filters dialogue box w ill appear.
4.
If you select Use filters that were saved with this graph option, the graph w ill open w ith the filters that w ere
saved w ith the original saved graph.
5.
If you have already pre-selected a Level 2 and/or Level 3 and or Level 4 and/or added other conditions then you
can select the Use filters that have just been selected option.
6.
Click Ok .
Copying Graphs
You can copy a graph and paste it as a Window s MetaFile to another application.
1.
With your cursor anyw here on the Graph, right-click and select Copy to Clipboard.
2.
Navigate to your open application right-click and select Paste.
You can also save your graph as a .jpg.
12.6
1.
With your cursor anyw here on the Graph, right-click and select Sav e As JPG.
2.
The Save As dialogue w indow opens. In the Sav e In drop-dow n menu, select the folder that you w ish to
save to. Type in a File name and click Sav e.
Setting and Changing Graph Properties
DataSight comes w ith its ow n Graph Properties editor so that you can control the look of any graph display.
1.
Click
on the Graph toolbar or right-click anyw here on the Graph.
2.
The Properties dialogue box appears.
3.
Select the appropriate tab and make the changes.
DataSight Users Manual Version 2.9.4
© 2013 Seveno Pty Ltd
Graphs
118
From within this window the user can access the options to change the graph style, edit the each of
the axis, create graph titles, alter the legend and perform many other functions. It is simply a matter of
selecting the appropriate tab.
For example, to change the format of date labels on the x-axis:
1. Select the Axis tab.
2. Select the Labels tab.
3. Select the Format tab.
4. Select Bottom Axis from the Axes list on the left, and select (or type in) the required format.
DataSight Users Manual Version 2.9.4
© 2013 Seveno Pty Ltd
Graphs
12.7
119
Using Advanced Options
Within the Graph panel you can use Adv anc ed Options to apply commonly-used series Display Type and Series Label
formats.
Graph Type and Series labels
1.
With the cursor anyw here on the graph, right-click and select Adv anc ed Options.
2.
The Adv anc ed Options panel w ill open to the right of the Graph.
DataSight Users Manual Version 2.9.4
© 2013 Seveno Pty Ltd
Graphs
120
3.
Checking All Series checkbox w ill apply the selected options to all plotted series. To apply an option to an
individual series, uncheck the All Series checkbox and click to select any series on the graph legend.
4.
Make your selection by using the drop-dow n menus on the T ype and Labels fields.
5.
Manipulate data for any graph series by highlighting the series in the legend of the graph and then selecting a
function from the drop dow n menu. An entire new series is draw n onto the graph. Functions available are Min,
Max, Average, Standard Deviation, Trend Line, Total and Cumulative
DataSight Users Manual Version 2.9.4
© 2013 Seveno Pty Ltd
Graphs
12.8
121
Advanced Graphs
The following pages contain some examples of creating more advanced graphs using the features
detailed in the previous section.
12.8.1
Graphing Multiple Variables
Graphing multiple variables allows users to display large amounts of information within one image.
The following example, using weather station variables, details the procedure for creating this type of
chart.
This worked example uses a database with the following Data List Levels
and these Field List Variables
1. While viewing the New Graph window within DataSight you can drag and drop variables in the
Graphing window.
DataSight Users Manual Version 2.9.4
© 2013 Seveno Pty Ltd
Graphs
122
2. Click and hold the DateTime variable and drag it across to the graph, dropping it on the x-axis when
the cursor looks like this
3. Now you can add dependent variables on the y-axis, dragging them from the Variables list and
dropping when the cursor looks like this
For this example four variables are added to the left-hand axis:
Radiation and Temperature.
Rainfall, Relative Humidity, Solar
By default these variables are all added as line graphs, and the chart may look crowded.
So, the aim now is to clearly display these variables clearly and distinctly within the one chart.
DataSight Users Manual Version 2.9.4
© 2013 Seveno Pty Ltd
Graphs
123
Advanced Options
Right-click anywhere within the graphing window and select Advanced Options.
This will display the Advanced Options to the right of the graphing window.
Advanced Options allows you to edit the Type of graph for each variable, the type of Labels visible,
turn data Points on/off, and add Functions, such as trend-lines and cumulative data.
For this example, we will display Rainfall as a Bar graph, Solar Radiation as an Area graph, and
Relative Humidity and Temperature as Line graphs.
- With the Advanced Options window open, ensure the All Series box is unchecked, left click on the
variable you wish to edit in the graphing window. This will select it and display a dotted line around the
label.
- Left-click on the drop down menu next to Type and select Bar.
- This will display the data for the variable selected ('10 RF Hrly Tot') in Bar chart format.
- Left-click another variable within the graphing window and alter it to be displayed as an Area graph.
For this example, 'Sol Rad Hrly Avg'.
DataSight Users Manual Version 2.9.4
© 2013 Seveno Pty Ltd
Graphs
124
- Close the Advanced Options toolbar
Graph Properties
Click the Graph Properties button
on the toolbar. Alternatively, right-click anywhere within the
graphing window and select Properties. This will open the Graph Editing window:
The first thing you can alter within this window is the graph colours so they are all easily visible when
they are displayed within the one chart.
- Select the Series tab.
- Select the variable to be displayed as a Bar chart (eg. '10 RF Hrly Tot').
- under the Format tab you can alter the Style, Colour, Bar Width, etc.
- Click the Border button and untick the Visible checkbox, click OK.
DataSight Users Manual Version 2.9.4
© 2013 Seveno Pty Ltd
Graphs
125
- From the drop-down arrow under Series select the variable to be displayed as an Area graph ('Sol Rad
Hrly Avg').
- under the Format tab click the Border button and untick the Visible checkbox, click OK.
- Click the Area Lines button and untick the Visible checkbox, click OK
- Following these steps has simply removed the borders from around these two variables.
- Another option is to click the Color button and you can change the colour the variable will be
displayed in.
DataSight Users Manual Version 2.9.4
© 2013 Seveno Pty Ltd
Graphs
126
In order to distribute the variables along the y-axis you must create several custom axes to display
them on.
- In the Graph Properties window, select the Chart tab.
- now, select the Axis tab. This diaplsy all the options available to you for editing the chart axes.
To add a Custom axis, click the + button below the axes list. To display four variables on the y-axis, as
is re
quired here, click this button three times.
You now have a Left Axis and Custom 0, Custom 1 and Custom 2 to display these variables.
DataSight Users Manual Version 2.9.4
© 2013 Seveno Pty Ltd
Graphs
127
To distribute these axes evenly up the left-hand y-axis:
- Within the Editing window, Select Left Axis within the Axis tab and click on the Position tab.
- leave the Start % on 0, change the End % to 25.
- select the Custom 0 axis from the list to the left. Change the Start % Position to 25 and the End %
50.
- Custom 1: Start % 50, End % 75.
- Custom 2: Start % 75, End % 100.
DataSight Users Manual Version 2.9.4
© 2013 Seveno Pty Ltd
Graphs
128
Now, we must distribute the variables across the axes we have created.
- Select the top Series tab (between the Chart and Data tabs) and select the General tab below this.
- Assign a vertical axis to each of the variables:
- Select each variable from the drop-down menu and alter the Vertical Axis it is displayed on.
- Each variable should have a different Vertical Axis.
- When you have finished assigning axis to the variables, click Close.
DataSight Users Manual Version 2.9.4
© 2013 Seveno Pty Ltd
Graphs
DataSight Users Manual Version 2.9.4
129
© 2013 Seveno Pty Ltd
Graphs
130
Final presentation of the graph requires editing other attributes such as Legend, Title, Axis labels and
inserting separation lines to clearly identify variables.
Legend
- Open the Graph Properties window
- Select the Chart tab - select the Legend tab - select the Position tab.
- Change the position of the Legend to Bottom.
- From here, you can also edit other Legend properties such as the Text style and Framing and
Shadow effects.
Title
- Select the Titles tab and enter a Title / SubTitle / Footer.
Axis
- Select the Axis tab, select the Title tab and untick the Visible checkbox.
DataSight Users Manual Version 2.9.4
© 2013 Seveno Pty Ltd
Graphs
131
Separation Lines / Using Tools
- Select the Tools tab from the top of the Graph Properties editing window and click the Add button.
- Select Color Line, and click Add.
- Add 3 colour lines.
- You can now assign these lines to Axis, and check the Allow Drag box to set their position on the
axis.
DataSight Users Manual Version 2.9.4
© 2013 Seveno Pty Ltd
Graphs
132
- Click Close.
You have now created a high quality, presentable chart using several variables from your dataset. You
can now print the graph, or it can be copied to the clipboard or saved as a JPG file and placed into a
report or other document. To do this right-click anywhere on the graph and select from the list of
options.
12.8.2
Wind Rose
Creating a wind rose from weather station data is a great way to get a succinct view of how wind speed
and direction are typically distributed at a particular location.
When graphing a wind rose in DataSight the wind rose is presented in a circular format. It shows the
DataSight Users Manual Version 2.9.4
© 2013 Seveno Pty Ltd
Graphs
133
velocity of winds blowing from particular directions. The distribution of each point or line around the
circle is related to the velocity that the wind blows from a particular direction.
It is also possible to create a Wind Direction Report in DataSight. This report displays a wind rose
showing the frequency of winds blowing from particular directions. The length of each "spoke" around
the circle is related to the frequency of time that the wind blows from a particular direction. See
Reports for further details.
1. Within the DataSight graphing area, drag and drop the Wind Direction variable on to the x-axis
(horizontal axis).
2. Drag Wind Velocity on to the y-axis (vertical axis).
DataSight will plot this data as a line graph as default.
3. Right-click on Wind Velocity in the the legend and select Advanced Options.
4. Within the Advanced Options area that opens select Windrose from the Type drop-down box.
DataSight Users Manual Version 2.9.4
© 2013 Seveno Pty Ltd
Graphs
134
The graph will change to a wind rose.
5. Opening Graph Properties (right-click on the graph) allows the user to make the graph circled:
DataSight Users Manual Version 2.9.4
© 2013 Seveno Pty Ltd
Graphs
135
- Select the Series tab
- Select the Circled tab
- Tick the Circled checkbox
6. The user can also change the layout of the wind rose from within the Editing window shown above.
- Turn points on / off by selecting the Visible checkbox in the Series > Point tab.
- Turn the border on / off using the Pen and Pattern options in the Series > Format tab.
DataSight Users Manual Version 2.9.4
© 2013 Seveno Pty Ltd
Graphs
136
- Add a title in the Chart > Titles tab.
- Edit the Legend in the the Chart > Legend tab.
Note: When the user needs to mark w ind direction points on a Wind Rose it is important to select Label from the Graph
Properties w indow . This is show n below :
DataSight Users Manual Version 2.9.4
© 2013 Seveno Pty Ltd
Graphs
DataSight Users Manual Version 2.9.4
137
© 2013 Seveno Pty Ltd
GIS and DataSight
13
138
GIS and DataSight
DataSight data is able to link directly in to GIS softw are for spatial analysis.
Users must ensure they have checked the SQL View s for Saved Datasheet View s boxes in the Datasheet options
area of DataSight.
This w ill allow GIS softw are, such as MapInfo and ArcGIS, to view and display DataSight data.
The latitude and longitude (or eastings, northings, X,Y co-ordinates, etc.) for stations is stored under Level 3 Properties.
DataSight Users Manual Version 2.9.4
© 2013 Seveno Pty Ltd
GIS and DataSight
139
Station information, w hen linked w ith a GIS package, can then be georeferenced allow ing easy access to database data
for querying, analysis and reporting.
DataSight Users Manual Version 2.9.4
© 2013 Seveno Pty Ltd
Reports
14
140
Reports
There are several w ays to create reports in DataSight. For data printouts, one option is to filter a datasheet and print or
export the resulting data show n in the datasheet.
Users can also simply generate a graph from data in the database and either print or save a copy as a .jpg.
Alternatively you can elect to use one of DataSight's three different reporting tools: Scheduler, Tabular Reports and
Report Creator.
14.1
Tabular Reports
Tabular Reports is a fixed type tabular reporting solution. You cannot change the report layout but you can select the
various Levels and Variables that you w ish to report upon. You can change the summary type (totals, averages) and
output type. You can also save report templates to use them again.
To generate a Tabular Report
icon on the DataSight Toolbar. This opens the T abular Report W izard.
1.
Select the
2.
If you have already saved a Template for this type of report and w ant to use it, click the Load T emplate button.
Click to select the appropriate template and click Open. This w ill load the parameters that have been saved for
that report. Continue to press Next to preview and move through each subsequent step.
Otherw ise,
3.
Select your Report Type and Reporting Period.
Report Type
Purpose
Reporting Period
Annual
Average or cumulative reports over 12 months
Enter Year and Starting Month
Monthly - Daily
Basis
Daily averages or totals for multiple variables
Enter Year and Month
Monthly - Hourly
Monthly tabular report for individual variables in
Enter Year and Month
DataSight Users Manual Version 2.9.4
© 2013 Seveno Pty Ltd
Reports
141
Basis
hours
Daily
Average and total figures hourly over the day
Enter the Date
Special Reports
Specialised analytical reports for the data set
Choose Report Type form drop dow n
menu
Rainfall Intensity
Enter dates for the reporting period
Operational Period Summary
Tabular Summary
Standards (Exceeding Data)
Standards Summary
Wind Direction (%)
4.
Click Next. The T abular Report W izard Lev els dialogue w indow appears.
5.
On the left are listed the levels available in your DataSight database for reporting. On the right is the list of your
selected sites. Double click on any level to include any or all stations w ithin that level in the selected sites list.
Use
6.
to clear sites from the selected sites list. Order the site list using the
and
keys.
Click Next. The T abular Report W izard Variables dialogue w indow appears.
DataSight Users Manual Version 2.9.4
© 2013 Seveno Pty Ltd
Reports
142
7.
Select your variables by either double clicking on individual variables, or by highlighting variables and using the
arrow keys.
8.
Click Next. The T abular Report W izard Summary T ypes dialogue w indow appears.
9.
Customise the the Report Type by selecting either a Cumulativ e or Mean data report from the drop dow n
menus.
Sites can also be ignored at this point by removing the tick button in the Include column.
10.
Click Next. The T abular Report W izard Output Dev ic e dialogue w indow appears.
DataSight Users Manual Version 2.9.4
© 2013 Seveno Pty Ltd
Reports
143
11.
Select one of the Output Options from the To Print list: Print Report, RTF, PDF, or HTML. For the latter options
ensure the appropriate save options are chosen. You may collate reports by variables or sites.
12.
If you w ish to save the report, click on Sav e T emplate.
13.
a.
Type the Name of your Report template.
b.
Click Sav e. The T abular Report T emplate dialogue w indow w ill close.
Click Next. The list of created tabular reports w ill be show n.
DataSight Users Manual Version 2.9.4
© 2013 Seveno Pty Ltd
Reports
14.
14.1.1
144
Click Finish to exit Tabular Reports.
Example Report: Wind Rose
This example details how to create a Wind Direction Report. This report displays a wind rose showing
the frequency of winds blowing from particular directions. The length of each "spoke" around the circle
is related to the frequency of time that the wind blows from a particular direction.
1. Select Tabular Reports from the Toolbar.
2. Select Special Reports from the Report Type area.
3. Select Wind Direction - (%) along with the reporting period from the drop-down list to the right.
4. Click Next.
5. Select the Sites required for the Wind Rose report (and click Next).
DataSight Users Manual Version 2.9.4
© 2013 Seveno Pty Ltd
Reports
145
6. Select the variables to report with (e.g. Wind Direction) and click Next.
7. In the Summary window ensure your selection is correct before clicking Next.
8. Select the Output Type (PDF, Excel, direct to Printer, etc.). Enter the file location and filename if
required.
DataSight Users Manual Version 2.9.4
© 2013 Seveno Pty Ltd
Reports
Note: at this last step the user can also elect to
146
to use the template at a future date.
9. Upon clicking Next the report will be created:
Below is an example report output in PDF format.
DataSight Users Manual Version 2.9.4
© 2013 Seveno Pty Ltd
Reports
14.2
147
Report Creator
Report Creator is an end-user reporting solution. Using Report Creator you can create your ow n report templates and
use them in DataSight. As Report Creator is also a report management tool, you are then able to share your reports w ith
other users.
To create a new report tem plate
1.
Click T ools, Report Creator.
2.
The Report Explorer dialogue w indow appears.
3.
Select File, New Report. The DataSight ReportCreator: New Report w indow appears w ith the Design
w indow open.
DataSight Users Manual Version 2.9.4
© 2013 Seveno Pty Ltd
Reports
148
4.
Select the Data tab to bring up the blank Data w indow .
5.
Select File, New to create a new data query. The New Items template w indow opens.
6.
Click on the T emplates tab to show the DataSight Template. This query accesses all the relevant Fields and
Tables w ithin your DataSight Database.
DataSight Enterprise version has another template. DatasightNumeric has same fields w ith the first template
plus numeric versions of the text variables. Some of the report functions like SUM, AVG etc are not able w ork
w ith text variables. We need to create and use text variables to be able to use below detection symbols like <, >
etc. DatasightNumeric create numeric version of the text variable to make them available to use in the
calculation. If the content of the variable is not the convertible data it w ill be empty w ith the numeric version of
the variable.
DataSight Users Manual Version 2.9.4
© 2013 Seveno Pty Ltd
Reports
149
7.
Double click on the DataSight Template. A query then runs to return the follow ing list of fields from your
Database to the Data w indow .
8.
Click on the Design tab to return to the Design w indow .
9.
Click File, Sav e to save the report template w hich now links via the data query to your DataSight database.
The named template w ill appear in the Report Explorer w indow .
10.
You are now ready to build your report.
To access a Report Builder User’s manual, go to:
http://w w w .digital-metaphors.com/dow nload/learning_reportbuilder.html
To run the report in DataSight
1.
Within the Report Explorer dialogue w indow , highlight the Report template that you w ish to export to your
DataSight database.
DataSight Users Manual Version 2.9.4
© 2013 Seveno Pty Ltd
Reports
150
2.
Select File, Export to Sav ed Views. The Report template w ill now be listed under Reports in the Sav ed
Views panel in DataSight
3.
To run the report, right-click on the report template and select Open (or double click on the report template).
You can then Print Prev iew your report.
4.
Select File, Print to choose your output (Printer or Print to File).
DataSight Users Manual Version 2.9.4
© 2013 Seveno Pty Ltd
Reports
5.
151
Select OK and then Close the Print Preview w indow .
DataSight Users Manual Version 2.9.4
© 2013 Seveno Pty Ltd
Reports
DataSight Users Manual Version 2.9.4
152
© 2013 Seveno Pty Ltd
Scheduler
15
153
Scheduler
DataSight has a facility for generating a report based on an existing saved graph, datasheet, calculation or report. The
output can be in a pdf (Adobe Acrobat), RTF, HTML, JPG or xls (Microsoft Excel datasheet) format. The user also has
the option to email the output file to a number of recipients. To set up scheduled email reporting please revisit the Options
section under Setting up the DataSight Database.
Reports can be regenerated periodically w ith the same file name, or DataSight can automatically increment file names
such as Temp 001.jpg, Temp 002.jpg...
Once you have set the appropriate filters on your data and saved the results as a Graph or Datasheet...
1.
Click T ools, Sc heduler
2.
The Sc heduled T ask s dialogue box w ill appear.
DataSight Users Manual Version 2.9.4
© 2013 Seveno Pty Ltd
Scheduler
15.1
154
Scheduling Tasks
Add a Task
1.
2.
3.
4.
Click the New icon on the menu, or double-click the Add Sc heduler T ask icon and the Edit T ask dialogue
box appears.
Check Ac tiv e to make the task enabled and running. Uncheck to disable the task. Tasks scheduled to run once
w ill be inactive after one run.
Type in a Desc riptiv e name for the task.
Use the T ask T ype drop dow n menu to select either Graphs, Datasheets, Reports, Calculations or Email
Documents.
5.
Select File T ype from drop dow n list.
6.
Enter the File Name w ith the destination folder.
7.
If you are scheduling the recurring creation of a the report you can select to overw rite file at recurrence.
if you select this option note that each time a report is generated the new output w ill overw rite the existing
file.
If you tick the checkbox for "Do not create output if no data" the you avoid overw riting the last output file that
DataSight Users Manual Version 2.9.4
© 2013 Seveno Pty Ltd
Scheduler
155
contained data.
8.
DataSight can create and add a Report Title to the output file. Check or uncheck this box to Enable / disable the
Report Title.
9.
The generated output file can be emailed to one (or more) recipients.
Simply check the box and enter an email address. When entering more than one email address, separate each
address w ith a comma.
You can choose one of three options w hen emailing the results of your task. You can choose to send an email
every time the scheduler runs the task, or only send an email w hen data is found, or only send an email w hen
there is no data. Having the ability to receive an email notification from the scheduler if data has not arrived can
be great for your data management
Note: please ensure the user has entered the correct email server (SMTP) details in the Tools area of the
DataSight Options (access via Settings on the toolbar).
10.
Choose the Saved Graph, Datasheet, Calculation or Report from the Item Name list. This defines the filter
conditions that you are going to use for the task.
Important: For Task Type - Reports
Saved Reports must have an associated Saved Datasheet or Saved Graph w hich contains the filter settings to be
applied to the report.
Once you have selected the Report, select the associated datasheet or graph from the Use Filter From drop dow n
list.
In the example above the filter applied to the saved AWS - Monthly Data graph or datasheet w ill be applied to the
DataSight Users Manual Version 2.9.4
© 2013 Seveno Pty Ltd
Scheduler
156
report 'Rainfall'.
For Task Type - Calculations
Saved Calculations must have associated filter settings to be applied to the report. These can be taken from a Saved
Datasheet.
Once you have selected the Calculation, select the associated Datasheet from the Use Filter From drop dow n list.
11.
Set the date and time that you w ish the report to run.
12.
Set the Frequenc y, Rec urrenc e and Regeneration options.
13.
Click OK.
Edit a task
1.
Click T ools, Sc heduler
2.
The Sc heduled T ask s dialogue box appears..
3.
Right-click on the task and select Edit.
4.
Make any required changes
5.
Click OK.
Delete a task
1.
Click T ools, Sc heduler
2.
The Sc heduled T ask s dialogue box appears..
3.
Right-click on the task and select Delete.
4.
You w ill be asked to confirm the selected deletion.
5.
Click OK.
Checking tasks assigned to a Graph or a Datasheet
1.
Right-click on any saved Graph or saved Datasheet and select Properties.
2.
Scheduled tasks are listed.
DataSight Users Manual Version 2.9.4
© 2013 Seveno Pty Ltd
Conversion Tool
16
Conversion Tool
16.1
Conversion Tool Introduction
157
The Conversion tool is an extremely flexible tool allow ing the user to use either "look up tables" or "interpolation tables"
along w ith free hand formula's or a combination of each to adjust and modify data.
In brief the user can
Convert data using look up/interpolation tables
Convert data using free hand formulas
Convert or adjust data using time shift w ith either absolute or percentage values
Use the data from multiple stations or multiple variables to undertake conversions
Generate new data and place in a variable
Relocate data to appropriate variable
Undertake Scientific unit conversion
Review Modified data in the Conversion graph
Review tabular data in the Conversion data grid
It is important that the user understands from the onset that the Conversions does not undertake any review of the
accuracy or validity of the data being adjusted, generated or calculated. The accuracy is the sole responsibility of the user.
We recommend that the user create tw o or three variables that are used for review ing calculated data. In many cases w e
add three variables normally Calc 1, Calc 2, Calc 3 for all data modified or generated. This allow s the user to review the
data before relocating to the final variable.
DataSight Users Manual Version 2.9.4
© 2013 Seveno Pty Ltd
Conversion Tool
158
Conversion Tool
The Conversion Tool is accessed from w ithin the Datasheet area of DataSight.
1. Users must ensure the variables they w ish to use in the calculation or conversion (including the Calc variables) are
checked in the Field List and visible w ithin the datasheet.
2. Right-click your mouse in the Datasheet w indow and select Conversions.
3. The Conversion Tool w ill open.
DataSight Users Manual Version 2.9.4
© 2013 Seveno Pty Ltd
Conversion Tool
159
Multiple variables can be used in the calculations. Only stations, variables and actual data that are displayed in the
DataSight Datasheet are accessible.
Once you have completed the conversion you can Save the Set (located at the top of the screen) if you w ish to use this
specific conversion again. The conversion set can be stored on the netw ork allow ing any other users to use your same
conversion set.
DataSight Users Manual Version 2.9.4
© 2013 Seveno Pty Ltd
Conversion Tool
160
The Conversions also has a conversion data graph that w ill display the data you have converted against the original data.
You can also access all of the standard graphing options by right clicking your mouse w ithin the graph area. This includes
exporting the graph as a JPG image, etc.
DataSight Users Manual Version 2.9.4
© 2013 Seveno Pty Ltd
Conversion Tool
161
The Conversion Tool also includes a Conversion Data area w hich displays the data in grid format.
DataSight Users Manual Version 2.9.4
© 2013 Seveno Pty Ltd
Conversion Tool
162
Conversion tables can also be used. There is no limit to the number of points. Betw een each point the conversion tool uses
a linear interpolation to calculate data betw een points. If data is above or below the values specified in the table the slope
of the line is continued and the data calculated. Extreme care has been taken to ensure the accuracy of the data. How ever,
w e do recommend that the user conducts a review of the data to ensure the conversion is valid for their specific
circumstance.
16.2
Conversion Tool Overview
The Conversion Tool
The DataSight Conversions tool is designed to enable the user to manipulate the data that is w ithin DataSight. The
Conversions are linked directly to the Datasheet w ithin DataSight. Therefore only data that can be seen w ithin the
Datasheet is available for manipulation by the Conversion tool. This can be across multiple stations and multiple variables.
By using data that is only in the Datasheet the user can isolate only the data that requires modification. The Conversion tool
also allow s the user to save conversion sets and look up tables.
The speed of the conversion changes betw een DataSight Desktop and DataSight Enterprise. We recommend that the user
undertakes conversions in reasonable sizes. For example w ith DataSight Desktop it takes under 2 minutes to complete the
conversion of 9,000 data points. This w ould equate to approximately 12 months of hourly data. But performance of the
conversions is really dependent of you computers performance.
The Conversion tool is extremely flexible and pow erful allow ing the user to use look up tables, free hand formula, off set
adjustments in proportion to time for both absolute and percentage changes. This is extremely important for adjustment of
w ater quality data as sensors are affected by algal grow th. Data form several different sites can also be modified.
We recommend that if the user is undertaking a significant amount of data manipulation that they generate three additional
DataSight Users Manual Version 2.9.4
© 2013 Seveno Pty Ltd
Conversion Tool
163
variables. In most cases w e use Calc 1, Calc 2 and Calc 3. These additional variables allow the user to manipulate, modify
the data set and save it into a generic variable w hich they can then verify before placing into the final variable.
The following is to be used as a guide only.
No warranty is given as to the accuracy of the calculations.
This is the user's responsibility and all calculations should be checked.
By using the Conversion Tool the user warranties Seveno against any claims.
DataSight Users Manual Version 2.9.4
© 2013 Seveno Pty Ltd
Conversion Tool
164
Conversion Table Layout
DataSight Users Manual Version 2.9.4
© 2013 Seveno Pty Ltd
Conversion Tool
DataSight Users Manual Version 2.9.4
165
© 2013 Seveno Pty Ltd
Conversion Tool
DataSight Users Manual Version 2.9.4
166
© 2013 Seveno Pty Ltd
Conversion Tool
167
Conversion Graph
The Conversion Graph displays both the raw data and the converted data. This can provide the user w ith an opportunity to
complete an initial review . By right clicking on the graph the user can access all of the standard DataSight graphing
features found in the main program. This includes exporting the graph via email or saving to a file.
DataSight Users Manual Version 2.9.4
© 2013 Seveno Pty Ltd
Conversion Tool
168
Conversion Data
The Conversion Data displays the both the raw and the calculated data. This is only available after the conversion has
been undertaken.
DataSight Users Manual Version 2.9.4
© 2013 Seveno Pty Ltd
Conversion Tool
16.3
169
Using the Conversion Tool
Using the Conversion Tool
DataSight Conversion tool is a free hand calculation tool for the manipulation and calculation of data.
Before progressing please read the "Conversion Tool Overview "
If you have used DataSight you w ill be familiar w ith the required fields w ithin the calculation tool.
The first step in using the tool is to use DataSight to filter and display the data that you w ish to use in the calculations. The
data MUST be displayed in the DataSight Datasheet. It is possible to have several stations displayed in the Datasheet so
they are all available for calculations.
Once you have filtered your data, to access the Conversions right click w ithin the DataSight Datasheet and select
Conversions.
The follow ing Icons are found at the top of the Conversions screen.
If you select Open the screen "Conversion Sets" w ill open so you can select a saved Conversion Set.
DataSight Users Manual Version 2.9.4
© 2013 Seveno Pty Ltd
Conversion Tool
170
Once you have your Datasheet displayed you can then populate the fields w ithin the Conversion Tool. If you require more
than one variable, select Add Variable at the top of the Conversions screen.
Variables
Users must select specific Level and Variable information for the Variables which have been added
for use in the conversion / calculation.
Time Shifting
Time Shifting can be used when an error is found in the data. For example on installation a sensor may
have no error. However, after 6 months deployment there may be a 10% error in the sensor's
measurements. By using Time Shifting, selecting the Start and End Offset amount/percentage, the
DataSight Users Manual Version 2.9.4
© 2013 Seveno Pty Ltd
Conversion Tool
171
user can adjust the data proportionally over time. It is important to note that Time Shifting assumes
that the error is linear and undertakes the calculations using this assumption.
Formula & Output
The Output area allows a formula to be entered and an output variable to be selected and updated.
Update conversion form variable: the output is within the conversion tool. This allows the user to simply
update and store the output within the conversion tool, so as not to change any of the database
variables. This also allows conversions to be completed on the output variable selected and not change
any data within the database.
Update database variable: the output is to the database. This allows the user to update and store the
output in the selected output variable in the database.
To demonstrate the areas of the Conversion Tool window several example calculations are carried out
below.
DataSight Users Manual Version 2.9.4
© 2013 Seveno Pty Ltd
Conversion Tool
16.3.1
172
Completing a Conversion 1
Exam ple 1: Calculating Dew Point Tem perature
If the user w anted to calculate Dew Point Temperature, using the variables Temperature and Relative Humidity:
1. Ensure the variables required for the calculation are currently being view ed w ithin the Datasheet.
2. Right-click on the datasheet and open the Conversion w indow .
3. Select Master Variable A (Temperature) by selecting the Level and Variable from the populated drop-dow n lists.
4. Add a second Variable by selecting Add Variable in the toolbar.
5. Select Variable B (Relative Humidity).
DataSight Users Manual Version 2.9.4
© 2013 Seveno Pty Ltd
Conversion Tool
173
6. Below the Output area of the Conversion w indow enter the Form ula required to complete the calculation.
7. Select the Output variable
8. The user can then select either Update conversion form variable or Update database variable checkbox to complete the
calculation.
Options
Update conversion form variable: the output is w ithin the conversion tool. This allow s the user to simply update and
store the output w ithin the conversion tool, so as not to change any of the database variables. This also allow s
conversions to be completed on the output variable (created in Step 7) and not change any data w ithin the database.
Update database variable: the output is to the database. This allow s the user to update and store the output in the
database variable selected in Step 7.
9. Once the user has selected from these options, simply press the
button.
10. A Conversion Log summary w ill be displayed (and saved to the Audit Trail Log) and the conversion completed w hen
OK is pressed.
DataSight Users Manual Version 2.9.4
© 2013 Seveno Pty Ltd
Conversion Tool
174
11. The user can also view the result of the calculation as a graph by selecting Conversion Graph tab.
The im age above displays the Conversion Graph.
Plotted on the graph are Variables A and B and the Result of the form ula entered.
As w ith the graphs created in other areas of DataSight, users can save and export the graph (and data) and zoom in
DataSight Users Manual Version 2.9.4
© 2013 Seveno Pty Ltd
Conversion Tool
175
and examine the graph more closely w ithin the conversion w indow .
12. Press the Close button w hen you w ish to view the output data. You can then elect to either save or discard the
conversion you have completed by selecting Yes or No.
Note that this sim ply saves the Conversion Tool w indow variable/s and form ula. You do not need to save
to com plete the conversion.
13. Select Yes to refresh the datasheet and view the new ly calculated data.
The Dew Point (°C) variable has been populated w ithin the datasheet.
DataSight Users Manual Version 2.9.4
© 2013 Seveno Pty Ltd
Conversion Tool
16.3.2
176
Completing a Conversion 2
Exam ple 2: A sim ple calculation.
The follow ing example illustrates a simple multiplication, completed w ithin the Conversion Tool.
Select the Conversion Graph tab to view the result of the calculation.
DataSight Users Manual Version 2.9.4
© 2013 Seveno Pty Ltd
Conversion Tool
DataSight Users Manual Version 2.9.4
177
© 2013 Seveno Pty Ltd
Conversion Tool
16.3.3
178
Completing a Conversion 3
Conversion Tables
To calculate stream flow from depth measurements ensure you have the correct rating table w ith depth and discharge
data.
Rating tables can be entered into DataSight in the Conversion Tool. Select File, Conversion Tables.
An example of a rating table is show n below , follow ed by an example streamflow calculation using the rating table.
Exam ple 3: Converting Depth to Flow using a Conversion Table.
1. Ensure you are view ing the data you w ish to w ork w ith in the Datasheet w indow . Right-click and select Conversions.
2. In the Conversions w indow select the appropriate Level and Variable for Master Variable A (these should be the depth
measurement location and depth.
DataSight Users Manual Version 2.9.4
© 2013 Seveno Pty Ltd
Conversion Tool
179
Ensure you also check the Use conversion table box.
3. Select the appropriate Conversion table from the drop-dow n list.
4. When completing conversions using a Conversion table, the Formula entered can simply be A (or a).
DataSight Users Manual Version 2.9.4
© 2013 Seveno Pty Ltd
Conversion Tool
16.3.4
180
Completing a Conversion 4
Flow Duration Curves
To establish representative low flow s and floods (high flow s) for a river course a hydrologist w ill analyse the frequency
of daily flow s in the form of a flow duration curve. A flow duration curve is a plot of discharge vs. amount of time that a
certain discharge w as exceeded. For most studies the data needed for this analysis is the daily average flow (the average
discharge or flow for each day), hence this is used in this example.
Within the Datasheet, ensure you are view ing the
variables required for the calculation:
Flow and tw o variables to output Daily Av erage
Flow and Perc ent of time exc eeded.
To c alc ulate the Daily av erage flow
- Open the conversion tool
- Select Master Variable A (140 Flow)
- Enter the formula dailyavgA
- Select the output variable (Daily Avg Flow)
- Check the Update database variable box and the
Update conversion form variable box and click
Update data.
Once the conversion has run you w ill have the Daily Average Flow for the river and you can calculate the Percent of
tim e exceeded.
- Within the conversion tool select the Daily Average Flow variable you have just populated w ith the previous calculation
- Enter the follow ing formula
(RankDSCA/(n + 1))*100
RankDSC is used in the formula to sort (rank) the average daily discharges for the period of record from the largest value
to the smallest value, involving a total of n values, w here n equals the number of points or events for the period of flow
records being analysed.
So, in our example, there are 6275 flow points in the period,
and this is displayed in the conversion tool w indow .
So, the formula to be entered is (RankDSCA/(6275+1))*100
- Select an output variable (for example, Percent)
- Check the Update database variable box
- Click Update data.
Close the conversion tool w indow , ensuring you refresh the datasheet to see the current data.
DataSight Users Manual Version 2.9.4
© 2013 Seveno Pty Ltd
Conversion Tool
181
Creating the Flow Duration Curve
Using your calculated data you can now create a Flow Duration Curve
- Click the New Graph tab
- Place the Percent exceeded variable on to the x-axis
- Place the Daily Average Flow variable on the y-axis
DataSight Users Manual Version 2.9.4
© 2013 Seveno Pty Ltd
Conversion Tool
16.4
182
Conversion Formulas
DataSight Conversion Tool gives you the opportunity to do complex conversions. The formula area is one of the most
important pieces of the Conversion Tool. You can w rite simple or complex formulas and calculations and any formula you
enter in to the formula box is parsed against errors before you do the calculation.
Consider the details below w hile you are w orking w ith the Conversion Tool.
- Each DataSight variable added into the Conversion Tool is represented w ith corresponding variable (letter) in the formula.
The first variable is a Master variable and named by 'A', additional variables are named 'B', 'C', etc.
Conv ersion Variable
Formula Representation
Master Variable A
A or a
Variable B
B or b
Variable C
C or c
...
Variable Z
Z or z
Examples:
A
A+B
A*2.3+B
For example, If the user enters 'A' into the formula box, the conversion tool w ill return the value of Variable A as the result.
Datasight implemented variables
There are also some DataSight Implemented variables for use in the Formula area.
Formula
Representation
Comment
MINA
Minimum Value of Master Variable A series
MAXA
Maximum Value of Master Variable A series
AVGA
Average Value of Master Variable A series
SUMA
Total Value of Master Variable A Series
DISCHARGEA
Total Discharge Value of Master Variable A series
MINB
Minimum Value of Variable B series
MAXB
Maximum Value of Variable B series
AVGB
Average Value of Variable B series
SUMB
Total Value of Variable B series
DISCHARGEB
Total Discharge Value of Variable B series
...
...
Further functions include calander usage, such as DAILYSUM,
MONTHLYSUM, MONTHLYAVG, YEARLYSUM, YEARLYAVG.
DataSight Users Manual Version 2.9.4
DAILYAVG,
WEEKLYSUM,
WEEKLYAVG,
© 2013 Seveno Pty Ltd
Conversion Tool
183
You need the add the corresponding letter for the variable to the end of these formulas for the conversion to complete,
such as DAILYAVGA, WEEKLYSUMB, YEARLYAVGC, etc.
Formula Representation
Comment
DAILYSUMA
Daily Sumary (Total) Value of Master Variable A
series
DAILYAVGA
Daily Average Value of Master Variable A series
...
...
Mathematical and Statistical Functions
Formula
Example Use
MEDIAN
Calculates the Median Value of the selected Variable
series
VARIANCE
Calculates the Variance Value of the selected
Variable series
STDEV
Calculates the Standard Deviation of the selected
Variable series
CofV
Calculates the Co-efficient of Variation of the
selected Variable series
RofC(x)
Calculates the per second Rate of Change from one
data point to the next.
For example, the formula rofcA(3) w ill calculate the
per second rate of change for variable A over the
previous three points.
The formula rofcA(3)*3600 calculates the hourly rate
of change for variable A.
Calculating Differences
The Conversion Tool can be used to determine previous, next and time differences w ithin the variables of a database.
Formula Variable
Comment
PVALA
Previous reading / value (of Variable A)
PVALB
Previous reading / value (of Variable B)
...
Previous reading / value (of Variable n)
Formula Variable
Comment
NVALA
Next reading / value (of Variable A)
NVALB
Next reading / value (of Variable B)
...
Previous reading / value (of Variable n)
Example 1: by using the Previous Value and Next Value in a formula a user can calculate differences betw een values.
Example 2: the NVAL conversion formula could be used to ensure correct functioning of the meter, such as looking at
future (next or NVAL) values to see if a w ater meter is increasing in value as a flow increases.
Note: When PVAL is used for the first value w ithin the dataset it w ill return that first value. Similarly, w hen NVAL is used
DataSight Users Manual Version 2.9.4
© 2013 Seveno Pty Ltd
Conversion Tool
184
for the final value in a set it w ill return that final value.
- The Conversion Tool can be used to calculate the time difference betw een records/values
Formula Variable
Comment
TIMEDIFFA
Time difference betw een records (in seconds)
TIMEDIFFB
...
...
The TIMEDIFF variable w ill return the time difference betw een records/values.
For example if Record 1 w as taken at '12/12/2008, 02:02:00' and Record 2 at '12/12/2008, 02:03:00' the value given w ould
be 60 (seconds).
INDEX function
Formula
INDEX
Example Use
Displays the Index value of the output
The INDEX function can be used to index the selected variable - giving the first data entry in the series a value of 1, the
next a value of 2, then 3 and so on. An example output is displayed below .
- Analytic Operators: +, -, /, *, ^
- Logic al Operators: <, >, =, &, |, !, <>, <=, >=
- Paranthesis: (, {, [
- Common math func tions are defined by default.
Full list of built in math functions.
Functions with single parameters.
SQR
: Square function w hich can be used as SQR(X)
SIN
: Sinus function w hich can be used as SIN(X), X is a real-type expression. Sin returns the sine of the
angle X in radians.
DataSight Users Manual Version 2.9.4
© 2013 Seveno Pty Ltd
Conversion Tool
185
COS
: Cosinus function w hich can be used as COS(X), X is a real-type expression. COS returns the cosine
of the angle X in radians.
AT AN
: ArcTangent function w hich can be used as ATAN(X)
SINH
: Sinus Hyperbolic function w hich can be used as SINH(X)
COSH
: Cosinus Hyperbolic function w hich can be used as COSH(X)
COT AN
: w hich can be used as COTAN(X)
T AN
: w hich can be used as TAN(X)
EXP
: w hich can be used as EXP(X)
LN
: natural log, w hich can be used as LN(X)
LOG
: 10 based log, w hich can be used as LOG(X)
SQRT
: w hich can be used as SQRT(X)
ABS
: absolute value, w hich can be used as ABS(X)
SIGN
: SIGN(X) returns -1 if X<0; +1 if X>0, 0 if X=0; it can be used as SQR(X)
T RUNC
: Discards the fractional part of a number. e.g. TRUNC(-3.2) is -3, TRUNC(3.2) is 3.
CEIL
: CEIL(-3.2) = 3, CEIL(3.2) = 4
FLOOR
: FLOOR(-3.2) = -4, FLOOR(3.2) = 3
Functions that take two parameters are:
INT POW
: The INTPOW function raises Base to an integral pow er. INTPOW(2, 3) = 8.
Note that result of INTPOW(2, 3.4) = 8 as w ell.
POW
: The Pow er function raises Base to any pow er.
For fractional exponents or exponents greater than MaxInt, Base must be greater than 0.
LOGN
: The LogN function returns the log base N of X. Example: LOGN(10, 100) = 2
MIN
: MIN(2, 3) is 2.
MAX
: MAX(2, 3) is 3.
Functions that take more than 2 parameters are:
IF
: IF(BOOL, X, Y) returns X if BOOL is <> 0, returns Y if BOOL =0.
Values of X and Y are calculated regardless of BOOL (Full Boolean Evaluation).
Formula Samples:
A-MINA
A+B+(AVGB-AVGB)
Parenthesis can be in the
follow ing formats (, {, [2*[LN(1+X) / LOG(1-X)]
[237.7* (( (17.27*A) / (237.7+A) ) + ln(B/100) )) / (17.27 -((( 17.27*A) / (237.7+A)) +ln
(B/100) )]
Functions, variables and
constant values can be
nested
SIN(3.14)+5^2+POW(2,MAX(X*2,Y))
IF(a,b,c) branching function
are supported.
IF(X>0, 3/X, F(X))
Boolean operators are
DataSight Users Manual Version 2.9.4
© 2013 Seveno Pty Ltd
Conversion Tool
186
supported
Any non-zero value is TRUE,
0 is FALSE.
Scientific notation is
supported: eg. 3E-2
X+COSH(3E-2)
SIN(3.14)+5^2+POW(2,7)-MAX(10,20)
{ [ SIN(A)^2 ] + COS(1) } * PI/2
( COSH(2.71)+ SINH( COS(0.5) * POW(0.2345, 0.67) )) - LOG(1-A^2+A^5)
25993.894*EXP(-1.53389*(A-32))*POW(A, 0.13547)*POW(B, 0.38603)*EXP(-0.36222*B)
A+B+IF(A,A,B)
A-IF(A<>0,3*A,3)
IF(A>=B,A,B/2)
As mentioned, the formula box is analysed for errors before the calculation is completed. If you have any errors in the
formula the conversion w ill not continue and you w ill receive the follow ing w arning.
DataSight Users Manual Version 2.9.4
© 2013 Seveno Pty Ltd
Conversion Tables
17
187
Conversion Tables
The follow ing provides information on how to create and save a conversion look up table. These look up tables can contain
data for
Stream/River Stage Discharge Curves
Water Quality data. For example, plotting Turbidity against Discharge
Stream Rating Tables
Pump Rating Tables
To create a Conversion Table access the Conversion Tables w indow via the Tools menu.
Conversion Tables are also accessible from the File menu w ithin the Conversion Tool.
Create a New Table by clicking the New button on the Toolbar.
This allow s the user to enter X and Y data in the area provided along w ith a Period of Applicability for each new
conversion table.
For example, in this exercise w e w ill create a Water Quality lookup table comparing observed Discharge and total
suspended solids (TSS) for a stream.
DataSight Users Manual Version 2.9.4
© 2013 Seveno Pty Ltd
Conversion Tables
188
After entering the specific X and Y axis labels available data can be entered:
- Data can be entered individually using the navigation buttons at the bottom of the data area, selecting the
add a line and enter data, and the
button to
button to remove a line of data.
- Column data can also be by copied from Excel (or a similar program) into the X and Y columns in the Conversion Table.
So, if you have rating tables/look up tables in tw o columns in Excel, for example, you w ill be able to highlight, copy and
paste them into this area.
Similarly, if the user w as to enter a rating table displaying depth/stage vs. discharge:
As data is entered it is graphed in the Conversion Table Graph area, as show n below .
DataSight Users Manual Version 2.9.4
© 2013 Seveno Pty Ltd
Conversion Tables
189
To save the graph go to the File menu and select Sav e as.
As you can see in the images below , graph axis can be transposed by selecting
(Note that this does not change or sw ap data stored in the X and Y columns, it simply changes the w ay they are displayed
on the graph.)
DataSight Users Manual Version 2.9.4
© 2013 Seveno Pty Ltd
Conversion Tables
190
Selecting
allow s the user to set the graph scale to Logarithmic, w hich can be helpful w hen the data
entered covers a large range of values.
Selecting Regression opens the Regression Tool, allow ing regression analysis and the development of rating tables,
tasks w hich are detailed in the follow ing chapter.
Assign the Conversion Table to a Station
Once the Conversion Table has been created it can be assigned to a station (specific Level 1, Level 2, Level 3 location)
so that it can be compared w ith stream gauging data (individual discharge measurements) and used for regression
analysis.
1. Select Assign to Station from the File menu.
2. Within the Assign Levels w indow , click the New button.
3. Select the Station to assign the conversion table to, then select OK.
(Users can assign multiple stations to one Conversion Table by selecting New from w ithin the Assign Levels w indow ).
Updating existing data
Once the Conversion Table has been created and assigned to a station (specific Level 1, Level 2, Level 3 location) it
can be applied to the existing data. Period of Applicability needs to be assigned to be able to update existing data.
DataSight Users Manual Version 2.9.4
© 2013 Seveno Pty Ltd
Conversion Tables
17.1
191
Applying Conversion Table to (Updating) Existing Data
Conversion Tables can be applied to existing data. Existing data can be raw or already converted.
Conversion Table needs to be assigned to a station (specific Level 1, Level 2, Level 3 location) and Period of
Applicability needs to be assigned to be able to update existing data.
To open Update Form click
button.
After selecting source variable and output variable DataSight automatically show s old and new data on the Graph. Data tab
also show s the Source and before and after data in the datasheet to review .
DataSight Users Manual Version 2.9.4
© 2013 Seveno Pty Ltd
Conversion Tables
192
Click Save button to update existing data.
17.2
Using Conversion Tables
Conversion Tables can be used for interpolation w ithin the DataSight Conversion Tool. They can also be used for
regression analysis w ithin the Regression Tool.
Within the Conversion Tool the user first needs to select the appropriate Conversion table from the list. The small box to the
right provides access to the conversion table, allow ing the user to view and edit the table.
Below this, Conversion type allow s the user to select the type of interpolation betw een the selected variable and the
conversion table.
Interpolate - assumes a straight-line relationship and draw s a straight line betw een the points in the table
Step up method - Goes UP to the nearest point on the conversion/rating table to calculate the output.
DataSight Users Manual Version 2.9.4
© 2013 Seveno Pty Ltd
Conversion Tables
193
Step dow n method - Goes DOWN to the nearest point on the conversion/rating table to calculate the output.
The Step up / Step dow n methods can be used for situations w here pump activation might initiate a pump that has only
one speed. Therefore it is either on or off.
To complete the conversion a formula must be entered in the Output area.
In this example, A is the formula (referring to variable A - w hich w ill be interpolated against the conversion table) and Calc2
is selected as the Output variable.
Selecting the
tab or the
and the data result, of the conversion before it is completed.
DataSight Users Manual Version 2.9.4
tab allow s the user to view the graphical result
© 2013 Seveno Pty Ltd
Regression Tool
18
Regression Tool
18.1
Regression Tool
194
The Regression Tool allow s the user to analyse the relationship betw een different variables and to fit statistical functions
to a set of data in order to understand the relationship betw een the dependent and independent variable. It is accessible via
the T ools menu.
18.2
Analysing Water Quality relationships using the Regression Tool
To perform regression analysis on tw o variables a conversion table must exist. The procedure for creating a Conversion
Table is outlined in the previous chapter.
In this example, w e w ill analyse a w ater quality table containing the variables discharge and total suspended solids (TSS).
1. Having created our conversion table w ith the existing data, open the Regression Tool.
2. Click the T able button to load the Table List, select the appropriate table and click OK.
DataSight Users Manual Version 2.9.4
© 2013 Seveno Pty Ltd
Regression Tool
195
3. The table w ill be displayed in the Conversion Table area as w ell as graphically in the Regression Graph area.
4. Click the Result Settings button to apply start and end values and output increments for the regression analysis.
DataSight Users Manual Version 2.9.4
© 2013 Seveno Pty Ltd
Regression Tool
196
The user can elect to:
- Automatically set start and end values: the regression tool w ill use the low est and highest values in the data as the start
and end values.
- check the Use these values button and enter values manually.
- Enter a number of Increments at each step of the regression or enter a total Number of increments for the regression
analysis.
5. Click the Analyse button to select the Regression groups and carry out the analysis. In this example the Polynomial
regression models are selected.
Users can also click the New button to create and edit their ow n Regression group from the in-built Regression Models.
6. When you are satisfied w ith your selection, click OK. The regression analysis w ill be completed using your selected
models and the results displayed to the right of the Regression Tool w indow .
DataSight Users Manual Version 2.9.4
© 2013 Seveno Pty Ltd
Regression Tool
197
Selecting a model from the list w ill display the model graphically and present the statistical model details, including the R2
value, p-Value, Standard Error and Sum of Squares information (as show n above). Further details can be found by clicking
the Details button.
DataSight Users Manual Version 2.9.4
© 2013 Seveno Pty Ltd
Regression Tool
198
Developing a Water Quality Conversion Table
Continuing w ith this example, w e can develop a conversion table modelled on the measured w ater quality results:
1. Select Model number 3 - Third Order Polynomial.
2. Zooming in on the the low er end of the graph, w e can identify the curve that lines up suitably w ith the existing measure
points:
DataSight Users Manual Version 2.9.4
© 2013 Seveno Pty Ltd
Regression Tool
199
Note that you can select regression models from the list on the right, and the graph w ill reflect this change (red line).
3. In this example, I am satisfied w ith the regression model from a discharge point of about 4.5 (before this point the model
is not reliably accurate). View the generated analysis results by selecting the Analysis Results tab.
4. The user can then highlight row s and output to a new table. In this example, w e w ill select row s, right-click and select
Copy Selected Into Output.
5. This moves any selected data into the Output Table tab.
Data in the Output Table is displayed in the Graph area in blue.
DataSight Users Manual Version 2.9.4
© 2013 Seveno Pty Ltd
Regression Tool
200
We now have part of a conversion table - for determining TSS based on Discharge - but still need the low er end of the
table.
6. Click the Analyse button and select All Groups from the Regression Groups list. This w ill complete a regression analysis
of the data using all available models in DataSight.
7. If you scroll through the Regression Models to the right of the w indow you can view the model graphically in the
Regression Graph area. It displays w hich models fit the existing data points along w ith the Output Table w e began
creating in the previous steps.
DataSight Users Manual Version 2.9.4
© 2013 Seveno Pty Ltd
Regression Tool
201
8. In this example, as it fits the line w ell, w e select Model 65 - Gunary Model, as show n below .
9. Select the Analyse Results tab to display the results of the selected model.
10. Highlight the values you w ish to move across to the Output Table, right-click and and select Copy Selected Into Output.
In this example, generating the Conversion Table, this is the points w ith a discharge value below 4.5.
DataSight Users Manual Version 2.9.4
© 2013 Seveno Pty Ltd
Regression Tool
202
11. The Output Table w ill be displayed in the graphing area and can be saved (as a DataSight Conversion Table) by clicking
the Save button on the toolbar and entering the follow ing details:
Rating Table Name
X and Y axis Labels
Period of Applicability (this is simply a set of reference dates for the user).
select to Assign the conversion table to the Level 3 that the original conversion table data w as assigned to.
select to update existing data in the database.
DataSight Users Manual Version 2.9.4
© 2013 Seveno Pty Ltd
Regression Tool
203
12. Click OK to save the Conversion Table.
13.Update existing data. Applying Conversion Table to (Updating) Existing Data
The Conversion Table w ill then be available from the Tools menu, and w ithin the Conversion Tool for interpolation and use
w ith other datasets.
18.3
Analysing hydrographic relationships using the Regression Tool
The regression tool also allow s the user to fit different functions to a set of gauging data points and develop rating tables
based on existing gauging data.
There are three aspects to the Regression Analysis Tool.
These are:
Gaugings
Conversion Tables
Regression Tool
Regression Analysis can be performed on Gauging data, Conversion Table data or both.
To perform regression analysis a conversion table must exist (or be created). The procedure for this is outlined in the
previous chapter.
In order to carry out the regression analysis the Conversion Table must also be assigned to a station.
It is necessary to have some gauging information w ithin the database to complete regression analysis. The procedure for
entering Gauging data is covered in a later chapter.
DataSight Users Manual Version 2.9.4
© 2013 Seveno Pty Ltd
Regression Tool
204
When you open the Regression Tool, the first thing you w ill need to do is load the Conversion Table and Gauging data.
1. Click the Table button on the toolbar to select the Conversion Table for analysis.
The user w ill be presented w ith a list of available Conversion Tables - i.e. those that exist w ithin the current database.
Select the Conversion Table you w ish to use for analysis and click OK.
Within the Regression Tool, the Conversion Table area w ill be populated w ith data from the selected Conversion Table and
the Regression Graph area w ill display the Conversion Table graphically.
DataSight Users Manual Version 2.9.4
© 2013 Seveno Pty Ltd
Regression Tool
205
2. Click the Gaugings button on the toolbar to select the Gaugings for analysis.
DataSight Users Manual Version 2.9.4
© 2013 Seveno Pty Ltd
Regression Tool
206
Select individual gaugings by checking the boxes on the right of the
Gaugings w indow , or right-click on the w indow and Select All.
This w ill populate the Gauging Data area of the Regression Tool, allow ing
regressions to be carried out on those selected, and plot the gaugings
graphically in the Regression Graph area.
This is displayed below .
The user can select and deselect row s from the Conversion Table, and those from the Gaugings before (or after) carrying
out analysis, by selecting the checkboxes at the left.
Selecting the Result Settings button allow s the user to define the upper and low er boundaries of the result set produced
during analysis, along w ith the required number of increments required for the result set.
DataSight Users Manual Version 2.9.4
© 2013 Seveno Pty Ltd
Regression Tool
207
Once you have selected the conversion table and gaugings you w ish to use, click Analyse in the toolbar to begin
regression analysis.
A list of the available Regression Groups w ill be displayed.
Select the applicable Group (or select All Groups) and click OK.
By clicking New , users also have the option of creating their ow n Group (using the in-built
regression models).
Details of the Regression Groups available for analysis are found in the follow ing pages.
When the user clicks OK, DataSight w ill complete the regression analysis and display the results of each model graphically.
On the right, details of the Regression Models w ill be displayed. A graphical representation of the model w ill be displayed in
the Regression Graph w indow in the middle of the Regression Tool.
DataSight Users Manual Version 2.9.4
© 2013 Seveno Pty Ltd
Regression Tool
DataSight Users Manual Version 2.9.4
208
© 2013 Seveno Pty Ltd
Regression Tool
209
Model details are displayed at the bottom of the Models w indow (at the right).
This includes the R2 value, p-Value, Standard Error and Sum of Squares information.
Further details can be found by clicking the Details button.
Graphical Display
Users can scroll through the Models - to display them on the graph.
Check or Un-check the boxes in the gauging list and conversion table, to remove these from the regression calculation.
While view ing the graph, users can alter the Result Set Settings, altering the start and end values.
Zoom by clicking the left mouse button and dragging.
Pan around the graph by right-clicking the graph and dragging.
Right-clicking the mouse button also displays a menu allow ing the user to copy and save the graph, and turn the various
series in the graph on or off.
DataSight Users Manual Version 2.9.4
© 2013 Seveno Pty Ltd
Regression Tool
210
The Graph Legend
The graph legend is standard, displaying the six different series view able in the Regression Tool.
Selecting the Analyse Results tab w ill display the results of the analysis (using the selected model that is currently
displayed on the graph).
Within the Analyse Results w indow that the user can begin to create new Conversion Tables (based on the results of the
Regression Analysis).
Simply select the lines you w ish to use in your new Conversion Table. Then right-click on the table and select Copy
Selected into Output.
Then, w hen you view the Output Table tab, you can see the new ly created Conversion Table data. This data w ill also be
displayed on the graph.
Select Save from the toolbar to save the rating table.
DataSight Users Manual Version 2.9.4
© 2013 Seveno Pty Ltd
Regression Tool
211
This w ill open the Save Rating Table dialog w indow .
Enter the name of the new Rating Table.
Enter the X and Y axis Labels.
Enter the Period of Applicability for the new Rating Table.
Users can also elect to Assign the rating table to the same Level 3 as the current Conversion
Table.
'Update existing data' needs to be clicked to be able to apply the new rating table (shift) to
existing data.
Click OK.
18.4
Regression Models
The follow ing is a list of the in-built models that are available w ithin the DataSight Regression Tool.
Model Formula
Number
Model Name
Group Name
a*x+b
First Order Polynomial
Polynomial
2
a*x^2+b*x+c
Second Order Polynomial Polynomial
3
a*x^3+b*x^2+c*x+d
Third Order Polynomial
4
a*x^4+b*x^3+c*x^2+d*x+e
Fourth Order Polynomial Polynomial
5
a*x^5+b*x^4+c*x^3+d*x^2+e*x+f
Fifth Order Polynomial
Polynomial
6
a*x^6+b*x^5+c*x^4+d*x^3+e*x^2
+f*x+g
Sixth Order Polynomial
Polynomial
7
a*x^7+b*x^6+c*x^5+d*x^4+e*x^3
+f*x^2+g*x+h
Seventh Order PolynomialPolynomial
8
a*x^8+b*x^7+c*x^6+d*x^5+e*x^4
+f*x^3+g*x^2+h*x+i
Eighth Order Polynomial Polynomial
9
a*x^9+b*x^8+c*x^7+d*x^6+e*x^5
+f*x^4+g*x^3+h*x^2+i*x+j
Ninth Order Polynomial
Polynomial
10
a*x^10+b*x^9+c*x^8+d*x^7+e*x^6
+f*x^5+g*x^4+h*x^3+i*x^2+j*x+k
Tenth Order Polynomial
Polynomial
45
a+b*log(x)
First Order Logarithm
Logarithm Polynomial
45
a+b*log(x)
Logarithm Model
Logarithm Polynomial
12
a+b*log(x)+c*log(x)^2
Second Order Logarithm Logarithm Polynomial
13
a+b*log(x)+c*log(x)^2+d*log(x)^3
Third Order Logarithm
Logarithm Polynomial
14
a+b*log(x)+c*log(x)^2+d*log(x)^3
+e*log(x)^4
Fourth Order Logarithm
Logarithm Polynomial
15
a+b*log(x)+c*log(x)^2+d*log(x)^3
+e*log(x)^4+f*log(x)^5
Fifth Order Logarithm
Logarithm Polynomial
50
a+b/x
First Order Inverse
Inverse Polynomial
1
DataSight Users Manual Version 2.9.4
Polynomial
© 2013 Seveno Pty Ltd
Regression Tool
212
Model Formula
Number
Model Name
Group Name
50
a+b/x
Hyperbolic Model
Inverse Polynomial
17
a+b/x+c/x^2
Second Order Inverse
Inverse Polynomial
18
a+b/x+c/x^2+d/x^3
Third Order Inverse
Inverse Polynomial
19
a+b/x+c/x^2+d/x^3+e/x^4
Fourth Order Inverse
Inverse Polynomial
20
a+b/x+c/x^2+d/x^3+e/x^4+f/x^5
Fifth Order Inverse
Inverse Polynomial
21
a+b/log(x)
First Order Inverse
Logarithm
Inverse Logarithm
22
a+b/log(x)+c/log(x)^2
Second Order Inverse
Logarithm
Inverse Logarithm
23
a+b/log(x)+c/log(x)^2+d/log(x)^3
Third Order Inverse
Logarithm
Inverse Logarithm
24
a+b/log(x)+c/log(x)^2+d/log(x)^3+e/ Fourth Order Inverse
log(x)^4
Logarithm
Inverse Logarithm
25
a+b/log(x)+c/log(x)^2+d/log(x)^3+e/ Fifth Order Inverse
log(x)^4+f/log(x)^5
Logarithm
Inverse Logarithm
26
log(x-a)
Single Parameter Convex/Concave
27
1/(1+a*x)
Single Parameter Convex/Concave
28
exp(x-a)
Single Parameter Convex/Concave
29
x^a
30
a^(1/x)
31
1/(x+a)
Single Parameter Convex/Concave
32
1-1/(x^a)
Single Parameter Convex/Concave
33
log(a+b*x)
34
a*x^b
Power (Freundlich)
Two Parameter Convex/Concave
35
a*b^x
Modified Power
Two Parameter Convex/Concave
36
a*exp(b*x)
Exponential
Two Parameter Convex/Concave
37
a*exp(b/x)
Modified Exponential
Two Parameter Convex/Concave
38
exp(a+b*x)
39
a*b*x/(1+b*x)
40
x/(a*x+b)
41
1/(a+b*x)
42
a/(1+b*x)
Two Parameter Convex/Concave
43
a*(x-b)
Two Parameter Convex/Concave
44
a*(1+x)^b
Two Parameter Convex/Concave
45
a+b*log(x)
First Order Logarithm
Two Parameter Convex/Concave
45
a+b*log(x)
Logarithm Model
Two Parameter Convex/Concave
46
1/(a+b*log(x))
Reciprocal Logarithm
Model
Two Parameter Convex/Concave
47
a*x^(b*x)
Geometric Model
Two Parameter Convex/Concave
48
a*x^(b/x)
Modified Geometric
Model
Two Parameter Convex/Concave
49
a*x/(b+x)
Saturation Growth Model Two Parameter Convex/Concave
50
a+b/x
First Order Inverse
Two Parameter Convex/Concave
50
a+b/x
Hyperbolic Model
Two Parameter Convex/Concave
51
a*b^x*x^c
Hoerl Model
Three Parameter Convex/Concave
52
a*b^(1/x)*x^c
Modified Hoerl Model
Three Parameter Convex/Concave
DataSight Users Manual Version 2.9.4
Single Parameter Convex/Concave
Root Model
Single Parameter Convex/Concave
Two Parameter Convex/Concave
Two Parameter Convex/Concave
Rectangular Hyperbola
Two Parameter Convex/Concave
Two Parameter Convex/Concave
Reciprocal Model
Two Parameter Convex/Concave
© 2013 Seveno Pty Ltd
Regression Tool
Model Formula
Number
Model Name
Group Name
213
53
1/(a+b*x+c*x^2)
Reciprocal Quadratic
(Holliday)
Three Parameter Convex/Concave
54
exp(a+b/x+c*log(x))
Vapor Pressure Model
Three Parameter Convex/Concave
55
a+b*x+c/x^2
Heat Capacity Model
Three Parameter Convex/Concave
56
a/(1+b*x+c*x^2)
57
cos(x+a)
Trigonometric
Single Parameter with Max/Min
58
sin(x+a)
Trigonometric II
Single Parameter with Max/Min
59
1-exp(-a*x^2)
Single Parameter with Max/Min
60
exp(-a*x^2)
Single Parameter with Max/Min
61
a*cos(x)+b*sin(x)
Two Parameter with Max/Min
62
x/(a+b*x+c*x^2)
Three Parameter with Max/Min
63
a+b*cos(x)+c*sin(x)
Three Parameter with Max/Min
64
exp(a+b*x+c*x^2)
Three Parameter with Max/Min
65
x/(a+b*x+c*sqr(x))
66
a*x^b*exp(-c*x)
Three Parameter with Max/Min
67
x^a*exp(b-c*x)
Three Parameter with Max/Min
68
a*x^b*(1-x)^c
Beta Distribution Model Three Parameter with Max/Min
69
a*exp((-(x-b)^2)/(2*c^2))
Gaussian Distribution
Model
70
1-exp(-x^a)
Single Parameter Sigmoidally
Shaped
71
exp(-x^a)
Single Parameter Sigmoidally
Shaped
72
1-exp(-a*x^b)
Two Parameter Sigmoidally
Shaped
73
1-exp(-a*b^x)
Two Parameter Sigmoidally
Shaped
74
exp(-exp(a-b*x))
Two Parameter Sigmoidally
Shaped
75
a+b*x*log(x)
Single Term Intercept
76
a+b*x^1.5
Single Term Intercept
77
a+b*x^2
Single Term Intercept
78
a+b*x^2*log(x)
Single Term Intercept
79
a+b*x^2.5
Single Term Intercept
80
a+b*x^3
Single Term Intercept
81
a+b*exp(x)
Single Term Intercept
82
a+b*x^.5*log(x)
Single Term Intercept
83
a+b*log(x)^2
Single Term Intercept
84
a+b*x/log(x)
Single Term Intercept
85
a+b*x^.5
Single Term Intercept
86
a+b/x^.5
Single Term Intercept
87
a+b*log(x)/x
Single Term Intercept
88
a+b/x^1.5
Single Term Intercept
89
a+b*log(x)/x^2
Single Term Intercept
90
a+b/x^2
Single Term Intercept
91
a+b*exp(-x)
Single Term Intercept
DataSight Users Manual Version 2.9.4
Three Parameter Convex/Concave
Gunary Model
Three Parameter with Max/Min
Three Parameter with Max/Min
© 2013 Seveno Pty Ltd
Regression Tool
Model Formula
Number
Model Name
Group Name
92
a+b*x+c*x*log(x)
Two Term Intercept
93
a+b*x+c*x^1.5
Two Term Intercept
94
a+b*x+c*x^2*log(x)
Two Term Intercept
95
a+b*x+c*x^2.5
Two Term Intercept
96
a+b*x+c*x^3
Two Term Intercept
97
a+b*x+c*exp(x)
Two Term Intercept
98
a+b*x+c*x^.5*log(x)
Two Term Intercept
99
a+b*x+c*log(x)^2
Two Term Intercept
100
a+b*x+c*x/log(x)
Two Term Intercept
101
a+b*x+c*x^.5
Two Term Intercept
102
a+b*x+c*log(x)
Two Term Intercept
103
a+b*x+c/log(x)
Two Term Intercept
104
a+b*x+c/x^.5
Two Term Intercept
105
a+b*x+c*log(x)/x
Two Term Intercept
106
a+b*x+c/x
Two Term Intercept
107
a+b*x+c/x^1.5
Two Term Intercept
108
a+b*x+c*log(x)/x^2
Two Term Intercept
109
a+b*x+c*exp(-x)
Two Term Intercept
110
a+b*x*log(x)+c*x^1.5
Two Term Intercept
111
a+b*x*log(x)+c*x^2
Two Term Intercept
112
a+b*x*log(x)+c*x^2*log(x)
Two Term Intercept
113
a+b*x*log(x)+c*x^2.5
Two Term Intercept
114
a+b*x*log(x)+c*x^3
Two Term Intercept
115
a+b*x*log(x)+c*exp(x)
Two Term Intercept
116
a+b*x*log(x)+c*x^.5*log(x)
Two Term Intercept
117
a+b*x*log(x)+c*log(x)^2
Two Term Intercept
118
a+b*x*log(x)+c*x/log(x)
Two Term Intercept
119
a+b*x*log(x)+c*x^.5
Two Term Intercept
120
a+b*x*log(x)+c*log(x)
Two Term Intercept
121
a+b*x*log(x)+c/log(x)
Two Term Intercept
122
a+b*x*log(x)+c/x^.5
Two Term Intercept
123
a+b*x*log(x)+c*log(x)/x
Two Term Intercept
124
a+b*x*log(x)+c/x
Two Term Intercept
125
a+b*x*log(x)+c/x^1.5
Two Term Intercept
126
a+b*x*log(x)+c*log(x)/x^2
Two Term Intercept
127
a+b*x*log(x)+c/x^2
Two Term Intercept
128
a+b*x*log(x)+c*exp(-x)
Two Term Intercept
129
a+b*x^1.5+c*x^2
Two Term Intercept
130
a+b*x^1.5+c*x^2*log(x)
Two Term Intercept
131
a+b*x^1.5+c*x^2.5
Two Term Intercept
132
a+b*x^1.5+c*x^3
Two Term Intercept
133
a+b*x^1.5+c*exp(x)
Two Term Intercept
134
a+b*x^1.5+c*x^.5*log(x)
Two Term Intercept
135
a+b*x^1.5+c*log(x)^2
Two Term Intercept
DataSight Users Manual Version 2.9.4
214
© 2013 Seveno Pty Ltd
Regression Tool
Model Formula
Number
Model Name
Group Name
136
a+b*x^1.5+c*x/log(x)
Two Term Intercept
137
a+b*x^1.5+c*x^.5
Two Term Intercept
138
a+b*x^1.5+c*log(x)
Two Term Intercept
139
a+b*x^1.5+c/log(x)
Two Term Intercept
140
a+b*x^1.5+c/x^.5
Two Term Intercept
141
a+b*x^1.5+c*log(x)/x
Two Term Intercept
142
a+b*x^1.5+c/x
Two Term Intercept
143
a+b*x^1.5+c/x^1.5
Two Term Intercept
144
a+b*x^1.5+c*log(x)/x^2
Two Term Intercept
145
a+b*x^1.5+c/x^2
Two Term Intercept
146
a+b*x^1.5+c*exp(-x)
Two Term Intercept
147
a+b*x^2+c*x^2*log(x)
Two Term Intercept
148
a+b*x^2+c*x^2.5
Two Term Intercept
149
a+b*x^2+c*x^3
Two Term Intercept
150
a+b*x^2+c*exp(x)
Two Term Intercept
151
a+b*x^2+c*x^.5*log(x)
Two Term Intercept
152
a+b*x^2+c*log(x)^2
Two Term Intercept
153
a+b*x^2+c*x/log(x)
Two Term Intercept
154
a+b*x^2+c*x^.5
Two Term Intercept
155
a+b*x^2+c*log(x)
Two Term Intercept
156
a+b*x^2+c/log(x)
Two Term Intercept
157
a+b*x^2+c/x^.5
Two Term Intercept
158
a+b*x^2+c*log(x)/x
Two Term Intercept
159
a+b*x^2+c/x
Two Term Intercept
160
a+b*x^2+c/x^1.5
Two Term Intercept
161
a+b*x^2+c*log(x)/x^2
Two Term Intercept
162
a+b*x^2+c/x^2
Two Term Intercept
163
a+b*x^2+c*exp(-x)
Two Term Intercept
164
a+b*x^2*log(x)+c*x^2.5
Two Term Intercept
165
a+b*x^2*log(x)+c*x^3
Two Term Intercept
166
a+b*x^2*log(x)+c*exp(x)
Two Term Intercept
167
a+b*x^2*log(x)+c*x^.5*log(x)
Two Term Intercept
168
a+b*x^2*log(x)+c*log(x)^2
Two Term Intercept
169
a+b*x^2*log(x)+c*x/log(x)
Two Term Intercept
170
a+b*x^2*log(x)+c*x^.5
Two Term Intercept
171
a+b*x^2*log(x)+c*log(x)
Two Term Intercept
172
a+b*x^2*log(x)+c/log(x)
Two Term Intercept
173
a+b*x^2*log(x)+c/x^.5
Two Term Intercept
174
a+b*x^2*log(x)+c*log(x)/x
Two Term Intercept
175
a+b*x^2*log(x)+c/x
Two Term Intercept
176
a+b*x^2*log(x)+c/x^1.5
Two Term Intercept
177
a+b*x^2*log(x)+c*log(x)/x^2
Two Term Intercept
178
a+b*x^2*log(x)+c/x^2
Two Term Intercept
179
a+b*x^2*log(x)+c*exp(-x)
Two Term Intercept
DataSight Users Manual Version 2.9.4
215
© 2013 Seveno Pty Ltd
Regression Tool
Model Formula
Number
Model Name
Group Name
180
a+b*x^2.5+c*x^3
Two Term Intercept
181
a+b*x^2.5+c*exp(x)
Two Term Intercept
182
a+b*x^2.5+c*x^.5*log(x)
Two Term Intercept
183
a+b*x^2.5+c*log(x)^2
Two Term Intercept
184
a+b*x^2.5+c*x/log(x)
Two Term Intercept
185
a+b*x^2.5+c*x^.5
Two Term Intercept
186
a+b*x^2.5+c*log(x)
Two Term Intercept
187
a+b*x^2.5+c/log(x)
Two Term Intercept
188
a+b*x^2.5+c/x^.5
Two Term Intercept
189
a+b*x^2.5+c*log(x)/x
Two Term Intercept
190
a+b*x^2.5+c/x
Two Term Intercept
191
a+b*x^2.5+c/x^1.5
Two Term Intercept
192
a+b*x^2.5+c*log(x)/x^2
Two Term Intercept
193
a+b*x^2.5+c/x^2
Two Term Intercept
194
a+b*x^2.5+c*exp(-x)
Two Term Intercept
195
a+b*x^3+c*exp(x)
Two Term Intercept
196
a+b*x^3+c*x^.5*log(x)
Two Term Intercept
197
a+b*x^3+c*log(x)^2
Two Term Intercept
198
a+b*x^3+c*x/log(x)
Two Term Intercept
199
a+b*x^3+c*x^.5
Two Term Intercept
200
a+b*x^3+c*log(x)
Two Term Intercept
201
a+b*x^3+c/log(x)
Two Term Intercept
202
a+b*x^3+c/x^.5
Two Term Intercept
203
a+b*x^3+c*log(x)/x
Two Term Intercept
204
a+b*x^3+c/x
Two Term Intercept
205
a+b*x^3+c/x^1.5
Two Term Intercept
206
a+b*x^3+c*log(x)/x^2
Two Term Intercept
207
a+b*x^3+c/x^2
Two Term Intercept
208
a+b*x^3+c*exp(-x)
Two Term Intercept
209
a+b*exp(x)+c*x^.5*log(x)
Two Term Intercept
210
a+b*exp(x)+c*log(x)^2
Two Term Intercept
211
a+b*exp(x)+c*x/log(x)
Two Term Intercept
212
a+b*exp(x)+c*x^.5
Two Term Intercept
213
a+b*exp(x)+c*log(x)
Two Term Intercept
214
a+b*exp(x)+c/log(x)
Two Term Intercept
215
a+b*exp(x)+c/x^.5
Two Term Intercept
216
a+b*exp(x)+c*log(x)/x
Two Term Intercept
217
a+b*exp(x)+c/x
Two Term Intercept
218
a+b*exp(x)+c/x^1.5
Two Term Intercept
219
a+b*exp(x)+c*log(x)/x^2
Two Term Intercept
220
a+b*exp(x)+c/x^2
Two Term Intercept
221
a+b*exp(x)+c*exp(-x)
Two Term Intercept
222
a+b*x^.5*log(x)+c*log(x)^2
Two Term Intercept
223
a+b*x^.5*log(x)+c*x/log(x)
Two Term Intercept
DataSight Users Manual Version 2.9.4
216
© 2013 Seveno Pty Ltd
Regression Tool
Model Formula
Number
Model Name
Group Name
224
a+b*x^.5*log(x)+c*x^.5
Two Term Intercept
225
a+b*x^.5*log(x)+c*log(x)
Two Term Intercept
226
a+b*x^.5*log(x)+c/log(x)
Two Term Intercept
227
a+b*x^.5*log(x)+c/x^.5
Two Term Intercept
228
a+b*x^.5*log(x)+c*log(x)/x
Two Term Intercept
229
a+b*x^.5*log(x)+c/x
Two Term Intercept
230
a+b*x^.5*log(x)+c/x^1.5
Two Term Intercept
231
a+b*x^.5*log(x)+c*log(x)/x^2
Two Term Intercept
232
a+b*x^.5*log(x)+c/x^2
Two Term Intercept
233
a+b*x^.5*log(x)+c*exp(-x)
Two Term Intercept
234
a+b*log(x)^2+c*x/log(x)
Two Term Intercept
235
a+b*log(x)^2+c*x^.5
Two Term Intercept
236
a+b*log(x)^2+c*log(x)
Two Term Intercept
237
a+b*log(x)^2+c/log(x)
Two Term Intercept
238
a+b*log(x)^2+c/x^.5
Two Term Intercept
239
a+b*log(x)^2+c*log(x)/x
Two Term Intercept
240
a+b*log(x)^2+c/x
Two Term Intercept
241
a+b*log(x)^2+c/x^1.5
Two Term Intercept
242
a+b*log(x)^2+c*log(x)/x^2
Two Term Intercept
243
a+b*log(x)^2+c/x^2
Two Term Intercept
244
a+b*log(x)^2+c*exp(-x)
Two Term Intercept
245
a+b*x/log(x)+c*x^.5
Two Term Intercept
246
a+b*x/log(x)+c*log(x)
Two Term Intercept
247
a+b*x/log(x)+c/log(x)
Two Term Intercept
248
a+b*x/log(x)+c/x^.5
Two Term Intercept
249
a+b*x/log(x)+c*log(x)/x
Two Term Intercept
250
a+b*x/log(x)+c/x
Two Term Intercept
251
a+b*x/log(x)+c/x^1.5
Two Term Intercept
252
a+b*x/log(x)+c*log(x)/x^2
Two Term Intercept
253
a+b*x/log(x)+c/x^2
Two Term Intercept
254
a+b*x/log(x)+c*exp(-x)
Two Term Intercept
255
a+b*x^.5+c*log(x)
Two Term Intercept
256
a+b*x^.5+c/log(x)
Two Term Intercept
257
a+b*x^.5+c/x^.5
Two Term Intercept
258
a+b*x^.5+c*log(x)/x
Two Term Intercept
259
a+b*x^.5+c/x
Two Term Intercept
260
a+b*x^.5+c/x^1.5
Two Term Intercept
261
a+b*x^.5+c*log(x)/x^2
Two Term Intercept
262
a+b*x^.5+c/x^2
Two Term Intercept
263
a+b*x^.5+c*exp(-x)
Two Term Intercept
264
a+b*log(x)+c/log(x)
Two Term Intercept
265
a+b*log(x)+c/x^.5
Two Term Intercept
266
a+b*log(x)+c*log(x)/x
Two Term Intercept
267
a+b*log(x)+c/x
Two Term Intercept
DataSight Users Manual Version 2.9.4
217
© 2013 Seveno Pty Ltd
Regression Tool
Model Formula
Number
Model Name
Group Name
268
a+b*log(x)+c/x^1.5
Two Term Intercept
269
a+b*log(x)+c*log(x)/x^2
Two Term Intercept
270
a+b*log(x)+c/x^2
Two Term Intercept
271
a+b*log(x)+c*exp(-x)
Two Term Intercept
272
a+b/log(x)+c/x^.5
Two Term Intercept
273
a+b/log(x)+c*log(x)/x
Two Term Intercept
274
a+b/log(x)+c/x
Two Term Intercept
275
a+b/log(x)+c/x^1.5
Two Term Intercept
276
a+b/log(x)+c*log(x)/x^2
Two Term Intercept
277
a+b/log(x)+c/x^2
Two Term Intercept
278
a+b/log(x)+c*exp(-x)
Two Term Intercept
279
a+b/x^.5+c*log(x)/x
Two Term Intercept
280
a+b/x^.5+c/x
Two Term Intercept
281
a+b/x^.5+c/x^1.5
Two Term Intercept
282
a+b/x^.5+c*log(x)/x^2
Two Term Intercept
283
a+b/x^.5+c/x^2
Two Term Intercept
284
a+b/x^.5+c*exp(-x)
Two Term Intercept
285
a+b*log(x)/x+c/x
Two Term Intercept
286
a+b*log(x)/x+c/x^1.5
Two Term Intercept
287
a+b*log(x)/x+c*log(x)/x^2
Two Term Intercept
288
a+b*log(x)/x+c/x^2
Two Term Intercept
289
a+b*log(x)/x+c*exp(-x)
Two Term Intercept
290
a+b/x+c/x^1.5
Two Term Intercept
291
a+b/x+c*log(x)/x^2
Two Term Intercept
292
a+b/x+c*exp(-x)
Two Term Intercept
293
a+b/x^1.5+c*log(x)/x^2
Two Term Intercept
294
a+b/x^1.5+c/x^2
Two Term Intercept
295
a+b/x^1.5+c*exp(-x)
Two Term Intercept
296
a+b*log(x)/x^2+c/x^2
Two Term Intercept
297
a+b*log(x)/x^2+c*exp(-x)
Two Term Intercept
298
a+b/x^2+c*exp(-x)
Two Term Intercept
DataSight Users Manual Version 2.9.4
218
© 2013 Seveno Pty Ltd
Interpolation Tool
19
219
Interpolation Tool
The Interpolation Tool provides users with the ability to construct new data points within the range of a
discrete set of known data points. The interpolation tool, accessed by right-clicking within the
Datasheet, is a graphical curve fitting feature using spline interpolation to perform functional
interpolation operations.
Spline interpolation divides the selected data range into small subintervals and each of these is
interpolated using the third-degree polynomial. DataSight's Interpolation tool provides the following
Spline types: linear spline, cubic spline and Akima spline.
19.1
Spline type
Description
Linear spline
The linear spline simply involves forming
consecutive data through straight lines, using
existing (known) data points.
Cubic spline
A cubic spline curve is a piecewise continuous
curve, passing through each of the known values.
The resulting curve includes a separate cubic
polynomial for each interval, with matching first and
second derivatives at the supplied data-points.
Akima spline
The Akima method is also based on piecewise
polynomials. The Akima spline is less affected by
outlying data points.
Interpolation Tool
The Interpolation Tool is accessed from within the Datasheet area of DataSight.
1. Users should ensure the variables they wish to review are checked in the Field List and visible within
the datasheet.
2. The Interpolation tool will apply any filters selected in the filter panel and only display data that
applies to the filter.
3. Right-click your mouse in the Datasheet window and select Inte rp o la tio ns .
4. The Interpolation Tool will open.
DataSight Users Manual Version 2.9.4
© 2013 Seveno Pty Ltd
Interpolation Tool
220
Within the Interpolation Tool:
1. Select the Site for the data you wish to review. (This list is limited to the sites currently viewed in the
Datasheet).
2. Select the Variable to be used in the interpolation. Once selected, the data will be displayed in the
graphing area to the right.
3. Select the Interpolation method (Linear, Cubic or Akima).
4. Using either the Data Starts and Ends display or by selecting points within the graphing window you
can select the data start and end points for the interpolation to occur. Left-click your mouse to
select the start point, right-click to define the end point.
DataSight Users Manual Version 2.9.4
© 2013 Seveno Pty Ltd
Interpolation Tool
221
Interpolated data
5. Enter the existing data points between which you wish to create new data points.
6. The user can define the points to be created by the interpolation tool
a) enter the number of points to create between each existing data point.
b) enter the number of points to be created within a nominated time interval (second, minute,
hour, day, month or year) within the selected range of data. For example, Every 15 minutes.
7. Once these options have been entered the points will be displayed within the graphing area of the
Interpolation Tool. This can be seen as the red data points in the graph above.
8. The user can elect to output newly created points to the original variable or another variable in the
database. The default variable is the same as the source data. In the example above, this is Battery
(Volts).
9. When you are satisfied with the interpolation and to create new points in the database press the
S a v e button. Please note, where existing data with the same date and time as the new data points
exist it will be overwritten with the interpolated figure.
DataSight Users Manual Version 2.9.4
© 2013 Seveno Pty Ltd
Scientific Standards
20
222
Scientific Standards
Scientific Standards in DataSight can be used to check and control the data entered for specific variables w ithin a
database against certain specified Scientific Standards.
20.1
Scientific Standards Introduction
Standards are accessed by selecting 'Standards' from 'Settings' main menu.
Use the menu items to create a New Standard and to Save and Delete existing Standards.
DataSight Users Manual Version 2.9.4
© 2013 Seveno Pty Ltd
Scientific Standards
223
You can also Renam e and Delete standard w ith the right click menu items.
Standard Items
Each Standard Item consists of a Variable and it's Minimum and Maximum values to be applied in the specific standard.
Users can add any number of variables into the Standard. The navigation menu can be used to add, delete and submit
standard items.
Each standard item has tw o values, Min and Max. These can both be blank. If this is the case, the standard item is ignored
in all the Standard processes, such as Datasheet analysis and during Import.
DataSight Users Manual Version 2.9.4
© 2013 Seveno Pty Ltd
Scientific Standards
20.2
224
Using Scientific Standards
Standards can be used in several places in DataSight.
Data analysis
Tabular Reports
Import
How to use Standards in the Datasheet for data analysis.
When you create a Standard using Standard interface it w ill be available on the Datasheet by right-clicking on the data
and selecting Standards. Standards w ithin the Datasheet apply the use of Stop Lighting so the Datasheet allow s you
to visualise exceeding standard values in different colors. It uses the color schema associated w ith Stop Lighting.
Datasight w ill show you all the Standards you have created before on the right click menu of Datasheet.
After you select one of Standard you created, Datasheet w ill trace the data and w ill show the exceeding data
different colors w hich are selected in Options.
You can see the one of the samples for Datasight variable pH.
DataSight Users Manual Version 2.9.4
© 2013 Seveno Pty Ltd
Scientific Standards
225
How to use Standards in the Tabular Reports
There are tw o special reports w hich are available through Tabular Report Wizard.
Standards (Exc eeding Data)
Standards Summary
DataSight Users Manual Version 2.9.4
© 2013 Seveno Pty Ltd
Scientific Standards
226
Standards (Exceeding Data) report is show every exceeding data for selected variable(s). A sample output of the
report looks like this.
Standards Summary Report is very similar to Exceeding Data report. It w ill create a report displaying exceeding data
and add statistical information to the end of each section.
A sample output of the Summary Report looks like this.
DataSight Users Manual Version 2.9.4
© 2013 Seveno Pty Ltd
Scientific Standards
DataSight Users Manual Version 2.9.4
227
© 2013 Seveno Pty Ltd
Scientific Standards
228
How to use Standards during Import
Users can also use standard in the Import to check w hether imported data is in the standard limits or not. You can select
w hich standard you w ould like to use in the during the Import process at the 6th Step of the Import Wizard.
You can see the result at the last step of the Import Wizard. If you finished the import all the Import Summary w ill be
recorded into the related Station properties under the Import Audit Log section. For example:
Import:
Import Date&Time:Source File:13/04/2009 11:14:01 AM
Source File:C:\Documents\Seveno\remote\mine\ground water.csv
Number of lines in source file : 404
Import starts from : 2
Import finishes at : 25
Levels:
Level 1 : Remote Mine
Level 2 : Ground Water Monitoring
Variables:
Sample Location ( Field2 ) --> Level 3
Date ( Field3 ) --> Date
Time ( Field4 ) --> Time
Al27(MR) ( Field5 ) --> Aluminium Total (mg/l)
Standards Check:
18/07/2007 9:00:00 AM The import value for Aluminium Total (mg/l) (2.05) is greater than Standard value (0.25).
DataSight Users Manual Version 2.9.4
© 2013 Seveno Pty Ltd
Scientific Standards
229
18/07/2007 9:00:00 AM The import value for Aluminium Total (mg/l) (9.88) is greater than Standard value (0.25).
17/08/2007 9:00:00 AM The import value for Aluminium Total (mg/l) (1.451) is greater than Standard value (0.25).
17/08/2007 9:00:00 AM The import value for Aluminium Total (mg/l) (0.3959) is greater than Standard value (0.25).
DataSight Users Manual Version 2.9.4
© 2013 Seveno Pty Ltd
Flags
21
230
Flags
DataSight Flags can be used to assign and visually identify data for quality coding or quality assurance purposes. Flags
are user-defined and database specific and can be used to clearly label data by colouring the row of data.
21.1
Setting Up Flags
The user can access Flags via the Settings menu.
By default DataSight sets up several Flags for use within the database. The user can elect to edit
these, or delete them to create their own user-defined flagging system.
Create a new Flag
1. To create a new flag, simply click the New button on the Flags toolbar.
2. Enter the flag Description in the blank space (this can be alphanumeric).
3. Select the Index number to assign to this flag. The Index is used to number flags and is useful
when filtering data according to Flag index in the Datasheet.
DataSight Users Manual Version 2.9.4
© 2013 Seveno Pty Ltd
Flags
231
4. Select an appropriate Image from the drop-down menu. The image is simply a visually associated
icon for the selected flag.
5. Assign a background colour to the flag. This colour is used to highlight flagged data in the
Datasheet.
6. When you are satisfied with the selection, click OK. The new flag will be added to the list.
Edit a Flag
1. Double-click the flag you wish to edit and make the appropriate changes.
For exam ple, from this:
to this:
DataSight Users Manual Version 2.9.4
© 2013 Seveno Pty Ltd
Flags
232
Delete a Flag
1. Select the flag you wish to delete and click the Delete button on the Flags toolbar.
2. You will be asked to confirm the delete request. Click OK if you are sure.
21.2
Application Flags
Flags can be assigned for automatic flagging to specific DataSight tasks:
Im port
Data that is imported w ill automatically be assigned this flag.
Conversion
When using the conversion tool the calculated results, or converted data, w ill be assigned this flag
Archive/Read Only
Data that is assigned w ith the Archive/Read Only flag w ill not be editable by any user. Administrator users, or those w ith
appropriate DataSight permissions, w ill be able to assign/remove Archive/Ready Only flags.
1. To set these flags, select the Application Flags button in the Flags toolbar.
2. In the Flag Index column you can select an appropriate flag for each of the above application processes. For example,
some selections are made below .
DataSight Users Manual Version 2.9.4
© 2013 Seveno Pty Ltd
Flags
233
3. The Allow Override function is only applicable for the Conversion. If this option is selected, users are able to change the
flag assigned to specific data using the conversion tool. For example, w hile completing a calculation the user may elect to
flag current 'raw data' w ith an 'edited data' flag as it is modified in the Conversion Tool. If the box is unchecked, these
changes w ill not be allow ed. See Assigning Flags during Calcualtions for further details.
21.3
Using Flags
Flags can be assigned to data
during import.
within the Datasheet.
during calculations in the Conversion Tool.
with the graphical Data Quality interface.
Assigning Flags during Import
Users can set up a specific Import flag within the Application Flags interface. All data imported in to
the database will then be assigned the selected flag.
21.3.1
Flags in the Datasheet
Assigning Flags within the Datasheet
When viewing data in the Datsheet simply select a row(s) of data, right-click and select to Set Flag.
The Set Flag list is populated by the user-defined flags in the Settings menu (created by following the
steps under Setting Up Flags).
DataSight Users Manual Version 2.9.4
© 2013 Seveno Pty Ltd
Flags
234
Data assigned with a flag will be coloured with the selected Flag colour. An example datasheet is
shown below.
DataSight Users Manual Version 2.9.4
© 2013 Seveno Pty Ltd
Flags
21.3.2
235
Flags in the Conversion Tool
Assigning Flags during Calculations
Where a flag is designated as a "conversion flag" in the Application Flags interface any output data in
the conversion tool will be assigned this flag (Example 'Flag 3').
However, if the Conversion flag has the "Alow Override" function checked users are then able to change
the flag assigned to specific data within the conversion tool.
For example, using the Flag Index number within the Conversion Tool the Output Flag can be
calculated, rather than user defined, using an IF statement (or other condition statements).
In the example below, where the result of the calculation (output) is greater than 4.5 the data will be
flagged 2, otherwise it will be flagged 4 - using the statement: IF(output>4.5,2,4).
In another example, if the user wishes to simply flag the output data as an alternative flag to that
assigned in the Application Flags area they can just enter the Flag Index number - see below:
21.3.3
Flags and Data Quality
Assigning Flags with the Data Quality tool
The Data Quality component within DataSight allows the user to quickly and visually assign flags to
data points using the graphical interface.
DataSight Users Manual Version 2.9.4
© 2013 Seveno Pty Ltd
Flags
236
To edit data in the Data Quality interface:
1. Open the Datasheet and display the data they wish to review and flag.
2. Right-click on the datasheet and select Data Quality. The Data Quality window will open.
For example, in the image above depth measurements can be quickly identified and flagged as ‘poor
quality’ or ‘bad’ data or flagged as data verified to be correct, etc.
Use the Above and Below Start Edit buttons to create freehand lines to define the upper and lower
limits for the selected dataset.
Individual points can be edited - drag them up or down to a new value (The date and time will remain
the same).
Clicking Save will make the changes in the database - to any modified data and/or flags (depending
on the check boxes selected).
DataSight Users Manual Version 2.9.4
© 2013 Seveno Pty Ltd
Gaugings
22
237
Gaugings
Gauging Calculator helps you store gauging measurements and get the Total Discharge, Total Area and Mean Velocity.
22.1
Gauging Calculator
The Gauging Calculator module is for storing your Stream Gauging Measurements and for calculation of the Total
Discharge.
The calculation of the discharge from velocity and depth measurements can be made in several w ays.
Mid section method uses averages of the mean velocities in the verticals and of the w idth of the sub divisions.
Mean section method uses the mean velocities and depths at the subdivision point.
DataSight Gaugings are related to the Level 3 in a DataSight database.
Each Level 3 item has it's ow n Gauging storage and can be accessible through right-click menu item at Level 3.
DataSight Users Manual Version 2.9.4
© 2013 Seveno Pty Ltd
Gaugings
238
All the Gaugings related to the specific Level 3 User can be seen in the main gauging form. Main form show s Gauging list
and some of the details for each gauging.
To create new Gauging click
New button. All the properties of the Gauging, including Description, Starting
and Finishing Date and Time, Gauging Method and Starting Bank, can be changed.
DataSight Users Manual Version 2.9.4
© 2013 Seveno Pty Ltd
Gaugings
239
A new Gauging ID w ill be provided after saving the Gauging. Gauging ID's are automatically created by Datasight and
cannot be edited or changed by the user and ID's for deleted Gaugings cannot be used again.
Calculated properties w ill show the values for Mean Staff Gauge Height, Total Area, Mean Velocity and Total
Discharge for the Gauging. These values w ill be refreshed after adding or editing Chainage measurements and are
displayed in the same measurement units as the data being entered. There is also an option to enter these values
manually by clicking the Manual Override checkbox.
To add new chainages or edit chainages click
DataSight Users Manual Version 2.9.4
Chainages button.
© 2013 Seveno Pty Ltd
Gaugings
240
All the chainages can be seen in the Chainages form.
To add new Chainage edit new button.
To edit the chainage double click on the chainage.
Chainages can be edited via Chainage details form.
DataSight Users Manual Version 2.9.4
© 2013 Seveno Pty Ltd
Gaugings
241
You can add multiple observations for each chainage through observations form.
DataSight Users Manual Version 2.9.4
© 2013 Seveno Pty Ltd
Gaugings
22.2
242
Gauging Reports
Gauging report provides summary information for each gauging, chainage details and graph for Segmental Division of
Cross-Section and Segment Velocity Profile. These are created by clicking the Reports button from the Gauging
w indow and selecting Gauging Details or Gauging List.
Here is the report layout of a sample gauging summary report, w hich is created by highlighting the gauging you w ish to
view and selecting Reports, Gauging Details.
Figures and summary data are displayed in the same measurement units as the data that has been entered, w hether that
be metres, cm, feet, inches, etc.
DataSight Users Manual Version 2.9.4
© 2013 Seveno Pty Ltd
Gaugings
243
Here is the report layout of a sample gauging list report, w hich is created by selecting Gauging List from the Reports
button.
Figures and summary data are displayed in the same measurement units as the data that has been entered, w hether that
be metres, cm, feet, inches, etc.
If you select File, Print or click the Print icon, you can "Print to File" and export the gauging report as an xls, pdf, rtf or
other file.
DataSight Users Manual Version 2.9.4
© 2013 Seveno Pty Ltd
Plug In Modules
23
244
Plug In Modules
Plug Ins are used to enable third parties to develop their ow n applications that access the data w ithin DataSight.
DataSight Plug Ins operate w ith both DataSight Desktop and DataSight Enterprise.
23.1
Add a Plug In
To connect a Plug-in to DataSight
1.
Go to the T ools menu and under Plug-Ins select Plug-In Manager.
2.
The Plug-In Manager dialogue w indow appears.
3.
The Window show s the current suite of Plug-Ins installed. You can view the Version number, Author,
Public ation Date and a brief Desc ription of the Plug-In.
4.
Click Add or Remov e to manage your Plug-In suite. Plug-Ins are attached to DataSight through a .dll file located
in the appropriate Plug-In directory on your computer or your local server.
5.
Close the Plug-In Manager to return to the DataSight desktop.
6.
Select T ools, Plug-Ins to view the available Plug-Ins from the drop dow n menu.
DataSight Users Manual Version 2.9.4
© 2013 Seveno Pty Ltd
Troubleshooting
24
245
Troubleshooting
Use this guide to troubleshoot any issues w ith DataSight.
If you do not find the answ er here or elsew here in the Help file then use the Forum or email [email protected] w ith
the issue details.
24.1
General running issues
If you have any issues or errors w hen DataSight opens:
24.2
1.
Check that you are only have one copy of DataSight running. Use the Window s Task Manager to confirm.
2.
Check that no one else is concurrently connected to the DataSight Database.
3.
Ensure you have enough free hard disk space on your machine.
Printing Issues
If you see the message "Default Printer not set" or "Cannot Print to screen" or other similar errors, check that your
Printer/s are setup correctly.
24.3
Importing Issues
If you see the message box:
Check that all import options e.g. File type, Date Delimiter, etc. are appropriate to the file you are importing.
If you get the error message "User var not found during the import"
If you are using an Import Spec, check that all variables defined in the Import Spec are present in your DataSight
Database.
If you see the message box:
1.
Click T ools, Options then select General
2.
in the Temp Data Path box, type or navigate to a new drive location.
3.
Click OK.
DataSight Users Manual Version 2.9.4
© 2013 Seveno Pty Ltd
Troubleshooting
246
If you receive the error "DBISAM Engine Error # 11013 Access denied to table 'C:\Program Files\DataSight
Enterprise\Temp\TempEvent.DAT'."
It is essential that a DataSight user has access rights to the paths nominated in Tools, Options. If users are not able to
w rite to the default paths please change the paths in the Options w indow .
24.4
Exporting Issues
In certain circumstances if you are exporting a database and you uncheck a Level 4 (or Level 4s) under a station you
may get this error message.
In this case the export w ill fail. If this happens re-export the database leaving all Level 4s checked. Then, open the
exported database and delete the Level 4s from w ithin the database itself.
DataSight Users Manual Version 2.9.4
© 2013 Seveno Pty Ltd
Troubleshooting
24.5
247
Merge Issues
Deleting a variable after you have mapped it during the merge process w ill cause the other mappings to scramble.
You w ill need to remap these before proceeding w ith the Merge.
DataSight Users Manual Version 2.9.4
© 2013 Seveno Pty Ltd
Glossary of Term s
25
248
Glossary of Terms
Find the definitions of commonly used terms in DataSight.
csv (Comma separated values)
Files w ith a .csv file extension are "comma-separated value" files. A csv file is one in w hich each value in the cells
of a table row is delimited by and separated from the next value by a comma. The beginning of a row is indicated
by a new line character.
Delimited
Delimited files use a special text character to separate each data value in a record. Typically the delimiter is either a
tab or a comma, but any character may be used. The field delimiter denotes the beginning and ending of a data field
e.g. ;123450; w ith a semi-colon (;) as the field delimiter identifies 123450 as the data value in that field.
dependent variable
A variable w hose value is determined by the value of an independent variable. For example in a graph of
temperature at different depths for a w ater body, temperature is the dependent variable. Any depth from the
surface to the bottom can be chosen to see w hat the corresponding temperature at that depth is. By convention a
dependent variable is plotted on the y axis but w ith DataSight you can choose the x axis if you w ish.
dsd
A single zipped DataSight file containing all the database tables. This file format is suitable for sharing or emailing
databases.
Field List panel
The bottom left screen panel displaying the available data variables in your DataSight database.
Fixed width
A fixed-w idth file contains data in columns, w here each column is a certain w idth, and all values in that column are
the same w idth.
Footer
Footers are fields that follow the main file content and describe characteristics of the file.
Header
Headers precede the main file content and describe the length of the content or other characteristics of the file.
html (HyperText Markup Language)
Files w ith a .html file extension have been created for use w ithin a w eb brow sing interface, such as Internet
Explorer.
Import Spec
A file that contains specified DataSight parameters for importing data (including the mapping decisions).
independent variable
A variable w hose value determines the value of other variables.It is called independent because w ithin a certain
valid range any independent value can be chosen to see w hat the dependent value is. For example in a graph of
temperature at different depths for a w aterbody, depth is the independent variable. Any depth from the surface to
the bottom can be chosen to see w hat the corresponding temperature at that depth is.
By convention an independent variable is plotted on the x axis but w ith DataSight you can choose the the y axis if
you w ish. This can be be helpful in producing depth profiles for example.
DataSight Users Manual Version 2.9.4
© 2013 Seveno Pty Ltd
Glossary of Term s
249
jpg
Files w ith a .jpg file extension are JPEG files, w hich is a commonly used standard method of compression for
graphic images. The name JPEG stands for Joint Photographic Experts Group.
Level 1
An organizational level of data naming, w hich w ill be determined by the type of data you are w orking w ith. In the
case of freshw ater quality data, for example, an appropriate Level 1 may be Lakes, Rivers, Reservoirs etc.
Level 2
The first Data grouping level (w ith Level 1 being the organizational level). For example, in the case of freshw ater
quality data an appropriate Level 2 may be the name of a particular w ater body.
Level 3
The defined physical point at w hich data is collected. This forms the 2nd level in the hierarchy of data grouping
underneath Level 2 and contains Level 4 data.
Level 4
An Level 4 is an occurrence of data sampling w hich occurs at a Level 3. Each Event (Level 4) is differentiated by
its date.
parse
To define something in an orderly w ay. In DataSight, parsing the data enables DataSight to identify the different
features of the data, eg Title Row , Number of Title Row s etc.
pdf
(Portable Document Format)
Files w ith a .pdf file extension are created for easy document exchange betw een users. Documents can be
view ed in the free Adobe Reader program.
rtf (Rich Text Format)
Files w ith the file extension .rtf are created for easy document interchange as most w ord processors are able to
read and w rite rtf documents.
Text Qualifier
Denotes that a text value is enclosed w ithin, eg the data field "Blue-greens" w ithin a text qualifier of double quotes
(") identifies the value Blue-greens as a text value rather than say a numeric value.
txt
Files w ith a .txt file extension are text files. They may contain text and numeric characters.
xls
Files w ith a .xls file extension have been created using Microsoft Excel.
xml (Extensible Markup Language)
Files w ith a .xml file extension can be used for sharing structured data, such as database information, betw een
users - particularly via the Internet.
DataSight Users Manual Version 2.9.4
© 2013 Seveno Pty Ltd
Index
Index
Cumulative
250
28
-D-[-
Daily
[PICTURE _bm56n.bmp]
Data 74
Editing
52
-A-
106
Entering
Add a Plug In
244
Adding and Updating variables
Adding User passw ords
45
40
111
Manual Entry
Parsing
119
74
61
237
Creating
48
68
43
Exporting
Audit Trail Table
Control Documents
95
Database
Compacting
28
Audit Trail
Filtering
Data Quality
38
Advanced Options
39
99
Data pathw ays
Temporary
Admin Group Permissions
Adding 38
Maintaining
95
Exporting
Adding and maintaining Groups and Users
Annual
28
50
Level 3 Properties
50
Level 4 Properties
50
99
Merging
97
Opening
43
Repairing
68
Datasheet 105
Clear Column
Auto-Update
Enable 61
105
Default formats
-C-
Deleting
61
105, 113
Display Options
calculation
157
Calculations
Calendar
Editing
169
Exporting
113
105
Control Documents
40
182
conversion table
178, 187
Conversion Tool
Time Shifting
157
169
157
162
101
117
Copyright Notice
1
33
Date Formats
61
Delimited files
Importing
Discharge
40
113
Deleting variables
Conversion Tool Introduction
Copying Graphs
DataSight Lite
Dates
Setting
169
Copying data
33
DataSight Enterprise
180
Conversion Tool Overview
105, 108
DataSight Desktop
58
Conversion Formulas
Using
113
View ing
Clearing User passw ords
Conversion
99
Saving
Clear Column
108
105
46
81
180
-EEditing data
106
Create and View Graphs
115
Editing or deleting data in datasheet
Creating a new database
43
Example Graphs
csv files
Importing
81
DataSight Users Manual Version 2.9.4
Exporting
Issues
105
121
246
© 2013 Seveno Pty Ltd
Index
Exporting a database
Exporting data
99
-G-
99
Exporting data from a datasheet
99
-F-
Gauging 194, 203
Gauging Reports
Getting Started
74
Filtering data
111
GIS
111
Fixed w idth files
Importing 88
Flow Duration Curves
37
180
Functions
ABS 182
69, 71, 138
Glossary of Terms
Graph
3D
69, 71
115
36
Advanced options
Copying
117
Creating
115
CofV
182
Move
COS
182
Rotate
36
Series
116
182
COTAN
182
182
INDEX
182
INTPOW
182
182
LOG
182
MAX
182
182
NVAL
182
PVAL
RANKASC
182
RANKDSC
182
SIN
182
SQRT
TAN
TRUNC
121
Hourly
39
28
Importing
Data
Default formats
61
74
182
182
88
245
Spreadsheet files
182
33
74
Other delimited files
182
VARIANCE
Graphing Variables
Issues
182
TIMEDIFF
115
Fixed w idth files
182
STDEV
Zooming
Excel files
182
SQR
115
If you are using DataSight Lite
182
SIGN
116
View ing
-I-
182
POW
117
36
-H-
182
MEDIAN
MIN
Toolbar
Group
Adding or Maintaining
182
LOGN
36
36
Using saved
182
FLOOR
61
Setting properties
182
DISCHARGE
EXP
119
Depth Properties
182
COSH
248
Default formats
182
CEIL
34
Google maps
Floating and Docking a Toolbar
3
138
GIS Information
Filtering using Relative Date/Time
ATAN
245
Get the the latest version
2
Fields
Mapping
LN
237
General running issues
Feedback
251
81
74
-JJPG
117
182
DataSight Users Manual Version 2.9.4
© 2013 Seveno Pty Ltd
Index
Data List
-LLevel 2
Adding or deleting
44
Level 3
Adding or deleting
44
Properties
Look and feel
61
Look Up Tables
34
40
40
28
Plug In Modules 244
Add a Plug In 244
Preferences
Print
Setup
34
95, 106
69, 71
Mapping
69, 71
Mapping Fields
34
Permissions
Setting 40
191, 192
Manual Data Entry
74
61
35
Printing
Issues
245
Properties
Graph
117
-Q-
95
28
Menu Bar and Datasight Toolbar
Merge
Issues
35
Quick Tour: Graphs
97
47
211
28
Quick Tour: Layout
7
Quick Tour: Merge
21
Quick Tour: Notes
32
10
28
-R-
-OOpening a database
Operators
Analytic Operators
Logical Operators
Paranthesis
Rank
43
182
182
182
180
Rating Table 178
Conversion Table
Receiving a .dsd file
Regression Tool
Conversion Table
194, 203
94
194
Regression Analysis
61
Relative Date/Time filtering
-PPage
Setup
23
Quick Tour: Reports
101
9
19
Quick Tour: Importing Data
Models
Regression Models
Options
Setting
6
Quick Tour: Exporting Data
Merging variables
Moving data
Quick Tour
Quick Tour: Database Variables
247
Merging a database
Montly
Graph
PDF
44
Main Window Layout
Means
34
Passw ord
Adding
-M-
MDE
Filters
Clearing
Level 4
Adding or deleting
57
34
Saved View s
52
Properties
34
Field List
44
Map
34
Datasheet
Level 1
Adding or deleting
252
194, 203
111
Renaming and deleting Graph Series
116
Repairing and compacting the Database
35
Page orientation
61
Panel
DataSight Users Manual Version 2.9.4
Report Wizard
28
Reports 28
Print to File
147
68
© 2013 Seveno Pty Ltd
Index
Scheduler
Reports 28
Printing 140, 147
Report Creator
Saved View s
Scheduler
Tabular
Graph
140
Menu
147
Right click menus
RTF
Toolbars
DataSight
147
140, 153
Templates
153
Temporary data pathw ays
140, 147
35
35
txt files
Importing
28
81
113
Graphs
116
Reports
147
Updates
Getting
Scheduled Datasheet
Scheduled Graph
Scheduler
3
User
Adding and maintaining
153
153
Passw ord
Scheduling tasks
153
Scientific Standards
Importing 222
Tabular reports
Using this Guide
Group permissions
Deleting
37
38
dragging
115
115
User passw ords
37
independent
User permissions
37
Merge
Version
Latest
116
Setting and Changing Graph Properties
113
Setting Security
Setting User Permissions
SQL View s
43
40
28
3
Water Quality
Style settings
61
105
194
Who this Help file is for
Layout
110
34
34
-YYour feedback
-T-
33
132, 144
Window
DataSight
110
Summary Statistics
47
View ing/Editing Data
w ind rose
138
Statistics
Summary
115
-W-
38
Setting up the Datasight Database
Special reports
117
45
46
dependent
Series
Renaming and deleting
33
Variables 121
Adding or updating
38
37
Setting for the first time
116
-V-
222
Security
Admin Group Permissions
Setting dates
40
Using Saved Graphs
222, 224
39
40
Permissions
153
Setting
33
-U-
Saved View s
Datasheet
Tabular
245
Typographical conventions
-S-
61
35, 36
Troubleshooting
37
253
2
28
Tabular Reports
140
Task
DataSight Users Manual Version 2.9.4
© 2013 Seveno Pty Ltd
Notes


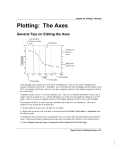


![AudioBox AB64 ABEdit Software User Manual [PDF Format]](http://vs1.manualzilla.com/store/data/005983205_1-2265185b3c4bf7986bc4222e13230c75-150x150.png)