1
Viewing Web Filter Reports
5.
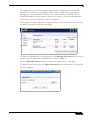
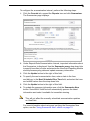
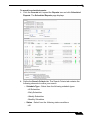
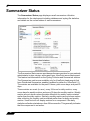
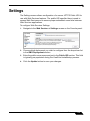
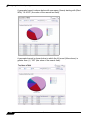
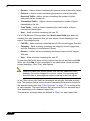
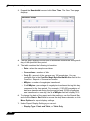
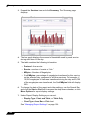
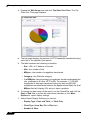
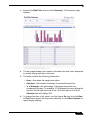
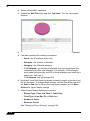
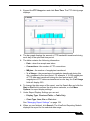
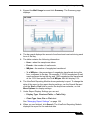
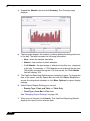
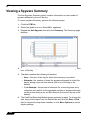
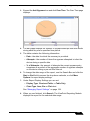
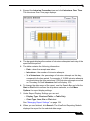
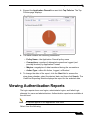
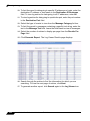
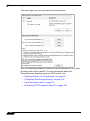
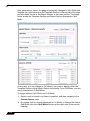
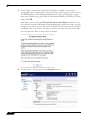
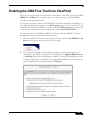
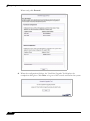
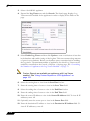
The table contains the following information:
– Users—the IP address of the user.
– Attempts—the number of attempts.
– Category—the Web site category.
– % of Attempts—the percentage of attempts to access the blocked
site, compared to all other user attempts. For example, if 500 attempts
were made during the period and 250 of those attempts were made by
a single user, his % of Attempts field will display 50%.
6.
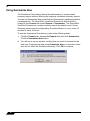
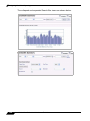
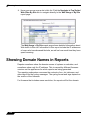
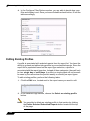
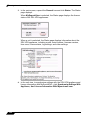
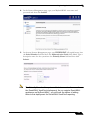
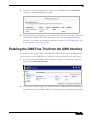
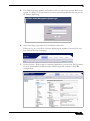
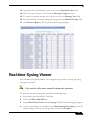
To change date range of the report, use the Search Bar and click the Start
or End field to access the drop-down calendar, or click More Options for
display settings.
7.
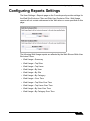
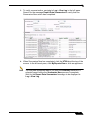
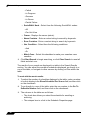
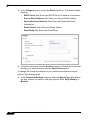
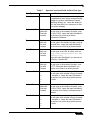
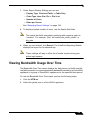
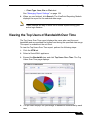
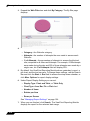
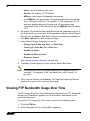
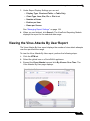
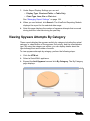
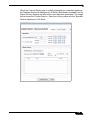
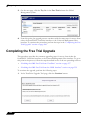
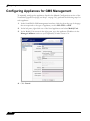
Under Report Display Settings you can set:
– Display Type: Chart and Table, or Table Only
– Chart Type: Area, Bar, Pie or Plot chart
– Number of Sites
– Rows per Screen
See “Managing Report Settings” on page 154.
8.
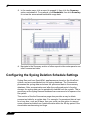
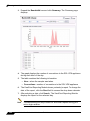
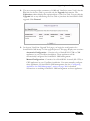
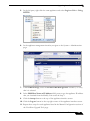
When you are finished, click Search. The ViewPoint Reporting Module
displays the report for the selected date range.
Viewing Blocked Sites for Each User Over Time
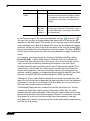
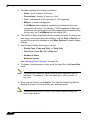
The Web Filter By User report displays the top blocked Web sites that each
user attempted to access during the specified time period.
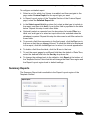
To view the By User Over Time report, perform the following steps:
222
1.
Click the UTM tab.
2.
Select a SonicWALL appliance.
SonicWALL ViewPoint 6.0 Administrator’s Guide