1
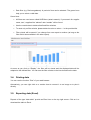
User manual: Information system
This document describes the usage of SICK’s information system / reporting system in
Pool4Tool. This system provides KPIs and reports which can be used by both SICK and its
suppliers.
User manual: Information system .......................................................................................... 1
1.
Introduction .................................................................................................................. 2
2.
Accessing the information system ................................................................................ 3
2.1. For SICK employees ............................................................................................... 3
2.2. For suppliers ........................................................................................................... 3
3.
Functions in the information system ............................................................................. 4
3.1. navigation ................................................................................................................ 4
3.2. Report types ............................................................................................................ 4
3.2.1.
Charts .............................................................................................................. 4
3.2.2.
Data table......................................................................................................... 5
3.3. Select data (setting filters) ....................................................................................... 5
3.4. Printing data ............................................................................................................ 7
3.5. Exporting data (Excel) ............................................................................................. 7
1. Introduction
The information system provides KPIs to measure and control the procurement processes of
SICK.
2. Accessing the information system
2.1. For SICK employees
You can find the information system in Pool4Tool under CRM / SRM and then information
system. https://www.pool4tool.com/login.php
2.2. For suppliers
Suppliers can find the information system at the bottom of the menu-box on the left side of
the entry page at the SICK supplier portal. https://www.pool4tool.com/portal/sick/login.php
3. Functions in the information system
3.1. navigation
To open a specific report, please select it in the menu-box.
3.2. Report types
Two types of reports can be found in the information system.
3.2.1. Charts
Charts can be identified by the blue symbol (e. g. turnover development) – data will be
displayed in graphical format (bar chart, line chart…)
3.2.2. Data table
Reports of this type display data in a table format and can provide more detailed information
than charts. This data can be downloaded to Excel in order to perform further analysis (see
chapter 3.4).
3.3. Select data (setting filters)
For each report a filter is available. This filter allows you to adapt the displayed data to your
current requirements (e. g. turnover of supplier X, delivery performance of material group
Y…). As long as no filter is defined, all available data will be displayed.
By default, the filter is invisible in order to provide more space for the reporting data. In order
to show the filter, please click on the plus symbol in the filter box (see red square in previous
picture).
Now it is possible to define a combination of filter criterias. Use the button “Display” to
activate your filter. The following filter types are available:
•
Single selection (e. g. Division): Select one value in a list
•
Multiple selection (e. g. Warengruppe): Select one or several values in a list (use Ctrl
+ MouseClick or Shift + MouseClick).
•
Free filter (e.g. Lieferantennummer): Any value can be entere as filter criteria. To
define more than one value, a semicolon can be used. Use „53052;53011“ to display
all which contains either 53052 or 53011 (or both).
•
Date filter (e.g. Rechnungsdatum): A period of time can be selected. The green icons
help you to select a valid date.
Some hints:
•
All filters are used as so called LIKE-filters (asterix search): If you search for supplier
name „test“, suppliers like “abctest” oder “testabc” will be found.
•
Use the reset button to delete all defined filter criterias.
•
To reset only on filter criteria, please delete its value or select --- in the provided list.
•
Filter criteria will be saved if you change from one report to another (as long as the
filter field is also available in the other report).
As soon as you click on “Display”, the filter will be closed and the displayed data will be
adapted to the defined filter. You can see the filter criterias in the blue box above the data.
3.4. Printing data
You can use the function “Print” of your web browser.
Alternatively, you can right click on a certain chart to convert it to an image or to print it
directly.
3.5. Exporting data (Excel)
Reports of the type “data table” provide an Excel icon on the top right corner. Click on it to
download the table to Excel.