1
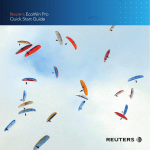
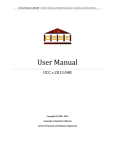
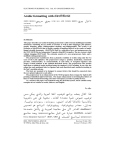
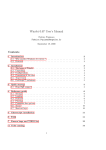
KEYNOTE ADDRESS: Portable Graphics in TEX Malcolm Clark Information Resource Services Polytechnic of Central London 115 New Cavendish Street London W1M 8JS England Phone: 44 – 71 – 269 – 3555 x3567 Internet: [email protected] To a very large extent, TEX was designed for the placement of characters on a page. It was implicitly assumed that the characters were probably alphabetic or mathematical. Nevertheless, Knuth notes If you enjoy fooling around making pictures, instead of typesetting ordinary text, TEX will be a source of endless frustration/amusement for you, because almost anything is possible. . . While it is well able to draw horizontal and vertical lines, or even to plot dots more or less at random (see, for example, Knuth, 1986, p.389, and Figure 1), most people expect a little more from their graphics. There is also an architectural limitation: although TEX could easily simulate an arbitrary continuous curve by placing a very large number of small dots (or rules) on the page (or screen), TEX was only granted a finite memory. You quickly run out of memory. This is all the more distressing since there now exist versions of TEX with small and large amounts of memory (basically related to the addressing ability: 64-bit TEX on a Cray has potentially much more memory than 16-bit TEX on a pc: TEX-in-unix is generally somewhere in between). Sadly, this has had the effect of making TEX documents less portable, and seriously undermines TEX’s claim to universality. TEX is universal, but the documents may be restricted to certain versions — and you won’t necessarily know until you try to process them (and run out of memory, or not). This article is reprinted from Chapter 17 of A Plain TEX Primer, by Malcolm Clark, Oxford University Press, 480pp, November, 1992. (0 8) ; (4 7) (10 8) ; ; (3 5) ; (1 1 5) (4 2) ; : ; (0 0) ; (14 0) ; (;1 ;2 5) ; : Figure 1. Simple graphics within TEX All sorts of diagrams have been created using TEX. References to some of these are given in the bibliography. There are three major ways in which graphics may be made part of TEX documents. For simplicity and brevity, ‘graphics’ is restricted principally to line graphics, but most of what is covered can be generalized. As with most things, the more limited the capabilities, the closer they may be to universality. High degrees of sophistication usually mean greater restrictions are present. Attention is directed here to techniques which have some claim to generality: the ‘running on my Sun workstation using proprietary software’ solution is ignored as far as possible. The vain hope is that someone working on their Macintosh will be able to exchange TEX documents with someone working on an IBM pc, an Amiga, an Atari, a NeXT, a Vax under VMS, and so on up the scale until we reach the supercomputer league. We do not wish to present solutions which only work on specific boxes. unix may be the de facto operating system, just as PostScript is the de facto page description language. But there are more non-unix boxes out in the world than there TUGboat, Volume 13 (1992), No. 3 — Proceedings of the 1992 Annual Meeting 253 Malcolm Clark are unix boxes. Similarly, there are more nonPostScript output devices than there are PostScript outputs. If everybody were to standardize on the same computing box many problems of interchange would go away, but this is unlikely to happen. Interactive preprocessor Photographs (scanner) Maths & text typesetting language e.g. TEX ? SGML Special Fonts J This first approach is limited, but very general — it will work with TEX and any of its drivers. It is possible to use special fonts to build pictures. Again there are three main ways to do this: the first is through simple font elements (that is, straight line segments, or curves) which can be assembled to give (fairly simple) pictures. The second is through METAFONT. Here, we use METAFONT to create a single character which is our graph (or whatever). This seems intimidating, but need not be. And lastly, we can create special fonts without METAFONT. Simple font elements. So, start with the simple font elements. Knuth gives an example in The TEXbook, pages 389 – 391, but the font he uses is not generally available. Alternatively, LATEX already does this, in its picture environment (cf. Lamport, 1986, pp.101 – 111). Unfortunately Lamport did not develop this to the same extent as the rest of LATEX, and it has a distinctly ‘squared graph paper’ feel. But it is certainly possible to create quite attractive graphs. Any vertical and horizontal elements are just standard TEX rules, while rounded corners and circles can be made from the LATEX circle fonts — (Figure 2). A small range of diagonals is possible through other special line fonts — ✁✁✂✄✆. The LATEX picture environment is amazingly modular. In other words you can rip it out of LATEX and run it in plain TEX, using the same basic commands which are documented in the LATEX book. Although creating pictures this way is time consuming, it can give quite pleasing quality (at least on the laser printer). Quite acceptable bar charts may be created, as Nagy (1989) shows (Figure 3). It is possible to tackle chemistry through the use of these fonts, as Figure 4 demonstrates. In this case some of the tedium is removed by creating the ring structure only once, storing it in a box, and then copying that box when it is needed. Besides making the procedure less long winded, it cuts down on the effort needed by TEX itself, since copying a box requires no new manipulations. The creation of diagrams like this can be amazingly tedious, but the approach still achieves a generality and portability which cannot be ignored. Æ 254 Word Processor e.g. WordPerfect J Illustrations e.g. GemDraw J J J J Q Q J Q J Q Q J Chemical structure editor, e.g. ChemDraw Page makeup e.g. Ventura ? J^ Q Q Qs - Graphs e.g. Gino-F + via PDL e.g. PostScript Printed page ? Figure 2. Using the LATEX fonts, from Norris and Oakley (1990) Computing Costs 0 10 20 30 40 50 60 70 80 90 100 Jan Feb Mar Apr May compute other disc-space geoid Key: Super '88 Chapman Conf Jun Figure 3. Bar chart, from Nagy (1989) J J J J J J J J J J J J J J J J J J J J J J J J J J J J J J Figure 4. Simple chemistry with LATEX fonts, from de Bruin et al. (1988) Because of this generality, there are some pre- TUGboat, Volume 13 (1992), No. 3 — Proceedings of the 1992 Annual Meeting KEYNOTE ADDRESS: Portable Graphics in TEX s s X X X s X A A = (0 1) C A C A C A C s H s A H H The parabola = 2 4 before rotation A H H . ... . . ..... .... ... F ; .... .... . .. ... . .... ..... .. .. .... .... . .... ............ .... . . .... . ........... .... . . . . . . . . ................. . ... .... ... ............ ..... ....... . ...... . . ... .. ..... . . ...... ....... ....... ....... . ....... ......... .......................... ................ . y A H H A H H H A x = .. .. ... ... ... ... ... F ; ... . .... . ... ........ .... ....... .. ... .... ..... .. .......... . .... ....... .. ....... ..... . .. .......... ...... . . ..... ....... .. ........... .. .. . ...... . . . . ..... ........... ...... ........ ....... ... . . . . .............. .... ................................. = (0 1) After rotation about the focus by 15 F s s Figure 6. PICTEX graphics, from Wichura (1987) s s s s s Figure 5. Bézier curves and control points, from Beebe (1989) processor programs which will allow you to create something interactively which is then transformed into LATEX commands. If you have access to a unix system, gnutex can assist. On an msdos system, part of the emTEX package does just this (although it adds a few extra features of its own). The key drawbacks of the LATEX special font approach are centered around the limited fonts which are available, both in the slope of lines and their thicknesses, and the limited range of curves. These very limited resources can be encouraged to generate quite an amazing range of possibilities. But an enormous amount of time and effort is also required. Having said this, traditionally a tremendous amount of effort had to be expended to create diagrams like these anyway. In this way we have a single document, and the opportunity to revise. An advantage of course is that everything is in (LA)TEX, so that we can ensure that the relative weights of lines, the font sizes, the symbols, blend in well with the rest of the document. This is a feature which we should not ignore. A further advantage is the ability to preview the diagram on the screen. Since the METAFONT descriptions of the fonts are available, the screen fonts may also be generated. The use of the rules might indicate that you could build the most complex curves out of small rectangular boxes: make them small enough and it will not be possible to see the join. In fact, an extension to LATEX picture environment is the bezier style, which allows a bézier curve to be plotted (see Figure 5). Make too many of them and TEX runs out of memory. Resolution becomes an issue if we try to create continuous curves from small elements. If TEX memory fills up quickly at 300 dpi, it will fill up even more quickly at 1270 dpi. It is difficult to claim device independence when we must take resolution into account. We can of course ignore the resolution problem, but on those times when we want to produce high-quality graphs, we may be disappointed by the faithful rendition of those 300 dpi blobs, and the angular ‘staircasing’ which is all too obvious at the higher resolution. The creation of bézier curves is a remarkable achievement, given TEX’s limited arithmetic capability. Adding two numbers together is awkward enough, and when we realize that TEX will only use integers in a rather limited range, the results are all the more surprising. Since the picture environment is rather crude, one or two people have put higher-level commands around them. The two best known are PICTEX and epic. PICTEX (Wichura, 1987) can be run with both TEX and LATEX (Figure 6). The commands for PICTEX are distributed freely, but the 85 page manual is essential in order to use it sensibly. This article has already loaded quite a few picture-drawing commands and many of the allocation registers are becoming filled up. While it is no real problem to stick to (say) the picture environment, once we start mixing in extra commands the limitation to 256 counters, boxes, dimensions, and token strings starts to hurt. The syntax of the commands required by PICTEX seems quite reasonable, if quirky at times. It is no worse than many commercial plotting packages like SAS or SPSS. But even if we have enough room for allocation of the registers, running with PICTEX and LATEX, on a 32-bit TEX, it is still possible (but not easy) to exhaust the available memory. And given the amount of arithmetic going on in the background, these diagrams tend to be slow. TUGboat, Volume 13 (1992), No. 3 — Proceedings of the 1992 Annual Meeting 255 Malcolm Clark x ? ? 1.25 1=m 1.20 + + + 1.15 + 1.10 ++ +++ ++ ++ + + + + + 1.05 75.0 80.0 85.0 90.0 95.0 100.0 T [K] ;! Figure 7. Reciprocal magnetic susceptibility, from Ramek (1990) Olivier (1989) describes an amalgam between S, the unix statistical package, and PICTEX. Clearly this is restricted to unix in the first instance, although the PICTEX would be portable. Although epic (Podar, 1986) was targeted for LATEX it can also be used in TEX. It lacks the generality of PICTEX, but is a useful extension. Podar added some higher-level commands in order to provide a ‘friendlier and more powerful users interface’. In particular he managed to reduce the amount of manual calculation required. For example, he introduced a \drawline command which allows specified points to be connected. In order to avoid the problem of slope segments outside LATEX’s ability, he uses the closest slope available. This can lead to rather jagged lines. If the lines are dashed, this problem appears less acute. There are several collections of commands which draw all sorts of rather nice graphs. My favourites are those of Michael Ramek (Ramek, 1990). Figure 7 is taken from his paper and helps illustrate the scope that is possible. Besides the ‘normal’ graph requirements, he provided some other commands to draw chemical structures as shown in Figure 8. Other fonts. So far we have been discussing the use of special fonts. Of course, we can also generate our own. There are two different directions here. On the one hand we can use some suite of other fonts; on the other we could generate METAFONT descriptions somehow and use those descriptions. In both cases there is appreciable generality. In the final analysis, METAFONT is as portable as TEX, and once the descriptions are made available we are 256 CH3 N O N C C C C N H N C CH3 CH3 O Figure 8. Caffeine as free to use those as we would be to use (LA)TEX commands. Knuth (1987) introduced some halftone fonts which allow greyscale ‘pictures’ to be typeset in a completely device independent way. Adrian Clark (1987) also made some contribution to this, and Hoenig (1989) shows some interesting examples. Since the descriptions are available, anyone may ‘borrow’ them quite easily. Adrian used a Fortran program as a pre-processor. This is fair, since for all sorts of reasons we would normally expect the data to be provided in a digital form from some other source. There are problems of TEX memory here again. Even with a ‘big’ version, TEX may only handle one 512 × 512 picture (or four 256 × 256 pictures). Knuth’s paper discusses some manipulation techniques which would allow greater clarity from lower-resolution pictures. This is a fairly general and well-understood aspect of image processing which need not concern us here. The point is that it is quite possible and represents no new addition of hardware or software. An alternative use of METAFONT is to view it as a means of describing an arbitrary picture, not a typeface. All the tools are there to do it, and in fact it is really a lot simpler than creating fonts. Of course, you do not really do it in METAFONT; you do it in something else, which is then translated to METAFONT. The something else at the moment is one of several programs by Rick Simpson (Simpson, 1990), which works on the IBM RT (running AIX, a unix lookalike), or Metaplot (Pat Wilcox, 1989). This latter was written in C, and is available in a number of forms. There is at least a pc version, an Amiga version, and lots of unix versions. In both cases, what comes out at the far end is a single (very large) character (or even a set of characters which are ‘tiled’ together), which you plot wherever you want. The disadvantage is that scaling the picture is tedious (just like scaling a ‘normal’ character), and editing it requires a re-run TUGboat, Volume 13 (1992), No. 3 — Proceedings of the 1992 Annual Meeting KEYNOTE ADDRESS: Portable Graphics in TEX of METAFONT. But it is device independent. The only proviso is that the device driver be able to handle these very large characters. This is not a trivial expectation, since many drivers were written expecting that they would be dealing with letters, and that there was some reasonable maximum size to a letter. Wilcox did not really expect the user to write in her ‘Metaplot’. The notion was that a variety of other, arbitrary, plotting languages could be mapped onto the Metaplot commands, which were then shipped to METAFONT. CGM, or Computer Graphics Metafile, is worth considering too. It has a couple of features which we ought to bear in mind. It is an international standard. Nominally, every graphics package ought to have the facility to generate CGM, and also to read it in. The metafile should also be able to be transmitted over electronic networks with the minimum of fuss. The other feature is that CALS (Computer-aided Acquisition and Logistics System) has adopted CGM as one of its components: while we may worry about the militaristic background of CALS, it has done much to revitalize and make acceptable sgml, and we can expect it to help in the adoption of CGM. One other component of CALS is that it has adopted another ‘graphics’ standard, IGES. IGES is usually described as a de facto standard; it was developed principally for use with CAD-CAM software. Nevertheless, it does offer another routeway. In essence there is no real reason why Metaplot could not read an IGES file and transform it to METAFONT form. Since we are in the real world of ‘standards’, Heinz (1990) notes that GKS (Graphics Kernel Standard) may also be transformed into TEX. Another route to create a character. If we look a little more closely at what a driver actually requires to set a character, we note that there are two items: the pixel file, and the TEX font metric file. Conventionally, the route to produce these is METAFONT, but there is no particular reason why we should have to adopt this route. Provided the tfm and pk contain appropriate information, the driver should be able to typeset. The underlying idea here is that we can have another program take (say) a grey-scale picture and process it to produce both the required files. The tfm file should be simple enough to produce, even by hand, since we might make this ‘font’ have only one character at a time. The property list would be fairly simple. A traditional pixel (or pxl) file only contains binary information, so we are back in the realms of image processing or half toning if we wish to do something rather fancy. Most drivers now accept ‘packed pixel’ rather than ‘pixel’ information. This is simply a far more compact form of the same information. Simpson (1990) also describes an application of this approach. The example he chooses takes a raster image and turns it into a font. The program imtopk converts an impart image processing file into a pk/tfm pair. impart handles the image scaling, allowing for device pixel density, does any filtering necessary, and converts an n-level grey scale to two levels. TEX positions the image on the page, typesets any annotation, and handles any other typesetting. At Texas A&M University, a similar approach is used where output from a number of graphics programs, but especially the graphics software package ‘Disspla’, is processed to produce the pk/tfm pair. This has some appeal since Disspla runs on a very wide variety of machines, and may even be called from programming languages. A drawback of this approach is that it is difficult to annotate the diagrams with fonts similar to the ones used in the TEX document. Special Now to the less general: any sort of material may be incorporated in a \special. Whatever appears there is passed directly to the dvi file, where it will be handled by the dvi driver. For example, we could have PostScript commands in there (or even a reference to a file containing a PostScriptcreated graphic). The problem is that you also need a driver which knows what to do with the information, and a device (printer/screen) which can display the information. While PostScript is described as a de facto standard, not everyone has access to a PostScript device, and in fact more Hewlett Packard (and compatible) machines are out there in the real world than anything else. This actually opens up another route. While we could easily include a complete graphic produced by another approach (one of the vast array of graphics packages which will produce PostScript), and probably scale or otherwise modify it, we can also pass simpler information to the dvi file for processing by the driver. Maus and Baker (1986) extended the LATEX picture environment by adding a whole host of commands, which, when examined closely, are little ‘specials’ which do things like draw a line of arbitrary slope through PostScript commands. Now TEX does not process anything; therefore TEX’s memory does not fill up. When printed (on a PostScript device), the line is there. TUGboat, Volume 13 (1992), No. 3 — Proceedings of the 1992 Annual Meeting 257 Malcolm Clark Unfortunately, only a few screens are PostScript devices, and so we don’t usually expect to see these elements previewed. One other disadvantage of using specials is that the form of specials is by no means standardized. Although there is a working party (TUG, 1992) attempting to standardize and issue recommendations, they are facing the usual problems of standardization committees. One of the recommendations is that a level 0 driver should be able to place at least 1000 rules and 20,000 characters on a single page, unless the output device is constrained in some way. On-board device memory may be limited and limit these ideal minima. Recall that well over half of the drivers written for use with TEX reside in the public domain. No commercial forces come into play with them, nor can the TEX Users Group impose rules (it is there to serve its members, not police them: in general this sort of anarchy works, since there is enough goodwill around). What we are coming to is the fact that specials have to be written with a specific driver in mind. To give an example: imagine we want to ship out a couple of PostScript commands, represented by <command>. Using Textures on the Macintosh, which has its own built-in driver, you could say \special{postscript <command>} that any changes should be local (in TEX terminology). The portion of psfig which deals with the \specials is well separated, and it is possible to modify that part of the command suite for particular drivers. You could reasonably ask why we do not include CGM files in \specials. In fact, this has been done (Andrews, 1989). Provided the driver can handle the commands and change them into the correct form for the output device, any sort of file can be processed. As noted earlier, the dvi is itself a sort of metafile. Andrews’ extensions work for unix and VMS environments. PostScript is not yet ubiquitous. Fortunately, there is also an approach which allows us to use a Hewlett Packard LaserJet — capture (Pickrell, 1990). Any program which produces output for a LaserJet can have that output processed with capture to produce a file which may be input to TEX, through some suitable commands (which will, somewhere, employ \specials). Again, this sounds longwinded, but there are a great many programs which will do this. Even more remarkable, there are programs which can take PostScript and turn it into LaserJet form (Freedom of the Press, GoScript, Ghostscript, etc.). This means that we are now relatively independent of PostScript. Using ArborText’s (1987) PostScript driver, Dvilaser/PS, the command is \special{ps:: <command>} A few years ago the notion of ‘little languages’ became current. This is a scheme which is found most generally in unix. Instead of adding features to troff, ‘little languages’ were created: preprocessors which massaged some reasonable form of input into troff. These include chem (for chemistry), tbl (for tables), eqn (for equations), grap (for general graphs), and pic (for pictures). The one we are interested in is pic and perhaps grap: pic has a language which allows creation of line diagrams with embedded text. Sounds simple. Of course, with the way that unix works, it is ‘easy’ to write a command line which hides all the ‘little language’ bits and pieces from the end user. How is this relevant? Recall that TEX passes \special information straight to the dvi file. That information could easily be special commands which the driver could interpret. If we pass PostScript commands, then the driver can handle PostScript (maybe). What if we pass higher-level commands which the driver then processes to produce a new dvi file? In other words, a dvi to dvi processor. The new dvi file would, among other things, be able to be previewed, or be sent to any suitable Using the public domain dvips, the structure is \special{pstext=<command>} or using another public domain driver dvips (Tom Rokicki), the equivalent is \specialps: <command> or \specialps:: <command> while Nelson Beebe’s driver (Beebe, 1987) appears to have no way of including a single command (you could obviously use the facility to read in a file, which itself contained only one command); similarly, Personal TEX’s PostScript driver (Personal TEX, 1987) appears to lack the ‘in-line command’ feature. Trevor Darrell (1987) wrote a useful set of commands, psfig, which greatly ease the problems of incorporating PostScript into a document. The PostScript is really ‘encapsulated’, since the ‘bounding box’ information is required. ‘Encapsulated’ also implies that the PostScript should not change the state of commands — in other words, 258 In Betweens TUGboat, Volume 13 (1992), No. 3 — Proceedings of the 1992 Annual Meeting KEYNOTE ADDRESS: Portable Graphics in TEX printer (provided you had the correct dvi-to-printer driver). So what we end up with is a device independent method. There are a couple of attempts to do this. There is a program around called dvidvi (Rokicki, 1989) which processes a dvi file, but only so that you can rearrange the pages — say to shrink them to thumbnails and arrange them all on a single sheet (actually very useful for book make-up). Mike Spivak (1989) has provided dvipaste which allows you to ‘paste’ a dvi file into another dvi file, so that you can put a table (which gobbles up space in TEX) where you want (equally it could paste in a large picture — and that is why it has been mentioned here). And lastly, the one that really does pictures, Rolf Olejniczak’s texpic (1989). This is a TEX implementation of pic which does all the things that pic does and more, and works in just the way outlined. What is the snag? The driver has to be implemented on all sorts of different machines. We are gnawing away at the portability. Including PostScript or Hewlett Packard’s laser printer language seems also eminently non-portable. At least this localizes the problem and in the longer term gives a far more general solution. Olejniczak’s program is available only for ms-dos, and is currently proprietary, although it is not especially expensive. It is the restricted platform which is the real problem. Closing Comments Beebe (1989), Rahtz (1989), and Heinz (1990) have all contributed to the discussion of incorporating graphics into TEX documents. The adoption of the METAFONT and pk/tfm solution goes some way to ensuring the transportability of documents. None of the other approaches yet comes close enough to being capable of being transmitted over fairly arbitrary networks. Another advantage of this approach should be the capability of viewing the diagrams on the screen, as well as on paper. The tools which enable these transformations ought to be part of the standard TEX distributions. Within a closed environment, any solution which works is to be applauded. But one of the major features of TEX is its ‘open’-ness, and the portability of documents created with TEX. It will have become apparent that we are always in the hands of the drivers available. This is perhaps the weakest link in the whole chain. Whether you regard the drivers as part of TEX or not depends on your viewpoint. It is perhaps wise to remind ourselves that even in the days of Johann Gensfleisch zum Gutenberg the integration of text and illustration (through woodblocks) took some time, and could only be achieved after agreement with the professional woodblock cutters. Bibliography Andrews, Phil. “Integration of TEX and graphics at the Pittsburgh Supercomputing Center.” TUGboat 10(2), pages 177 – 178, 1989. ArborText. Dvilaser/PS User Manual, 1989. Beebe, Nelson H.F.. “A TEX DVI Driver Family.” TEXniques 5, pages 71 – 113, 1988. Beebe, Nelson H.F. “TEX and Graphics: The State of the Problem.” Cahiers GUTenberg 2, pages 13 – 53, 1989. Bruin, Rob de, Cornelis G. van der Laan, Jan R. Luyten, and Herman F. Vogt. “Publiceren met LATEX.” CWI Syllabus 19, 1989. Clark, Adrian F. “Halftone Output from TEX.” TUGboat 8(3), pages 270 – 274, 1987. Clark, Adrian F. “Practical Halftoning with TEX.” TUGboat 12(1) pages 157 – 165, 1991. Darrell, Trevor. “Incorporating PostScript and Macintosh Figures in TEX.” Electronic document available with psfig commands, 1987. Ehrbar, Hans. “Statistical Graphics with TEX.” TUGboat 7(3), pages 171 – 175, 1986. Gehani, N. “Tutorial: Unix Document Formatting and Typesetting.” IEEE Software, pages 15 – 24, September 1986. Gruber, H., E. Krautz, H.P. Fritzer, K. Gatterer, G. Sperka, W. Sitte, and A. Popitsch. “Electrical Resistivity, Magnetic Susceptibility, and Infrared Spectra of Superconducting RBa2 Cu3 O7 with R = Y, Sc, Tm, Ho, Eu, Nd, Gd.” Pages 83 – 88 in High-Tc Superconductors, H.W. Weber, ed. New York: Plenum Press, 1989. Heinz, Alois. “Including Pictures in TEX.” Pages 141 – 151 in TEX Applications, Uses, Methods, Malcolm Clark (ed.). Chichester, England: Ellis Horwood Publishers, 1990. Hoenig, Alan. “Fractal Images with TEX.” TUGboat 10(4), pages 491 – 498, 1989. Kernighan, Brian W. “pic — A Language for Typesetting Graphics.” Software — Practice and Experience 12(1), pages 1 – 21, 1982. Kernighan, Brian W. “The Unix Document Preparation Tools — A Retrospective.” Pages 12 – 25 in PROTEXT I. J.J.H. Miller, ed. Dublin: Boole Press, 1984. TUGboat, Volume 13 (1992), No. 3 — Proceedings of the 1992 Annual Meeting 259 Malcolm Clark Knuth, Donald E. The TEXbook. Reading, Mass.: Addison-Wesley, 1984. Knuth, Donald E. The METAFONT Book. Reading, Mass.: Addison-Wesley, 1984. Knuth, Donald E. “Fonts for Digital Halftones.” TUGboat 8(2), pages 135 – 160, 1987. Lamport, Leslie. LATEX: A Document Preparation System. Reading, Mass.: Addison-Wesley, 1985. Maus, Doug, and Bruce Baker. “Dvilaser/PS Extensions to LATEX.” TUGboat 7(1), pages 41 – 47, 1987. Murray, Peter, and Linda Murray. The Art of the Renaissance. London: Thames & Hudson, 1963. Nicole, Olivier, “A Graphic Driver to Interface Statistical Software S with PICTEX.” TUGboat 12(1), pages 70 – 73, 1990. Norris, A.C., and A.L. Oakley. “Electronic Publishing and Chemical Text Processing.” Pages 207 – 225 in TEX Applications, Uses, Methods, Malcolm Clark (ed.). Chichester, England: Ellis Horwood Publishers, 1990. Olejniczak-Burkert, Rolf. texpic User Manual 1.0. Interplan TB Software GmbH., 1990. Olejniczak-Burkert, Rolf. “texpic — Design and Implementation of a Picture Graphics Language in TEX à la pic.” TUGboat 10(4), pages 627 – 637, 1989. Personal TEX Inc. PTI Laser/PS Manual, 1987. Pickrell, Lee S. “Combining Graphics with TEX on IBM PC-Compatible Systems and LaserJet Printers.” TEX Users Group 11(1), 26 – 31, 1990. Podar, Sunil. “Enhancements to the Picture Environment of LATEX.” Technical Report 8617, Department of Computer Science, SUNY, 1986. Rahtz, Sebastian. “A Survey of TEX and Graphics.” CSTR 89-7, Department of Electronics & Computer Science, University of Southampton, 1989. 260 Ramek, Michael. “Chemical Structure Formulas and X/Y Diagrams with TEX.” Pages 227 – 258 in TEX Applications, Uses, Methods, Malcolm Clark (ed.). Chichester, England: Ellis Horwood Publishers, 1990. Rokicki, Tom. “dvidvi: read.me.” Electronic documentation), Radical Eye Software, 1989. Rokicki, Tom. dvips: A TEX Driver. Salomon, David. “DDA Methods in TEX.” TUGboat 10(2), pages 207 – 216, 1989. Schöpf, Rainer. “Drawing Histogram Bars inside the LATEX Picture-Environment.” TUGboat 10(1), pages 105 – 107, 1989. Simpson, Richard. “Nontraditional uses of METAFONT.” Pages 259 – 271 in TEX Applications, Uses, Methods, Malcolm Clark (ed.). Chichester, England: Ellis Horwood Publishers, 1990. Ballantyne, Michael, Michael D. Spivak, and Yoke Lee. “HI-TEX Cutting & Pasting.” TUGboat 10(2), pages 164 – 165, 1989. TUG DVI Driver Standards Committee. “The DVI Driver Standard, Level 0.” TUGboat 13(1), pages 54 – 57, 1992. Van Haagen, A.J. “Box Plots and Scatter Plots with TEX Macros.” TUGboat 9(2), pages 189 – 192, 1988. Wichura, Michael. The PICTEX Manual. (TEXniques 6 series. Providence, Rhode Island: TEX Users Group, 1987. Wichura, Michael. “PICTEX: Macros for Drawing PICtures.” TUGboat 9(2), pages 193 – 197, 1988. Wilcox, Patricia. “Metaplot: Machine Independent Line Graphics for TEX.” TUGboat 10(2), pages 179 – 187, 1989. Wujastyk, Dominik. “Chemical Ring Macros in LATEX.” TEXline 4, page 11, 1987. Wujastyk, Dominik. “Chemical Symbols from LATEX.” TEXline 5, page 10, 1987. TUGboat, Volume 13 (1992), No. 3 — Proceedings of the 1992 Annual Meeting