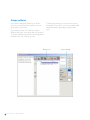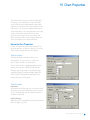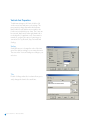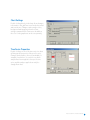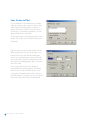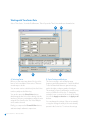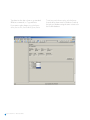
1
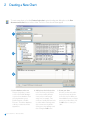
Reuters EcoWin Pro
Quick Start Guide
Quick Start Guide
Content
1
Introduction ......................................................................................................................... 6
Help ..................................................................................................................................................................6
Welcome to Reuters EcoWin Pro ...................................................................................................................6
Toolbar..............................................................................................................................................................7
Menus ...............................................................................................................................................................7
2
Creating a New Chart......................................................................................................... 8
Saving Your Chart ............................................................................................................................................9
3
Selecting Series ................................................................................................................. 10
Using Select Series........................................................................................................................................ 10
Text Search .................................................................................................................................................... 11
Equities Selection.......................................................................................................................................... 12
Series List....................................................................................................................................................... 13
4
Creating an Output .......................................................................................................... 14
5
Using Studies .................................................................................................................... 15
Study types.................................................................................................................................................... 15
6
Using Charts in Office Applications ................................................................................. 17
Paste Link | EcoWin Document Object ................................................................................................................................... 17
Paste | Picture (Enhanced Metafile) .......................................................................................................................................... 17
Paste | EcoWin Document Object (Embedded Object)....................................................................................................... 17
Lock Size of Linked Documents................................................................................................................................................ 17
Publish – Linking Data into Excel or EcoWin Documents .......................................................................... 18
Creating a link to Excel............................................................................................................................................................... 18
Using Published Data as Input in Another EcoWin Document ........................................................................................... 18
7
Adding analyses ................................................................................................................ 19
Transformations............................................................................................................................................. 20
Simulations .................................................................................................................................................... 21
Statistics......................................................................................................................................................... 21
Flow ............................................................................................................................................................... 22
Miscellaneous................................................................................................................................................ 22
8
Changing the Chart Layout .............................................................................................. 23
Groups and Series ........................................................................................................................................ 24
Load Chart Style ........................................................................................................................................... 25
Alternate Scale .............................................................................................................................................. 25
9
Multiple Panes .................................................................................................................. 26
4 Reuters EcoWin Pro – Quick Start Guide
10
Chart Properties ................................................................................................................ 27
Horizontal Axis Properties ............................................................................................................................ 27
Time Axis Layout ......................................................................................................................................................................... 27
Time Axis Labels ......................................................................................................................................................................... 27
Vertical Axis Properties ................................................................................................................................. 28
Scaling .......................................................................................................................................................................................... 28
Title................................................................................................................................................................................................ 28
Chart Settings ............................................................................................................................................... 29
Time Series Properties.................................................................................................................................. 29
Lines, Arrows and Text.................................................................................................................................. 30
11
Excel Add-in ...................................................................................................................... 31
Working with Time Series Data.................................................................................................................... 32
A. Selecting Series ...................................................................................................................................................................... 32
B. Series Settings and Analyses ................................................................................................................................................ 32
C. Series List ................................................................................................................................................................................. 34
D. Export Options ....................................................................................................................................................................... 34
E. Series List Commands ........................................................................................................................................................... 34
Series Properties ........................................................................................................................................... 35
Working with Equities Data.......................................................................................................................... 36
Company and Index Selection ................................................................................................................................................. 36
Data Item Selection .................................................................................................................................................................... 37
Presentation Settings ................................................................................................................................................................. 38
Regions ......................................................................................................................................................................................... 38
12
Creating In-house Time Series ......................................................................................... 39
13
DDE Linking ...................................................................................................................... 41
Reuters EcoWin Pro – Quick Start Guide 5
1 Introduction
This Quick Start Guide is designed
to give you an overview of the
main features of Reuters EcoWin
Pro, equipping you with basic
knowledge of how the software
works, and what it can do for you.
Many of the areas covered in the
overview can be followed up in
greater depth using the online
help documentation.
Reuters EcoWin Pro operates in a Windows
environment. This means there is consistency in
menus, commands and dialog boxes. You will find a
standardized toolbar containing buttons consistent
with Windows. With the Excel Add-in you can easily
download and export data to Microsoft Excel and
update your spreadsheets.
6 Reuters EcoWin Pro – Quick Start Guide
Help
Reuters EcoWin Pro contains comprehensive help
documentation. Within the documentation, you
will find descriptions, definitions, formulas and
examples. Simply mark an item and press F1 on
your keyboard.
Welcome to Reuters EcoWin Pro
When opening Reuters EcoWin Pro from the
program menu, a dialog box will appear showing
several options for using Reuters EcoWin Pro.
Create a Basic Chart – Create a chart directly by
selecting time series.
Create Document Using a Study – Open a preinstalled study template for your document.
Open a Saved Document – Open a previously
saved EcoWin Pro document.
Go to the EcoWin Pro Start Page – Access the
EcoWin Pro Start page directly.
Continue to Use EcoWin – Access all options
mentioned above from here.
Toolbar
New document with chart
Insert arrow
New study
Insert line
Formula editor
Insert vertical line
Series information
Insert horizontal line
Hide/show Property bar
Insert text
Add series
Reuters EcoWin Pro Start page
Duplicate series
Chart Library
Presentation settings
Help
Load chart style
Menus
File - Contains administrative features such as
Saving, Printing, Settings, Series Editor and the
Binder.
Analysis - Contains Save as series, Calculation
range, and the Insert menu which shows all the
available analysis methods.
Edit - Includes copy commands, which you can
use to move/copy documents or data into other
applications. Reuters EcoWin Pro supports both
OLE and DDE links. The Undo option can be found
here.
Tools - Provides utilities to administer (configure,
repair, backup) your database.
View - Deactivate the Legend, the analysis shown in
the Legend or multiple columns in the Legend. You
can also find the Ruler command here.
Insert - Allows the user to insert Text labels, Arrows,
Lines and multiple Panes.
Window - Cascade, Tile and Arrange Icons are
commands for organizing your documents on the
screen. The Set size command is also available
here, as well as the command Restore floating bar
position.
Help - Content includes Help Topics, Recent News,
Check for new version, a link to the Reuters EcoWin
Pro Start page and Contact us.
Chart - Commands related to the formatting of
your chart, such as Graph layout, Chart settings,
Horizontal axis, Main vertical axis, Alternate vertical
axis, Info box settings and Load styles.
Reuters EcoWin Pro – Quick Start Guide 7
2 Creating a New Chart
To create a new chart, select the Create a basic chart option from the start dialog box or the New
document with chart button in the toolbar. The Select Series box will then appear.
1
2
3
1. Select database and source
First specify whether you want
to look in the EcoWin database
or your In-house database. Then
select the database source:
EcoWin Financial or EcoWin
Economic. The add-on databases
to which you subscribe will also
appear here.
8 Reuters EcoWin Pro – Quick Start Guide
2. Add series to the Selection List
In the Tree View you will find the
time series sorted by different
views, such as countries and
categories, for example. Time
series are sorted by different levels
in order to make searching easier.
Select a time series by doubleclicking on it or by marking it and
then clicking the Add button.
3. Create your chart
All series you have selected in
the previous steps are shown
in the Selection List. When you
have added all series you want to
present in your document, click
the OK button to create your
chart.
Saving Your Chart
Using the Save As option in the File menu, you can
save documents consisting of charts, tables and
reports in your own file library.
These documents can be retrieved at any time, by
clicking on the Open button. The documents will
be updated automatically when new values are
entered into the databases.
The EcoWin series are presented, by default, as a line chart along with the Analyses tree to the left.
In-house databases or any other data sources are based on the same principle, which means that time series from
different databases can be combined freely.
Reuters EcoWin Pro – Quick Start Guide 9
3 Selecting Series
Using Select Series
Data is selected from the Select Series box. There
are several ways to access this box in Reuters
EcoWin Pro. If you have already started Reuters
EcoWin Pro, a new chart can be created using the
New document with chart button in the toolbar.
If you have not decided what output you would like,
select the New button in the toolbar, then access
the Select Series box using the Add Series button.
This button can also be used if you want to add
series to an existing document.
Series can be duplicated using the Duplicate
series button in the toolbar.
The Tree View is the default search engine in
Reuters EcoWin Pro. The filter function can be used
to further refine your series selection. However, the
properties of this function may vary from database
to database. You can also personalize Select Series
by using the Favorites function so that only the
countries and categories you are interested in are
displayed.
A
B
C
D
A. Search for series
Series can be found by using the
Tree, Text, or Equities search.
The Equities search tab is only
available if you subscribe to the
EcoWin Equities database.
10 Reuters EcoWin Pro – Quick Start Guide
B. Filter
Fine-tune your series selection
with filters.
C. Add series
You can add series to the
Selection List here.
D. Selection List
The Selection List allows you to
browse and choose multiple series
from different categories and
databases, without having to close
the Select Series box.
Text Search
Data can also be found using the Text Search. The
Text Search searches the databases marked in the
sources list when you click the Search button or
Enter key. You can use the booleans and, or when
searching. Without these booleans, the search will
use and by default. Evaluation takes place from left
to right only.
The Text Search searches using the series’ full
descriptions and source as well as all the other
meta data associated with the series, except the
commentary and frequency. You can use the
frequency filter to narrow your search further.
A maximum of 300 hits are returned. The search will
not return any discontinued series.
By pressing down the Ctrl or Shift keys, you can
select multiple data sources from which to search.
Reuters EcoWin Pro – Quick Start Guide 11
Equities Selection
The Equities tab is available if you subscribe to
the EcoWin Equities database and offers a more
efficient way of searching for companies.
The EcoWin Equities database lets you tap directly
into an accurate, comprehensive and up-to-date
source of equity-related data.
1
1. Choose Category
Choose the category you want to search from the
drop-down menu.
Mark the country in which you are interested and
click the Lookup button. All companies listed for this
country will now be shown in the Company window.
12 Reuters EcoWin Pro – Quick Start Guide
This database gives you access to worldwide
balance sheets, income statements and cash flow
statements, as well as key ratios, global equity
prices, quarterly fundamentals, world equity
indices, and more.
2
2. Select Time Series
Mark the companies of interest and click the Choose
button. A new window will now open.
Companies will appear in a tree structure in the Select
Time Series window. If this structure is expanded, all
variables for these companies will be shown.
Series List
The Series List is where all your selected series
are located. In order to convert Frequency, set
Calendar or make Currency conversions for your
selected series, go to the Series List and make your
changes.
A
B
D
C
E
F
A. Changing Frequency
Convert frequency for all series in the Series List by
selecting any of the preset frequency periods.
B. Calendar
The Calendar determines how Reuters EcoWin Pro will
handle missing values.
Any series includes all observations where there is at
least one observation in any series.
All series is used if one of the times series in the Series
List has a missing value. If so, that specific date/
observation will be removed for all the time series.
Calendar includes all observations regardless of
missing values in any series.
C. Currency
Convert currency for all series in the Series List by
selecting any of the preset currencies.
D. Forecasts
You can extend any time series in the document with
your own future values for use in all calculations and
presentations.
E. Conversion Settings
You can make more advanced decisions regarding
frequency conversions and the handling of missing
values using Conversion settings.
F. Right-click Menu
Right-clicking on the series ID or the internal label of a
series will bring up a drop-down menu.
Any series can be copied, deleted, added, or
duplicated from here. You can also select which
columns to view and make changes to the series label
from this menu. Custom labels can be propagated to
charts and tables.
Reuters EcoWin Pro – Quick Start Guide 13
4 Creating an Output
Reuters EcoWin Pro gives you several options
for presentation of the data. We have already
mentioned the possibility of creating a Time chart.
The other output alternatives are Scatter chart,
Table and Report.
Time chart
Table
A Table shows the dates and the
values for the time series, as well as
for the output of the analyses.
Report
In a Report you will find information
about the time series, for instance,
source and description. If a
regression analysis is added, a
statistical report is generated
automatically.
A standard Time chart is displayed
as a plotted line. A number of
additional chart layouts are
possible. A group of series can
be represented as a bar group, a
stacked bar group, an area group,
an open-high-low-close group, a
stripe group or a candlestick group.
Scatter chart The Scatter chart shows the values
for two time series plotted against
each other.
14 Reuters EcoWin Pro – Quick Start Guide
5 Using Studies
EcoWin studies are pre-formulated, editable
algorithms that operate on the series, frequency,
and other parameters that you provide. Depending
on the particular study, the results may be charts,
plots, reports, or diagrams.
Studies are available from the File menu or the New
Study button in the toolbar.
Study types
Several types of studies are supported, and can be
selected from the New Study dialog, as illustrated
below:
The output displays the transformed variable(s) in a
chart and in a table.
Best Lag Regression
Finds the lag at which the independent variable has
maximum correlation with the dependent variable.
A simple regression forecast with the accordingly
lagged independent variable is created.
Fan Chart – User data
Fan chart for a series is created from bands entered
as document data.
Fan Chart – Parametric
A series future distribution is simulated in a
model where random changes are sampled from
distribution functions.
Fan Chart – Bootstrapped
A series future distribution is simulated in a
geometric model where random gross rates of
changes are bootstrapped from empirical historical
distribution.
GDP Weighted Real Yield
Allows you to build an aggregate real yield for
Government Benchmark Bonds.
Prices and Volume
Aggregates
Allows you to create GDP (gross domestic product)
weighted aggregates or indices. The variables that
can be aggregated contain, for example, equity
index and consumer price index.
Change over Period
Allows you to create a chart where up to five time
series can be transformed into their corresponding
change over period series. There is, in addition, an
option for smoothing the change over period.
Allows you to pick a closing price for an equity, for
which the study will find the corresponding high,
low, and open prices, and the volume traded for
that equity.
Regression Modelling
The Regression Modeling study allows you to
estimate a number of linear regression models
for a given dependent variable that you want to
describe, explain and forecast.
Reuters EcoWin Pro – Quick Start Guide 15
Risk/Return
Allows you to quickly get an overview of the
risk and return characteristics for a number of
series. All input data series are transformed into a
common form prior to the risk and expected return
calculations.
Scatter Plot with Best Fit
Allows you to produce a scatter chart with a line of
best fit and a standard deviation band around the
line of best fit.
Standardization
Allows you to select one or more time series and,
for each series, a separate time chart depicting the
time series, the mean of the time series, and the
standardized time series will be created.
Standard Yield Curve
Allows you to easily create yield curves for any
country in the database.
Series Distribution Histogram
Calculates the distribution histogram and the
cumulative distribution function for a series.
A fan chart produced using the Parametric Fan Chart Study.
16 Reuters EcoWin Pro – Quick Start Guide
6 Using Charts in Office Applications
It is possible to copy any chart in Reuters EcoWin
Pro using Edit, Copy chart picture and object.
These charts can be automatically or manually
updated in Office applications.
Paste Link | EcoWin Document Object
In order to access this option, the original EcoWin
document needs to be saved. Only a link to the
original document is saved in the Office document.
This link will be broken if the original document is
moved, deleted or not accessible for some reason.
Applying an analysis or renaming a chart in the
EcoWin document will also break the link. When
double-clicking an EcoWin document in an Office
application, it will open in Reuters EcoWin Pro.
Since the document is linked, you can use the Edit,
Links menu to update links and select automatic or
manual update.
Anyone who does not have Reuters EcoWin Pro
installed will be able to open documents with linked
EcoWin objects. However, they will not be able to
update, edit or open the chart object.
Paste | Picture (Enhanced Metafile)
This option creates a static picture of the chart; one
that will never be updated. You can only manipulate
it using standard Office tools. Right-click the picture
to use Format picture. If you are not able to use
Enhanced metafile, the problem might be that this
function has been disabled in the Reuters EcoWin
Pro application (located in the File menu, under
Settings, Options, Chart).
Paste | EcoWin Document Object
(Embedded Object)
Pasting the complete EcoWin document into an
Office application will create an embedded object.
It will be updated when it is double clicked and you
will have access to most of Reuters EcoWin Pro’s
menus while still inside the Office application. It is
also possible to update the chart by right-clicking it
and selecting EcoWin Document Object, Update.
Anyone who does not have Reuters EcoWin Pro
installed will be able to open documents with
embedded EcoWin objects. However, they will not
be able to update, edit or open the chart object.
Paste EcoWin document object is the general
default if you use Ctrl+V or just choose Paste in the
Office application.
Lock Size of Linked Documents
By setting the size of the linked EcoWin document
in the OLE-link it is possible to keep the size fixed.
The Set Size function can be found in the Window
menu. Please note that users of versions prior to
Reuters EcoWin Pro 5.4 will not be able to open
or update linked documents created in Reuters
Ecowin Pro 5.4. To avoid this, make sure that all
users have the latest version installed.
Reuters EcoWin Pro – Quick Start Guide 17
Publish – Linking Data into Excel or
EcoWin Documents
The Publish feature is primarily intended for two
purposes:
• Linking time series data into Excel
• Linking time series data into other EcoWin
documents
To make the data available for linking, it must be
published.
1. Select the series you want to publish from either
a table or a chart.
2. Right-click this series and select Publish from the
context menu
Creating a link to Excel
1. Publish the data you want to make available in
Excel. Note that you can publish more than one
series at a time by marking several columns in a
Table and selecting Publish.
2. Save the document.
3. In a list of published data, select Copy or Copy
Special from the context menu.
4. In Excel, select Paste Special and check Paste
Link.
Using Published Data as Input in Another
EcoWin Document
1. Publish the data you want to make available as
input in other documents.
2. Edit the Description in the first column so that
you can easily recognize this data.
3. Save the document in the EcoWin folder.
This folder is by default located under
My Documents\EcoWin.
4. In the document where you want to use the data
as an input, select Analysis, Add Series and
then select the database Document Database.
You should now be able to find the document
you saved in the previous step.
5. You will now be able to find the document you
saved in step 3. When you select the document,
you can see a list of data published in this
document. Select the data you want to use as
input and click OK.
The text in the first column can be edited if you
do not want the suggested text. This text will be
displayed when you browse for series to use as
input in other EcoWin documents, as described to
the right.
18 Reuters EcoWin Pro – Quick Start Guide
Another way to create a reference to the published
data is to select Copy from the list of published
data in the first document and then select Paste
Link in the Series List of the new document.
7 Adding analyses
Once you have selected the data you want to work
with, an analysis can be applied. The analyses
available are divided into three different groups;
Transformations, Statistics and Flow. The groups
can be seen by right-clicking on the Series List.
Analyses can be applied on top of each other by
placing the cursor in the Analyses tree where you
want to insert your analysis. You can also change
the order of your analyses by using drag and drop
in the Analyses tree.
Reuters EcoWin Pro – Quick Start Guide 19
Transformations
Arithmetic
Two time series can be added
to, multiplied or divided by, or
subtracted from each other. The
resulting time series can in turn
be manipulated using the four
arithmetic operators or together
with another time series.
Forecast
The Forecast analysis adds
forecasted values that you enter to
the end of a time series. By entering
a forecast, you can extend the time
series from the database with your
own future values.
Formula
The Formula analysis makes it
possible for you to add a formula at
a specific point in the analysis tree
instead of creating whole formula
series.
Performance The performance of a time series
can either be expressed as a
percentage change, or as a change
in the level from a certain date. For
both these kinds of transformations
it is possible to choose a variety
of time intervals over which the
performance calculations can be
made.
Rate of Change A change in a time series can be
expressed either as a percentage
change per period, or simply as
a change in the level. For both
these kinds of transformations it is
possible to express the changes
as an annual rate for both of these
kinds of transformations.
Rebase
The value of a time series can be
set to a constant, say 100, at a given
point in time. The original time
series is simply divided by the value
at the given point in time and then
multiplied by 100. It is also possible
to rebase a time series relative to
the value of a second time series at
any given point.
Scalar
The Scalar analysis creates a
number of new series from a set
of input time series. Each new
output series obtains its values
from some scalar function of the
input series. The scalar functions
are observation values at specific
dates or observation numbers, or
the mean, median, performance or
standard deviation of input series
for a specified sample. This function
gives you flexible cross-comparison
possibilities for time series.
Index Builder The Index Builder analysis can
calculate an index or an aggregate
representing either the value of a
self-financing portfolio of assets, or
the value of a set of assets.
Lag
Missing
Values
To lag or lead a time series means
shifting the observations of a
chosen time series backward or
forward in time. When a time series
is lagged, it is shifted forwards a
chosen number of observations.
Leading the time series means
the series is shifted backwards a
number of observations.
You can use the Missing Values
analysis to handle missing values in
time series using different methods:
Linear interpolation, Mean, Previous
Value, Quadratic interpolation, or
None.
20 Reuters EcoWin Pro – Quick Start Guide
Slicing
With this analysis, you can divide
a given sample of observations
from any number of time series
into smaller samples according to
the criteria of calendar time and/or
number of observations.
Histogram
Use the Histogram analysis to
calculate the cumulative distribution
function or the probability density
function. The output series can
be either in absolute or relative
frequencies.
Yield Curve
Create yield curves based on
natural cubic spline or linear
interpolation methods.
Mean
The mean, median, max or min can
be calculated for any time series. It
is also possible to have confidence
intervals around these calculations.
Regression
The regression analysis estimates
a linear regression model with
ordinary least squares (OLS).
The output from this analysis is
estimated parameter values and
their standard errors as well as
overall regression statistics. These
can be seen in a report.
Season
It is possible to use either an
additive or a multiplicative model
for a time series seasonal factor. The
seasonal factors themselves can be
output series.
Smoothing
Various ways of applying moving
averages to any time series: Moving
Averages and Centered Moving
Average, as well as Exponential
Weight and Hodrick-Prescott filter.
This function also allows you to
apply moving standard deviation
(over time).
Trend
Reuters EcoWin Pro can plot or
remove certain deterministic trends
from a time series. It is possible to
draw a confidence interval around
the estimated trend.
Simulations
Scenario
Builder
Statistics
The scenario builder analysis
simulates possible paths for a
time series. Random noise is used
together with a specified path of
future values or a single starting
value to generate scenarios
incorporating uncertainty.
The output series are time series
consisting of quantiles.
Correlation
The correlation analysis can
calculate correlation functions for
any number of time series.
Covariation
The covariation analysis can
calculate a number of moving
statistics, i.e. the sample on which
they are based is a time window
with a fixed number of observations.
This analysis is especially useful
for detecting instabilities in
correlations, standard deviations,
and regression coefficients.
Reuters EcoWin Pro – Quick Start Guide 21
Flow
Aggregation Depending on the underlying time
series’ data frequency, a number
of summation periodicities are
available. The user specifies how
often the aggregation will be
restarted within each year.
Early Warning The user formulates a plan or
projection for the present year
concerning this year’s sum of a flow
variable. Given the chosen seasonal
model, i.e. additive or multiplicative
model, and the actual development
during the present year up to now,
this analysis estimates whether the
actual development is following
the plan. This estimate can be
formulated in percentages or
values.
Miscellaneous
Stop
The Stop selection halts the
creation of a series at the point at
which Stop was selected.
If you want more information about a specific
analysis, mark that analysis in the Analyses tree and
press F1.
22 Reuters EcoWin Pro – Quick Start Guide
8 Changing the Chart Layout
Reuters EcoWin Pro makes it easy for the user to
make changes to the chart layout.
When a time chart is created, the series are
automatically presented as lines. The tool for
changing the chart layout is the Presentation
settings button.
A
A. Series
Shows all series available in the Series List.
If you want to remove a series from the chart, use
the right-hand part of the Graph layout box. Just
mark the series and select Delete. The series will
then be deleted from the chart, but is still available
in the Series list and can be added to the chart
again, using the arrow.
B
B. Groups
Shows all series that will be presented in the chart.
Reuters EcoWin Pro – Quick Start Guide 23
Groups and Series
If you want to change the chart style for all the
series in your chart, mark Lines and select a new
group style for your series.
If you want to present one of the series with a
different chart style, a new group has to be created.
To do this, mark the relevant series in the right-hand
field and select one of the Group icons.
To modify the settings of a series the series has to
be marked. Selections for color, line style and width
can then be made, depending on type of chart
style.
Group icons
24 Reuters EcoWin Pro – Quick Start Guide
Series settings
Load Chart Style
Alternate Scale
A template is created by simply saving the chart. A
number of features of this chart can then be applied
to another chart. The most important properties
are the grouping of the time series, the chart layout
and what can be called ‘user made changes’, such
as the grid, background, the fonts applied to the
value axis and the main title.
You can also create an alternate scale from the
Graph layout box by marking this series and create
a new group. In order to activate the Alternate scale
box, mark the group for the relevant series. The
Alternate scale box can then be marked.
You can use previously saved EcoWin Pro charts as
templates when creating new charts. This choice
is available from the Load chart style drop-down
menu in the toolbar.
The easiest way to display one of the time series
in your chart on an alternate scale, is to right-click
on the time series in your chart, and select Use
alternate scale from the context menu that appears.
Above: Create an alternate scale in Graph layout box.
Left: Create an alternate scale directly in the chart.
Reuters EcoWin Pro – Quick Start Guide 25
9 Multiple Panes
It is possible to display several panes in one time
chart. Panes are always inserted below the existing
one and this can be done in several ways: By
dragging and dropping a series outside the graph
area or by using Insert Pane below in the Insert
menu. All panes in a time chart share the same
settings for title, background, range paint and
x-axis. The graph layout is separate, however. Any
pane can be resized relatively by clicking between
two panes and dragging.
26 Reuters EcoWin Pro – Quick Start Guide
All series that are added to a document will
automatically be added to the upper pane only.
The panes support dragging and dropping of
series between them and this is often the fastest
way to add series to a pane. Series can also be
Copied/Pasted between different panes using the
Copy command in the Edit menu.
10 Chart Properties
The default chart setting is to chart the data with
full history. If you mark a time series in the chart,
you will find a status field showing the exact date
and value for that point of the series in the bottom
right corner. You can use the right and left buttons
on the keyboard to scroll along the time series and
clearly see the dates and values of the series.
If you have more than one series in a chart, the
Ruler command can be used to display dates and
values for multiple series at the same time.
Horizontal Axis Properties
To edit or view the properties that are specific to
the horizontal axis, you have to double-click on the
X-axis. An X-axis properties box will appear.
Time Axis Layout
The Display range can be altered to fit your
requirements. You can choose to either set a
specific date or number of observations.
Several other choices regarding margins and tick
mark position are also available under this tab.
Changes can also be made to the display range
using the Display/Zoom bar available under the
chart. Double-clicking the bar displays the full
length of the series in the chart.
Time Axis Labels
Automatic
In Automatic mode the purpose is to show as much
information as possible. When this mode is turned
off, you can manually enter the distance between
each minor tick mark.
Include Century
When this option is marked the years will be printed
with four digits, e.g. 1998.
Reuters EcoWin Pro – Quick Start Guide 27
Vertical Axis Properties
To add new settings to the Y-axis, double-click
on the vertical axis and enter your settings. The
preset mode is always Automatic which means
that EcoWin Pro will find the most suitable scale
for the series included in your chart. The Y-axis can
be reversed, duplicated on the right-hand side or
recalculated to a logarithmic scale. If automatic is
turned off, you have the option of entering your
own values for Top, Bottom, Step, Decimals and
Scaling.
Scaling
Scaling allows you to change the scale of the time
series in a chart according to your own preferences.
The text on the Y-axis will change according to your
selection.
Title
Double-clicking on the title in a chart allows you to
easily change the chart’s titles and fonts.
28 Reuters EcoWin Pro – Quick Start Guide
Chart Settings
Double-clicking directly in the chart allows changes
to be made to the grid lines as well as the horizontal
and vertical axes. Changes can be made to titles,
background and range paint from the Chart
settings command in the Chart menu. In addition,
the color for the graph area can be set separately.
Time Series Properties
Double-clicking on one of the time series in a chart
will bring up the properties of the specific series.
Changes can be made to line style and width, for
example, from this box. You can also see which
analyses have been applied to the specific time
series, and the analyses applied can easily be
changed from here.
Reuters EcoWin Pro – Quick Start Guide 29
Lines, Arrows and Text
You can add labels, lines and arrows to the chart
simply by clicking on these buttons in the toolbar,
and pointing and clicking where you want it to
appear in the chart. Double-click on the object to
set the font, color and style. In addition, you can
apply multiple lines to text labels.
To edit the properties of text inserted in the chart,
double-click on the text; the Label Properties box
will appear.
Objects can be moved from their initial locations.
When using Print preview you will be able to see
how the text fits into the chart. By marking the
object once, a small square becomes visible and
you can move the object by holding down the left
mouse button and dragging the object to another
part of the chart.
Lines, arrows, and text boxes are anchored
horizontally and vertically by default. This means
that lines, arrows and text will be relative to the
x- and y-axis. If unmarked, these will be relative to
the chart window. If you want to point out a specific
value in the chart, anchoring is recommended.
30 Reuters EcoWin Pro – Quick Start Guide
11 Excel Add-in
Use the Excel Add-in to download time series
data directly into Excel spreadsheets. The add-in
consists of two parts: the Time Series module and
the Equities module; while the former allows you
to work with all sorts of data, the latter is designed
specifically to handle equities-related data.
A. Toolbar Buttons
The toolbar buttons provide a quick way of accessing
the Time Series and Equities wizards, as well as the
online Help.
B. Download Time Series Data to Excel
Time series - This will open the Time Series window,
through which you can select and download time
series data.
Properties - Here, you can change the settings of one
or several selected time series, and even replace the
entire time series.
Load data - Opens up the Time Series wizard for all or
a selection of series.
Convert old sheet - Convert spreadsheets from
EcoWin Graphics format to EcoWin Pro format.
C. Download Equities Data to Excel
Equities - Download equities data. This will open the
Equities wizard.
Edit Worksheet - Load content from the spreadsheet
into the Equities Wizard for editing.
Convert Values - Convert from dynamic values to
static ones, or vice versa.
Show Series Info - Present information about a
particular time series.
Open Select Series - Browse for time series using the
Select Series interface.
D. Update
Update - Updates a sheet, a selection of series, or the
entire workbook.
Requery - Re-runs the query originally used to create
a particular EcoWin Equities output region. This may
cause the entire region to shrink or grow.
A
B
C
D
E
F
G
E. Preferences
Allows you to change the preferences settings for the
Excel Add-in.
F. Export to In-house
With this feature you can define a set of time series in
Excel and export the data to your in-house database.
G. Help and Miscellaneous
EcoWin Add-in Help - Display the software
documentation set.
Reuters EcoWin Pro on the Web - Start an Internet
browser, and direct it to the EcoWin web site.
Contact Us - Send your query directly to Reuters
helpdesk by using the Contact Us form.
About EcoWin Add-in - Display additional
information about the software.
Reuters EcoWin Pro – Quick Start Guide 31
Working with Time Series Data
Select ‘Time Series...’ from the EcoWin menu. This will open the Time Series window, as shown below.
A
C
D
A. Selecting Series
Before you can export any data to Excel you first
have to select a number of time series. There are
several ways to do this:
You can enter a series code directly into the Series
text box, and press the Enter key.
You can also press the Select Series button,
which brings up the Select Series dialog. Use this
interface to browse your databases, and pick series
using the Text Search or the Tree View. Multiple
series can be selected.
Finally, you can press the Formula Editor button,
and enter simple arithmetic expressions.
32 Reuters EcoWin Pro – Quick Start Guide
B
E
B. Series Settings and Analyses
The Series settings – such as display range,
frequency and other parameters – can be modified.
To the left-hand side there are general settings,
and to the right you have a number of analyses.
The settings you specify will then be used for every
series you add to the Series List. To change the
settings for one or several of the series in the Series
List, use the Apply to selection or the Apply to all
buttons.
You can change the settings of the series manually
or copy the settings from any of the series already
present in the Series List. To retrieve the settings
from a series in the Series List, select the series and
then click Get Settings. To assign default values to
all settings and analyses, click the Reset button (this
action will not affect the series in the Series List).
Conversion method – Select the frequency
conversion method, if any.
Settings – General tab
Missing Values – Defines how non-existent
observation values should be handled.
Default is N/A, but can be changed to Previous
Value or Empty.
From – Start of display range. Can be set to:
• LAST
Shows the latest observation available in the
database.
• START
From the actual beginning of the series. This is
the default setting.
• Number of observations
The number of observations prior to the latest
one, e.g., -10 or -200.
• Custom date
A normal date. Short date format should be used
(c.f., Regional Settings in Windows).
• Calendar period
Used when a specific calendar period should be
displayed, e.g., -1M or -1Y.
To – End date of Display range. Can be set to:
• LAST
Shows the latest observation available in the
database. This is the default setting.
• TODAY
Shows all observations up to today. Useful when
you want to apply a common end date to all
series.
• Number of observations
The number of observations prior to the last one.
• Custom date
A normal date. Short date format should be used
(c.f., Regional Settings in Windows).
• Calendar period
Used when a specific calendar period should be
displayed, e.g., -1M, -1Y, +1M, or +1Y.
Currency – Select the currency in which you want to
express the series.
Do Not Show Dates – If this is marked, the series
will not show any date columns.
Use Scale Factor – If this is marked, the Scale
factor will be used and all digits will be displayed in
Excel.
Settings – Value tab
Lag Observations – The number of steps to shift
the time series observations forward or backward.
Analyses
There are three different analyses available
– Rate of Change, Rebase, and Smoothing. Rate
of Change and Rebase also support a number
of different variants. Note that you cannot apply
more than one analysis per time series. For more
information on analyses and the parameters they
accept, please refer to the online User Manual.
Frequency – Select the frequency to which you
want to convert the data.
Reuters EcoWin Pro – Quick Start Guide 33
C. Series List
Changing Order of Series – Use the Up and Down
arrows to change the order of series in the Series
List.
Series Selection – Changes can be applied to
a selection of series in the Series List. To apply
the current settings, click the Apply to selection
button, or use the Apply to all button.
Series Properties – To change the properties of a
single series in the Series List, you can double-click
it. This will display the Properties dialog for the
selected series. Properties can also be accessed
by right-clicking the series and selecting the
Properties menu item, or by pressing the Enter key.
Copy and Paste – Select one or more series in the
list, then right-click. From the context menu, you
can choose one of the standard Copy and Paste
items. By using those commands you can move
collections of time series identifiers between the
Series List and other applications, such as EcoWin
Pro or Notepad.
Delete – Pick some series in the Series List and
press the Del key, or right-click and select the
Delete menu item.
D. Export Options
Export to Excel – Exports the content of the Series
List to Excel.
Export to New Sheet – Exports series into cell A1
in a new spreadsheet.
Export as Rows – If this is marked, series will be
exported into rows instead of columns (the output
will be transposed).
Close on Export – Closes the Time series window
after export is completed.
Do Not Export Dates – If unmarked, one date
column will be exported for each series. If marked,
no date columns will be exported.
34 Reuters EcoWin Pro – Quick Start Guide
One Date Col/Row – If checked, only the date
column for the first series will be exported. This
option is only available if all series share the same
Start date, Frequency and Last date. To ensure that
the last date is the same, set To = TODAY for all
your series.
E. Series List Commands
Clear – Clears the Series List, and resets the
settings and analyses to their default values.
Open/Save – Load or save the contents of the
Series List from or to disk.
Close – Close the Time Series wizard window.
Series Properties
After you have exported your time series data
to an Excel spreadsheet, you can use one of the
Properties menu items to change the settings
of one or several time series. Depending on your
Macro Security settings in Excel, you may also be
able to right-click a cell containing a time series
identifier in the Excel spreadsheet to access the
same dialog.
From here, the settings of individual series can be
changed, and series replaced.
Reuters EcoWin Pro – Quick Start Guide 35
Working with Equities Data
Company and Index Selection
Select ‘Equities...’ from the EcoWin menu.
Using the Equities wizard you can easily download
equities data into Excel – e.g., this can be historical
data or estimates, for prices and for fundamentals..
It is a tool that lets you create and edit dynamic and
static equities data.
1. Look up companies or indices either by using
keywords (searching by name, ISIN or RIC) or by
browsing through the tree structure.
2. Pick the companies you are interested in, and
add them to the Selection List.
3. Click Next to proceed to data items selection.
The wizard provides you with an easy way of picking
the companies (and/or indices) and data items
you are interested in, and offers a wide variety of
formatting options.
2
1
3
36 Reuters EcoWin Pro – Quick Start Guide
Data Item Selection
1. You will have four different categories of
data items to choose from: Attributes, Prices,
Fundamentals and Estimates. (The Estimates tab
will only be available to subscribers of estimate
data).
Attributes – allows you to choose items such
as the country of origin and different industry
classifications.
Prices – close, high, low, volume, etc.
Fundamentals – choose variables from Balance
Sheet, Income Statement, Cash Flow Statement
and Key ratios.
Estimates – select the estimates of interest such
as EBIT Median, Sales Median, etc.
2. Select the data item you are interested; you
can then decide to apply one of the available
analyses, such as Rebase or Performance. When
clicking the Add Item button you will get the last
value of the series, while Add Range allows you
to choose a time range, that is, it will help you
create several, consecutive observations at the
same time.
3. The selected data items are now added to the
companies in the Selection List, and you can
select another data item.
Note that you cannot change the settings of the
data items that have already been added to the
Selection List.
1
2
3
Reuters EcoWin Pro – Quick Start Guide 37
Presentation Settings
Regions
Once the data items have been selected you have
several options for how to present them. You can
Target the data, meaning that the data can be
downloaded to your current worksheet, or a new
one, and you can also direct the output to start at
any cell you choose. Customized Formatting allows
you to choose between several different formatting
schemes.
All equities data will be exported to Regions, and
this enables you to export data several times to the
same worksheet. Later, when you want to edit your
data, you will be asked which region you want to
modify, and this data will then be loaded into the
Equities wizard.
Export your data selection to the assigned book,
sheet and cell, and in the format selected, by
clicking the Export button.
After you have downloaded data into Excel it is
possible to change, for example, the currency of a
particular data item. Do this by going to the EcoWin
menu, and select Edit Worksheet.
38 Reuters EcoWin Pro – Quick Start Guide
You can also ask the system to Requery for data,
which is useful if you want to update for example an
Index Constituent List. Such a list is then allowed to
grow or shrink depending on whether companies
may have dropped out or been added to the index.
Note that this is conceptually different from a
normal Update operation, which will only update
the data for companies already present in the
spreadsheet.
12 Creating In-house Time Series
Reuters EcoWin Pro can be integrated into your
own data, for example, your company’s in-house
tracking of sales of various products, volume or
other data sets relevant to your organization.
If you want to create your own time series, you can
do this using the Series editor. The Series editor
can be found in the File menu, Series editor, New,
Series.
1.
2.
3.
4.
5.
Give your series a name.
Select start time for the series.
Select frequency and optional currency.
Type a description for the series.
In order to easily find your in-house series, select
country and category.
6. Save your series.
Note that if you use Excel, you can also use the
Reuters EcoWin Excel Add-in to create and edit inhouse time series data.
1
2
3
4
5
6
Reuters EcoWin Pro – Quick Start Guide 39
Type data into the data column or use standard
Windows commands, i.e. Copy and Paste.
If you want to make changes to your In-house
series, choose File, Series editor, Open, Series.
40 Reuters EcoWin Pro – Quick Start Guide
To retrieve your In-house series, select In-house
from the drop-down menu for Database. Search in
the In-house database using the same criteria as for
the EcoWin database.
13 DDE Linking
DDE is a way to transfer data to other Windows
applications. Reuters EcoWin Pro supports DDE
links to data in the EcoWin databases to make it
possible to use this data in applications such as
Microsoft Excel. When the data is updated in the
database, any data that uses DDE links is also
updated automatically.
An easy way to create a DDE link is to copy the
link information to the clipboard from a chart in
Reuters EcoWin Pro. Please note that DDE linking
can only be implemented before any analyses
are added. Select a value by clicking on a graph,
then copy (using the Copy command in the Edit
menu, the toolbar, the context menu or by pressing
Ctrl+C). In Microsoft Excel, select a cell and mark
the Link option in the Edit menu, Paste Special
dialog box. No analyses performed for the series
will be included in the link, and some analyses even
prevent links from being created, since there is no
obvious way to determine what the original series
or formula was.
Below are a few examples of DDE links for Excel:
EcoWin|Expr!’ew:swe19001’
The last value of the series ew:swe19001.
EcoWin|Expr!’ew:swe19001[-1]’
The second to last value of the series ew:swe19001.
EcoWin|Expr!’ew:swe19001/ew:gbr19001’
The last value of the formula ew:swe19001/
ew:gbr19001.
EcoWin|Expr!’ew:swe19001[-3,0]’
The last four values of the series ew:swe19001.
To enter a vector expression like this in Microsoft
Excel, mark four cells, enter the expression and
then press Ctrl+Shift+Enter.
EcoWin|Date!’ew:swe19001’
The date of the last observation of the series ew:
swe19001.
Reuters EcoWin Pro – Quick Start Guide 41
42 Reuters EcoWin Pro – Quick Start Guide
For more information:
Further Assistance
Send us a sales enquiry at
www.reuters.com/salesenquiry
Read more about our products at
www.reuters.com/productinfo
Find out how to contact your local office
www.reuters.com/contacts
Reuters EcoWin Pro Help
Reuters EcoWin Pro contains comprehensive
help documentation. Within this you will find
descriptions, definitions, formulas and examples.
Simply mark an item and press F1 on your keyboard
or click on the Help button in the toolbar.
Reuters EcoWin Excel Add-in Help
The help for the Reuters EcoWin Excel Add-in is
available in the EcoWin menu in Excel and contains
a quick start guide, user manual, and reference
manual.
Reuters Customer Zone
Technical and user documentation is available
on Reuters Customer Zone. This site includes
information for contacting Reuters support either
online or by local telephone.
http://customers.reuters.com
Access customer services at
www.reuters.com/customers
Reuters uses your data in accordance with Reuters
privacy policy in the privacy footer at www.reuters.
com. Reuters Limited is primarily responsible
for managing your data. As Reuters is a global
company your data will be transferred and available
internationally, including in countries which do
not have privacy laws but Reuters seeks to comply
with its privacy policy. If you wish to see or correct
data held on you or no longer wish to receive
information about developments in Reuters Group
products and services, such as free trials or events
or you wish to change your preferred method of
receiving a communication, please email esupport.
[email protected] writing “Personal Details” in
the subject line.
© Reuters 2007. All rights reserved.
Reuters, Reuters EcoWin Pro and the sphere logo
are the trademarks or registered trademarks of the
Reuters group of companies around the world.
Microsoft and Windows are registered trademarks
of Microsoft Corporation in the United States
and/or other countries.
Published by Reuters Limited, The Reuters Building,
South Colonnade, Canary Wharf, London, E14 5EP.
RA-Jun-07-1602 (v5.6)
Customer Support
For local telephone numbers please see:
http://customers.reuters.com
You can send your query directly to the Reuters
helpdesk by using the Contact Us form available in
the Help menu of the application.
REUTERS/Paul Matthews
Pilots fly their paragliders during day one of the 10th
World Paragliding Championships in the skies above
Manilla northwest of Sydney February 27, 2007.
The competition has attracted competitiors from 45
nations and lasts two weeks.