1
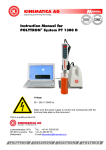
SAM BalanceLab 1.2 for Windows
User Manual
Version 1.2
Science&Motion Sports GmbH
BalanceLab User Manual
Text release 02/2009
Manufacturer and Distribution
Science&Motion Sports GmbH
Schaefergasse 4
65428 Ruesselsheim
Germany
Phone +49 (0) 6131 906 4440
[email protected]
www.scienceandmotion.com
Science&Motion Sports GmbH
BalanceLab User Manual
Page 2
Preface
Welcome to the User Manual for the BalanceLab software for analyzing the static and
dynamical pressure distribution, using the PDM-S measuring platform.
This User Manual provides a basic understanding for operating the software
BalanceLab for analyzing the pressure distribution of static and dynamic forces. It will
explain the basic set-up and operation of the PDM-S system, and provide tips on
preparation for measuring and data acquisition.
The company Science&Motions Sports GmbH i.G. does not assume any liability
whatsoever for injury to personnel or players or damage to the device caused by
improper use of the BalanceLab software.
All particulars about the Measurement System in this book were prepared, compiled,
and edited with the greatest of care. Nevertheless, we cannot guarantee that
mistakes do not appear. We advise the user that Science&Motions Sports GmbH i.G.
neither provides a guarantee against nor accepts any legal responsibility or any
liability for consequences resulting from incorrect statements.
If you notice any mistakes in this manual, or should you have any suggestions for the
improvement, we would be very grateful for giving us a short message any time.
In the interests of continuous product development, the manufacturer reserves the
right to carry out improvements to this manual and the product described there in at
any time and without any further obligation.
Registered trademarks
Different brand names are referred to in this manual. All these product names are
used only for clarity’s sake or for editorial reasons and are trade marks belonging to
the respective companies.
By using the brand names, the trade marks themselves and the rights of the
respective proprietors remain protected.
Science&Motions Sports is a registered trade mark and PDMS denotes a feature of
the company, Science&Motions Sports GmbH i.G..
The hardware, software, and company names referred to in this handbook are in
general brand names, trademarked, or patented.
Copyrights
This document and extracts taken from it may on no account be duplicated without
the explicit consent of Science&Motions Sports GmbH i.G.. The content of this
document may on no account be used for purposes that have not been approved. An
infringement of the copyright is a punishable offence.
© Copyright Science&Motions Sports GmbH i.G.
All rights reserved.
Science&Motion Sports GmbH
BalanceLab User Manual
Page 3
Conventions
In this user manual the following conventions will be used:
Important warnings are shown as following:
"WARNING" symbols indicate a potential hazard to the health
and safety of the users and/or players. The warnings
describe the danger involved and how this can be avoided.
CAUTION
Notes are shown in this way:
"NOTE" symbols denote a potential danger that can cause
damage to or destroy the device. These NOTE symbols describe
the danger involved and how this can be avoided.
NOTE
This manual is to be kept within easy reach so that the information it contains is
available to the user at any time.
Important Security Note:
The surface of the sytem is designed for indoor usage with sports shoes.
• never use the system if damp or humidity is on the surface or on a
player's shoes – there is a danger of slipping or falling for the player in
this case !
• never step on the plate with golf shoes equipped with hard spikes – the
surface of the plate might get damaghed over time!
Science&Motion is currently working on a solution with a covering mat for usage with
spikes or outdoor usage. Please contact us for availability date.
Science&Motion Sports GmbH
BalanceLab User Manual
Page 4
Table of contents:
1
INTRODUCTION ..............................................................................................6
1.1
Layout of the program...................................................................................... 6
2
PREPARING THE DATABASE (STEP 1)........................................................7
2.1
2.2
2.3
Instructions ...................................................................................................... 7
General information ......................................................................................... 7
Create new players .......................................................................................... 8
3
ANALYZING THE STATICAL PRESSURE DISTRIBUTION ...........................9
3.1
Instruction for the stance analysis.................................................................... 9
3.2
Execution of measurement (step 2) ............................................................... 11
3.3
Preparation for the report in the „View” (step 3)............................................. 14
3.3.1
Visualization of the measurement data....................................................15
3.3.2
Preparation ..............................................................................................16
3.4
The report (Step 3)......................................................................................... 17
3.4.1
Explanation of the report..........................................................................17
The histogram represents the average percentage pressure distribution of the left
and right fore and back foot and the percentage pressure distribution between left
and right foot. .........................................................................................................19
3.4.2
Comparison of two records ......................................................................19
3.4.3
Data Rating..............................................................................................20
4
ANALYZING THE DYNAMIC PRESSURE DISTRIBUTIONFEHLER! TEXTMARKE NICHT D
4.1
Instructions for the dynamic analysis ......... Fehler! Textmarke nicht definiert.
4.2
Execution of measurement (Step 2)........... Fehler! Textmarke nicht definiert.
4.3
Preparation for the report in the “View” (Step 3) ........ Fehler! Textmarke nicht
definiert.
4.3.1
Visualisation of the measurement dataFehler! Textmarke nicht definiert.
4.3.2
Definition of the steps ......................... Fehler! Textmarke nicht definiert.
4.3.3
Printing ............................................... Fehler! Textmarke nicht definiert.
4.4
The Report (Step 4) ................................... Fehler! Textmarke nicht definiert.
4.4.1
Explanation of the report..................... Fehler! Textmarke nicht definiert.
4.4.2
Data rating .......................................... Fehler! Textmarke nicht definiert.
5
FEATURES OF REPORT...............................................................................21
6
APPENDIX .....................................................................................................22
6.1
Minimum computer equipment....................................................................... 22
6.2
Software-Installation of BalanceLab............................................................... 22
6.3
Hardware Installation ..................................................................................... 25
6.4
Backup of all measurement data ................................................................... 26
6.5
Import and export of data............................................................................... 27
6.5.1
Import and export of individual measurements ........................................27
6.5.2
Export ASCII and APD.............................................................................28
6.5.2.1 Export ASCII ............................................................................................30
6.5.2.2 Export APD ..............................................................................................32
6.6
Notes for measuring principle ........................................................................ 34
6.7
Safety instructions.......................................................................................... 35
Science&Motion Sports GmbH
BalanceLab User Manual
Page 5
1 Introduction
The BalanceLab program for analyzing the distribution of static and dynamic forces
runs under Windows XP and Windows Vista.
Please find the instructions on the computer hardware requirements in the appendix.
1.1 Layout of the program
data base
1
real-time
measurement
2
result
viewer
3
report
4
The program includes a data base (1) in which projects, players, and individual
measurements are filed. On the basis of these data, the measurements (2) are run.
Afterwards the viewer (3) offers the possibility to review the recorded data again as
well as in slow-motion or time lapse. Different calculated data can easiliy be
accessed with a few clicks. This is done in the report funtion (4).
Moreover, the program includes a measuring data export option.
Science&Motion Sports GmbH
BalanceLab User Manual
Page 6
2 Preparing the database (step 1)
Note
Please first install the BalanceLab-Software before you plug in the
USB cable of the platform.
Information about the installation is given in the appendix
chapter 6.2
After the installation of the BalanceLab-platform please connect the USB cable
between the PDMS platform and the computer. Double-click the BalanceLab icon or
launch the program with "Start" - "Programme" - "SAM" - "BalanceLab". The
BalanceLab program will now open the database screen and you can prepare your
measurement.
2.1 Instructions
1.
Create a project
3.
Click "Measure"
2.
Create a new
entry with
player`s data
2.2 General information
The BalanceLab database system has three levels for measurement data
management:
Science&Motion Sports GmbH
BalanceLab User Manual
Page 7
The highest level is the project level. Here various projects, pratient groups or
program users can be assigned. Players` names are entered in the next level
(“Players”). Measurement data files are listed in the last level (“Records”).
The measurement file names are automatically assigned by the program according to
the date of examination and a consecutive number (e.g. 02-03-2006 Stance Test 2).
It is possible to rename data files.
By clicking on "New", "Delete", "Rename" or "Edit" projects, players or records may
be added, deleted or renamed.
2.3 Create new players
By selecting the functions “Player“ “New“ the following dialog appears for entering the
player`s data:
When entering a player's name, the sex and the birth date as well as a player
specific code can be entered. The birth date is entered under "Born" in the following
format: DD.MM.YYYY (the seperation can be done with . / or space, e.g. 21/03/06
and the program will automatically replace them with dots: 21.03.2006).
The field "Comments" can be used for findings, memos, etc.
Science&Motion Sports GmbH
BalanceLab User Manual
Page 8
3 Analyzing the pressure distribution
The BalanceLab sytem analyses the statical pressure distribution in real-time either
two- or three-dimensional. Furthermore it is possible to record an unlimited number of
measurements one after the other and to compare two different records in one report.
3.1 Instruction for the pressure analysis
To start the measurement please select “Stance Test” and click on
.
The measurement takes about 20 seconds. To adjust the measurement duration,
please click
under “Configuration”. Here the presetting of 20 seconds
can be changed.
NOTE
Please do not stand on the platform, when the Start-Button is
pressed.
Please wait until the hardware initialization has finished and
consider the given instructions.
First the platform hast to be calibrated. For this, please leave the platform and press
“Enter”.
Afterwards following screen will be shown
Science&Motion Sports GmbH
BalanceLab User Manual
Page 9
2D/3D view of
start
measurement the platform
displace the
parting lines
change the view
A
zoom in and zoom
out
B
C
D
Window A displays the presure distribution under the feet 2D or 3D . The color scale
on the left representing the force in N/cm² acting on the individual plate sensors. The
pink line is the connecting line of the three CoPs (Center of pressure). The middle
cross is the center of pressure of the contact area. Left and right points are the CoPs
of the left and right contact area.
Window B shows the force curves in relation to the measuring time. The vertical
reaction force of the left and right forefoot is shown at the top and underneath the
reaction force of the left and right backfoot.
Science&Motion Sports GmbH
BalanceLab User Manual
Page 10
In Window C the percentage values and the red and green bars indicate the forcedistribution between the left and right foot and the distribution between left and right
front and back foot .
% of front foot load left
% of front foot load right
% of back foot load left
% of back foot load right
% of load left side
% of load right side
Window D shows the various instructions for the respective measuring process and a
scale which indicates the time of measurement.
3.2 Execution of measurement (step 2)
Science&Motion Sports GmbH
BalanceLab User Manual
Page 11
Firstly the player stands on the platform. For the correct positioning please consider
the label on the platform.
Science&Motion Sports GmbH
BalanceLab User Manual
Page 12
The red lines separate the left and right body side as well as the fore- and backfoot.
button. Afterwards the lines can be shifted.
For correction, please press the
This step will be explained more detailed in chapter 3.3.2.
Please press the red record button
to start the measurement. Alternatively the
“Enter“ key can be used.
The measurement is stopped automatically after the selected measurement duration.
To abort the measurement at an earlier time, use the Stop button
“Enter“ key.
When the record is finished following dialog box appears.
or press the
Here the name of the record can be input. After confirming with “OK“ the
measurement will be saved and a new measurement can be performed.
The number of recorded measurements is not limited.
By clicking on “Cancel“ the last performed measurement will not be saved and the
main database is shown.
Science&Motion Sports GmbH
BalanceLab User Manual
Page 13
3.3 Preparation for the report in the „View” (step 3)
The “View“ program section is achieved via the database by clicking on the
button. Following screen appears:
Play back
measurement
view pressure distribution at the
current position
view average pressure
distribution
The View screen shows first or after activating the button
the average load
distribution under the feet.
The pink line is the connecting line of the three CoPs (Center of pressure). The
middle cross is the center of pressure of the whole body. Left and right points are the
CoPs of the left and right body side.
The distance which the CoPs cover during the measurement are drawn as white
curves.
the current screen view can be print out. In doing so it
With the print button
should be considered that the print job is send to the default printer of the computer.
Science&Motion Sports GmbH
BalanceLab User Manual
Page 14
3.3.1 Visualization of the measurement data
Several features are available for the visualisation of the measurement data:
•
Automatic play-back of the measurement by clicking the Play button
or
pressing “Enter“. The measurement is played-back and repeated until the
Pause button
(or the “Enter“ key) is pressed.
•
Press the
button to see the current force distribution. By shifting the
dashed line (with the mouse or the right and left arrow keys) in the force/time
diagram the measurement can be viewed at different points of time.
•
you can zoom in/zoom out the
With the ”zoom” buttons
presentation of the platform to the left or the force/time curve to the right.
By clicking with the left mouse button, holding the shift key and clicking the left
mouse button again, an interval in the force/time diagramm can be selected
(blue background). Now play-back or zooming of the interval is possible.
The scaling of the force/time diagram can be modified. For doing so the
mouse must be moved on the force axis of the force/time diagram so that the
following symbol appears:
•
•
By keep holding the left mouse button and moving left and right the scaling
can be adapted. In the same way the position of the base line can be changed
by moving up or down.
• The view of the platform can be changed in any way. First you have to activate
the button
. For changing the projection following features can be used:
Enables the scrolling of perspective views with the mouse
movement (hold the left mouse button).
Enables the zooming of views by moving the mouse
(hold the left mouse button).
Enables the rotation of perspective views. To achieve this,
move the mouse (hold the left mouse button).
Science&Motion Sports GmbH
BalanceLab User Manual
Page 15
3.3.2 Preparation
For preparing the report the software needs to know, where the left and right foot and
the forefoot and backfoot is positioned. This can be definied by clicking the
button (the lines turn yellow) and move the vertical and horizontal lines that way, that
the necessary information is correct.
To get to the report, please leave the viewer by clicking the Exit-Button.
Please confirm the question for “Save Changes” with Yes.
Science&Motion Sports GmbH
BalanceLab User Manual
Page 16
3.4 The report (Step 3)
To get to the report please click the
base.
button, which is available in the data
3.4.1 Explanation of the report
Science&Motion Sports GmbH
BalanceLab User Manual
Page 17
The report is composed of frames (graphics) which represent the measurement
results. The frames can be arranged on any number of pages in free selectable size.
More features of the report are explained in chapter 5.
The standard report of the static pressure distribution is build up as follows:
Header: caption, project name, player
name and date of measurement
The image shows the average load
distribution under the feet. The color
scale on the left quantifies the load
distribution.
The pink line is the connecting line of
the three CoPs (Center of pressure).
The middle cross is the center of
pressure of the whole body. The
ellipse around the cross includes 95%
of the CoPs. Characteristics of the
circle are displayed in a chart.
Left and right points are the CoPs of
the left and right body side seperately.
Confidence ellipse width: indicates the
amplitude of the ellipse in mm
Confidence ellipse height: indicates
the height of the ellipse in mm
Confidence ellipse angle: indicates
the orientation of the direction of the
longitudinal axis of the ellipse
compared to the logitudinal (x-) axis of
the platform in degree and the
orientation direction (left or right)
Confidence ellipse area: indicates the
area of the ellipse in mm²
CoF total track length: is the sway
path length in mm (length of way of
CoP)
CoF horizontal and vertical deviation:
are the standard deviation and
characterise the sway path width in
mm.
Science&Motion Sports GmbH
BalanceLab User Manual
Page 18
The diagram “Forces (N)“ displays in four
force/time diagrams the vertical floor
reaction force of the left/right forefoot and
the left/right backfoot in relation of the
measuring time.
The histogram represents the average
percentage pressure distribution of the left
and right fore and back foot and the
percentage pressure distribution between
left and right foot.
3.4.2 Comparison of two records
In order to compare two different measurements, please proceed as follows:
• Mark the first record
• Mark the second record of equal type (stance test or dynamic test). To mark
the second record keep the ‘Ctrl’ key pressed and click on the second record.
• Click the ‘Report’ button in the database
The report shows now colored and grey diagrams. The colored diagrams represent
the first and the grey diagrams represent the second measurement.
Science&Motion Sports GmbH
BalanceLab User Manual
Page 19
3.4.3 Data Rating
The image above indicates the following:
The load distribution between left and right foot is expressed as a percentage.
A perfect distribution is an equal distribution of 50 % for the right and left
contact area.
Ideally, the connecting line of left and right CoP (pink line) runs parallel to the
connection of the heel contacts.
By the load distribution between backfoot and forefoot the forefoot should be
loaded with approx. 1/3 (33%) and the backfoot with approx. 2/3 (66%).
The maximum load should not exceed 15 N/cm².
For sensitive feet (e.g. diabetics, etc.) the pressure should be less than 11 N/cm² in
order to avoid any damage to the soles of the feet.
These values apply to a “normal” load distribution during upright standing without
shoes.
Science&Motion Sports GmbH
BalanceLab User Manual
Page 20
4 Features of Report
To change the layout of the report click on the “Edit Layout“ button
.
• Size and position of frames
Size and position of the graphic presentations can be modified by clicking on the
frames and dragging with the mouse.
• Header and footer
Under “Edit” – “Header” / “Footer” the top or bottom line can be changed.
• Saving
New settings are stored with "Save Template" under "File".
• Zoom buttons
With the zoom buttons, the actual size of the report can be maximized or
minimized.
• Viewing the whole page
By clicking the button for viewing the whole page, the report can be shown on the
screen as it will be printed. With the zoom buttons, the actual view can be
maximized or minimized. You can view "Two Pages" at the same time or change
to the "Next Page" or "Prev Page" by clicking the buttons.
With "Close" the side view is finished.
With “Print…” the report can be printed. Please note that for this operation, the
driver of the printer must be installed.
•
Exit
Leave the Report screen by clicking on the”Exit” button or on
right corner of the window.
Science&Motion Sports GmbH
BalanceLab User Manual
in the upper
Page 21
5 Appendix
5.1 Minimum computer equipment
•
•
•
•
•
•
•
Intel Pentium IV or better
1024 MB RAM
VGA graphics card with resolution 1024 x 768 and 24Bit True color
Color monitor with minimum resolution 1024 x 768
Windows XP or Windows Vista
200 MB free disk space on drive C:
min. one free USB port
5.2 Software-Installation of BalanceLab
Attention: Please do not connect the USB cable between the
PDMS platform and the computer before the software has
been installed on your computer!
NOTE
To install BalanceLab start Windows and place the CD in the computer. The
installation runs automatically.
Following window opens:
By clicking on the "Next" button the installation will start.
Science&Motion Sports GmbH
BalanceLab User Manual
Page 22
Accept the license agreement and click "Next" to continue.
By default the program will be installed to the folder " SAM BalanceLab 1.0 into your
Windows programs folder. You can change the installation location if you like.
In the case of installing the software as an update, the existing measuring data will
be included in the update automatically
Science&Motion Sports GmbH
BalanceLab User Manual
Page 23
After successful installation an icon with the name "SAM BalanceLab" automatically
appears on the desktop.
Now at this stage (but not beforehand), please connect the
platform to the computer using the enclosed USB cable !
NOTE
After this, the USB driver will be installed automatically. Please ignore any error
messages of the Windows operating system that might appear during the installation.
Be sure to press "Continue" at any warning message, never press "Cancel".
Science&Motion Sports GmbH
BalanceLab User Manual
Page 24
5.3 Hardware Installation
Normally you would not need to change anything here. The default values are set for
operation with USB connection.
Select „Setup“
in the database. You will reach the hardware setup:
The interface mode (serial or USB) can be changed with „Others“.
To select the measurement device (USB interfaces) or the port (e.g. COM1) use
„Settings“.
For information about your measurement device please
consider the lable at the platform side next to the cable
connections.
NOTE
This table shows which settings have to be confirmed before measuring:
connection cable
Other...
Settings...
USB
SDK Driver
FDM
Serial
chosing the port
SDK Driver
„PDM device on RS232“ and
chosing the port with „Setup”
Serial
Science&Motion Sports GmbH
BalanceLab User Manual
Page 25
5.4 Backup of all measurement data
In order to avoid loss of data due to a technical defect of the hard disk a backup of
measurement data in regular intervals is recommended.
The program path is set to C:\Programme\SAM\BalanceLab on standard installation.
In this directory, the whole data are arranged in the sub-directory „Data“.
In order to back up all the measurement data, this sub-directory is copied on to a
second hard disk, tape drives, DVD or CD. Special backup software is available
for the tape drives, which is normally supplied with the drive. Backup on a second
hard disk can be performed with the help of the Windows Explorer.
Science&Motion Sports GmbH
BalanceLab User Manual
Page 26
5.5 Import and export of data
The database has a „Copy“ function to import or export players with their
measurement data or just a specifc measurement. Furthermore it is possible to
export all data in different formats.
For single records following features are available:
• „External Records“
• „APD Export“
• „ASCII Export”
5.5.1 Import and export of individual measurements
By clicking the „Copy“ button from “Players” or by clicking the “Copy” button from
“Records” and selecting “External Records” the following dialog box appears:
Science&Motion Sports GmbH
BalanceLab User Manual
Page 27
1.
Chose the path
(source directory or
target folder)
2.
Confirm with „OK“
After confirmation the next dialog box appears:
The left side represents the existing, local database. On the rigth-hand side any
database can be selected which is on a floppy disk, hard disk or on other data carrier.
The background of the respective selected record is blue. By pressing the „
“
“ button the selected data are imported in the local database or are
or „
exported in the chosen directory.
Whereas the double-arrow to the left
is for the import and the double-arrow
to the right
is for the export of the measurement data.
5.5.2 Export ASCII and APD
Similar to the normal export (chapter 6.5.1) a target folder for saving the exported
files has to be selected first.
In the following chapter the structure of the ASCII- and APD-files are explained.
Science&Motion Sports GmbH
BalanceLab User Manual
Page 28
For better understanding of both export results, following pictures show the position
of the used coordinate system in relation to the PDMS platform.
View static measurement:
View dynamic measurement :
Science&Motion Sports GmbH
BalanceLab User Manual
Page 29
5.5.2.1 Export ASCII
By exporting ASCII data a text file is created. The structure of the ASCII-File is built
up as follows (e.g. dynamic analysis):
1
2
3
4
5
Science&Motion Sports GmbH
BalanceLab User Manual
Page 30
6
7
8
9
1 player data (name, sex, date of birth, ...)
2 record data (name, creation date,...)
Time specific value like starttime and duration of the exercises of the
3
measurement
frequency in Hz and number of samples, which have been recorded during the
4
measurement.
The chart displays the force in N and the max. pressure in N/cm² of each sensor
5
and for each sample of the off-roll analysis.
6 platform, sensor, frequency, ... data
Science&Motion Sports GmbH
BalanceLab User Manual
Page 31
The main part of the file consists of frames of each recorded sample. In the frame the
force value of each sensor is shown. The example shows, that 211 samples were
recorded. The number of samples depends on the frequency and the duration of the
measurement (here 60 Hz and 3,51sec)
Title of the chart, consecutive numbering of the charts, position of the center of
pressure CoP
Matrix of recorded forces for each sensor. Columns= x coordinate, lines =y8
coordinate
9 Continuation of the chart
7
5.5.2.2 Export APD
In case of an export to APD format is performed, files with the extension „.apd“ are
created. If a dynamic measurement is exported to APD-format and more than one
roll-off analysis was performed, each roll-off analysis is exported to one single APD
file.
1
2
3
Science&Motion Sports GmbH
BalanceLab User Manual
Page 32
4
1
2
3
general information about the measurement, file
player data (name, sex, foot side)
technical platform and sensor data:
• maximum number of sensors in x and y direction
• the lowest sensor number, seen from the origin, which was loaded
• number of heavily loaded sensors in x and y direction
• sensor size
4
Chart of recorded forces for each sensor (only the part, which was loaded).
Columns= x coordinate, lines =y-coordinate. The value „-1“ stands for an
unloaded sensor.
Please consider the position of the coordinate system.
Science&Motion Sports GmbH
BalanceLab User Manual
Page 33
5.6 Notes for measuring principle
The measuring system must be checked at regular intervals to
ensure that the measuring function is operating correctly.
NOTE
Notes
If invasive measures are to be taken, the measuring system must only be used as
additional expert evidence. On no account can or may invasive interventions or
measures potentially dangerous to the player be undertaken solely on the basis of
the measuring results.
In the event of recognizable damage to the sensor area of the measuring platform,
no further measurements must be undertaken.
After the performance of a zero measurement, no measured values must be
displayed in the unloaded state. Furthermore, the pressure distribution images must
be examined regularly for atypical measuring patterns. These mainly concern column
or row shaped measuring patterns distinguishable from the surrounding values.
If any of the faults described occur or in the event of doubt, the manufacturer must be
contacted.
Calibration
The measuring accuracy of the sensors for the pressure distribution measurement
must be checked from time to time using a specific force.
This can be done by a user of known body weight standing on the platform with one
foot. Taking into account the acceleration due to gravity, the platform must indicate
any not fully loaded marginal sensors and the measuring tolerance of the
approximate body weight. A false indication means that re-calibration must be carried
out by the manufacturer. In any event, the measuring platform must be checked and
re-calibrated every two years by the manufacturer.
Science&Motion Sports GmbH
BalanceLab User Manual
Page 34
5.7 Safety instructions
General safety instructions for operating the system
CAUTION
•
Never use the device in a damp place or where it could possibly be sprayed
with fluids. Any fluid penetrating the device can cause a fire, electric shock or
other serious accidents.
•
Never pour any fluid over the system or its components.
•
Do not place the system on an unstable surface.
•
Do not install the system above or near any heating.
•
Only operate the system using the stipulated mains voltage and the supply
unit that has been approved for medical products and is included in the
delivery by the manufacturer.
•
Lay the mains cable such that no-one can trip over it and check regularly that
it is not damaged.
•
Never insert any objects in the system components.
•
Do not attempt at servicing the system in any manner other than that
described in this manual. If the cover is removed it is possible that you could
be exposed to lethal voltages or other hazards.
•
Should one of the situations in the following list occur, please do not fail to
contact the manufacturer:
a) The mains cable or mains plug has been damaged
b) Fluid has been spilled over the main device or other system
components
c) The system fails to function properly although the operating instructions
have been adhered to
d) The platform or other system components has/have been dropped or
the housing has been damaged
Safety instructions for applying the PDM-S Platform on the
player results.
CAUTION
•
Before using the device for the first time, please read the operating manual
and safety instructions carefully. If there is any uncertainty about applying the
device correctly, or about its correct mode of function, the Instruction Manual
must always be consulted. Therefore the Instruction Manual should always be
kept within easy reach of the product.
Science&Motion Sports GmbH
BalanceLab User Manual
Page 35
•
The application and operation of the system and also the evaluation of the
measuring data and their interpretation may only be carried out by trained
qualified personnel. The manufacturer assumes no liability for any injury to
persons, damage to property, or loss of data due to improper use of the
software, the device or its component parts.
•
The players’ data and measuring data may only be copied, moved, or deleted
using the database function provided by the SAM application programs. In the
case of data being changed intentionally without using the database functions,
the user alone bears the full risk.
•
Before beginning each measurement, check to ensure that the correct choice
and correct position of the transmitters or application aids have been carried
out.
•
An injury hazard exists for the player from the cables. Please observe here the
special instructions in the application software manuals and take particular
care not to allow any children or mentally retarded persons to go near the
device without supervision.
•
Should there be any damage to the device or component parts, they should be
returned to the manufacturer for a safety check. It is forbidden to continue
using them, as severe damage and serious injuries - even lethal injuries - may
result. The manufacturer must always be contacted in all cases of fault or
doubt.
•
We also point out that by making changes to this certified device or its
accessories your legal right to operate it will be nullified.
•
Should any invasive measures be taken, the measuring system may only be
applied as a supplementary means for expert evaluation. On no account must
or may invasive measures or measures endangering the player be carried out
solely on the basis of the measuring results.
•
The platform must be set up on a non-slip base, or built into a catwalk, in order
to rule out any danger to the player due to the platform slipping.
•
The servicing, repair and re-adjustment must only be carried out by
authorized, qualified specialist. Only store and transport in the original packing
supplied by the manufacturer.
Science&Motion Sports GmbH
BalanceLab User Manual
Page 36