Download User Manual - Spectrum Analyzer
Transcript
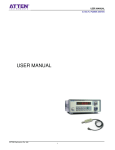
User Manual
ATN3021/ATN3022 Network Analyzer
User Manual
ATN3021/ATN3022
Network Analyzer
ATTEN
www.attenelectronics.com
ATTEN Electronics Co. Ltd.
1
User Manual
ATN3021/ATN3022 Network Analyzer
ATN3021
ATN3022
ATTEN Electronics Co. Ltd.
2
User Manual
ATN3021/ATN3022 Network Analyzer
CONTENTS
Section
1.
Page
General Information
4
1.1 Introduction
4
1.2 Precautions On Safety
4
1.3 Technical Terms
4
2.
System Specifications
6
3.
Face Panel And the Keys
7
4.
Operating Methods
8
4.1 Warm Up Of The Instrument
8
4.2 Top Menu
8
4.3 Preset The Frequency Scan Project
8
4.4 Reflection Measurement
10
4.5 Transmission Measurement
11
4.6 Gain Measurement
12
4.7 Simultaneous Measurement Of The Insertion Loss And The Return Loss
13
4.8 Fault Location
14
4.9 About Printing
16
4.10 Other Application Notes
17
Performance Verification
19
5.1 Verification For The Insertion Loss Readings
19
5.2 Verification For Directivity
19
5.3 Verification For Phase Accuracy
20
6.
Maintenance And Troubleshooting
21
7.
Warranty And Extended Support
23
5.
ATTEN Electronics Co. Ltd.
3
User Manual
ATN3021/ATN3022 Network Analyzer
GENERAL INFORMATION
Introduction
ATTEN is the abbreviation of the Popular Portable Phaser Network Analyzer (usually phaser is
replaced by vector). The equipment is designed to measure the performance of one port or two port
R.F. Networks. One port feature includes the input impedance or S.W.R. of an antenna or other load.
Two port feature includes insertion loss, phase shift and group delay.
With frequency synthesizer, receiver, display and printer assembled all in one small cabinet, it can
easily be carried and accomplish tests individually.
It is simply menu -operated, with only five keys on the panel.
1.2 Precautions on Safety
A ground wire must connect the screw on the rear panel to an earth ground to make the
cabinet safe from shock hazard.
Do not plug in or pull out any cards and ICs when power is on.
If the instrument goes out of order because of something wrong, press RESET, and restart it.
Beware of destructive pin depths on mating connectors. If the center pin is too long or too
eccentric, do not mate it before repair. Usually a protective adaptor is preferred.
Do not connect the instrument to the antenna if there exists a strong transmitting signal from a
radar or radio station in near by. Otherwise the receiving power in antenna will damage the
instrument. The instrument only can withstand a few miniwatts.
When printer runs with a strange sound and the paper does not come out, the paper roll may
run out. Press RESET, and then examine it.
Although the instrument is portable, care must be taken when transporting it.
1.3 Technical Terms and Their Meanings
Reflection coefficient Г, return loss (R.L.) and standing wave ratio (S.W.R.) are three terms to describe
the match state of the load, let Zo is the characteristic impedance of a transmission line, and Z is the
impedance of the load. The relations between them are:
Г= ( Z - Zo ) / ( Z + Zo )
R.L.= 20 log│Г│
S.W.R.= ( 1 + |Г| ) / ( 1 - |Г| )
Reflection Bridge (R.B.) is a Wheatstone bridge in radio frequency. The output voltage is proportional
to the reflection coefficient. So we call it Reflection Bridge, but directional bridge or S.W.R. bridge may
also be called.
ATTEN Electronics Co. Ltd.
4
User Manual
ATN3021/ATN3022 Network Analyzer
Transmission coefficient T and Insertion Loss (I.L.) are defined as:
T = V2 / V1 = | T |
∠φ
I.L.= 20 log | T | (ignoring the negative sign)
φis the phase shift of the device under test (D.U.T.).
Group Delay or delay for short:
τ= -dΦ/ (360°df ) ; in which, τin µs, φ in degrees and f in MHz.
Z0
Device
Under
~
ATTEN Electronics Co. Ltd.
V1
Test
5
V2
Z0
User Manual
ATN3021/ATN3022 Network Analyzer
SYSTEM SPECIFICATIONS
2.1 Scan Features and Channels
ATTEN 3021:
30-3200 MHz, One test channel, i.e. 30/3200 series.
ATTEN 3023:
30-3200 MHz, Two test channel, i.e. 30/3200 series.
For 0.001/120 series, only 0.005-110MHz should be eximmed.
Pure digital frequency scan (jump), Minimum Step Size ⊿f is associated with varies
series of type.
Frequency accuracy ≤10-4
2.2 Dynamic Range
I. L .measurement: 70 dB
R.L. measurement: 50 dB
Gain measurement: 30 dB
2.3 Resolution and Uncertainty
The resolution of small I.L.is 0.01 dB,The uncertainty is 0.2 dB + ( dB value )×4% within
50 dB.
The resolution of small reflection is 0.002. The uncertainty of small reflection is 0.01
( residual SWR 1.02 ) below 1600 MHz, and 0.02 above;
The phase resolution is 0.01°. The uncertainty is 5°/magnitude below 1600 MHz, and
10°/magnitude above.
2.4 Directivity of R.B. is 40 dB below 1600 MHz, and 35 dB to 3200MHz.
2.5 Return loss of 50Ω load : 46 dB below 1600 MHz, and 40 dB to 3200MHz.
2.6 Dimension
133mm (H) × 430mm (W) × 450mm (D)
Net Weight: ~13 kg
2.7 Power
AC 50Hz, 220 V, 0.2A, Fuse 1A
ATTEN Electronics Co. Ltd.
6
User Manual
ATN3021/ATN3022 Network Analyzer
FRONT PANEL AND THE FUNCTIONAL KEYS
3.1 Sketch of Front Panel
LED
INTENSITY
DISPLAY
↓
→
←
MENU
RESET
RF OUT
A input
B input
EXE
Note :
Printer outlet is on the rear panel.
Rear panel sketch is on the rear panel name plate.
A input and B input is equal, may be exchanged or replaced each or ther.
The B input port is blocked for one channel instrument. In this situation, only port A input
is used for either T or Гtest.
3.2 The Functional Keys
RESET
This key is used to stop all operating and return to the initial top menu.
↓
This is a dual function key. One of the functions is during menu select, by pressing this
key, the marker can move from the top item to the bottom item and just circulated in one
direction to an item whatever you want. The other is during measuring you may press
the key to change the scale of the screen.
←
←
→
These two keys have the same function but with opposite direction. They also work in
two style. During menu selecting, pressing it you can change the terms or numbers to
whatever you want. During measuring, you may press one of them to shift the marker to
the point you are interested.
MENU
During measuring, a second menu is shown when you press it. It can also be pressed
after printing is finished to return to the second menu. In top menu, pressing it will bring
you the preset scan project menu.
EXEC
When the item is determined in the second menu or marker under CALI: in top menu,
you can start running the item by pressing the key.
ATTEN Electronics Co. Ltd.
7
User Manual
ATN3021/ATN3022 Network Analyzer
OPERATING METHODS
4.1 Warming up the instrument
Be sure the chest is well grounded.
Plug in the power cord.
Switch on the switch on the rear panel.
For small Insertion Loss measurement, the warming up time is at least 20 minutes.
Note: Usually, the longer the better.
4.2 The Top Menu
Whenever you power on or press the RESET key, the Top Menu is shown:
Menu:
Notes:
F. D.
Now in frequency domain
XX
XX presents ⊿F min
BF:
Beginning Frequency MHz
⊿F:
Frequency Step Size MHz
EF:
Ending Frequency MHz
N:
Number of test points
M: NORM
Mode select, usually utilize NORMAL mode,
TEST:
Port select and measurement item Select
+++++++++++++
CALI:
Calibration
During the right beginning, the marker is flashing at the CALI item. That means if you do not want to
change anything on the top menu, you can calibrate it now to start measuring.
If top menu is in F.D. or T.D. and you want to change it to T.D. or F.D., press ↓ to move the marker
under the F.D. or T.D., then press →, you can get the instrument into one of the domains you want.
PRECI i.e. precision mode is more accurate but take more time.
4.3 Preset or select the Frequency Scan Project
There are two methods to change the frequency scan project: On top menu or on the Frequency Scan
Project Menu.
ATTEN Electronics Co. Ltd.
8
User Manual
ATN3021/ATN3022 Network Analyzer
When preset the scan project, you should select the ⊿F min first.
For 30/3200 series, in 1600 -3200MHz range, the ⊿F min is 0.2MHz, below
1600MHz ⊿F min is 0.1MHz and 0.025MHz maybe selected.
For 30/1600 series, ⊿F min is 0.1MHz and 0.025MHz maybe selected.
For 5/870 series, ⊿F min is 0.1MHz and 0.025MHz maybe selected above 28MHz.
For 0.001/120 series, ⊿F min is 2KHz and 0.5KHz maybe selected.
4.3.1
Preset the scan project on top menu
Press ↓ to move the marker under BF, then press ← or → to get the right beginning frequency
you want.
Press ↓ to move the marker under ⊿F, then press ← or → to get the right ⊿F you want.
Press ↓ to move the marker under EF, then press ← or → to get the ending frequency you
want. EF=BF+ (N-1)⊿F, N varies as the EF varies. The minimum N is 1, the maximum N is 81.
Setting a point frequency measurement. Press ← to get the ⊿F=0 or EF=BF, the instrument
will operate in a point frequency state.
4.3.2
Preset the scan project on scan project menu with equal ⊿F
Press the MENU key on the top menu, you get into the scan project menu. This menu has two
layers, first one is the scan number menu, the second is the scan project menu.
Press the ↓ key , the marker will circulate from 1 to 7. Lets the marker stay on some project
number you want, if the project is just what you need, press the EXEC key, then you return to
the top menu . If the project must be modified in 1-6, Press the MENU key again, then you get
into the scan project menu, now you can change them just like the procedure in 4.3.1 to get
the right value.
4.3.3
Preset the list scan project menu
Lets the marker stay on project no.7, then press the MENU key and select the ⊿F min.
Press the ↓ key to move the marker under N, use the ←or→ key to get the number of test
points what you want in 1 to 30.
Press the ↓ key to move the marker to set the point frequency, this is most use-ful to the test of
dual frequency antenna or for the equal ratio scan.
ATTEN Electronics Co. Ltd.
Press the EXEC key to return to the top menu and press the RESET key to conform it.
9
User Manual
ATN3021/ATN3022 Network Analyzer
4.4. Reflection Measurement
A input
RF OUT
B input
R.B.
4.4.1 Impedance Measurement
Connecting the cables as shown in the figure, and let the RB (Reflection Bridge) open.
On top menu, press ↓ key to move the marker under the TEST:, then press → to get until item
REFL is shown under B.
Press ↓ or RESET to move the marker under the CALI: OPEN.
Press EXEC, the frequency number increases at the right bottom of the screen and soon
change into REFL coordinate, the test points will lie on 0 dB line.
Press the Menu key and move the marker under SHORT ,Connect the short plug on the test
port of RB, then press the EXEC key, the Smith chart is shown and the marker is blinking at
R=0. Disconnect the short plug, the marker is now at ∞.
Connect the device under test to the test port of the R.B., the measured curve is then shown
on the chart.
You can press← or → key to see the numerical value of each point.
Use ↓ key , you can change the scale.
4.4.2. Test the R.L.(return loss) in dB
If you want the RL response in dB, press the Menu key and move the marker under dB, press the
EXEC key then you gets it.
4.4.3. Test of S.W.R.
While R.L. test is running, if you want to see the S.W.R. of the DUT, press the MENU key and
move the marker under the S.W.R., then press the EXEC key.
ATTEN Electronics Co. Ltd.
Use the ↓ key, you can change the scale to see the smaller value curve.
10
User Manual
ATN3021/ATN3022 Network Analyzer
4.4.4. Three Terms Calibration
To enhance the accuracy, three terms calibration may be used. They are open, short, and zero
set. Usually single open calibration is satisfied for general purpose. You may add the short
calibration to get a better accuracy.
If you want to measure the R.L. around 40 dB or sometimes you want to enhance the
directivity of a worse RB, the zero set calibration may be introduced.
Connect a precision termination to the R.B. test port, press MENU, then choose the ZERO
SET and press EXEC. Then test points will all go down to 50 dB line which means the zero set
is fulfilled. At this time the effective directivity of RB is equal to the RL value of the precise
termination.
Three terms calibration may introduced when you measure the DUT through a protective
adapter or a test cable. Beware the RL of the test cable is 24dB or better, otherwise you may
get wrong readings.
4.4.5. Shift of Reference Plane
Smith Chart is very useful to do the impedance matching job. But the right reference plane should
be chosen. In the procedures above, the reference plane is at the RB test port, but may be not the
case you want. The reference plane can be shifted in two ways.
Disconnect the point you are interested (The maximum reflecting point, which usually occurred
at the main feeder line input or output), and do the open calibration ( do the short calibration
also if it is convenient). Then the reference plane is shifted to that point.
If the length between RB test port and the point of interest is known in electrical length ( by a
test of T.D.). Press MENU, move the marker under the SHIFT, press the → or ← to set the
right length to be shifted, then move the marker under SMITH CHART press EXEC. The
reference plane is shifted.
4.5 Transmission Measurement
4.5.1 Insertion Loss
Measurement
On
top
RF OUT
menu, press
A input
↓ to move
the
under
marker
the
10dB
10dB
TEST:, Then
press → or
DUT
← to get the
TRAN item under A.
ATTEN Electronics Co. Ltd.
11
B input
User Manual
ATN3021/ATN3022 Network Analyzer
Connect one end of the cables to the RFOUT and A input .Then connect the other end to two
10 dB attenuators joined by a twin female adapter. As is shown in the diagram above.
Press ↓ to move the marker under CALI: THROU to do the through calibration, and then press
EXEC. Screen turns to rectangular coordinate and test points lie on 0 dB line.
Disconnect the adapter and insert the DUT. The I.L. curve will be shown.
Press ↓ to see smaller IL loss.
To minimize the drift, measure the I.L. soon after calibration.
Two 10 dB attenuator is needed in small I.L. measurement. In the test of large IL greater then
50 dB, the attenuators should not be introduced.
4.5.2 Measurement of phase shift and magnitude
φ.L., then press EXEC you can get the PHASE vs I.L. curve.
Press MENU, select
Press ↓, you can get the expanded PHASE vs 4 dB I.L., PHASE vs 20 dB I.L, Expanded
PHASE vs 20 dB I.L. curves sequentially.
4.5.3. Group Delay Measurement
During TRAN test, press MENU, move the marker under GROUP DELAY. Press → or ← to choose the
suitable delay time.
Press EXEC, you can see the delay curve on the screen.
NOTE: 1. The frequency scan project depends on the frequency band of the DUT, and ⊿F is
associated with τ, such as 50/ τ ≤⊿F ≤500/ τ, typical value as shown:
Group Delay τ
Typical ⊿ f
MHz
10µS
0.025
1µS
0.2
100nS
2
10nS
20
The test points can be selected between 21 and 81.
Since the scan project is not unique, various projects may cause the results not so coincide.
You must choose the suitable scan project as a designated scan project for each kind of
device via practice.
NOTE 2. The delay of an amplifier can be measured the same as an IL test by connecting
some attenuator to cancel the gain. Usually the delay of attenuator can be ignored. However
you may measure the delays of attenuators and adapters and subscribe them from the total
group delay value.
4.6 Gain Measurement
4.6.1Precautions
Beware of the maximum output of the amplifier under test. Since the sensitivity of the input port is very
high and no attenuator is inside, the receiving port can withstanding only a few miniwatts. So some
external attenuator must be introduced to cancel the gain of the amplifier. Since a 30 dB gain
measurement scale is provided by this instrument, an attenuator about 30 dB must be added in.
ATTEN Electronics Co. Ltd.
12
User Manual
ATN3021/ATN3022 Network Analyzer
4.6.2
Gain
Measurement
Connect as shown.
The
may
be
inserted
the
RF OUT
attenuators
A input
B input
all
behind
amplifier,
or
one in front and
30dB
the other behind
with
DUT
amplifier in
between, depends
on the power level
of the amplifier.
On top menu, move the marker under TEST:, press → or ← , choose GAIN.
Press ↓ move the marker under CALI: THROUGH, then press EXEC. The screen turns to 30 dB
gain coordinate, with the test points on 0 dB line.
Insert the amplifier between the connectors the gain curve is shown.
Suggestions:
If gain is greater than 30 dB but less than 50 dB, an additional 20 dB attenuator must be
introduced. Since this 20 dB will take count in the gain value, the true value of the attenuator is
needed.
If the dynamic range of the gain measurement is not satisfied, try to introduce external attenuator
to substract the gain of the amplifier. Then test it in I.L. measurement. That may get you some
benefits, but the data is indirect and must be calculated.
4.7
Measure the insertion loss and return loss simultaneously
This function is only provided by two test channel instrument.
A input
RF OUT
B input
R.B.
rtttt
Connect as shown above. In front of T IN port a 10 dB attenuator ( isolator or circulator) must
be connected to improve the match of the A input port.
ATTEN Electronics Co. Ltd.
13
User Manual
ATN3021/ATN3022 Network Analyzer
Press ↓ to move the marker under TEST: , use → or ← get TRAH, REFL item.
Press ↓ to move the marker under CALI: OPEN
Be sure the RB test port is open. Press EXEC. After calibration of open, CALI: THROU is
shown.
Connect the RB to A input port with a twin male adapter or a test cable. Then press EXEC, the
IL test points will lie on the 0 dB line, and the R.L. test points is the R.L. of the A input port.
Disconnect the adapter or cable to insert the DUT, the IL and RL curves is shown
imultaneously.
You may change IL scale by press ↓.
You may change the coordinate by press MENU.
When φ.L. coordinate is chosen, press ↓, you can get PHASE and RL, expanded PHASE and
RL, PHASE and IL, expanded PHASE and IL sequentially.
When Smith Chart is chosen, it will be the same as impedance measurement and no .L.
information.
Suggestion:
The accuracy of measurement with two parameters is worse than single one. If it is not necessary,
measurement on one parameter is preferred.
If you want to see the gain and R.L. feature simultaneously, it can be done by introduce attenuator
to cancel the gain and do the same job as to measure the I.L. and R.L. simultaneously.
4.8. Fault Location In Time Domain (T.D.)
4.8.1 Introduction
In a station, the distance between transmitter and antenna is usually from tens to several hundreds
meters. If there is a fault in the transmission line which causes the system to an abnormal condition,
you must locate the fault point. It can be done by T.D.R. ( Time Domain Reflectometer ) before, but
now in this instrument we use the reflections in frequency domain to calculate and display the time
domain features on the screen.
Here we use 81 points to simplify the test and the calculation. Thus yields two parameters are as
follows:
The ambiguity range = 150 / ⊿F
The resolution = 150 / (N-1) ⊿F
All range (length) here is in electrical length. It relates to the physical (mechanical) length with a wave
velocity rate 1/ ε , where ε is the effective dielectric constant of the cable. Usually the wave velocity
rate lies between 0.6 to 1, you can get it by measuring both the physical and the electrical lengths of a
cable, and then calculate the ratio between these values.
The procedures of time domain test is described as follows.
ATTEN Electronics Co. Ltd.
14
User Manual
ATN3021/ATN3022 Network Analyzer
4.8.2 Get Into The Time Domain
In top menu, press ↓ to move the marker under F. D., then press
→to
enter the TIME
DOMAIN (T.D.) state
Press ↓ to move the marker under TEST, then press → or ← to get the suitable range. Here is
a table for reference.
Test Range
Ambiguity Range
Resolution
Nominal Accuracy mm
m
m
m
1200
1500
19
± 400
600
750
9
±200
300
375
5
±100
120
150
2
±40
60
75
0.9
±20
30
37.5
0.5
±10
12
15
0.2
±4
6
7.5
0.1
±2
3
3.75
0.05
±1
Press MENU to get the preset scan project. If it is not suitable for your requirement, you may
change the BF and EF, but the value of ⊿F will remain the same.
4.8.3 Open and Short Calibration
Connect the cables just as in R.L. test, and let the R.B. test port open.
Press ↓ to move the marker under CALI: OPEN. Then press EXEC.
When CALI: SHORT are shown, connect the short to the RB test port, and press EXEC.
In fault location, two terms calibration above is sufficient in general. If the reflection is too small,
you may back to F.D. to do the ZERO SET as described in 5.4.4, then return to T.D. to
measure the small reflection.
4.8.4. Time Domain Measurement
When screen is turn to the T.D. coordinate, connect the cable under test to the test port of R.B.
The frequency digit varies at the right upper corner, which means the F.D. test is now running. When
the digit disappeared, the computer does the time domain analysis and the calculated point will swept
from left to right displaying the reflection values versus distance.
During display time, press ↓ can change the vertical scale (1.0, 0.25, and 0.05). Press → or ← can
ATTEN Electronics Co. Ltd.
15
User Manual
ATN3021/ATN3022 Network Analyzer
move the marker to see the parameters of each point.
Г is the reflection coefficient, d is the electrical length, t is delay time along the cable, φ is the angle of
Г ( Φ near 0°, denotes a fault of open; near 180° denotes a fault of short ).
4.8.5
Time Domain Menu
A press of MENU during the display time will bring you the T.D. menu. One of thefour
functions can be selected.
ZOOM the region near by the marker can be enlarged four times to show the details and the
distance of the maximum reflection point dma will shown on the bottom line.
FULL Back to full size as in 5.8.4.
F.D. You may move the marker under it and press EXEC to see the F.D. feature .When you
are in Frequency Domain Display, you can press MENU key, then select T.D. to return.
COPY The figure on the screen will be printed when selected.
4.8.6. Some Notes
Since it will take tens of seconds to connect a cable, it is not easy to finish the job just inside the
display time, so you ought to wait until the next turn for a complete period finished. However you may
press the MENU to pause the operation and press EXEC soon after the connecting. It is needed
especially when the smaller Гscale is being used.
A small reflection from a cable connector usually caused by the connector soldering, but sometimes by
the deviation of the cable characteristic impedance Z0 . In this time, measurement of Z0 is needed.
Press RESET to get into the top menu, press ↓ to move the marker under T.D. Then press → key to
get into FREQ DOMAIN.
4.9 Printing
When a measurement is running, and if the test value is reasonable to be reserved press MENU, move
the marker under PRINT. Then press EXEC, the print menu will be shown.
Two types of printing are provided: screen copy or data.
4.9.1 Print Screen
When print menu is shown, the marker is already under COPY. press EXEC Key will make the
printer print the curve just as you see on the screen.
For rectangular coordinate, the start frequency is printed at the left and the stop frequency at
the right end. The frequency of each point can be interpolated by ⊿F and the counts of the
point. For the ease of count, a
∴marker is under the each tens. The ∷
marker is utilized to
point IL or gain. The … marker is for R.L.
For polar coordinate, a
∷
marker represents the start frequency point, and a∷
marker
represents the stop frequency point. The number at the right bottom corner represents the
points overflowed.
ATTEN Electronics Co. Ltd.
16
User Manual
ATN3021/ATN3022 Network Analyzer
4.9.2 Print data
Curve is preferred for adjustment. But for verification or calculation, print data is also needed .
Move the marker to the item you need and press the EXEC to get the data copy.
4.10 Other Application Notes
4.10.1 R.L. test,
In R.L. test, the DUT can not be brought to nearby the ATTEN. Two methods can solve the problem:
Use two longer cables to connect the R.B. directly to the DUT. Thus can maintain the most accuracy of
the instrument.
Connect a test cable to the test port of R.B. Do the calibration of open ( do the short calibration also if
possible ), then connect the DUT to test.
4.10.2 Test of outside antenna indoor.
In the case of a station antenna is on the tower, which apart from transmitter by hundreds meters, if a
test is taken at the input of the transmission line, the reflections of the near end and the far end adds
up. A very complex SWR versus frequency curve will be shown. Usually the ripple represent the near
end reflection. So you must abstract the mean value to get the true S.W.R. of the antenna.
Use T.D. measurement to resolve the near end reflection. If it is two high at the near end, you ought to
change the adapter or the short cable to minimize the reflection .
Occasionally a sharp peak were shown at a certain frequency caused by the cable resonance
phenomena. It means the cable is not suitable in this frequency band.
4.10.3 Cable Electrical Length Measuring
You can compare two cables using reflection coefficient phase at point frequency. The one which leads
in phase is shorter than the one which lags. So choose one as a reference, you can test the other. This
method has the drawback due to ambiguous phase and the effect of characteristic impedance.
Use time domain measurement to determine the absolute electrical length.
4.10.4 Characteristic Impedance Measurement
In R.L. test, insert a 10dB attenuator to the input port of the RB, and another one at the output port ,
after calibration of Open and Short, connect the coax for test. Take the values of reactance (ignored
the resistance) of the input impedance of the coax under the conditions of OPEN and SHORT on the
far end of the coax. The characteristic impedance of the coax is equal to the square root of product of
the two values.
Try to choose the frequency so that the length of coax is about 1/8 wavelength of the test frequency,
the measurement can be done either in point frequency or scan frequency project.
ATTEN Electronics Co. Ltd.
17
User Manual
ATN3021/ATN3022 Network Analyzer
4.10.5 Gain Measurement of Antenna
In gain test, connect the transmitting antenna to the RF OUT port of ATTEN. Put a reference gain
antenna in suitable location and connect it into the A input port. Make THROU calibration. Substitute
the reference antenna with the antenna you want to test. The gain of the antenna refer to the known
gain of the reference antenna is obtained
The interference of man and field must be minimized and precision mode should be used to get a
stable data.
4.10.6 Magnitude and Phase Distribution Measurement of Array Aperture
In I.L. test, connect RF OUT port to input of the antenna. A insulated short dipole is hanged on the
center of a dipole in the central part of antenna to pick up the signal and then send to A input port.
Calibrate THROU, and then chose the φ.L. item.
Hang the pickup antenna to other dipole to get the magnitude and phase values. The magnitude and
phase distribution of array aperture is acquired.
4.10.7 The Four Scattering Parameters
In this equipment, three parameters of reflection, transmission and amplification ( S11, S21) are treated
independently. Thus, the test of the four scattering parameters ( S12, S22 ) is done by inverse the
connecting of the DUT and test again.
ATTEN Electronics Co. Ltd.
18
User Manual
ATN3021/ATN3022 Network Analyzer
PERFORMANCE VERIFICATION
5.1 Verification for I.L. readings
Connect a manual step attenuator between RF OUT and A input as shown as follows:
A input
RF OUT
B input
dB
You had better connect the two 10 dB fixed attenuator with the step attenuator in between. Or
set the beginning reading of the step attenuator at 10 dB.
Frequency scan project: 30 ~ 1600 MHz with ⊿F=100 MHz, or 30 ~ 3200 MHz with ⊿F=200
MHz.
Select I.L. measurement. ( TEST: TRANSMISSION ).Move the marker under CALI:
THROUGH
Press EXEC and a straight line around 0 dB is displayed. Fluctuation of the curve is less then
0.2 dB. If it is not true, please reset the instrument and repeat the above procedure again. A
long warm up time may be useful.
Step the attenuator and the I.L. curve is shown on the line according to the reading of the
attenuator. The allowable tolerance is listed as follows:
Reading
(dB)
0
10
20
30
Tolerance
(dB)
±0.3
±0.6
±0.8
±1.1
40
50
±1.5
±2.1
60
±5
Step the attenuator to 100 dB or disconnect the cable. The figures on the screen should be
greater than 70 dB ( above 60 dB in 3200 MHz ).
Suggestion: Precision mode can be selected in this verification.
5.2 Verification for directivity
The frequency scan project is the same as in I.L. verification. The procedure is the same as in R.L.
test.
Connect the standard load to the test port of R.B. The measured value is defined as the directivity of
R.B., usually ≥ 40 dB below 1600 MHz, and 35 dB above.
Notes: This specification is not easy to achieved. It is obtained by both the directivity of R.B. and the
ATTEN Electronics Co. Ltd.
19
User Manual
ATN3021/ATN3022 Network Analyzer
return loss of the load. It can be inferred that if the tested value is not ideal, one of the two may have its
property lowered. You can use another better set to justify which one is good or not. Please contact the
producer, or sent them back to repair.
5.3 Verification for Phase Accuracy
RF OUT
A input
B input
R.B.
Sliding Short
Connect as shown above. The test point frequency is at 1250 MHz.
Sliding the scale of the sliding short to 60mm. Calibrate OPEN.
Press MENU. Move the marker to SHORT. Move the sliding short to 0 reading. Press EXEC.
Sliding the SHORT and write down the test values. Compare them with the theoretical values
listed in the table below.
The allowable tolerance is 5°
S.
Short
mm
0
10
20
30
40
50
60
70
80
90
100
110
T. Value
deg
ree
180
150
120
90
60
30
0
330
300
270
240
210
In this test, a 10 dB fixed attenuator can be joined in the input of R.B.
Other frequency can also be chosen. But the theoretical values must be calculated.
For the instrument with the range of 3200 MHz, the test frequency must be changed to 2500 MHz.
Calibrate OPEN at 30 mm and SHORT at 0. When sliding the SHORT, every 5 mm corresponds to 30°.
The allowable tolerance is then 10°.
Note: For the lower frequency series instrument, use a certain length of good cable, examine the
phase shift angle vs frequency, to see whether the phase difference is uniform enough within the
requirement.
ATTEN Electronics Co. Ltd.
20
User Manual
ATN3021/ATN3022 Network Analyzer
MAINTENANCE AND TROUBLESHOOTING
6.1 Printer
After a period of time, the paper on the printer will be used out. If the printer sounds harshly and
strangely, and the paper does not come out when printing, you should check the paper if it is run out.
Procedures of changing paper roll are illustrated as follows:
Screw down the two big cap screws and take off the cover.
Screw down other two screws and take out the whole printer.
Take off the ribbon ( change a new ERC-05 ribbon if the color is very light ).
Tear off the paper, take out the old paper roll, and change a new paper roll. Clean up it if
necessary.
Cut the head of the paper in a shape of Λ and put it into the paper feed slot. Scroll the rubber shaft
and the paper will come out.
Put on the ribbon and rotate the wheel to tighten the tape.
Put the paper through the cover slot. Screw on the cover.
Tighten the paper roll then put on the printer and screw on the four big cap screws.
6.2 Most Common Symptoms and Troubleshooting Hints
6.2.1 I.L. test
In I.L. test with the calibration of THROU done, disconnect the cable, the points on the screen
do not come down below 60 dB.
Use the methods of R.L., or Time Domain or you can simply use a multimeter to check the
cable whether a short, open or poor connection is existed.
Tighten the center contacts of the connectors. Choose another good cable, repeat the I.L. test.
If no improvement happens, the instrument needs to repair.
6.2.2 R.L. test
In R.L. test, the points do not drop down to 30 dB when a standard load is connected.
Disconnect the R.B. and check the center contacts of all the connectors to see if they are
loose. Use a pair of tweezers or sharp head pliers and tighten them.
Change to another certified or tested load.
Check that the connecting cable is not in condition of short, open or poor connection.
Connect a certified cable directly from port RF OUT to port A or B. Calibrate OPEN and
disconnect the cable. If the points on the screen all come down, it can be concluded that you
have a bad R.B. or load or both. If there is no improvement, the instrument has trouble.
Please send the instrument or only its accessory parts to the manufacture if they are needs to
repair.
ATTEN Electronics Co. Ltd.
21
User Manual
ATN3021/ATN3022 Network Analyzer
6.2.3 I.L. test
In I.L. Test, the curve on the screen fluctuates obviously. Refer to operating methods in Sec 4.5.
Connect two 10 dB attenuators (circulators or isolators) and test again.
6.2.4 The most points are normal, but some individual points are abnormal. it means some points are
not phase locked. If it is not important, you may not account the abnormal point and continue to do
the test. But if the point is very important and can’t be ignored, please send back the instrument to the
manufacturer.
6.2.5 When a key is pressed, there is no response, or the instrument keeps on response without
stopping. Probable a key gets stuck. Please press the key vertically to the panel.
6.2.6 The display is black with LED on. Adjust the intensity on the panel.
ATTEN Electronics Co. Ltd.
22
User Manual
ATN3021/ATN3022 Network Analyzer
WARRANTY AND EXTENDED SUPPORT
THIS SHENZHEN ATTEN ELECTRONICS CO., LTD. PRODUCT IS WARRANTED.
We warrant the quality for the period of two years from purchasing date, so please contact
either SHENZHEN ATTEN ELECTRONICS CO., LTD. directly or the dealer where the
instrument is purchased as possible for the details of the warranty service or repair in this
period.
EXTENDED SUPPORT
Please read this manual before use this instrument and especially note below items.
1.Know well the management and using of this instrument based on details of Manual before
use it.
2.Make sure before connect if the selected input voltage (220V) of this instrument is same as
the power voltage
3.Make sure correct fuse of rated voltage is used (AC 250V
,1A)
4.Shall do the installation and check depend on Manual
,
5.SHENZHEN ATTEN ELECTRONICS CO. LTD. will not be responsible for the below case.
a. In case of the damage due to misuse or careless use, and in case of modification of
performance.
b. In case of exceeding the warranted period (Only, in this case, we do the parts supply for
value or repair for value, and the period of opposite view is for 5years after finish the
warranty.
ATTEN Electronics Co. Ltd.
23
User Manual
ATN3021/ATN3022 Network Analyzer
SHENZHEN ATTEN ELECTRONICS CO.,LTD
Building A29,Tanglang Industrial Zone,
Xili,Nanshan,Shenzhen,518055 P.R.China
http://www.atten.com.cn http://www.attenelectronics.com
Emil:[email protected]
TEL:86-755-86021376
FAX:86-755-86021347
ATTEN Electronics Co. Ltd.
24


