1
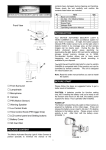
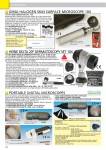
PC software For Microsoft Windows XP/Vista/7/8 User’s manual Please read the user’s manual carefully before the first use TensioMed® TensioWin™‐5‐02 v2.00.05 Revised: 07‐05‐2012 ________________________________________________________________________________________________________________________________ TensioWin™ 2 Table of Contents 1. Introduction......................................................................................................................4 2. Contents of the manual....................................................................................................5 3. The TensioWin™ software................................................................................................5 3.1 Installation and setup of the TensioWin software ......................................................6 3.2 The Structure of the TensioWin software...................................................................8 3.3 The main menu of TensioWin ...................................................................................11 4. Using the TensioWin software .......................................................................................13 4.1 Operator’s data.........................................................................................................13 4.2 Patient’s data ............................................................................................................15 Enter and delete office blood pressure data ..................................................................17 Enter cardiovascular risk factors.....................................................................................17 Enter and delete laboratory data....................................................................................17 5. Programming the device ................................................................................................18 6. Retrieve data from device ..............................................................................................21 7. Analyzing data, evaluating measurements.....................................................................24 7.1 The Study data ..........................................................................................................25 7.2 The graphical page of results ....................................................................................26 The Graph page .....................................................................................................27 Blood Pressure Curve......................................................................................................27 Arterial Function ......................................................................................................29 Pulse Wave Curve.....................................................................................................30 The Data page........................................................................................................30 7.3 Statistical analysis .....................................................................................................32 The Statistics page .................................................................................................32 Correlation page ....................................................................................................32 Histogram ..............................................................................................................32 8. Print a report ..................................................................................................................33 9. Forwarding a report by e‐mail........................................................................................37 10. Importing data base .....................................................................................................38 11. Troubleshooting ...........................................................................................................40 TensioWin™ 3 ___ 1. Introduction to TensioWin Thank you for choosing TensioMed® TensioWin™. TensioMed® devices are controlled by the TensioMed® TensioWin™ software. The measurement schedule and the blood pressure readings are loaded via infrared communication from and to the physician's PC, respectively. Automatic measurements can be set for up to 72 hours, with frequencies ranging from 10 to 90 minutes. Separate measurement frequencies can be set for the “active” daytime, “passive” night‐time, and for a third “special” period. The measured data, namely the systolic and diastolic BP value, the pulse rate, the date and time of the measurement will be stored in the EEPROM of the device. Apart from the programmed measurements, the patient may start a manual measurement (e.g.: he shows symptoms or feels sick). This can be done by a simple push button operation. All manually initiated measurements are stored and displayed on the software report. Copyright © 2011 TensioMed Ltd., Budapest, Hungary. All rights reserved. Under the copyright laws, this manual cannot be reproduced in any form without prior written permission of TensioMed Ltd. Every effort has been made to ensure that the information in this manual is accurate. Succeeding models and manuals are subject to change without notice. TensioMed® is not responsible for printing or clerical errors. TensioMed® TensioWin™ is an unregistered trademark of TensioMed Ltd. Other company and product names mentioned herein may be trademarks of their respective companies. ________________________________________________________________________________________________________________________________ TensioWin™ 4 2. Contents of the manual This manual helps you in setting up and starting to use the TensioMed® TensioWin™ software. ! Attention! Before first use, please read and understand this document carefully. 3. The TensioWin™ software Preliminary information about TensioWin™ software The TensioWin™ Software is a Windows‐based software. The common Windows mouse operations are to be used in the program (left single‐click, double click, drag, etc.). TensioWin™ software has two main components: the patient and physician database. This database is similar in all TensioMed® products, and allows for efficient patient management at a hypertension or cardiovascular clinic, for the calculation of cardiovascular risk, and for printing reports. the second component is specific for TensioDay and allows the programming of the device, the download and analysis of ambulatory blood pressure data. Useful addresses and telephone numbers The Manufaturer of TensioWin™ software is: TensioMed Ltd. 2/e Kőér str. Budapest H‐1103 Telephone: +36 (1) 433‐1700 Fax: +36 (1) 433‐1709 E‐mail: [email protected] Website: www.tensiomed.com TensioWin™ 5 ___ 3.1 Installation and setup of the TensioWin™ software Minimum System Requirements A computer with processor Pentium IV, 256 MB of storage, 2 GB of free space on HDD, CDROM drive, display of resolution 1024*768 pixels, Windows XP operational system with Service Pack 3 Active Bluetooth® or infrared port. Note: TensioWin™ software is capable of controlling TD1 and TD2 devices as well, even under former operational systems (Windows 2000 with SP4). XP operational system became to be a minimum requirement for devices TD3 and TDL2. Installation Insert the CD in your computer’s CD ROM. The installation CD will start automatically. In case it does not happen, double click on the setup.exe file on the disc and the installation setup will begin. The installation process will offer you the default directory for the program. Wait until the files are copied to the directory. At the end of installation the TensioWin™ icon will be created and placed on your desktop. 1. Installation CD for TensioWin™ Start TensioWin™ ________________________________________________________________________________________________________________________________ TensioWin™ 6 You can start using the program by double clicking on the TensioWin™ icon. TensioWin™ 7 ___ 3.2 The Structure of the TensioWin™ software For proper operation please choose the required operator and enter the proper password. When starting the software a login dialog window appears. From the drop‐ down list any formerly registered login name can be chosen. You can also choose the default login name “Arteriogram”. 2. Login The main window of the software consists of three main modules (see the picture below): 3. Control panel ________________________________________________________________________________________________________________________________ TensioWin™ 8 1. The first module shows the details of the currently selected patient and functions for adding, editing, deleting data and searching among patients. 4. Patient’s sheet 2. In the second module you can find functions for communication with the device, i.e. programming the device or downloading measured data from it. 5. Measurement 3. The third module shows the list of the measurements of the currently selected patient along with the most important results and the preview of the selected measurement. TensioWin™ 9 ___ Selection can be done by: 1. Clicking on the required measurement and select “Graph review” button. 2. Clicking on the required measurement and select the “Onward” button signed by an arrow on the right. 3. Double click on the required measurement. Either way, the result is the same: the required measurement will be displayed. 2x 3 1 2 6. Selecting measurements ________________________________________________________________________________________________________________________________ TensioWin™ 10 3.3 The main menu of TensioWin™ The menu bar contains the menu items through which all major functions are available. File Import data file: Interpreting a TensioWin™ data file previously saved by TensioWin™ or received by e‐mail. Export data: The data of the selected patient can be exported for further analysis Import from a database: To import previously saved TensioWin™ database Backup database: Backup database for safety purposes by selecting the destination directory for the backup file. When starting the software a warning massage will pop up if there had been no backup in 30 days. Exit: Escape from the program View Toolbar: To display or hide toolbar Status bar: To display or hide status bar Button labels: To display or hide the labels on the Toolbar buttons Patient details: To display or hide the selected Patient’s data. Patient functions: To display or hide the available functions of the selected Patient (new, edit, delete) Operator You can add, edit or delete the operator’s data here. Change Operator: By changing the login name, it is possible to operate amongst the given patients and measurements, without actually exiting the program. New: A new login/physician can be added by clicking this menu item. Edit: The data of a selected physician can be edited here. Delete: The data of a selected physician can be deleted here. Allocate patient: The patients belong to other operators can be allocated to the current operator Patient: By clicking on this menu item you can add, edit or delete patient data, calculate cardiovascular risk and print report. New: A new patient can be added here. Edit: The data of a selected patient can be edited here. Delete: By clicking this menu item the selected patient can be deleted. TensioWin™ 11 ___ Device types Search device: The available devices around the computer can be found The required device type can be selected (It can be changed before setting up the communication). The devices are as follows: TensioDay 1 (24hours ABPM) TensioDay (24hours ABPM) TensioDay Plus (24hours ABPM + central aortic blood pressure) Arteriograph24 (24hours Arteriograph) Protocol menu Set up protocol and program device: This menu item allows you to prepare the blood pressure monitoring schedule and to download the plan to the TensioMed® device. Retrieve data from device: This menu item allows you to download the blood pressure data recorded by the TensioMed® during the monitoring period and display it. Tools Windows control panel All the major functions of windows control panel are available from here. Telephones and modems System Bluetooth® tools Time and date setup E‐mail settings The parameters for the e‐mail function of the software can be set here. Setup By clicking on this menu item you can modify the following settings of the device: you can set the target pressure of the device to a pre‐determined starting value or to 50 mmHg above the previous MAP value you can determine the type of the cuff you can set the device to repeat the faulty measurements you can select or prohibit that the placing of the cuff should be checked by the device or not you can download the actual date and time into the device you can change language ________________________________________________________________________________________________________________________________ TensioWin™ 12 These settings are only take effect after sending those to the device by pressing the “Download into the device” button. Shall select the type of the device Shall select the required communicational port Information menu Help files: This function provides you with help in using the software. User’s manual: The User’s Manual can digitally be displayed. To use this function a program capable of reading PDF files should be installed to the PC. Manufacturer and software version information: This function gives you information about the TensioWin™ software. 4. Using the TensioWin™ software 4.1 Operator’s data Add new operator/physician If you want to add a new physician to the database go to menu “Operator – New” and enter the data of the physician in the pop‐up window. Note that the colored fields are mandatory to be filled out. Click OK to save the data. The name of the new physician now appears in the list. It will also be listed in the login names list upon starting the software. Selection of the operator In case you intend to choose a different operator than the one which is already logged in, select the “Change Operator” menu item or select “Change Operator” from the drop down list of “Operator” in the main menu. Find the physician in the list and select it by clicking on the name and then clicking the “OK” button. The name of the selected physician is indicated in the title row of the window. Edit operator data If you want to modify or edit previously entered data go to menu “Operator – Edit”. Modifications can be saved by clicking “OK”. Delete operator TensioWin™ 13 ___ You can delete one or more operators at a time via the “Delete operator” menu item. Simply select the required operator and press “Delete” button. The action will only be performed if the password of the particular operator was given. To complete operation TensioWin software has to be restarted. 7. Delete operator Allocate Patient In case you would like to insert a Patient assigned to another Operator, select “Allocate patient”. From the pop‐up window you can select to allocate the required patients only if you are aware of the assigned Operator’s password. To complete allocation, select the required Patients and press “Allocate patient” button. ________________________________________________________________________________________________________________________________ TensioWin™ 14 8. Allocate Patient 4.2 Patient’s data Selection of the patient You can select any patient that belongs to the formerly selected operator/login name by using the patient list in the “Patient details” module of the main window or by using the search function above the mentioned list. Hint: you can search for a particular patient of the physician by using the search function. You can search for names or ID numbers. To search for a name check “Name” in the “Search for field” and start typing the name of the patient. The search commences with partially entered names. Add new patient If you want to add a new patient, click “New” in the “Patient details” module or go to the “Patient ‐ New” menu item. A pop‐up window appears where the patient details can be entered. The setup of the database corresponds to the steps of a usual outpatient visit. This allows to enter information on medical history, on current complaints, on examinations, on laboratory data and to assess cardiovascular risk. You can save data by clicking “OK”. Comments or opinions given here are automatically added to the printed report. Please, note that the following colored fields have to be completed: Family name TensioWin™ 15 ___ First name Date of Birth In case of TensioMed TensioDay PlusTM, TensioMed Arteriograph24TM the following data must be entered: JUG‐SY (Jugulum‐Symphisis distance) Arm circumference After adding the arm circumference the software automatically suggests the proper size of cuff to be used. The suprasternal notch (jugulum) – pubic bone (symphisis) distance should be measured in a straight line. Measuring on the body surface can lead to overestimation (e.g. in case of obese patients). Wrap the suggested cuff around the dominant upper arm tightly. To avoid the irritation of the skin a long‐sleeved shirt made of some thin material can be worn under the cuff. Measure the suprasternal notch – pubic bone distance (Jug‐Sy) with use of the supplied tape measure. Ensure optimal measuring conditions: o Try to avoid speaking, muscle movements, especially the movement of arm muscles as these activities significantly increase the measuring time, may result in measurement failure or may reduce the precision rate thereof. Muscle movements (tremor) distort the form of the measured pulse wave and render its evaluation impossible. Edit patient data If the patient returns to the clinic for a follow up visit or has new laboratory or blood pressure data, you can edit the patient database and prepare a follow up report. To do so, select the patient in the “Patient details” module whose data you want to edit and ________________________________________________________________________________________________________________________________ TensioWin™ 16 click the “Edit” button or go to the “Patient ‐ Edit” menu. A pop‐up window appears where the patient details can be edited. In the “Baseline symptoms”, “Physical examination”, “Office blood pressure” fields the current date will automatically be displayed. You can review previous data by using the scroll bar. Only data entered with the newest date will be printed in the report. Modified data can be saved by clicking on the “OK” button. Enter and delete office blood pressure data If you want to enter new office readings to a particular patient’s database, select “New” on the Office BP panel on the Patient details window. Enter the systolic and diastolic blood pressure reading and the heart rate value then click “Save”. Entered values will be listed in the right panel with the date and time. Repeat these steps with each office reading. The average of the readings from the same date is automatically calculated and displayed on the bottom of the panel and can be printed as well. If you want to delete previously entered office blood pressure data, first select the row you want to delete by clicking on it. These data will now appear on the left side of the Office BP panel. Delete these data by clicking “Delete”. Enter cardiovascular risk factors The software allows you to enter clinical data that determine cardiovascular risk and to calculate this risk. Open the “Patient details” window of the patient to whom you want to enter cardiovascular risk factors and click on the “Risk factors” button. This brings you to the Cardiovascular risk factors window, where you can enter the data. Click “OK” to save the data. Enter and delete laboratory data You can enter laboratory data of the patient in the Cardiovascular risk factors window. At the bottom of the window you will find prepared fields for entering some of the laboratory values. If you want to enter new data select the “New lab data” button in the laboratory data panel. Fill in the fields, and save data by clicking on the “Save” button. You can select the dimension of the values to be entered (e.g. mmol/l or mg/dl). After saving your work, the current date will be added to the panel. You can review previously entered laboratory values by clicking on the “Previous lab data” button. If you whish to delete a set of laboratory data, simply find the data by using the Previous‐ or Next lab data buttons and then click “Delete”. All laboratory data belonging to that date will be deleted. Print cardiovascular risk factors and laboratory data TensioWin™ 17 ___ Select the “Print” button on the cardiovascular risk factors window. A print preview of the page will be presented with the risk factors, laboratory data, and the estimated risk of cardiovascular disease in the next 10 years for the patient. The risk is calculated according to the equation derived from the Framingham study (Anderson KM. et. al. Cardiovascular disease risk profiles. Am Heart J 1990;121:293‐8). The data needed to calculate risk are date of birth, sex, systolic blood pressure, current smoking status, diabetes, left ventricular hypertrophy detected by ECG, cholesterol, and HDL‐cholesterol values. 5. Programming the device To set up a measurement protocol and to program the device, press the “Set up protocol and Program device” button on the second module. 9. Programming In the “Set up protocol and Program device” window you can either select a pre‐set monitoring plan for the ambulatory monitoring or create your own protocol. The monitoring protocols are characterized by: the length of the test the active (awake), the passive (asleep), and (optionally) the special periods. This latter may be needed if there is a period of special interest (e.g. early morning hours before awakening) during which you want different measurement frequency the measurement frequencies during the active, passive (and, if included, special) periods the starting time of the test and the different periods ________________________________________________________________________________________________________________________________ TensioWin™ 18 10. Measurement protocol Pre‐set plans are listed in the window. The first number in the name of the pre‐set plan refers to the measurement frequency during the active; the second number to the measurement frequency during the passive; and the third number to the measurement frequency during the special period, respectively (i.e. 30/60/15). The length of the planned monitoring is indicated by the number in parenthesis (24h). Even when selecting a pre‐set plan you can modify the length of the test, the start time of the test, the different periods, and the measurement frequencies of the different periods. Measurements can be programmed up to 72 hours with frequencies from 10 to 90 minutes. If you want to use monitoring schedules, different from those listed in the pre‐set plan window frequently, select “New”. This allows you to define new, customized protocols that can be programmed quickly later. When preparing a new pre‐set plan you can define the length of the test and the measurement frequencies for the “active” daytime, “the “passive” night‐time, and for an additional “special” period. Save the new pre‐set plan by clicking OK after naming the new pre‐set plan. The details of the new pre‐set plan appear in the window. TensioWin™ 19 ___ 11. Protocol setting up You can always modify the starting time of the test. Once the protocol is set click on the “Send” button. As several TensioMed® products can be managed by the TensioWin™ software, the proper type of device has to be selected when initializing data transmission. In case the communication port is not known, but we intend to define it, then click on the search button next to the available communication ports or close the window going back to the control panel and select the “Search device” button on the toolbar. This way we can monitor the examination of the COM ports existing on the computer. Where the software finds a related device it reveals the name of the device next to the port, i.e. “COM3: TensioDay 3”. Thereafter the selection of the required device is possible from the drop down list. Warning! Make sure that time is displayed on the screen before communication starts; neither “BLUELINK” or “CONNECT” – in case of Bluetooth® communication – nor “IrDA” or “CO PC” – in case of infrared communication ‐ should be seen. If known, the number of the communication port can also be selected. This action can be omitted as the software automatically detects the correct port and stores its number so it does not have to be searched for next time. When selections are made, click “Send”. In case there are more devices available, but only one is intended to be used – of which the communication port is known – TensioWin™ is capable of connecting only via the selected communication port. This way the automatic search can be avoided and it is impossible to re‐program another device connected to a different port. The process of download of the measurement protocol to the device can be followed on the progress bar. “CONNECT” ‐ in case of Bluetooth® communication – or “CO PC” – in case of infrared communication ‐ is displayed on the screen of the device. The successful download is confirmed. ________________________________________________________________________________________________________________________________ TensioWin™ 20 In case you wish to delete the previously registered devices from your list, choose “Tools” from the menu of the “Set up protocol and program device” window and select “delete the previously registered devices”. 6. Retrieve data from device If you want to transfer data from the TensioMed® device into the computer select the “Retrieve data from device” button in the second module. 12. Retrieve data The pop‐up window for device selection appears: 13. Selecting the device and the communication port As several TensioMed® products can be managed by the TensioWin™ software the proper type of the device and connection port have to be selected when initializing data transmission (see also above). In case the transfer of data is intended to be done from a computer different from which the device was programmed to or the device was programmed via the device button – TensioDay2, TensioDay 3 – from the drop‐down list of “Tools” in the menu, “Downloading measurements of current patient to the PC” should be selected to connect TensioWin™ 21 ___ the transferred measurement to the preliminary selected patient. If you didn’t select this checkbox, the software will not realize any defined measurements in these cases. Please note that, in case the measurement was registered on the PC before, then the current patient’s test in progress – if there is any – will considered to be completed, thus no more measured data will be added. The measured data will appear in a separate measurement of the patient. Once a test is considered to be completed it cannot be resolved. It may happen that you would like to retrieve data of another Operator’s patient. In this case you can complete data transfer by using the required operator’s password during the process. The process of data transfer to the computer can be followed on the progress bar. The successful transfer is confirmed. After successful data transfer the blood pressure values are ready for analysis. NOTE: You can transfer the blood pressure data any time during a particular ambulatory blood pressure monitoring test. This may be necessary, for example, if you want to check the performance of the device or see the blood pressure values while the test is in progress. The data transfer does not affect the set protocol, and after data transfer the test will resume until the set length of the protocol is completed. If you transferred data while the test was in progress, i.e. before the full length of the test was complete, this fact is shown in the “Status” window of the first page of the “Analysis”. If you transfer additional data from the same test (e.g. at the end of the monitoring) these new data will be appended to the partial results transferred previously to allow complete data analysis. ________________________________________________________________________________________________________________________________ TensioWin™ 22 View 14. Largest view of analysis page – hiding all the possible parts TensioWin™ 23 ___ 7. Analyzing data, evaluating measurements In the third module of the main page select the required test from the list of the given patient. The Analysis page can be personalized for the purpose of easier usage. Selecting “View” from the main menu you can hide and display certain parts of the window, ensuring the larger view for evaluation. This way you may reduce the apparent data for the blood pressure curve only, while all the main functions are still available from the main menu. These functions are available via Tools in the main menu Export The complete measurement results can be exported from here and can be evaluated later on by another software in chart form. Save The measurement can be saved as a special data format in order to be portable and readable in another TensioWin™. Save PDF Report The report of the selected measurement can be saved in PDF format. Save and send This is a complement to the previous “Save” function with a further option for sending e‐ mails including the saved measurement together with the “standard report”. Print To print the measurements. It can be done either in the form of “Standard report” or a selection of the printable reports can be prepared as well. Return to the main device menu screen It closes the present measurement and leads back to the control panel, where a new measurement can be selected, launched or the User can quit the program. The four pages of analysis: the “Study data” The graphical page of “results” Page of “Statistics” “Conclusion” page ________________________________________________________________________________________________________________________________ TensioWin™ 24 7.1 The Study data contains the main specifications and the status of the measurement protocol (in progress/completed), besides the patient’s data. During analysis, the active and passive periods can be changed subsequently the test, both for statistical analysis and for graphical review. It can be necessary if the patient didn’t observe the preliminary set “Sleep” and “Awake” periods. Selecting the “Day/Night set” buttons you will see as follows: 15. Day/Night set If you change the start‐ and endpoints of the active and/or passive periods, then the graphical review of the analyzed data will be based on the modified time setting. The target blood pressure values can also be changed here selecting the “ABPM thresholds” button. 16. Setting the thresholds TensioWin™ software will reveal this threshold by a continuous black line on the blood pressure curve. TensioWin™ 25 ___ 7.2 The graphical page of results, displaying also the measurement results numerically 2 3 5 1 17. The graphical page of Results 8 7 6 9 4 ________________________________________________________________________________________________________________________________ TensioWin™ 26 Containing two additional pages: The Graph page The signs of Figure16 are as follows: 1. Standard Measurement list 2. Blood Pressure Curve 3. Arterial function Curve 4. Blood Pressure Curve/Arterial function display/hide 5. Select the display parameters 6. Select the display period 7. Numerical display of the given measurement 8. Pulse wave Curve 9. Settings of the Pulse Wave Display Standard Measurement list (1) The measurement list helps the better coordination between the measurements of a given patient. By clicking to a specific measurement, a red, vertical line appears on the curve, showing the required measurement, its numerical data (7) below and the corresponding Pulse Wave Curve* (8). The reverse is also true. Clicking to a specific measurement result on the blood pressure curve will change the focus of the measurement list as well – and reveals the Pulse Wave Curve. *In case of Arteriograph24 Blood Pressure Curve (2) 10 18. .Blood Pressure Curve TensioWin™ 27 ___ The graphical display of the measurement data as a function of time can be seen here. The set threshold values for the systolic and diastolic blood pressures for the active and passive periods are indicated by solid lines (10) (note that you can modify at the “Study data” page both the threshold values as well as the start and endpoints of the active and passive periods). The pill intake is indicated by a green circle on the top of the graph. There are several options for the graphic display: the readings may be displayed either as individual bars or the systolic and diastolic values connected by a solid line (Figure 19‐20) (11) the comments typed in on the 2nd page can be displayed (12) you can have the mean arterial pressure for each reading be displayed (13) you can view either the individual measurements or the hourly averages (14) you can view either the full test period or only a time segment of it. Clicking on “Time segment” at the bottom of the page allows you to define the time segment to be displayed (6) 11 12 13 14 19. Editing of the graphical display ________________________________________________________________________________________________________________________________ TensioWin™ 28 20. Without connection 21. Connected by a solid line Arterial Function (3) The graphical display of the arterial function as a function of time can be displayed here. It is all the same as for the Blood Pressure Curve that both the threshold values and the start and endpoints of the active and passive periods can be modified at the “Study data” page. 22. Arterial function The Aix‐ao, Aix‐br and PWV‐ao parameters can be displayed or hidden. Thus it is possible to evaluate the standard arterial function parameters and the data measured by Arteriograph24 either in parallel or separately. It can easily be done by clicking on the checkboxes above the graph: “Graph” and/or “Arterial function”. TensioWin™ 29 ___ The different curves can be displayed or hidden. (The parameters of SBP‐ao TensioDay Plus, SBP‐ao, Aix‐ao, Aix‐ao, Aix‐br, PWV‐ao can only be displayed in the case of Arteriograph24) Pulse Wave Curve The device records the pulse wave curves for each measurement. If you coordinate via the Standard Measurement List (1) the required Pulse Wave Curve can easily be selected. The required extent of the amplitude can be set by clicking the “‐“ and “+” buttons next to the curves. As a default, the software evaluates the curve, but it is still possible to evaluate manually. To do so, click to the starting point of the required section of the curve and keep the mouse button down while selecting the required section. To complete the selection simply let the button off. TensioWin™ software automatically tries to evaluate the given section, which will appear on the screen above (7) in case of success. If this latest result is preferred to be stored instead of the standard evaluation, then the newly activated “Save” button must be selected. The Data page The Data page is the tabulated list of the time, the date and the measurement data (blood pressure, heart rate, pulse pressure). Threshold values, based on which some of the statistics are calculated can be modified by clicking on the Blood Pressure threshold button at the bottom of “Study data” page. The passive period is indicated by the shaded area and the special period by an “*” at the beginning of the row. Re‐defining the start points of the active and passive periods will not change the marks of the data at the tabulated list. The status column indicates whether the reading is the result of an automated or manual measurement. The status column also lists the time of pill intakes and the time of waking up or going to bed. The comment column can be used to type in comments to a particular reading (e.g. dizziness noted by the patient). While the blood pressure measuring algorithm of the device automatically discards extreme blood pressure and heart rate values, the summary statistics is based on all data listed in this page. You can manually edit or delete a particular reading by double clicking on that row. Selecting the checkbox, the given parameters of the measurement will be inactive – as temporarily being deleted. In the case of Arteriograph24, there’s a possibility to delete only the parameters of arterial function (“Delete Arterial Function parameters of the measurement”). ________________________________________________________________________________________________________________________________ TensioWin™ 30 23. Data By doing so, the standard hemodynamic parameters will reveal on the blood pressure curve, but the arterial function parameters will not. The temporarily deleted parameters neither will be displayed on the graphs, nor in the statistical analysis. Double clicking again on the previously edited reading results will mean the re‐inclusion of that reading in the graph and statistics. 24. Editing results TensioWin™ 31 ___ 7.3 Statistical analysis is shown on Statistics page The statistics window contains 3 pages: The Statistics page gives you the summary statistics of the test. You can define which period to be analyzed (active, passive, special), and whether the full test or only a segment of it is to be considered. The start and end point of the different periods can always be re‐defined. Temporarily deleted values of “Study data” page are not included in the statistics. The statistical summary includes: Mean Maximum and minimum Standard deviation Diurnal index (DI) that denotes the difference in mean blood pressure between the active and passive period, expressed as a percent of the mean pressure during the active period. If you re‐define the start and end time of the active and passive period the value of DI changes accordingly. Percent time elevation (PTE) denotes the length of time during the test the patient’s blood pressure was above the threshold limits, expressed as percent of the length of the full test. The calculation assumes that the change in blood pressure between two readings is linear. If you re‐define the threshold values, the PTE changes accordingly. Blood pressure load (Load) denotes the area under the blood pressure curve exceeding the threshold limit. You can add the summary statistics of the different periods or time segments to the print list. The Correlation page allows you to view the histogram of the monitoring data. Similar to the previous pages, you can define which period to be analyzed, and whether the full test or only a time segment is to be considered. You can select the systolic, diastolic, mean arterial pressure, or the heart rate data to be displayed. The displayed histograms can be added to and removed from the print list. The Histogram is a correlation plot of the systolic values as a function of the diastolic readings. You can display the plot separately for: all data the active period the passive period the special period (only if there was one defined) To select the data and the period to be printed click on the appropriate period in the “Period” window. ________________________________________________________________________________________________________________________________ TensioWin™ 32 Similar to the previous page you can view the plot for either the full test period or only for a time segment of the test. Clicking on “Time segment” at the bottom of the page allows you to define the time segment to be plotted. 8. Print a report There are several options for printing the results: By clicking on the “print” icon at the right upper corner of Analysis window or the “Print” button at Tools menu, you can compile and print out the full report. 25. The Print window TensioWin™ 33 ___ Standard report The generally used report form can be set here. The default setting is as follows: Standard report of 2 pages: - a summary report together with the blood pressure curve and the corresponding statistics - corresponding opinion In the case of Arteriograph24, the standard report above is completed with the “arterial function” report, which contains the measured parameters of arterial function. This setting can easily be changed by clicking on “Setup” and in the pop‐up window you can select the parameters to be displayed on the default report setting. 26. The setting of a required report In case “data” was added and you selected “Save”, the pint screen will be as follows: ________________________________________________________________________________________________________________________________ TensioWin™ 34 27. Completed report After you set the required report for printing, click on “Preview”. Now the “print setup” window appears: 28. The print setup window The required task and printer can be selected and configured here. If it is done, select “OK”, then the print preview appears. TensioWin™ 35 ___ 29. Print preview With use of the toolbar on this screen the following functions can be accessed: Zoom tool The print preview page can be zoomed to fit the screen height (Zoom to fit), to fit the screen width (Zoom to width) and to the original size (100%). Navigation tool This tool can be used to navigate to the First page, Previous page, Next page or to the Last page of the medical report. Search tool With use of these tools a search can be performed by page number (Go to page) or by a keyword (Search for text). ________________________________________________________________________________________________________________________________ TensioWin™ 36 Print tool The page can be printed with the previously determined settings. Save/Load tool The Report can also be saved in a file by clicking on Save report. The SW offers the patient ID as complemented with the current date and time as the file name. The destination directory of the saved file can be chosen. The patient’s previously saved Reports can be selected and displayed by clicking on Load Report in the Print preview dialog box. Save PDF report The page can be printed in PDF format with the previously determined settings. The Print preview screen can be closed by using this button. 9. Forwarding a report by e‐mail It is possible with the TensioWin™ software to write a patient’s full data relevant to a given examination into a file from the program’s data base and send it in via e‐mail to a certain address (with the general report in .pdf format) or to download a similar file into your program. 30. E‐mail settings This function can be operated by clicking on the mail icon on the top of the Analysis window. In case you use the function for the first time, the program will offer you a TensioWin™ 37 ___ registration window, in which the colored fields must be completed because without knowing these data the e‐mail cannot be sent. After completing the fields, the software will save the file or report containing the data of the given examination automatically and it will display Microsoft Outlook or the basic corresponding program of the Windows with the completed data. 10. Import database TensioWin™ software is capable of importing the database of a former TensioWin™ program so the past data will be operable via the new software. Figure30. Database import ________________________________________________________________________________________________________________________________ TensioWin™ 38 The process of importing a database is as follows: You can import database from File menu. Select the type of software you intend to import (TensioWin™ 1. or TensioWin™ 2.) The selected part of the window is always active. i.e. If you intend to import from TensioWin™ 1. select “TensioWin™ 1” button and click on “Browse a Paradox Database” giving the direction of the database. (The default is: “C:\Program Files\TensioMed Ltd\TensioWin\Data”). To launch the process click on the “start import” button. After finishing the import and noting the warning message, you must restart TensioWin™ program. TensioWin™ 39 ___ 11. Troubleshooting Problem No communication No SBPao values are displayed No arterial function parameters are displayed No print preview The PDF report cannot be opened Database import cannot be completed Cannot send e‐mail successfully Device type Possible causes Communication adapter is not connected TensioDay TensioDay Plus The device is not recognized by the PC Arteriograph 24 No or low batteries in the device The device was turned off TensioDay Plus Arteriograph 24 Loose cuff Arrhythmia Tremor Arteriograph 24 TensioDay TensioDay Plus No printer has been installed to the PC Arteriograph 24 TensioDay TensioDay Plus Adobe Reader is not installed to the PC Arteriograph 24 TensioDay Not the proper database was opened or TensioDay Plus the database was damaged Arteriograph 24 Outlook is selected at the e‐mail settings but it is not installed to the PC TensioDay TensioDay Plus Standard e‐mail is selected at the e‐ Arteriograph 24 mail settings but no mail software has been configured on the PC ________________________________________________________________________________________________________________________________ TensioWin™ 40 TensioWin™ 41 ___ ________________________________________________________________________________________________________________________________ TensioWin™ 42 TensioWin™ 43 ___ www.tensiomed.com ________________________________________________________________________________________________________________________________ TensioWin™ 44