1
AWEA WindPower 2006
Software Tools for Distributed Wind
time of this writing, annual utility dues range from $1000 to $5000 depending on 2004 gross
revenues. The up-to-date dues structure is always on-line at www.uwig.org.
In addition, the National Renewable Energy Laboratory (NREL) has provided source code for
their WindFinance Web application, to form the basis of UWIG’s Economic Screener for
Distributed Wind.
Flicker Estimating Tool
Flicker is one of the first issues coming to a utility distribution engineer’s mind, when
considering the possibility of distributed wind generation. The customers are closer to the wind
turbine and the system impedance tends to be higher, compared to a wind farm connected to the
transmission system. As a result, there could be a greater exposure to flicker-induced customer
complaints, after the turbine has been installed.
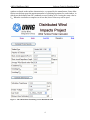
The UWIG tool suite includes a quick flicker estimating tool, shown in Figure 1, for use in this
situation. In order to use this calculator, you need the type of proposed wind turbine, and the
proposed location where it would be installed. The result is a quick estimate of the potential for
flicker becoming severe enough that other customers would notice and possibly complain. To
complete the estimate:
•
Choose a “Turbine Type” from the drop-down list box. At present, ten turbines from four
different vendors are available in the software’s library. To be included in the library, a
power quality test report compliant with IEC Standard 61400-21 must be provided for the
wind turbine. These power quality tests are time-consuming and expensive for the turbine
vendors, but more units will be added to the UWIG library as the test reports become
available.
•
Enter the number of turbines at this location and the average wind speed into the
appropriate edit boxes.
•
Enter the short-circuit MVA and impedance angle at this location. This information
would come from a short-circuit study of the feeder. If harmonics are of concern, this
information may already have been provided for an evaluation per IEEE Std. 519 at the
point of common coupling (PCC). Note that the Feeder Simulator can also provide this
information. Or, it may be estimated as described in the next point:
•
If the user does not know the short-circuit strength at the point of common coupling, it
may be estimated from the substation transformer size, the line construction type, and the
distance from the substation. Click the “Estimate Short-Circuit” button, which fills in the
short-circuit MVA and angle, and then click the “Calculate Flicker Severity” button.
•
Click on “Calculate Flicker Severity Level” to update the PST results for continuous and
step flicker, and the PLT result for step flicker. Values less than 0.90 are considered
acceptable for PST, but this example would exceed that threshold for switching flicker.
Values less than 0.70 are considered acceptable for PLT.
For continuous turbine flicker the short-term value PST and the long-term value PLT are defined
as equal to each other, so the Flicker Calculator only output PST.
For step flicker, the PST value is based on a 10-minute window and the PLT value is based on a
120-minute window. The flicker coefficients and the number of switching operations for each
3