1
Designer Manual
No responsibility is taken for the correctness of the information contained in this manual. The information is
subject to alteration without previous notice. combit GmbH accepts no liabilities in connection with this
document. The availability of many of the functions described in this manual (e.g. the procedure for accessing
the functions) is dependent on your system's version and release, the installed service packs (e.g. operating
system, text processing software, mail program etc.) and the configuration of the system. If in doubt, please
ask the person responsible for IT.
This manual or excerpts from this manual may not be copied or replicated in any other form (e.g. digital)
without the written approval of combit GmbH.
PDF creation utilizes wPDF (c) wpCubed GmbH - www.pdfcontrol.com
Copyright © combit GmbH 1992-2015; Rev. 21.000
www.combit.net
All rights reserved.
2
Contents
Contents
Designer Manual ........................................................................................ 1
1. Introduction .......................................................................................... 10
1.1 General ................................................................................................... 10
1.2 Screen .................................................................................................... 11
2. Getting Started ..................................................................................... 12
2.1 The Examples in this manual ................................................................... 12
2.2 Creating a Simple Report ........................................................................ 12
2.2.1 Inserting a Company Logo into the Report ..................................... 14
2.2.2 Adding a Title to the Report ............................................................ 16
2.2.3 Insert the Table for the Product List ............................................... 18
2.2.4 Formatting Table Fields .................................................................. 21
2.2.5 Displaying a Preview of the Report ................................................. 23
2.2.6 Adding a Page Number ................................................................... 24
2.2.7 Print the Report ............................................................................... 26
2.3 Creating a Simple Invoice ........................................................................ 27
2.3.1 Create a New Print Template .......................................................... 28
2.3.2 Adding a Company Logo ................................................................ 28
2.3.3 Add the Address Field ..................................................................... 28
2.3.4 Create Invoice Header With Number and Date ............................... 30
2.3.5 Adding the Item List ........................................................................ 34
2.3.6 Alignment and Formatting .............................................................. 37
2.3.7 Background Color and Frame ......................................................... 39
2.3.8 Invoice Footer With Totals .............................................................. 42
2.3.9 Create Additional Footer Lines ........................................................ 45
2.4 Creating a Simple Label .......................................................................... 46
2.4.1 Insert Object ................................................................................... 47
2.4.2 Insert Barcode ................................................................................. 49
2.4.3 Printing Labels ................................................................................ 49
3. Effective Workspace Techniques .......................................................... 50
3.1 View Mode ............................................................................................. 50
3.1.1 Layout ............................................................................................. 50
3.1.2 Layout Preview ................................................................................ 50
3.1.3 Real Data Preview ........................................................................... 50
3.2 General Procedures ................................................................................ 51
3.2.1 Choosing a Page Layout ................................................................. 51
3.2.2 Zoom ............................................................................................... 51
3.2.3 Status Line ...................................................................................... 52
3.2.4 Ribbon ............................................................................................. 52
3.2.5 Mini-toolbar ..................................................................................... 55
3.2.6 Default Settings for Font and Frame............................................... 56
3.2.7 Undo or redo an action ................................................................... 56
3
Contents
3.2.8 Copy Formats .................................................................................. 56
3.2.9 Variable/field list and drag & drop .................................................... 57
3.3 Inserting and Arranging Objects ............................................................. 58
3.3.1 Inserting Objects ............................................................................. 58
3.3.2 Size and Position of Objects ........................................................... 59
3.3.3 Arrangement as an Object List ........................................................ 59
3.3.4 Grouping of Objects ........................................................................ 60
3.3.5 Copies of Objects ............................................................................ 60
3.3.6 Importing Objects............................................................................ 61
3.4 Alignment of Objects ............................................................................. 61
3.4.1 Displaying the Alignment Grid ......................................................... 61
3.4.2 Aligning Objects .............................................................................. 61
3.4.3 Guides in the Workspace ................................................................ 62
3.5 Project Options ...................................................................................... 62
3.5.1 Options for the Project .................................................................... 63
3.5.2 Default Settings for Font and Frame ............................................... 63
3.5.3 Preview ............................................................................................ 63
3.5.4 Options for the Workspace ............................................................. 63
4. Mastering Appearance Conditions ........................................................ 65
4.1 Where Will the Objects be Printed? ........................................................ 65
4.2 Working With Appearance Conditions .................................................... 65
4.3 Working With Layers .............................................................................. 66
4.3.1 Defining Layers................................................................................ 66
4.3.2 Assigning Objects to a Layer .......................................................... 67
4.4 Practice: Create a Mail Merge Project .................................................... 68
4.4.1 Create a New Print Template .......................................................... 68
4.4.2 Adding a Company Logo ................................................................. 68
4.4.3 Add the Address Field ..................................................................... 69
4.4.4 Adding the Date and Page Number ................................................ 71
4.4.5 Adding Formatted Text for the Letter .............................................. 72
4.4.6 Adjusting the Position of the Letter Text for Following Pages ........ 74
4.4.7 Assigning Objects to the Layer ....................................................... 74
5. Creating Professional Tables ................................................................ 76
5.1 Working with the Report Container......................................................... 76
5.1.1 Report Container and Object list ..................................................... 76
5.1.2 Multiple Report Containers ............................................................. 77
5.2 Practice: Defining sub reports correctly .................................................. 77
5.3 Modifying the Fields and Columns ......................................................... 81
5.3.1 Table Tools and Mini-toolbar ........................................................... 81
5.3.2 Object Dialog ................................................................................... 81
5.3.3 Variables-/Field-List and Drag & Drop .............................................. 82
5.4 Defining Multiple Line Layouts ............................................................... 83
5.5 Defining Column Contents ..................................................................... 85
5.6 Defining Group Lines ............................................................................. 87
4
Contents
5.7 Tables in columns (Nested Tables) .......................................................... 89
5.8 Table Layouts ......................................................................................... 91
5.8.1 Align Columns ................................................................................. 91
5.8.2 Fixed Size ........................................................................................ 92
5.8.3 Printing Header Lines and Footer Lines Again ................................ 92
5.8.4 Defining the Size of the Table Variably ........................................... 93
5.8.5 Forcing a New Page ........................................................................ 93
5.8.6 Creating a Conditional Page Break.................................................. 94
5.8.7 Keeping Lines Together .................................................................. 95
5.8.8 Defining Totals and Counters ......................................................... 96
5.8.9 Outputting Free Content Before and After a Table ......................... 96
5.8.10 Anchored Lines (Overlapping Cells) .............................................. 97
5.8.11 Expandable Regions ..................................................................... 99
5.9 Sort Orders in the preview .................................................................... 100
6. Producing Analyses ............................................................................ 102
6.1 Creating Charts ..................................................................................... 102
6.1.1 Inserting a Chart Object ................................................................ 102
6.1.2 Pie, Donut or Circle Chart.............................................................. 104
6.1.3 Multi-Row Bar Chart ...................................................................... 107
6.1.4 100% Stacked Bar Chart ............................................................... 110
6.1.5 Multi-Row Line Chart .................................................................... 110
6.1.6 Stacked Area Chart ....................................................................... 111
6.1.7 Distributed Bubble Chart............................................................... 112
6.1.8 Funnel ........................................................................................... 113
6.1.9 Map/Shapefile ............................................................................... 115
6.1.10 Using Series to Determine the Values ........................................ 118
6.1.11 Mixing Chart Types ..................................................................... 120
6.2 Creating a Checkbox ............................................................................. 122
6.2.1 Inserting a Checkbox .................................................................... 123
6.2.2 Specify Properties ......................................................................... 123
6.3 Creating a Data Graphic ........................................................................ 124
6.3.1 Inserting a Data graphic ................................................................ 124
6.3.2 General .......................................................................................... 125
6.3.3 Define Bar ..................................................................................... 125
6.3.4 Define Symbol............................................................................... 126
6.4 Creating Gauges ................................................................................... 126
6.4.1 Inserting a Gauge .......................................................................... 127
6.4.2 Specify Properties ......................................................................... 127
6.5 Creating a Crosstab .............................................................................. 130
6.5.1 Creating a Crosstab Object ........................................................... 131
6.5.2 Defining Groupings ....................................................................... 131
6.5.3 Defining Cell Properties ................................................................ 133
6.5.4 The Layout Option and Wrapping Behavior .................................. 135
6.5.5 Special Functions .......................................................................... 136
6.6 Creating a Gantt Chart........................................................................... 138
5
Contents
6.6.1 Insert ............................................................................................. 138
6.6.2 Properties ...................................................................................... 139
6.7 Creating Statistical Reports With Footers ..............................................141
6.8 Drilldown Reports (Increase Detail Level) ............................................... 144
6.8.1 Drilldown via Relations .................................................................. 145
6.8.2 Drilldown via Report Parameters ................................................... 147
6.9 Multi-Column Reports ...........................................................................152
7. Advanced Functions ............................................................................154
7.1 Linking Objects ..................................................................................... 154
7.1.1 Object List ..................................................................................... 154
7.1.2 Creating Interlinks.......................................................................... 155
7.1.3 Sequential Interlinking ................................................................... 156
7.1.4 The Individual Size and Position Adaptations ................................ 158
7.1.5 The "at end, keep size" Interlink ..................................................... 164
7.2 Filter .....................................................................................................165
7.2.1 Project Filter .................................................................................. 165
7.2.2 Data Filters for Objects ................................................................. 165
7.3 Sum Variables ....................................................................................... 167
7.4 User Variables ....................................................................................... 168
7.5 Collection Variables ............................................................................... 169
7.6 Project Includes .................................................................................... 173
7.7 Insert PDF Pages................................................................................... 174
7.8 Insert HTML Pages................................................................................ 174
7.9 Insert OLE Documents ..........................................................................174
7.10 Insert Form Template Objects ............................................................. 175
8. Page Layout .........................................................................................176
8.1 Specifying the Page Layout ...................................................................176
8.1.1 Printer Settings .............................................................................. 176
8.1.2 Export Media ................................................................................. 177
8.1.3 Templates for Label Formats ........................................................ 178
8.1.4 Defining Your Own Label Format .................................................. 179
8.2 Layout Regions ..................................................................................... 181
8.2.1 Active Design Layout ..................................................................... 181
8.2.2 Practice: Report With Different Page Orientations ....................... 181
8.2.3 Practice: Managing Issues (Copies) .............................................. 183
8.2.4 Practice: Payment Form on the Last Page .................................... 184
8.3 Report Sections .................................................................................... 186
8.3.1 Table of Contents and Index ......................................................... 186
8.3.2 Reverse Side.................................................................................. 188
9. Output Options ....................................................................................190
9.1 Output Options ..................................................................................... 190
9.2 Real Data Preview ................................................................................. 191
9.3 Export in another Format (PDF, XLS ...) .................................................. 193
6
Contents
9.4 Test Print in the Designer ...................................................................... 195
9.5 Report Parameters ................................................................................ 195
10. Variables, Fields and Expressions ..................................................... 201
10.1 Variables-/Field-List ............................................................................. 201
10.2 The Elements of an Expression ........................................................... 202
10.2.1 Different Expression Modes ....................................................... 203
10.2.2 The Tabs...................................................................................... 204
10.2.3 The Editing Line .......................................................................... 205
10.2.4 Inserting Data .............................................................................. 205
10.2.5 Insert Fixed Text .......................................................................... 206
10.2.6 Inserting Comments ................................................................... 208
10.3 Working With Functions ...................................................................... 209
10.3.1 Notation of Functions ................................................................. 209
10.3.2 Value Types ................................................................................. 209
10.3.3 Overview of the Functions .......................................................... 210
10.3.4 Using Functions .......................................................................... 211
10.4 Working With Operators...................................................................... 219
10.4.1 Arithmetic Operators................................................................... 220
10.4.2 Relational Operators ................................................................... 221
10.4.3 Logical Operators ........................................................................ 221
10.4.4 Formula Errors............................................................................. 221
11. Overview of LL Variables and LL Fields ............................................. 223
11.1 Overview of Variables ......................................................................... 223
11.2 Overview of Fields .............................................................................. 225
12. Overview of Functions ...................................................................... 227
13. Overview of Properties ..................................................................... 306
13.1 Project Properties ............................................................................... 307
13.1.1 General Settings .......................................................................... 307
13.1.2 Fax and Mail Variables ................................................................ 310
13.2 Common Object Properties ................................................................. 310
13.2.1 Appearance Condition................................................................. 311
13.2.2 Background / Filling / Zebra Pattern ............................................ 311
13.2.3 Color ............................................................................................ 312
13.2.4 Conditional Formatting ................................................................ 312
13.2.5 Content ....................................................................................... 313
13.2.6 Design Scheme ........................................................................... 313
13.2.7 Display Condition for Issue Print ................................................. 314
13.2.8 Export as Picture ......................................................................... 314
13.2.9 Font ............................................................................................. 314
13.2.10 Format ....................................................................................... 315
13.2.11 Frame ........................................................................................ 316
13.2.12 Index Level ................................................................................ 317
13.2.13 Locked....................................................................................... 318
7
Contents
13.2.14 Name ......................................................................................... 318
13.2.15 Page Break Before Outputting Object ....................................... 318
13.2.16 Pattern ....................................................................................... 319
13.2.17 Position ...................................................................................... 319
13.2.18 Table of Contents Level ............................................................. 320
13.3 Text Objects ........................................................................................ 320
13.3.1 Object Properties ........................................................................ 320
13.3.2 Paragraph Properties ................................................................... 321
13.4 Line Objects ........................................................................................ 323
13.4.1 Object Properties ........................................................................ 323
13.5 Rectangle Objects ............................................................................... 324
13.5.1 Object Properties ........................................................................ 324
13.6 Circles and Ellipses .............................................................................325
13.6.1 Object Properties ........................................................................ 325
13.7 Picture Objects ................................................................................... 325
13.7.1 Object Properties ........................................................................ 326
13.8 Barcode Objects ................................................................................. 327
13.8.1 Object Properties ........................................................................ 328
13.8.2 Barcode Content ......................................................................... 328
13.8.3 Supported Barcode Formats ....................................................... 329
13.9 Report Container Object ......................................................................337
13.9.1 Object Properties ........................................................................ 337
13.9.2 Element Properties ...................................................................... 337
13.10 Table Objects .................................................................................... 339
13.10.1 Object Properties....................................................................... 339
13.10.2 Special Functions ...................................................................... 342
13.10.3 Line Properties .......................................................................... 342
13.10.4 Group Line Properties................................................................ 343
13.10.5 Column Properties ..................................................................... 344
13.11 Chart Objects .................................................................................... 348
13.11.1 Object Properties....................................................................... 348
13.11.2 Special Fields............................................................................. 348
13.11.3 Circle/Donut ............................................................................... 348
13.11.4 Bar/Line/Areas/Bubbles ............................................................. 351
13.11.5 Funnel ........................................................................................ 358
13.11.6 Map/Shapefile ........................................................................... 360
13.11.7 Diagram Area (All Diagram Types)............................................. 363
13.11.8 Colors (All Diagram Types without Shapefiles) ......................... 365
13.12 Crosstab Objects ............................................................................... 365
13.12.1 Object Properties....................................................................... 365
13.12.2 Special Functions ...................................................................... 365
13.12.3 Cell Properties ........................................................................... 366
13.12.4 Properties for the Crosstab Area ............................................... 367
13.13 Gantt Chart........................................................................................ 369
13.13.1 Object Properties....................................................................... 369
8
Contents
13.13.2 Special Fields ............................................................................ 369
13.13.3 Content ..................................................................................... 369
13.14 Gauge Objects .................................................................................. 372
13.14.1 Object Properties ...................................................................... 372
13.14.2 Content ..................................................................................... 372
13.15 Data Graphic ..................................................................................... 375
13.15.1 Object Properties ...................................................................... 375
13.15.2 General ...................................................................................... 375
13.15.3 Bar Properties ........................................................................... 375
13.15.4 Symbol-Properties ..................................................................... 376
13.16 Checkbox Objects ............................................................................. 377
13.16.1 Object Properties ...................................................................... 377
13.17 Formatted Text Objects..................................................................... 377
13.17.1 Object Properties ...................................................................... 378
13.18 Form Control Objects ........................................................................ 379
13.18.1 Edit ............................................................................................ 379
13.18.2 Checkbox .................................................................................. 380
13.18.3 Combobox ................................................................................. 381
13.18.4 Button ....................................................................................... 381
13.19 HTML Text Objects ........................................................................... 382
13.19.1 Object Properties ...................................................................... 382
13.19.2 Object Content .......................................................................... 382
13.20 PDF................................................................................................... 382
13.20.1 Object Properties ...................................................................... 383
13.20.2 Object Content .......................................................................... 383
13.21 OLE Container ................................................................................... 385
13.21.1 Object Properties ...................................................................... 385
13.21.2 Object Content .......................................................................... 385
13.22 Form Template Objects ..................................................................... 385
13.22.1 Object Properties ...................................................................... 385
14. Index ................................................................................................. 387
9
Introduction
1. Introduction
With the Designer, you create or edit different print templates for printing information
that originates either from a database or another data source. In the Designer, you
then have all the data at your disposal and can prepare it for printing in different
ways.
The Designer always uses the data that is passed from the program, in other words,
the application handles the process of selecting and compiling the data.
Thus, "the Designer" is not a self-contained application, but rather is incorporated in
an inherent part of an application.
The Designer – the print, preview and export dialog – is normally started via a menu
item (e.g. Configuration > Print or Output > Print).
1.1 General
The different print templates are referred to as "Projects". Along with the actual print
information, a project also contains, above all, layout specifications such as page size
and orientation, fonts, colors, frames, circles, lines, graphics etc. The Designer can
handle three different types of projects: Lists, labels and cards.
The individual elements of such a project are called "objects". For example, a project
can contain text objects, picture objects and a report container.
The required objects are normally selected in the object list, created on the
workspace with the mouse and then given the respective contents and layout
properties.
The Designer provides different types of objects which you can position freely in the
workspace and change the size as required.
Text and contents of variables
Lines
Rectangles
Circles and ellipses
Picture object
Barcode
Report container or Table object (depending on the application): The Report
containers can hold tables, charts, crosstabs and Gantt charts.
Charts: Schematic view of data.
Crosstabs: For presenting data in multiple dimensions.
Formatted text: For changing the formatting within a line.
Form elements: For entering data in the preview and PDF format.
10
Screen
Data Graphic: For simple visualization of data as a bar or symbol.
Gauge: For visualization of data as gauge or scale.
HTML content: For embedding HTML pages.
PDF: For embedding PDF documents.
OLE container. For linking OLE documents (e.g. Word, Excel).
Form templates are placed in the background of the workspace as a template so
that other objects can be aligned to them.
1.2 Screen
The Designer interface consists of a workspace and different tool windows.
A Ribbon with the particular available functions respectively the toolbars
"Objects" and "Actions". You can select the display type (ribbon or toolbar) in the
project options (File > Options > Workspace). This manual names the
commands in the Ribbon and the corresponding menu option in brackets.
Figure 1.1: The Ribbon
The ribbon can be hidden by double clicking on the tab. The blue button in the
top left is described as "File". The File menu contains commands for saving and
using the print project.
The objects are placed in the workspace. You change the shape and size of the
workspace via Project > Page Setup.
You can select the viewing mode by means of the tabs at the workspace
borders: Layout, Layout Preview, Preview.
The status bar with the current mouse position, the current operation, the
position/size and the Zoom Slider.
Tool windows for the available variables and fields (Variables-/Field-List), the
objects and elements of the report container, the different display layers (Layers)
and the properties of the selected object or project (Properties).
11
Getting Started
2. Getting Started
This chapter describes how to create a simple list based on the combit Sample
Application.
If you use List & Label as part of an application, you can usually start the Designer via
a menu item or similar. The functionality can differ slightly from the description
below.
2.1 The Examples in this manual
The Designer is not available as a self-contained application, but rather is
incorporated in List & Label as an inherent part of an application. For this reason, a
Sample Application is used to create the examples for this manual.
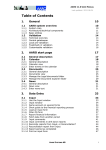
This Sample Application contains a Microsoft Access Database for a fictitious
company called "Northwind" with sample data for a food wholesaler.
It is a relational database meaning that the data is distributed across several tables.
Each table contains data elements that are related to one another. For instance, one
table contains the product data. Another contains the product categories. A table's
columns are referred to as fields (product name), and the rows of a table as data
records.
Figure 2.1: Structure of the Microsoft Northwind sample database
2.2 Creating a Simple Report
For a first simple report, you will produce a product list in alphabetical order with a
report title and a company logo.
12
Creating a Simple Report
1.
Start the Designer.
2.
A file selection dialog will appear. To start a new project, choose the New
button.
Note: This button is not available in Windows XP. Enter a name for the new
print template in the "File name" field and then choose "Open".
To open or edit an existing project, choose Open.
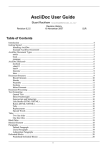
Figure 2.2: Open dialog
3.
The standard project for the respective project type is displayed. This standard
project is normally an empty workspace with a certain paper size and alignment.
With label projects, a certain label format (size and arrangement of the individual
labels on the sheet) is already specified as a default value.
Note: A standard project is a standard template for creating projects. However,
you can change it to suit your needs and save it again under the name
"Default".
4.
If you have chosen "New project wizard" under File > Options > Workspace the
project wizard will start. The project wizard simplifies the job of creating new
projects by leading you through different page setup options. We don´t use the
wizard for this example.
13
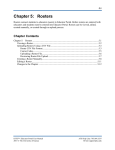
Getting Started
Figure 2.3: Empty workspace
2.2.1 Inserting a Company Logo into the Report
For the company logo, please use the "sunshine.gif" file, which you will find in the
directory for the Sample Application. We also need a "Picture" object. Proceed as
follows:
1.
Choose Insert > Picture (Objects > Insert > Picture).
Figure 2.4: Tab "Insert"
Note: Objects are your project's building blocks. They are generated in the
workspace where they are also given a border with which their size and
position can be changed. This border defines the space that the object takes
up and thus also the maximum size to which the contents of the respective
object can be expanded. Objects may overlap fully or partly.
2.
14
In the workspace, point the mouse to the position where the upper left corner of
the object is to begin. The mouse cursor changes to a crosshair. Hold down the
left mouse button and drag the crosshair to the lower right corner of the planned
object. Release the mouse button when the object (the dashed border) is the
right size.
Creating a Simple Report
Note: Objects can be added to the workspace in different ways: via the menu
Objects > Insert, via the toolbar or via keyboard shortcuts, or with Drag & Drop
from the list of variables.
3.
Select if the picture is loaded from a file or if the content is defined by a
formula/variable.
Note: This dialog is not available in Windows XP, the file selection dialog will
appear directly.
Figure 2.5: Picture source selection
4.
If you select File, a file selection dialog will appear. Select the image file.
Note: The following formats are available: WMF, EMF, BMP, DIB, PCX, SCR,
TIFF, GIF, JPEG, PCD, PNG and ICO. As a general rule, you should use the RGB
color space (not CYMK). Transparency in PNG files is supported by using the
corresponding Windows functions. In our experience the majority of printer
drivers do not support transparency so that reports with e.g. partly transparent
PNG files should thoroughly be tested on the actual hard-software
combination. If that is not possible we recommend doing without the alpha
channel.
In addition, you can insert the picture into the project by enabling the ("Embed
image in project file" checkbox option. This option copies the image to the
project thus making it available even without the external file.
5.
After you select the file, the logo will be inserted.
15
Getting Started
Figure 2.6: Report with picture object
2.2.2 Adding a Title to the Report
Use a text object to add a title to the report. Text objects let you place text in the
workspace. As well as fixed text, you can also insert the contents of fields (variables)
from the database (e.g. company name), or you can use functions (page number,
date etc.).
1.
Choose Insert > Text (Objects > Insert > Text).
28
Figure 2.7: Tab "Insert"
2.
In the workspace, hold down the left mouse button and pull the object to the
required size. Text objects should always be created in the maximum size you
want, the object shrinks at print time to the required size.
3.
The formula wizard will now appear which you can use to define the contents of
the text object.
This dialog consists of a series of tabs each containing different elements to be
edited. The following chapters explain the meanings of these elements in more
detail.
Data and Functions: the available variables, fields and functions.
Condition: for defining IF-THEN-ELSE conditions.
Text: for entering fixed text and tabs.
Date Format: different date formats.
Number Format: different number formats.
16
Creating a Simple Report
Operators: available conjunction operators.
You can also enter the expression that you want directly in the edit box or
modify the text that is there (e.g. put something in brackets).
Therefore, enter our title "Products" directly. Fixed text must be enclosed in
quotation marks. Enter names of data and functions without brackets.
Figure 2.8: Text in the formula wizard
Note: Please note that there are two ways of writing expressions, depending
on their use. You will find more information about this in the chapter "Variables,
Fields and Expressions".
4.
The title will be displayed when you close the dialog with OK.
5.
Use the Tab Texttools > Text (mini-toolbar) to enlarge the font size.
6.
You have now added the title:
17
Getting Started
Figure 2.9: Report with text object
2.2.3 Insert the Table for the Product List
Use the "Report Container" object to add a table to the report. As the name says, a
report container can hold several objects: tables, charts and crosstabs can be added
in any order.
Note: The report container is not available in all applications. In applications that
don't have the report container, use the "Table" object.
1.
Choose Insert > Report Container (Objects > Insert > Report Container).
Figure 2.10: Tab "Insert"
2.
In the workspace, hold down the left mouse button and pull the object to the
required size.
3.
A selection dialog will appear for the chosen element type. Choose the "Table"
element type.
18
Creating a Simple Report
Figure 2.11: Choosing the object type
4.
Now supply the data source in the following dialog. All available tables are
shown hierarchically; in other words, under the tables, you will find the relational
tables in each case.
Figure 2.12: Choosing the data source
Select the "Products" table because it contains the fields that we want for our
product list.
5.
A selection wizard will appear with all the fields in the "Products" table. In
addition, underneath the "Products" table, you will also find the fields in the
tables "Categories" and "Suppliers" which have a 1:1.relationship with "Products".
19
Getting Started
Figure 2.13: Data Selection Wizard
In this dialog, now choose the columns for the table. Double-click a field, e.g.
"ProductName". The field will be added to the "Columns" area.
6.
7.
Repeat this step for all fields that are to be shown in the table; i.e. also the
"CategoryName" field from the linked table "Categories" and the "UnitPrice" field
for the unit price. Confirm your selection with OK.
The table will now be displayed in the workspace.
The selected fields are displayed in the data line, in other words, the data line
contains the data.
In addition, a header line is automatically produced. Header lines are used
mostly as column titles, i.e. the selected field names are now shown here as
text.
If you pull the report container widthwise to make it wider or narrower while
holding down the CTRL key, the columns will be adjusted proportionally to fit.
The width of the columns adjusts automatically. You can adjust the width of a
column manually by moving the separating line to the right or the left with the
mouse.
Note: This changes all table columns, whose separators are within +/-2 mm
from the mouse position. If you hold down the CTRL key, the action will only
be carried out for the line on which the mouse is positioned. If the option
"Change width individually" is enabled (Table> Lines and Columns or
20
Creating a Simple Report
CTRL+M or project option "Column width modification affects next column"),
you can alter the column width while making the next column smaller.
Figure 2.14: Report with table in the report container object
2.2.4 Formatting Table Fields
Chapter "Creating Professional Tables" describes how you can format and modify a
table. Only a few basic formatting options are explained here.
1.
In the product category column title, the field name "CategoryName" is shown.
Click the respective field in order to change this text to "Category". The formula
wizard will now appear, which you can use to change the contents of the field.
Please consider that text must be enclosed in quotation marks.
21
Getting Started
Figure 2.15: Formula wizard with text input
2.
In addition, we want to format the unit price as currency and align the entire
column to the right. You will find both formatting options in the tab Table Tools
> Table (mini-toolbar). Click in the upper left corner to select the field containing
the unit price.
Figure 2.16: Selecting a single field
3.
Click the button "% Format" for the formatting dialog
4.
A selection dialog will now appear in which you can select the formatting that
you want for the numeric field. To do this, choose the type on the left hand side
i.e. "Currency". In the right pane, you can specify the currency formatting in
detail. The settings for the relevant application will be used in each case as
standard. Alternatively, you can choose the system setting or a user defined
setting.
22
Creating a Simple Report
Figure 2.17: Formatting dialog
5.
Finally, select both fields (the header and the data line) to align them to the right.
To do this, hold down the CTRL key and select both fields by clicking in the upper
left corner in each case. Then click the button for right alignment.
Figure 2.18: Multiple field selection
2.2.5 Displaying a Preview of the Report
Until now, you have only seen the report in layout view as a structure with a record.
To get an impression of the result, you can display a preview of the report. Use the
tabs in the bottom margin of the workspace to change to the preview.
Note: Real data preview mode is not supported by all applications.
Figure 2.19: "Preview Options" toolbar
The report will now be displayed with the data from the "Products" table. You can
also change the number of "products" or data records in the Sample Application.
1.
To do this, save the report with File > Save.
2.
End the Designer with File > Close.
3.
In the Sample Application, choose Options > Settings and increase the
maximum number of root records to 50.
23
Getting Started
4.
Open the print template that you created again via Design > Extended Samples,
and switch to preview mode. Your report will look roughly like this:
Figure 2.20: Real data preview
2.2.6 Adding a Page Number
It's a good idea to add a page number in the lower area of the page. To do this, add a
new text object. You will be using functions (such as the page number function) as
well as fixed text with this object.
1.
Choose Insert > Text (Objects > Insert > Text).
Figure 2.21: Tab "Insert"
2.
In the workspace, hold down the left mouse button and pull the object to the
required size.
3.
The formula wizard will now appear which you can use to define the contents of
the text object. The available functions are shown in the right pane. You can use
24
Creating a Simple Report
an auto filter with this list. Type "page" in the filter field. This will cause all
functions containing the expression "page" to be displayed.
The "Page$ ()" function returns the page number.
The "TotalPage$ ()" function returns the total number of pages.
Add the "Page$ ()" function to the result area by double-clicking.
4.
If you now want to output a footer in the form of "Page 1 of 2", you can enter the
text "of" directly in the usual way. Please consider that individual parts must be
joined with a "+" and that text must be enclosed in quotation marks.
5.
Now add the "TotalPages$ ()" function by double-clicking to get the total number
pages. The formula will look like this:
Figure 2.22: Formula wizard with functions and text
6.
You can center this line in the report in the usual way:
Figure 2.23: Quick format "centered" alignment
7.
Switch to preview mode to view the result:
25
Getting Started
Figure 2.24: Real data preview in the Designer
2.2.7 Print the Report
You can start the print function directly from the higher-level program, from the real
data preview or via File > Print.
1.
The Print Options dialog will appear.
Under "Print target", you can change the printer or the printer configuration.
Select the output format (e.g. preview, printer, Excel) under "Direct to".
26
Creating a Simple Invoice
Figure 2.25: Output options
2.
If you have selected an export format (such as PDF), choose the storage location
in the following "Save As" dialog and enter a name for the file to be created in the
"File name" field.
Figure 2.26: Save dialog when exporting to a different format
2.3 Creating a Simple Invoice
In this chapter, you will now meet functions and possibilities for designing reports.
For the next example, you will create a multi-page invoice with covering letter,
invoice header, totals, footers, enclosure and printed copy.
27
Getting Started
2.3.1 Create a New Print Template
1.
Start the Designer.
2.
A file selection dialog will appear. To start a new project, choose the New
button.
Note: This button is not available in Windows XP. Enter a name for the new
print template in the "File name" field and then choose "Open".
To open or edit an existing project, choose Open.
2.3.2 Adding a Company Logo
Use the picture object to add a logo.
1.
Choose Insert > Picture (Objects > Insert > Picture).
Figure 2.27: Tab "Insert"
2.
Pull the object to the right size and select an image file (see Chapter "Inserting a
Company Logo into the Report").
2.3.3 Add the Address Field
To add an address, use the text object. Text objects let you place text or the contents
of fields in the workspace.
Figure 2.28: Address field: it should look like this.
1.
Choose Insert > Text (Objects > Insert > Text).
Figure 2.29: Tab "Insert"
2.
Pull the object to the required size. Text objects should always be created in the
maximum size you want, the object shrinks at print time to the required size.
3.
The formula wizard will now appear which you can use to define the contents of
the text object.
This dialog consists of a series of tabs. On the "Data and Functions" tab, select
the variable for the company address (company) from the list of available
variables and fields.
28
Creating a Simple Invoice
You will see an auto filter field above the list of data. This means that you can
enter "Company" to display all fields and variables containing this expression.
Select the variable that you want by double-clicking and confirm your selection
with OK. You have now defined the first line of the address field.
Figure 2.30: Formula wizard with variable
4.
A text object can hold as many paragraphs as you want and they can all have
completely different display properties. You can add more paragraphs by means
of the tab Text Tools > Text (mini-toolbar). Choose "Append" to define an
additional line.
Figure 2.31: The Tab Tools-Tab "Text"
5.
The formula wizard will now appear, which you can use to define the contents of
the paragraph. Now enter the first name and the last name of the recipient. First
choose the "Firstname" variable.
6.
You should insert a space before choosing the "Lastname" variable to prevent
the contents of the two variables from being placed end to end. A space is
simply "Text". Fixed text must be enclosed in quotation marks. So now enter "+"
as a joining operator followed by " " for the space.
29
Getting Started
7.
Now select the "Lastname" variable. You must naturally also join this with "+".
The whole line looks like this:
Figure 2.32: Linking variables and text
8.
Now continue with the other variables: street and city. You have now completed
the address field.
Figure 2.33: Text field with 4 paragraphs
2.3.4 Create Invoice Header With Number and Date
Use the text object again to add the text "Invoice", the invoice date and the invoice
number to an invoice header.
30
Creating a Simple Invoice
Figure 2.34: Invoice header: it should look like this.
1.
Choose Insert > Text (Objects > Insert > Text).
2.
Pull the object to the required size.
3.
The formula wizard will now appear, which you can use to define the contents of
the text object. Type "Invoice".
4.
Add another paragraph by means of the tab Text Tools > Text (mini-toolbar) and
the "Append" button.
5.
The formula wizard will appear. Type "Date".
6.
Before you enter the invoice date, insert a tab stop so that the invoice date is
aligned to the right. You can insert a tab stop by means of the "Text" tab.
Figure 2.35: Adding a tab stop to a text expression
31
Getting Started
7.
You create a tab stop with the "Tab" button and you define the position and
alignment with the "Properties" button.
Note: Only one tab stop can be inserted on each line. A tab stop causes the
preceding text to run only as far as the tab stop. A tab stop that is right aligned
will cause the text that follows it to be justified to the right. The distance from
the left margin determines the position of the tab stop.
Since a tab stop is also a character, it must also be enclosed in quotation marks.
Alternatively, in this example, you can insert the tab stop with "Insert" to the
existing "Invoice date" text.
8.
Finally, position the cursor outside of the text field and insert the "Invoice_Date"
variable with the "Data and Functions" tab.
The format will be converted automatically.
Conversion with the "Date$()" function is essential since the invoice date has the
"date" type and the value that is returned is already defined as a "string" by the
"Invoice date" text expression entered earlier. The return value must always be
unique. The date value must therefore be converted to a string by means of a
function. The "Date$()" function is one way of doing this.
Figure 2.36: Format conversion with Date$()
32
Creating a Simple Invoice
The automatic format conversion uses "%x" as the formatting parameter. If you
want a different output format, switch to the "Date Format" tab. You can choose
a format here and then select the "Invoice_Date" variable.
9.
Now add the invoice number in the same way.
The format will be converted automatically here as well.
Figure 2.37: Format conversion with Str$()
Conversion with the "Str$()" function is essential since the invoice number is a
field with the "number" type and the value that is returned is already defined as a
"string" by the "Invoice number" text expression entered earlier. The return value
must always be unique. The number must therefore be converted to a string by
means of a function. The "Str$()" function is one way of doing this. This function
has 3 parameters: The first parameter is the number that is to be converted to a
string; the second parameter specifies the minimum length and the third
parameter the number of decimal places.
10. Now increase the font size for "Invoice". To do this, select the relevant line.
11. Set the font size to 24 by means of the "font size" button in Text Tools > Text
(mini-toolbar).
12. Now open the paragraph properties dialog via double-click to increase the
distance to the next line. In this dialog, you can define the properties for each
line. Set the value for the "Paragraph Spacing" property for the first line to 12 pt.
33
Getting Started
Figure 2.38: Paragraph properties dialog
13. And you now have an attractive invoice header.
2.3.5 Adding the Item List
Use the "Report Container" object to add the item list to the report. As the name
says, a report container can hold several objects: tables and freely defined content,
charts and cross tabulations. You need the "Table" element for the item list, and "Free
content" for the covering letter. Please see chapter "Insert the Table for the Product
List" for an introduction about how to create tables.
1.
Choose Insert > Report Container (Objects > Insert > Report Container).
Figure 2.39: Tab "Insert"
2.
In the workspace, hold down the left mouse button and pull the object to the
required size.
3.
A selection dialog will appear for the chosen element type. Choose the "Table"
element type.
34
Creating a Simple Invoice
Figure 2.40: Object type selection
4.
Now select the data source in the following dialog. All available tables are shown
hierarchically; in other words, under the tables, you will find the related tables in
each case. Select the "Items" table because it contains the fields that we want
for our item list.
5.
A selection wizard will appear with all the fields in the "Items" table.
6.
In this dialog, now choose the columns for the item list. Double-click one after
another on the fields: "Quantity", "No", "Description1", "UnitPrice". This will add
the fields to the "Columns" area. Confirm your selection with OK.
Figure 2.41: Data Selection Wizard
35
Getting Started
7.
The table will now be displayed in the workspace. A header line with strings as
the column titles and a data line with the contents of the fields will be created
automatically.
The width of the columns adjusts automatically. You can adjust the width of a
column manually by moving the separating line to the right or the left with the
mouse.
Note: This changes all table columns, whose separators are within +/-2 mm
from the mouse position. If you hold down the CTRL key, the action will only be
carried out for the line on which the mouse is positioned. If the option "Change
width individually" is enabled (Table> Lines and Columns or CTRL+M or project
option "Column width modification affects next column"), you can alter the
column width while making the next column smaller.
Figure 2.42: Changing column widths with the mouse
8.
In the next step, you add a new column: "Total". Select the "UnitPrice" field by
clicking in the upper left corner of the field. Then choose the "Insert Right" in
Table Tools > Table (mini-toolbar).
Figure 2.43: Select column
9.
A menu will appear for the selected field type. Choose "Text" here.
10. The formula wizard will now appear, which you can use to define the contents of
the field. Type "Total" and confirm with OK.
A message will now appear giving you the option of reducing the width of the
columns to allow the new column to be inserted in the visible area. Confirm this
dialog. You have now added an additional column to the header line. You now
need this column in the data line as well.
11. Now select the data line field containing the item price and add a new column to
it. The total price is now to be calculated here. The total price is calculated by
entering "Quantity*ItemPrice". To do this, select the relevant variables by doubleclicking them.
36
Creating a Simple Invoice
Figure 2.44: Multiplying two values in the formula wizard
Note: Open the list of available operators by clicking the "Operators" tab.
Operators join two or more values or variables to give a new value. In this way,
you can formulate arithmetic expressions (basic arithmetic operations) or
logical expression. You can combine multiple operations in one expression.
Please consider the calculation hierarchy of the operators used and place them
in brackets if necessary. The "+" operator has a special meaning. It is not only
suitable for additions ("Number" and "Date" value types) but is also used for
joining strings.
2.3.6 Alignment and Formatting
Make use of the numerous formatting options to present the invoice in the form that
you want. For example, change the column title and format the amounts as currency.
1.
Click the column title that you want to change. The formula wizard will now
appear, which you can use to change the contents of the field. Please consider
that text must be enclosed in quotation marks.
2.
In addition, you should also align the columns for the unit price and the total
price with the column titles. To do this, hold down the SHIFT key and select all 4
fields by clicking in the upper left corner of the "Item Price" data line. Then
choose the button for right alignment in the Table Tools (mini-toolbar).
37
Getting Started
3.
To format both amounts as currency, hold down the CTRL key and select both
fields by clicking in the upper left corner of each one. Then choose the button
for the formatting dialog.
Figure 2.45: Multiple field selection
4.
A selection dialog will now appear in which you can select the formatting that
you want for the numeric field. To do this, choose the type on the left hand side
i.e. "Currency". In the right pane, you can specify the currency formatting in
detail. The settings for the relevant application will be used in each case as
standard. Alternatively, you can choose the system setting or a user defined
setting.
Figure 2.46: Formatting a field
5.
Format the field for the quantity as a number without decimal points.
6.
Our item list will now look roughly like this:
38
Creating a Simple Invoice
Figure 2.47: Preview
2.3.7 Background Color and Frame
In order to structure the invoice and make it more attractive, it's a good idea to give
at least the column headers a colored background. You can also modify the
background color.
1.
To do this, select a column title.
2.
Now open the paragraph properties dialog via double-click. In this dialog, you
can define the properties for each column and row. Hold down the CTRL key and
select all columns.
3.
Click the "+" sign to expand the "Background" property group.
4.
For the background, choose the "Pattern/block color" property and the color, e.g.
LL.Color.LightSkyBlue. You reach the LL.Colors via the arrow button and the
standard color dialog via the ... button.
39
Getting Started
Figure 2.48: Object properties dialog for the table: background
5.
In addition, you want to increase the spacing between the header and the data
line. Since this is a line property (and not a column property), select the line.
Here you have the "Spacing" property. Choose e.g. 0.1 inch as "Bottom" to
increase the spacing below the column title.
Figure 2.49: Object properties dialog for the table: margins
40
Creating a Simple Invoice
6.
Now it only remains to make the settings for the frame. You can define different
settings independently for each cell. However, it's normally a good idea to make
the settings for the entire table. For this reason, the settings for the frame are
included in the table properties. You will find the table properties, as standard,
on the lower left when you select the table in the "Report Container" tool
window. When you select the property, there is a button which you can use to
open the dialog for the frame properties.
Figure 2.50: Frame properties
7.
Choose "white" as the color and click "Outline" to apply the color.
Please note: If you don't apply the setting but simply confirm the dialog with OK,
your settings will be lost!
8.
The invoice will now look roughly like this in the preview:
Figure 2.51: Preview (frame and background)
41
Getting Started
2.3.8 Invoice Footer With Totals
You now need to output the net totals, the VAT and the total amount in the invoice
footer. You can simply insert these values if they are held as fields in the database.
In our case, however, you must first calculate the values. To do this, you use the
"Sum()" aggregate function. This function totals the values that are passed to it.
Since the totals are to be output at the end of the table, you define a footer for this
purpose.
1.
Click "Insert Above" in the Table Tools (mini-toolbar) and then click "Footer Line".
Figure 2.52: Add new line
2.
You have not yet defined a line for this line type so you will be asked whether
you want to use an existing line definition from one of the other line types. This
wouldn't save any time at this point. Therefore, choose the "Single field or free
content" option.
Figure 2.53: Applying a line definition
42
Creating a Simple Invoice
3.
The formula wizard will open to allow you to define the contents of the first
column. Enter "Subtotal", not forgetting to enclose it in quotation marks.
4.
Once you have created the first line, add another column to it for the
aggregation. Use the "Sum()" function for aggregating values. You can either type
it in directly in the result field in the formula wizard or you can select the function
from the list of aggregate functions by double-clicking. As a parameter, enter the
value to be aggregated – in this case Quantity*ItemPrice.
Figure 2.54: Totaling with Sum()
5.
The entire line should now be moved a little to the right. Hold down the CTRL key
and drag the column separator on the extreme left at the outer edge of the table
to the right. An empty column will be inserted automatically as a spacer on the
extreme left.
6.
You must also format the total field as currency, give both columns the same
background color as the header line and set the "Top" margin to 0.1 inch to
correspond with the "Bottom" margin of the header line.
7.
As these footers are only to be output on the last page, even in the case of
multiple page invoices, you must now specify the "Lastpage()" or
"LastFooterThisTable()" function for the "Appearance Condition" line property.
43
Getting Started
Figure 2.55: Object dialog with 3 columns
8.
You have now defined the first footer and the invoice looks like this:
Figure 2.56: Preview (footer)
44
Creating a Simple Invoice
2.3.9 Create Additional Footer Lines
You can create as many line definitions as required for each line type (data line,
footer). The different line definitions are shown in the object dialog as a tree
structure.
For our example, now create two more footers for the VAT and the grand total.
Figure 2.57: Preview 3 footers
1.
To add more lines in the object dialog, first select an existing line definition. You
can then create a new line definition with the "Append line definition" button.
Figure 2.58: Object dialog with 4 lines
Alternatively, you can add a new line via the context menu or with the Table
Tools (the mini-toolbar) directly in the workspace.
2.
A dialog will appear asking you whether you want to use an existing line
definition. It saves some time if you use the footer that you have already created
as you will not have to configure the left margin, alignment or background
colors. Therefore, choose the "Line definition 1" entry from the "Footer" area.
3.
The line will now be inserted. Click the "Subtotal" field so that you can then
change the content to "VAT" with the formula wizard. Don't forget to enclose the
text in quotation marks.
45
Getting Started
4.
Once you have created the column, click in the column to enter the aggregation.
Instead of the total net amount, the 10% VAT is to be output here. Therefore,
you simply multiply the amount by 0.1:
Sum (Item.Quantity * Item.UnitPrice * 0.1)
5.
Proceed in the same way with the third footer. Copy the existing footer, change
the content and, in the formula, add the VAT to the total, like this:
Sum (Item.Quantity * Item.UnitPrice * 1.1)
6.
You have now defined the footer and the invoice looks like this:
Figure 2.59: Invoice with 3 footers
2.4 Creating a Simple Label
For your first label, you will now create an item label.
1.
46
Start the Designer.
Creating a Simple Label
2.
A file selection dialog will appear. To start a new project, choose the New
button.
Note: This button is not available in Windows XP. Enter a name for the new
print template in the "File name" field and then choose "Open".
To open or edit an existing project, choose Open.
3.
The standard project for this project type is displayed. This standard project is
normally an empty workspace with a certain paper size and alignment.
4.
Select a label format via Project > Layout Regions (Project > Page Setup). In the
"Templates" tab, choose the template that you want from the predefined label
formats of various manufacturers. This specifies automatically the size of the
individual labels, how many are to appear on the sheet and how they are to be
distributed. You will find more information about this in the chapter "Templates
for Label Formats".
Figure 2.60: Specify label format
5.
A single label will now be displayed in the workspace.
2.4.1 Insert Object
A picture of the item is to be displayed as a picture object on the label together with
two text objects (Item_No, Description and Price). Place a tab stop between the text
"Item No." and the "Item_No) variable.
47
Getting Started
Figure 2.61: It should look like this
1.
Begin by positioning the text object. Choose Insert > Text (Objects > Insert >
Text).
Figure 2.62: Tab "Insert"
2.
Pull the object to the required size.
3.
The formula wizard will now appear, which you can use to define the contents of
the text object.
4.
Now follow the steps described in Chapter "Add the Address Field" onwards.
5.
Use the picture object to add a logo. Drag the "Picture" variable from the list of
variables into the workspace. Pull the object to the required size.
48
Creating a Simple Label
2.4.2 Insert Barcode
The content dialog for the barcode object lets you define the barcode more precisely.
Choose "Text" if you want to print fixed text as a barcode. Choose "Formula" if you
want to use a formula as a barcode, and define a valid formula expression with the
"Edit" button. The formula must return a "barcode" value type. You can, of course,
also enter variables. However, they must first be converted to the "barcode" type with
the Barcode() function.
2.4.3 Printing Labels
You can start the print function directly from the higher-level program, from the real
data preview or via File > Print.
1.
The output options dialog will appear.
Under "Print target", you can change the printer or the printer configuration.
Select the output format (e.g. preview, printer) under "Direct to".
2.
The "Select" button lets you specify the starting position when printing the sheet
of labels. In this way, you can also print sheets of labels that have already been
partly used. You will find a sample label sheet for your label project in the dialog
for selecting the start position. Click the label where the print is to start.
49
Effective Workspace Techniques
3. Effective Workspace Techniques
This chapter will provide you with useful information and the most important
techniques for working efficiently with the Designer.
3.1 View Mode
You can select the view mode by means of the tabs in the margin of the workspace:
Figure 3.1: Tabs for selecting the view mode
3.1.1 Layout
In layout mode, you merely see the object frame and the contents of the objects as
formulas.
3.1.2 Layout Preview
The layout preview shows the objects in the WYSIWYG format. In addition, the
objects are transparent and are drawn in the color of the layer to which they are
assigned.
Choose File > Options > Preview to define global settings for the preview.
Setting Colors for the Preview: In the "Colors" group you can define the color for
the background of the preview window using the combo box "Background". With
the combo box "Border" you can select the color of the simulated paper border in
the preview.
Display of Label/Card Projects: Select if the preview should contain only one
label or the complete page.
Optimized View: Using the options from the "View Optimization" group you can
reduce different preview details, which enables a faster preview.
Real Data Preview
Objects can be marked by color (the color depend on the assigned layer).
3.1.3 Real Data Preview
The real data preview function is available directly in the Designer provided that your
application supports it. In this way, you can check the layout of a printout without
wasting paper in order to do so. After checking the layout, the actual print can be
started from the preview without having to use the print command again.
Choose File > Options > Preview to set the maximum number of pages which are
displayed in the Real Data Preview.
Also see "Real Data Preview" in chapter "Output Options".
50
General Procedures
Figure 3.2: Real data preview in the Designer
3.2 General Procedures
3.2.1 Choosing a Page Layout
The first task in a new project is to set up the page layout that you want. Choose
Project > Layout Regions (Project > Page Layout) to specify properties such the
choice of printer, paper size and orientation.
If multiple layout areas are defined, the active workspace can be selected via the
"Active Design Layout" project property.
3.2.2 Zoom
It is possible to zoom in on the workspace. Use "Zoom In", "Zoom Out" and "100%" to
adjust the view in the workspace. Use the Zoom slider in the status bar to slide to
the zoom percentage you requires (50% - 500%).
51
Effective Workspace Techniques
Use "Select Area" to select the view area with the left mouse button. Choose Start>
Select Area (objects toolbar> Select).
3.2.3 Status Line
The status line is divided in three sections.
The current mouse position from upper left.
The active operation (e.g. selection).
Name, position upper left, position lower right, width, height and layer of the
selected object.
Zoom slider for Workspace and Preview.
Figure 3.3: Status line
3.2.4 Ribbon
The Ribbon contains command buttons on different tabs. The commands are
arranged according to how often they are used. Frequently used commands are
available prominently; less frequently used commands are located on less
prominently.
Note: Alternatively, you can work with a classic menu and toolbars. Select the type
of display in the project options (Project> Options> Workspace).
Figure 3.4: The Ribbon
Some other commands are displayed only when you might need them, in response
to an action.
Text Tools
If you insert a text object, the Text Tools and the tab "Text" are displayed. The tab
contains the commands you need for working with text objects. When you have
finished the work on the text object, the Text Tools are hidden.
Figure 3.5: The Text Tools
With the Text Tools you can append/insert a paragraph, move paragraphs
upwards/downwards, apply fonts, font sizes, text colors and formatting as well as
arrange objects.
52
General Procedures
To select a complete paragraph, click onto the bar on the left. Hold Ctrl or Shift
to select multiple paragraphs or a complete range.
Figure 3.6: The Table Tools
Table Tools
If you insert a table, the Table Tools and the tab "Table" are displayed. The tab
contains the commands you need for working with table objects. When you have
finished the work on the text object, the Table Tools are hidden.
Figure 3.7: The Table Tools
With the Table Tools you can define a new line, insert a new row, move selected
rows/cells to the left/right, borders, apply fonts, font sizes, text colors and formatting
as well as arrange objects.
To select a field, click in the top left corner of the field. Hold Ctrl or Shift to select
multiple fields or a complete range.
Figure 3.8: Select a field
To select a complete line, click onto the bar on the left. Hold Ctrl or Shift to
select multiple paragraphs or a complete range.
Figure 3.9: Select a complete line
To select a complete column, hold Alt. Hold Ctrl or Shift to select multiple
columns or a complete range.
53
Effective Workspace Techniques
Figure 3.10: Select a complete column
Drawing Tools
If you insert a drawing object, the Drawing Tools and the tab "Design" are displayed.
The tab contains the commands you need for working with drawing objects (e.g.
Outline color, Lineweight).
Figure 3.11: The Drawing Tools
Minimize the Ribbon
The ribbon can be minimized in order to save screen space.
Right-click the ribbon, and then click Minimize the Ribbon.
To quickly minimize the ribbon, double-click the name of the active tab. Doubleclick a tab again to restore the ribbon.
To minimize or restore the ribbon via Keyboard shortcut press CTRL+F1.
To use the ribbon while it is minimized, click the tab you want to use, and then click
the option or command you want to use.
Quick Access Toolbar
The Quick Access Toolbar is a customizable toolbar that contains a set of commands
that are independent of the tab on the ribbon that is currently displayed. You can
move the Quick Access Toolbar from one of the two possible locations, and you can
add buttons that represent commands to the Quick Access Toolbar.
Figure 3.12: The quick access toolbar
On the ribbon, click the appropriate tab or group to display the command that you
want to add to the Quick Access Toolbar. Right-click the command, and then click
"Add to Quick Access Toolbar" on the shortcut menu. In order to delete a command,
right-click the command you want to remove from the Quick Access Toolbar, and
then click "Remove from Quick Access Toolbar" on the shortcut menu.
54
General Procedures
The File menu
The File menu (The blue tab top left) contains commands for saving, printing,
exporting the project and the project options.
Figure 3.13: The File menu
3.2.5 Mini-toolbar
When you select a text object or a table object, a convenient toolbar in miniature
format is displayed, the mini-toolbar.
Note: The Mini toolbar is especially useful if you use the classic menu and
toolbars instead of the ribbon. You can select the type of display in the project
options (Project> Options> Workspace). When using the ribbon, the functions of
the mini-toolbar will be displayed in the tabs "Text Tools" and "Table Tools".
With the mini-toolbar you can add a text paragraph, define a new table line,
insert a new table row, apply fonts, font sizes, orientations, text colors and
formatting as well as open the object dialog.
You can close the mini-toolbar by pressing ESC. With the project option "Show
mini-toolbar" (File > Options > Workspace) it can be suppressed permanently.
Figure 3.14: Mini-toolbar for text objects
55
Effective Workspace Techniques
3.2.6 Default Settings for Font and Frame
Choose File > Options > Objects.
The "Select" button under "Object font" lets you choose the default font to be
used for objects.
Under "Color preferences", you can specify the border and the filling for objects.
By default, the "preset" is activated for the various object properties (e.g. Font.Size,
Font.Bold, Font.Color). Hence, if a preset is changed at a later point in time, this will
affect all properties for which the font was not manually changed. To increase the
size of the font by 2pt as compared to the preset, select "+2" as the value for the
size, or correspondingly "-2" to decrease the font size by 2pt.
When you start a new project, it's a good idea to configure these settings using
suitable values to keep the effort required for making manual changes to a minimum.
The settings only apply for the current project.
3.2.7 Undo or redo an action
You can undo or redo actions and save yourself some retyping.
Undo an action
Press CTRL+Z (Alt+Backspace) until you've fixed your mistake. If you prefer your
mouse, click Undo in the Quick Access Toolbar, in the upper-left corner of the
Window.
You can't undo some actions, such as clicking commands on the File menu or saving
a file.
Redo an action
To redo something you've undone, press CTRL+Y or F4. Or click Redo on the Quick
Access toolbar.
3.2.8 Copy Formats
You can copy formats and apply them somewhere else.
1.
Select the object or an element in the report container (e.g. use the selection bar
on the left of the container).
In tables, you can select individual cells.
Figure 3.15: Select a table cell
56
General Procedures
In crosstabs, you can also select individual cells. Open the properties of the
crosstab and go to the "Cell Definition" tab.
Figure 3.16: Select a crosstab cell
2.
Click the format painter tool on the tab "Start" (Edit > Format Painter). In
crosstabs go the upper right corner of the "Cell Definition" tab.
3.
Click on the object, the cell or element to apply the format.
Figure 3.17: Format Painter
4.
If you want to copy the formatting to more than one cell, object or element,
double-click instead of single-clicking Format Painter. To exit the Format Painter,
press Esc.
3.2.9 Variable/field list and drag & drop
The variable/field list (Project > Variables/fields) shows all variables and fields
available in the current project and supports drag & drop for variables and fields.
When you drag variables to an empty area, a paragraph will be created in a new
text object.
When you drag variables to an existing text object, the variable can either be
inserted into an existing paragraph, or a new paragraph can be created.
When you drag fields into an existing report container, a new table will be
created.
If you wish to add additional columns for existing rows in tables, you can simply
drag the desired fields from the list to the corresponding location using your
mouse. In this case, the field can be added to the left or right of an existing
column; the insertion position is indicated visually with the help of a symbol. The
57
Effective Workspace Techniques
column (default width 30 mm) will then be inserted in the corresponding row.
Note that this may also create columns in invisible areas.
For numerical fields, this also automatically creates a footer with sums. If you do
not wish to create a footer, hold down the CTRL key.
If you have selected multiple fields, the order of the selection will be noted and
the fields will be placed in the corresponding order.
When you drag fields to an empty area, a new table will be created in a new
report container.
When you drag fields into an existing report container, a new table will be
created.
When you drag fields from a relationally linked table to an existing table (e.g.
fields from "Orders" to the table "Customers"), a new sub-table will be created.
3.3 Inserting and Arranging Objects
Objects are your project's building blocks. They are generated in the workspace
where they are also given a border with which their size and position can be
changed. This border defines the space that the object takes up and thus also the
maximum size to which the contents of the respective object can be expanded.
Objects may overlap fully or partly.
3.3.1 Inserting Objects
Objects may be inserted in the project workspace in different ways: using the tab
"Insert" (Object > Insert), shortcut keys or per drag & drop function of the variable list.
Text objects are inserted most comfortably and efficiently per drag & drop from the
variable list. Simply select the desired variable and drag it to a free area in the project
workspace. The easiest way to insert all other objects is via the toolbar.
1.
Select the desired object type. The mouse pointer will change to a crosshair.
2.
Place the crosshair on the point at which a corner of the object should be
placed. It is best to use the left upper corner of the planned object.
3.
Depress the left mouse button and pull – while keeping the mouse button
depressed – to the opposite corner of the planned object. If you started in the
upper left corner, pull the crosshair to the lower right corner of the planned
object.
4.
A dashed frame will appear which represents the size that the object will
assume upon release of the left mouse button.
5.
Release the mouse button when the object (dashed frame) has the desired size.
58
Inserting and Arranging Objects
3.3.2 Size and Position of Objects
You can move each selected object or change its size. If you select multiple objects,
you can change them all as if a single object were selected.
1.
Changing the size with the mouse: Select the object. If you position the mouse
on the frame, you can change the size by pulling the frame inwards or outwards,
as indicated by the arrows, while holding down the left mouse button. The
object's dimensions are shown during the resizing. You must position the mouse
in one corner of the frame in order to change the size both horizontally and
vertically.
2.
Moving with the mouse: Select the object. Hold down the mouse button and
drag the object to the position that you want. If you press the SHIFT key, you will
only be able to move the objects horizontally or vertically. The alignment remains
the same.
3.
Changing the size and moving with the dialog: You can also change the size and
position of an object by means of the property list. You can enter values
precisely here. If you double click the "Position" sub-item in the property list, a
position dialog will appear which makes it even easier to enter the size and
position of objects with the keyboard.
4.
Using the keyboard to move objects or change their size: Select the object. Use
the DIRECTION keys to move the object in the respective direction. Pressing the
key once moves the object by the smallest possible unit, if you hold down the
CTRL key, the object will be moved by ten times the smallest unit.
3.3.3 Arrangement as an Object List
Objects on the workspace may overlap or completely cover each other. Using the tab
"Start" (Objects > Arrange) or via context menu, you can rearrange the planes of the
selected objects so that they have the order you require (To Front, To Back, Forward,
Backward).
Please note that these "planes" (just a term in this case) have nothing to do with
the layers. Objects that have been edited using "Arrange" will not have their layer
assignment changed.
The object highest in the object list is the object in the background, the lowest/final
object to appear in the object list is the object in the foreground.
Exception: Generally the unlinked objects will be printed first, followed by the report
container and then the objects that are linked with other objects in some manner. In
other words, even if the report container is the first object in the object list, it will still
be printed last, i.e. in the foreground. With a temporal linking it is possible to print
objects (e.g. a text field) on top of a report container. You can find further
information about this process in the "Linking Objects" chapter.
59
Effective Workspace Techniques
Figure 3.18: Print order in the object list
3.3.4 Grouping of Objects
You can group multiple objects that belong together and then modify them as if they
were a single object. Please note that an object can only belong to one group. It is
therefore not possible to combine groups to a higher-level group.
In order to make a group of two or more objects, select the objects in question
and then choose Group in the context menu.
To edit a grouped object, hold down the ALT-key when selecting the object.
To remove the grouping, choose the item Ungroup.
3.3.5 Copies of Objects
You can copy objects singly or multiply.
Copy objects
1.
Select the object you want to copy, and press CTRL+C. You can also press
CTRL+X to cut the object.
2.
Move the mouse to the location where you want to paste the object and press
CTRL+V (Start> Paste). You can also use the "Paste" command on the contextmenu.
60
Alignment of Objects
Multiple Copies of Objects
If you want to place several, similar objects with the same distance on the
workspace, select the object and then choose Multiple Copies in the context menu.
Define the number and spacing of the objects horizontally and vertically.
3.3.6 Importing Objects
With File > Import, you can insert a copy of all objects belonging to another project
to the project that is currently loaded.
3.4 Alignment of Objects
You have different possibilities to align objects.
3.4.1 Displaying the Alignment Grid
Via Project > Gridlines (File > Options > Project) you can display an object alignment
grid.
Define the properties of the gridlines via File > Options > Project. You can specify
the spacing of the grid lines. The "Horiz./vertical synchronized" option causes the
same grid spacing in both directions.
3.4.2 Aligning Objects
Via the tab "Start" (Objects > Arrange > Alignment) and the item "Arrange", or the
corresponding toolbar, you can align multiple objects with one another. At least two
objects must be selected for the function to be enabled.
Figure 3.19: Toolbar for the alignment functions
Align Left, Align Right, Align Top, Align Bottom: The selected objects are aligned
to the border of the selection rectangle in which they are enclosed.
Centered: The selected objects are centered in the respective direction
(horizontal or vertical) within the selection rectangle.
Size adjustment: The frames of the selected objects are adjusted to a common
size in the respective direction (horizontal or vertical).
Equal shape distance: The distance between the edges of the selected object is
set to be equal. The outer edges in each case are significant here. The average
distance is determined relative to the edges of the objects and the objects are
arranged accordingly. In the event that the selected objects overlap, i.e. the
intermediate area has a negative value, the function will not spread the objects
61
Effective Workspace Techniques
apart but instead, only the degree of overlapping will be adjusted to the average
value.
Equal center distance: The distance between the centers of the selected object
is set to be equal. The average distance is determined relative to the centers of
the objects and the objects are arranged accordingly. In the event that the
selected objects overlap, the function will not spread the objects apart but
instead, merely the degree of overlapping is adjusted to the average value.
3.4.3 Guides in the Workspace
You can create horizontal and vertical guides. To do this, position the mouse on a
ruler, press and hold the mouse button and release it again in the workspace. A
position dialog will then appear, allowing you to enter the exact position. The new
guide is aligned in the same direction as the originally selected ruler. You can then
move the guides around as you wish.
A catch function helps you to position objects directly on the guide. This function
does not connect the objects permanently to the guide but merely helps you when
positioning objects.
If you hold down the CTRL key when you move the guide, the objects connected to
the guide will be moved as well.
The options relating to guides are defined via a context menu which appears when
you click the right mouse button. This lets you choose a catch range in pixels for
each guide. When you come within this range, the object will be drawn to the guide.
The catch function is switched off if you hold down the CTRL function when working
with objects. When drawing new objects in the workspace, the top left corner must
be placed next to the guide so that the object will be connected to the guide.
Figure 3.20: Context menu for guides
You can fix the guides in the workspace and prevent them from being moved by
mistake. You can also specify the position of the guide directly.
3.5 Project Options
In the Project options (File (the blue tab top left) > Options or Project > Options), you
find different defaultsfor the project, the objects, the preview and the workspace.
62
Project Options
3.5.1 Options for the Project
You find different defaults under File > Options > Project.
Defining Alignment Grid: See "Alignment of Objects" in this chapter.
Precision: Here you can define the default number of decimal places for numeric
values, which will be used as long as they aren't printed with format specifiers
(ex. FStr$).
Table of Contents and Index: Here you can set the maximum folder depth for
table of contents and index. See "Report Sections" in chapter "Page Layout".
3.5.2 Default Settings for Font and Frame
Choose File > Options > Objects to choose the default to be used for object font,
border color and filling color. See "Default Settings for Font and Frame" in chapter
"Effective Workspace Techniques".
3.5.3 Preview
Choose File > Options > Preview to define global settings for the preview. See
"View Mode" in chapter "Effective Workspace Techniques".
3.5.4 Options for the Workspace
Via the File > Options > Workspace menu item the workspace can be adjusted to
your needs in various ways.
Font for formula wizard
In the "Layout-View: Text in Objects" group you can define whether the text
contained in barcode, picture and formatted text objects should be displayed in the
layout view (as an option with the selected font and formatting).
Settings for Usability
The "Usability" options allow you to define various default values.
Check the option "Object Info" to get a tooltip with the object name.
Check the option "New Project Wizard" to receive assistance when creating new
projects.
Set the "Selection mode after object insertion" option in order to switch to the
selection mode automatically after inserting an object. This prevents you, for
example, from inserting multiple objects accidentally.
If the option "Use Ribbon if possible" is unchecked, a toolbar will appear.
Show mini –toolbar: You can activate the mini-toolbar for text- and tabel-objects.
Reactivate messages: Deactivated messages will be activated again.
63
Effective Workspace Techniques
Property lists: You can choose whether the states of the property lists saved
permanently, deleted when closing the designer or not to be saved.
Changing Column Widths Using the Cursor
The width of a field or an entire column can be controlled precisely by adjusting the
"width” property. You can also control the width directly with your cursor in the
workspace by selecting the table object and moving the right hand border line of a
column. This will affect all table columns, whose separators lie within a +/-2mm
interval of the cursor.
The adjustment will affect only the line on which the cursor is positioned if CTRL
is held down.
The line will snap to a separator mark if it is within a 10 pixel interval of it. By
holding SHIFT, this function is turned off.
With the option "Column width modification modifies next column", it is possible
to change the width of the column while also changing the width of the next.
To change the widths of columns that are currently invisible, deactivate the "Edit
only visible cells" option.
AutoRecover
It may happen that a project was not closed properly and you were unable to save
changes you made. The reason may be e.g. a power failure or an error in the
application.
The AutoRecover option allows you to instruct the program to save the project at
regular, customizable intervals. This means that the changes made to the file are at
least partially saved since the last save procedure, depending on how short the
chosen save interval is.
When a project is opened, the Designer will detect that an AutoRecover file is
available. You can then either save the recover file under a new name or ignore the
file and continue.
Figure 3.21: AutoRecover file found
64
Where Will the Objects be Printed?
4. Mastering Appearance Conditions
In this chapter, we will examine the concept of appearance conditions using a multipage standard letter or mail merge as an example. By means of appearance
conditions, you can specify when objects, elements, paragraphs, lines or columns
are to be printed or displayed.
In addition, it is frequently helpful to assign objects that belong together in terms of
content into what is called a layer. An appearance condition can be defined for each
layer. This condition specifies the conditions under which the objects assigned to
this layer are to be printed.
4.1 Where Will the Objects be Printed?
If a layer has not been defined for the objects, they will be printed on each page.
As an exception to this rule, table objects, cross tabs, text and formatted text are
printed consecutively starting on the 1st page.
With text and formatted text, the "Page break" property must be set to "yes".
A new page will therefore be created automatically whenever the space available in
the object is no longer sufficient. This means that you do not have to create a second
page; this is taken care of automatically by table objects, crosstabs, text, formatted
text or by means of the "Minimum page count" project property.
4.2 Working With Appearance Conditions
You can use filter conditions to control precisely the data to be output. In this way,
you can specify conditions not only for displaying data records but also for displaying
objects.
These conditions are logical expressions whose results decide whether a certain
data record or a certain object is printed or not. If the logical expression is true, the
data record or the object is printed. If the logical expression is false, the data record
or the object is not printed.
In order to achieve this, you define a corresponding "Appearance condition". You will
find these conditions in the properties of projects, layers, objects, elements,
paragraphs, lines or columns.
For example, if you want to output the terms of payment in the footer of an item
table, use the appearance condition for this line to specify that it is only to be printed
on the last page. Otherwise, this footer will be printed on every page at the end of
the table.
Example "Last page only": Lastpage()
65
Mastering Appearance Conditions
Or you define a condition specifying that the company logo is only to be output if the
letter is created as a PDF file, since, when outputting to the printer, the company
logo is already printed on the letterheads.
Example "For PDF output only": LL.OutputDevice="PDF"
In appearance conditions for table footer lines, you can also use the predefined "Last
page only" value. Internally, this entry uses the functions "Lastpage()" or
"LastFooterThisTable()".
In appearance conditions for table headers, you can also use the predefined "First
page only" value. Internally, this entry uses the functions "not Lastpage()" or
"FirstHeaderThisTable()".
4.3 Working With Layers
If you define appearance conditions for a layer, you can then assign objects to this
layer. This is very useful especially with large and complex projects as it allows you
to hide or display the objects assigned to a specific layer via the checkbox in the tool
window.
In this way, you avoid overlapping the different objects on the workspace which
would otherwise make working on individual objects difficult.
Figure 4.1: Layers tool window
4.3.1 Defining Layers
You define layers via Project > Layers (Project > Layer Definitions) or by double
clicking in the "Layers" tool window.
In the "Layers" dialog, you can define as many additional layers as you want with the
"New" or "Copy/Insert" buttons. Each new layer appears initially with the name "Layer".
You can enter a meaningful name for the layer in the "Name" field.
When creating new projects, the "Base", "First page" and "Following pages" layers
are automatically defined.
It's a good idea to give the layers different colors in order to easily tell them
apart. This also causes the objects in the respective layers to be shown in
different colors in the layout preview display mode. This color has no effect on
the actual print.
66
Working With Layers
If you delete a layer, the associated objects are automatically assigned to the
base layer. At least one layer must be defined.
New objects are automatically assigned to the first visible layer.
The Lastpage() function in an appearance condition can only be evaluated
correctly if an object is linked to a table/report container.
User variables cannot be used within appearance conditions of layers.
Figure 4.2: Layer definition dialog
In the "Condition" field you define the appearance condition for this layer. This
appearance condition then applies for all objects on the layer in question, i.e. the
associated objects are only printed when the condition for the layer is met.
Typical appearance conditions:
Condition
Explanation
no condition
The objects on this layer are always printed.
Page()=1
The objects on this layer are only printed on the first page.
Page()<>1
The objects on this layer are printed from the second page onwards.
4.3.2 Assigning Objects to a Layer
Once you have defined the layers, you can assign objects to them. You have two
options:
1.
In order to assign multiple objects to a layer, select the objects in the workspace
and choose Assign to layer in the context menu. Select the layer that you want
in the dialog that appears and confirm with OK.
In the workspace, the assigned objects automatically receive the color of the
corresponding layer so that they can be easily differentiated from the other
objects. This only affects the appearance on the workspace and not the print.
67
Mastering Appearance Conditions
2.
Alternatively, you can also copy objects into a layer. This is useful when you
want to include the same objects in different layers. Example: you create one
layer for each language. You then copy all objects into the language layer and
translate them.
The original object remains in its original layer and a copy of the object is created
in an additional layer. To do this choose Copy to Layer from the context menu
for the selected object.
Figure 4.3: Dialog for assigning objects to a layer
4.4 Practice: Create a Mail Merge Project
You learned the basic procedures in Chapter 2. In this chapter, you will now meet
other functions and possibilities for designing reports, using a serial or standard
letter as an example. As opposed to the previous examples, you use the formatted
text object here for the text of the mail merge and change the position of the object
from the second page onwards.
4.4.1 Create a New Print Template
1.
Start the Designer.
2.
A file selection dialog will appear. To start a new project, choose the New
button.
Note: This button is not available in Windows XP. Enter a name for the new
print template in the "File name" field and then choose "Open".
To open or edit an existing project, choose Open.
4.4.2 Adding a Company Logo
Use the picture object to add a logo.
1.
68
Choose Insert > Picture (Objects > Insert > Picture).
Practice: Create a Mail Merge Project
2.
Pull the object to the right size and select an image file (see Chapter 2.2.1).
3.
The company logo is only to be printed for PDF output. The logo is not to be
printed when outputting to the printer. This means, you select the picture object
and enter the "LL.OutputDevice = "PDF" logical condition in the "Appearance
Condition" object property.
Also see chapter "Overview of LL Variables and LL Fields".
4.4.3 Add the Address Field
To add an address, use the text object. Text objects let you place text or the contents
of fields in the workspace.
Figure 4.4: Address field: it should look like this.
1.
Choose Insert > Text (Objects > Insert > Text).
Figure 4.5: Tab "Insert"
2.
Pull the object to the required size.
3.
The formula wizard will now appear, which you can use to define the contents of
the text object.
69
Mastering Appearance Conditions
Figure 4.6: Formula wizard with variable
This dialog consists of a series of tabs. On the "Data and Functions" tab, select
the variable for the company address (company) from the list of available
variables and fields.
You will see an auto filter field above the list of data. This means that you can
enter "Company" to display all fields and variables containing this expression.
Select the variable that you want by double-clicking and confirm your selection
with OK. You have now defined the first line of the address field.
4.
A text object can hold as many paragraphs as you want and they can all have
completely different display properties. You can add more paragraphs by means
of the Text Tools (mini-toolbar). Choose "Append" to define an additional line.
Figure 4.7: Adding another paragraph via the Text Tools
5.
70
The formula wizard will now appear, which you can use to define the contents of
the paragraph. Now enter the first name and the last name of the recipient. First
choose the "Firstname" variable.
Practice: Create a Mail Merge Project
Figure 4.8: Linking variables and text
6.
You should insert a space before choosing the "Lastname" variable to prevent
the contents of the two variables from being placed directly end to end. A space
is simply "Text". Fixed text must be enclosed in quotation marks. So now enter
"+" as a joining operator followed by " " for the space.
7.
Now select the "Lastname" variable. You must of course also join this with "+".
8.
Now continue with the other variables: street and city. You have now completed
the address field.
Figure 4.9: Text field with 4 paragraphs
4.4.4 Adding the Date and Page Number
Use a text object once more to add a date and the page number to the letter.
1.
Choose Insert > Text (Objects > Insert > Text).
2.
Pull the object to the required size.
71
Mastering Appearance Conditions
3.
The formula wizard will now appear, which you can use to define the contents of
the text object. Switch to the "Date Format" tab.
4.
Select the date format that you want. When you do so, the Now() function will
be inserted automatically in the Date$() function. This outputs the current date in
the format that you have chosen.
5.
Then create a further text object in the footer area for the page number. In the
result area of the formula wizard, enter the Page$() function directly to output
the page number.
4.4.5 Adding Formatted Text for the Letter
You output the text for the letter with the formatted text object. As opposed to the
normal text object, this object also lets you change the formatting of the text within a
line.
1.
Choose Insert > Text (Objects > Insert > Text).
Figure 4.10: Tab "Insert"
2.
3.
Pull the object to the required size.
A dialog appears where you can type in the letter in the form of continuous text.
Alternatively, you can select an RTF variable from the "Source" drop-down list if
available.
Figure 4.11: Formatted text object dialog
72
Practice: Create a Mail Merge Project
Expert tip: If the current RTF object is appended to another RTF object for
which the "Page break" option is enabled, the "Transfer exceeding text of ..."
option is available as a data source ...". If you select this option, you cannot
enter text in the RTF object because the (remaining) text will be transferred
automatically from the other RTF object (e.g. for a two-column print).
4.
If you click the formula button, the formula wizard will appear here as well,
which you can use to insert variables.
You want to address the recipient personally so you now create the salutation.
When doing so, please make sure that you do not enter an unnecessary space
character at the end of the salutation formula if the "Name" field in "Dear Sir or
Madam" salutations is to be empty. One possibility for a perfect salutation
formula is the use of Rtrim$() e.g.:
«Rtrim$(Recipient.Salutation + " " + Recipient.Lastname)»,
5.
Now write the letter text. You have various formatting options at your disposal.
You create a tab stop with CTRL+TAB.
Or you can create the letter text or pictures and graphics in your normal text
processing program (e.g. MS Word), and insert them into this dialog with copy
CTRL+C and paste CTRL+V. The layout cannot always be taken over 1:1.
6.
The "WYSIWYG" (What You See Is What You Get) button shows you the
hyphenation based on the object size. This is just an approximate guide and can
differ slightly.
7.
Page breaks are created automatically if the available space is no longer
sufficient and the "Page break" object property is set to "Yes". If you want to
trigger a page break manually, you can do this by means of the context menu.
Select the Pagebreak control character.
Figure 4.12: Context menu for a user defined page break
73
Mastering Appearance Conditions
4.4.6 Adjusting the Position of the Letter Text for Following Pages
Because of the address field, the text starts further down on the first page of a letter.
So that the text begins at the top margin in multiple page mail merge projects, a
condition can be applied to the position (top, height) of the formatted text object with
which the object can be moved upwards and increased in height on following pages.
1.
Select the formatted text object.
2.
Select the "Position.top" property and set the Cond(Page()=1,4.0,2.0) condition.
3.
Select the "Position.height" property and set the Cond(Page()=1,7.0,9.0)
condition.
Figure 4.13: Specifying the position with a formula
4.4.7 Assigning Objects to the Layer
So that the objects for address, company logo and date are only printed on the first
page, you can assign these objects to the corresponding layer.
1.
Hold down the CTRL key and select the objects for the address, company logo
and date.
2.
Right-click to open the context menu and choose "Assign to Layer".
3.
A selection dialog will now appear in which you can select the "First page" layer.
Confirm your selection with OK.
4.
The objects are now assigned to the "First page" layer. This is indicated by the
fact that the objects are shown in the layout preview in green, the color assigned
to this layer.
74
Practice: Create a Mail Merge Project
Figure 4.14: Objects are shown in different colors
5.
The "formatted text" object remains assigned to the base layer so that it will be
printed on all pages.
75
Creating Professional Tables
5. Creating Professional Tables
In this chapter, we will extend the previous examples to include more functions,
output grouped data, use appearance conditions and layers to allow multiple pages
to be output and add more elements to the report container.
5.1 Working with the Report Container
You use the "Report Container" object to add a table. As the name says, a report
container can hold several objects.
Tables, charts, crosstabs and Gantt charts can be added in any order, even as subelements of tables. This lets you define sub-reports with almost any relationships
between tables.
In addition to a report container there can be any number of other report containers
and in addition also separate charts, cross tables or Gantt charts.
Hint: The report container and the possibility to insert separate charts, crosstabs
or Gantt charts is not available in every application. In applications without report
container you can use the "Table" object instead.
5.1.1 Report Container and Object list
You define new elements in the "Objects" tool window along with the hierarchical
structure that you want.
All actions are available in a context menu. There are additional buttons in the
top toolbar for the frequently used actions.
To add a new element to the report container, select the "Append an element" or
the "Append a sub-element" button. Sub-elements are only possible with tables.
All elements are shown here with object type and data source [relation name,
sort name].
The currently selected item will be highlighted in the workspace. By using the
checkboxes in the tool window "Objects", you can toggle the visibility of
elements, sub elements and branches.
Figure 5.1: "Objects" tool window
76
Practice: Defining sub reports correctly
5.1.2 Multiple Report Containers
Using multiple report containers is also supported; for example side-by-side reports
can be created. The data sources of the report containers and their elements can be
different.
Figure 5.2: Side-by-Side report with two report containers
5.2 Practice: Defining sub reports correctly
Let us assume that you want to produce a list of all customers, showing the orders
of the respective customers and all order items.
The data source provides the relationally linked tables Customers > Orders >
Order_Details.
You want the result to look roughly like this:
77
Creating Professional Tables
Figure 5.3: Hierarchical invoice list
To achieve this, proceed as follows:
1.
In Choose Insert > Report Container (Objects > Insert > Report Container).
Figure 5.4: Tab "Insert"
78
Practice: Defining sub reports correctly
2.
In the workspace, hold down the left mouse button and pull the object to the
required size.
3.
A selection dialog will appear for the chosen element type. Choose the "Table"
element type.
Figure 5.5: Choosing the object type
4.
You specify the data source in the following dialog. All available tables are
shown hierarchically, in other words, under the tables, you will find the relational
tables in each case.
Figure 5.6: Choosing the data source
For the list of invoices, you need the following structure: Customers > Orders >
Order_Details.
You have 2 alternative procedures at this point:
a) You select the "Customers" table to first create the "top" table. This
corresponds to a top-down procedure; meaning that you then add the
79
Creating Professional Tables
"Orders" sub-table followed by the "Order details" sub-table by means of the
"Report Structure" tool window.
b) Or you choose the structure that you want right from the start by selecting the
"lowest" table. This corresponds to a bottom-up procedure, meaning that you
create all three tables starting by designing the "lowest" table.
5.
You will be using the second method in this example. Accordingly, you select
the table "Customers > Orders > Order_Details".
6.
A selection wizard will appear with all the fields in the "Order_Details" table.
Figure 5.7: Data Selection Wizard
In this dialog, now choose the columns for this sub-table. For example, doubleclick the "ProductID", "Quantity", "UnitPrice" and "ProductName" fields from the
"Products" table which has a 1:1 relationship. This will add the fields to the
"Columns" area. You can change the order with the arrow button.
7.
All tables will now be displayed in the workspace, the currently selected item
"Order_Details" will be highlighted in the workspace.
The selected fields are displayed in the data line, in other words, the data line
contains the data.
In addition, a header line is automatically produced. Header lines are used
mostly as column titles, i.e. the selected field names are now shown here as
text.
The width of the columns adjusts automatically. You can adjust the width of a
column manually by moving the separating line to the right or the left with the
mouse.
80
Modifying the Fields and Columns
Note: This changes all table columns whose separators are within +/-2 mm
from the mouse position. If you hold down the CTRL key, the action will only
be carried out for the line on which the mouse is positioned. If the option
"Change width individually" is enabled (Table> Lines and Columns or
CTRL+M or project option "Column width modification affects next column"),
you can alter the column width while making the next column smaller.
8.
To define the columns of the "Orders" table, double-click the table in the
"Objects" tool window.
5.3 Modifying the Fields and Columns
There are two possibilities for adding additional columns to tables or for editing and
formatting them in detail.
5.3.1 Table Tools and Mini-toolbar
If you insert a table, the Table Tools and the tab "Table" are displayed. The tab
contains the commands you need for working with table objects. When you have
finished the work on the text object, the Table Tools are hidden.
Optionally, you can activate a mini-toolbar for the tabel-objects (File > Options >
Workspace).
Figure 5.8: The Table Tools
With the Table Tools you can define a new line, insert a new row, move selected
rows/cells to the left/right, borders, apply fonts, font sizes, text colors and formatting
as well as arrange objects.
To select a field, click in the top left corner of the field. Hold Ctrl or Shift to select
multiple fields or a complete range.
To select a complete line, click onto the bar on the left. Hold Ctrl or Shift to
select multiple paragraphs or a complete range.
To select a complete column, hold Alt. Hold Ctrl or Shift to select multiple
columns or a complete range.
5.3.2 Object Dialog
Use the object dialog for more advanced functionalities. You open this dialog via the
corresponding button in the mini-toolbar or by double-clicking the element in the
"Objects" tool window.
81
Creating Professional Tables
Figure 5.9: Object properties dialog for tables
There is a tab for each type of line where you can specify the different definitions and
columns for the respective line. The following types of line are available: header line,
data line, footer line, group header, group footer. A checkmark on the tab indicates
that a line type has one or more line definitions.
Header lines are mostly used as titles for the columns of the table.
Data lines contain the formatting for the actual table rows and the data that is to
be shown in the table.
Footer lines are displayed at the very end of the table and can hold final
information about the data lines that are output above.
Group header and footer lines are used to structure the data lines by means of
"Intermediate headings" and "Intermediate footers".
All line types can be defined independently of one another.
This means that the columns of a header line can have a different appearance as
the data lines or footers that follow.
You can also create different line layouts or line definitions for the individual line
types. It is then possible to activate the different line definitions with special
appearance conditions as required.
5.3.3 Variables-/Field-List and Drag & Drop
The Variables-/Field-List (Project > Variables/Fields) shows all available variables and
fields of the current project. To add more columns to existing rows you can simply
82
Defining Multiple Line Layouts
drag the desired fields from the list onto the corresponding position with the mouse
(drag & drop).
The field can be inserted to the left or right of the corresponding column, a symbol
shows the insert position. The column (standard width 30mm) will be inserted in the
corresponding row. Please note that columns could be created in the non-visible
area.
For numeric fields, a footer line with totals is created automatically. If you hold down
the CTRL key, no footer line will be created.
5.4 Defining Multiple Line Layouts
You can define different layouts for each type of line. Depending on the appearance
conditions, the appropriate layout is used in each case according to the situation. For
example, you can output two table lines for each data record in this way:
Figure 5.10: Two line definitions
Proceed as follows to create table lines in the object dialog.
1.
First select the line type that you want to edit by clicking the relevant tab, e.g.
Data Line.
2.
Now choose "Insert Table Line" in the context menu. Alternatively, you can select
an existing Line definition and then click the "New (Append line definition)"
button.
3.
In the "Choose a Table Line Definition" dialog that follows, you have the option of
using an already existing layout as a template for the new line definition (very
useful if the layout is similar).
83
Creating Professional Tables
starting the data selection wizard (very useful if you want to create several
columns in one operation)
or creating an empty line definition so that you can then add the columns by
means of the object dialog.
Figure 5.11: Choose a Table Line Definition
4.
You have now created the new line. Edit the columns as described in "Defining
Column Contents ". Change the order of the line with the arrow button or with
Drag & Drop.
5.
You can then specify the appearance of the new line as a whole. Various
properties are available for this including:
"Appearance Condition" with which you can specify when the line is to be
printed. This is useful if you define multiple line layouts that are to be printed
depending on certain values. The familiar dialog for defining logical
expressions opens up here.
Example line 1: Subtotal not on last page
Appearance condition: not Lastpage()
Example line 2: Grand total only on last page
Appearance condition: Lastpage()
Name of the line e.g. "data first line". This makes it easier to find the line in
complex layouts.
84
Defining Column Contents
Display in Designer: with this property, you can hide the lines in the
workspace – this is very useful if you have a lot of line definitions.
Spacing (margins): here you define the top, bottom, right and left spacing of
the line. The "top" or "bottom" values cause a corresponding space between
the individual table rows. With the "left" and "right" spacing values, you can
specify the margin in relation to the table object, i.e. you can indent lines or
columns.
The "Default Font" property sets the font for the entire table row. Newly
inserted columns appear initially in this font.
Outline Level (index level) of the bookmark in preview mode or for PDF export.
Also see chapters "Overview of Properties" and "Defining Group Lines".
Figure 5.12: Line properties
5.5 Defining Column Contents
You can define as many columns as you want for each line. You must only make sure
that these columns can be displayed within the width defined for the table.
The individual columns are shown in the object dialog as a tree structure. The
buttons let you edit, delete, cut, copy, insert and move the selected columns. You
can also move columns outside of the line definitions by using Drag & Drop.
Proceed as follows to create new columns in the object dialog:
1.
First select the line in which you want to insert a new column.
85
Creating Professional Tables
2.
Now choose "Append column" in the context menu. (ALT+INS). Alternatively, you
can select an existing Column definition and then click the "New (Append
column)" button or the small downwards arrow next to this button to specify the
type.
3.
Each column has a certain type. Various properties are available for the column
type including: Text, Picture, Barcode, Formatted Text, Form Control, table,
Chart, Checkbox, Data Graphic, Gauge, HTML Text, PDF and OLE container.
When selecting a field, this data type will be set automatically.
4.
To define the contents, the familiar formula wizard will appear in which you can
define the column contents in the form of expressions. You will find more
information about this under "Variables, Fields and Expressions".
5.
Now define the column's properties. Each column in a line can be edited and
formatted separately. Select the column that you want in the tree structure in
the object dialog.
Figure 5.13: Column properties
To select multiple columns, hold down the ALT or the SHIFT key. Various
properties are available including:
Formatting e.g. as number or currency.
Name of the column: this will help you to maintain an overview with complex
expressions. If you change the name directly in the tree structure, your
change will also be applied as "content" where appropriate.
You can specify when this column is to be printed with an "appearance
condition". This is useful if you define multiple columns that are to be printed
86
Defining Group Lines
depending on certain values. The familiar dialog for defining logical
expressions opens up here.
Rotation of the content in increments of 90°.
Background, frame, font, vertical and horizontal alignment.
A fixed height for the field irrespective of the content.
The column width.
Also see chapter "Overview of Properties".
5.6 Defining Group Lines
Group lines are a special type of line. They are used to group together the data lines
that are to be printed.
You can use the "Group by" line property to specify how the data is to be grouped.
This means that the line is printed whenever the result of the expression changes
from one data line to the next. If you don't enter an expression, the line will not be
printed and the property is highlighted in red in the property window.
A group header is printed accordingly before the data line is output, e.g. "Item group
XYZ" group heading.
A group footer appears after the condition of the "Group By" property has changed, in
other words, after outputting the data line. Group footers are suitable e.g. for totals
of data within a group.
In the report container you can also output a group sum in the group header with the
Precalc() function, e.g. Precalc(Sum(Item.UnitPrice, <GroupBy-String>)).
Figure 5.14: Group Headers
87
Creating Professional Tables
Example: Grouping by the first letter of the "Item.No" field.
Figure 5.15: Group lines in an article list
1.
Create a new line definition on the "Group header" tab. Enter the following
expression for the content of the column:
"Main group: ' + Left$ (Item.No,1)"
The result of the expression "Left$ (Item.No,1)" is the first character of the
"Item.No" variable. Whenever the first letter of "Item.No" changes, the text "Main
group: " and the first letter in each case will be printed.
2.
Enter "Left$ (Item.No,1)" as the condition for the "Group By" property.
With each new first letter, a corresponding intermediate header will be printed in
the list.
3.
Multiple line layouts are possible with group headers as well. In this way, you
can produce hierarchically structured intermediate headers. For example, you
can define a line layout that is produced, as in the above example, based on the
first letter of the "Item.No" variable. In addition, you define a second line layout
that produces intermediate headers based on the first three characters of
"Item.No".
4.
Create a new line grouping for the sub-group header in the same way. Enter
"Left$ (Item.No,3)" as the condition for the "Group By" property.
88
Tables in columns (Nested Tables)
Enter the "sub-group" for the content of the column: ' + Left$ (Artikel.Nr,3)":
When the first 3 letters change, a corresponding intermediate header will be
printed in the list.
Along with the properties of the "normal" lines, you also have the following at your
disposal:
Group sums: You can set sum variables to 0 here once they have been output in
order to produce group sums.
Page break before outputting a group header or break after outputting a group
footer.
The option of always displaying the group header additionally at the start of the
table if the group has been separated by a page break.
Also see chapter "Overview of Properties".
5.7 Tables in columns (Nested Tables)
You can output detailed data from a sub-table in a column. For example, if you would
like to output all of a client's orders to the right of a client's name, create a column of
type "Table", and then output the detailed data.
You can edit the properties of the table object by selecting the table. Double-click to
display the familiar table content dialog.
You can also use the action "Attach sub-table" to attach additional tables to this table,
e.g. the sum of the various order items.
Figure 5.16: Outputting (sub-)tables to columns
1.
Create a new element in the report container and select "Table" as the object
type.
2.
In the dialog that now appears, select the data source. For an assessment of the
sales for each client, select e.g. the table "Customers". Select e.g.
"Customer.CompanyName" as the field.
3.
In this data row, now add an additional column and output the data of a 1:Nconcatenated table. Select "Add/attach new column to table row" (ALT+INS) via
89
Creating Professional Tables
the context menu. Alternatively, you may also select an existing column
definition and then click on the small down arrow next to this button to
determine the type of this column.
4.
Select "Table" as column type and then e.g. the column "Orders.OrderID".
Although the data row will not be output (because we will be suppressing it), a
field is required so that the table will be printed at all.
5.
Back in the table dialog, select the table "Orders" and set the table property "Data
rows > Suppress data rows" to "Yes".
Figure 5.17: Suppressing data rows for a table column
6.
Now select "Attach sub-table" via the context menu. Alternatively, you may also
select the table and then click on the small down arrow next to this button to
attach a sub-table.
7.
Select the table "Order Details" as the data source and then the column
"Orders.OrderID" once again. Although the data row will also not be output
(because we will be suppressing it), a field is required so that the table will be
printed at all.
8.
Define the sum of the order items as the footer, i.e. in column 1 the order date
(Orders.OrderDate) and in column 2, the sum of the sales. You can calculate this
by
e.g.
using
the
formula
"Sum(Order_Details.Quantity
*
Order_Details.UnitPrice)". These two columns are then output next to the name
of the client, as the output of each of the data rows is suppressed.
90
Table Layouts
Figure 5.18: Aggregation in the footer
9.
Back in the table dialog, select the table "Order Details" and also set the table
property "Data rows > Suppress data rows" here to "Yes".
10. The assessment is complete; i.e. you will now see the orders next to the client
name, and next to it the sum of the order items (see Figure 5.16).
5.8 Table Layouts
There are various properties and functions which you can use to influence the layout
of a table. Also see chapters "Creating Statistical Reports With Footers", "Drilldown
Reports (Increase Detail Level)", "Page Layout" and "Overview of Properties".
5.8.1 Align Columns
There are various ways of simplifying the use of table objects.
If you hold down the CTRL key when reducing the size of a table, all columns will
be automatically reduced in size by the same factor.
The width of the columns adjusts automatically. You can adjust the width of a
column manually by moving the separating line to the right or the left with the
mouse. This changes all table columns, whose separators are within +/-2 mm
from the mouse position. If you hold down the CTRL key, the action will only be
carried out for the line on which the mouse is positioned. If the option "Change
width individually" is enabled (Table> Lines and Columns or Ctrl+M or project
91
Creating Professional Tables
option "Column width modification affects next column"), you can alter the
column width while making the next column smaller.
If you move the first column separator to the right with the mouse, an empty
column will be created in all line definitions.
Use the function TableWidth() to define the column widths relatively. It returns
the width of the table object. Example: With TableWidth()*30/100 the
Column
takes 30% of the width.
You can hide Line Types (header, data, footer, group lines) in the workspace. To
do this, select the table object and use Visible Line Types in the context menu or
the corresponding menu item View> Visible Line Types.
To align (sub) tables easier with one another, additional tick marks can be shown
on the ruler by means of an element property.
Figure 5.19: Tooltip for a column separator
5.8.2 Fixed Size
The "Fixed Size" property lets you specify that the size of the table is not to be
adjusted automatically when fewer data lines are printed than the available space in
the table object.
This property is useful to ensure that footers are always printed at the bottom of the
page, e.g. if the page number is output in the footer. If the property is disabled, the
end of the table automatically moves upwards (and the footer therefore also).
5.8.3 Printing Header Lines and Footer Lines Again
If the print of a table is continued on the following page, the header lines of this table
and the outer table will be printed again. To suppress repeated printing of the header
lines on the following page, use the FirstHeaderThisTable() function as an
appearance condition.
This functionality is also available for footer lines, here you use the
LastFooterThisTable() function as the appearance condition. This ensures that footer
lines are only output on the last page of the table in the event that the print is
continued on the following page due to lack of space.
You will find more information about this in the chapter "Overview of Functions".
92
Table Layouts
5.8.4 Defining the Size of the Table Variably
You can define the height and width of the report containers variably to avoid data
being truncated when the page format is changed (e.g. from portrait to landscape).
To do this, select the report container in the "Objects" tool window and use the
LL.Device.Page variables and the UnitFromSCM() function to specify the height and
width.
Figure 5.20: Size of the report container defined variably
5.8.5 Forcing a New Page
With complex projects containing hierarchical tables, it is sometimes wise to create a
page break before outputting a line of the "top" table.
Alternatively, you may want to have a new page if, after outputting a data line of the
"top" table, there is not enough room for the following data lines of the sub-table.
You can handle both cases with the "Pagebreak Condition" property.
For example, in the case of a hierarchical table, in order to output each data line of
the main table on a new page, select the main table in the "Objects" tool window and
set the "Pagebreak Condition" property to True.
93
Creating Professional Tables
Figure 5.21: Active page break condition
5.8.6 Creating a Conditional Page Break
Let’s assume that you want to create a continuous table. However, you want to avoid
printing data lines from the main table at the bottom of the table unless there is
enough room for at least 3 data lines from the sub-table.
You do not want it to look like this:
94
Table Layouts
Figure 5.22: Data lines from the main table without following line
You can avoid this by means of the RemainingTableSpace() function. This function
returns a value showing the available space. If you set the parameter to "True", the
value will be returned as 1/1000 mm.
If you want to specify that a new page should be started before outputting the data
line of the main table if the space remaining is less than 3 cm, enter the following
formula for the "Pagebreak Condition" property:
RemainingTableSpace(True)<30000
5.8.7 Keeping Lines Together
If the print of a table is continued on the following page due to lack of space, you can
decide whether the lines are to be separated or kept together if possible.
95
Creating Professional Tables
This option is useful for multi-line data lines or for invoice footer lines containing
totals. You can use this option with data lines, footer lines, group footers and group
headers
5.8.8 Defining Totals and Counters
You define totals and counters with sum variables or the corresponding aggregate
functions. You will find more information about this in chapters "Using Functions",
"Overview of Functions" and "Sum Variables".
5.8.9 Outputting Free Content Before and After a Table
You can output free text before and after a table. To do this, use the RTF object and
link the object to the project as free text via the report container.
Produce a first page with a covering letter for the invoice that we created in Chapter
"Creating a Simple Invoice" and an enclosure with the General Terms and Conditions.
1.
To add a new element to the report container, select the "Append an element" or
the "Append a sub-element" button in the "Objects" tool window.
2.
A selection dialog will appear for the chosen object type. Choose the "Table"
object type.
3.
In the following dialog, select "Free content" as the data source.
Figure 5.23: Add free content to the report container
4.
96
Then add a column via the properties dialog for the table object. In our case, we
want to create the covering letter as formatted text. Therefore, click the small
arrow on the right of the button and choose the Formatted Text option.
Table Layouts
Figure 5.24: Specifying formatted text for the content of the column
5.
A dialog appears where you can type in the covering letter in the form of
continuous text. You will find detailed instructions for working with formatted
text in Chapter "Practice: Create a Mail Merge Project".
6.
Please don't forget to remove the (column) frame for free content. The best way
is to remove the frame via the "Default Frame" property in the element
properties.
7.
You may also have to change the layer condition as the covering letter will now
be output on the first page.
8.
If the General Terms and Conditions are also to be output at the end of the
invoice, you must add another free content object to the container after the item
table. Then you have several options:
a)
Use the Formatted Text object here as well.
b)
Use the PDF object and include the General Terms and Conditions in PDF
format.
c)
Use the LoadFile$() function to load a linked file and enter the path of the file
as the parameter as follows LoadFile$ (ProjectPath$()+"\gtc.txt").
d)
For the issue on a reverse side, see "Reverse Side" in Chapter "Report
Sections".
5.8.10 Anchored Lines (Overlapping Cells)
Let us assume that you want to output the contents of a column across two lines.
You can achieve this by anchoring two lines to each other via the line property
"Anchor to row" (Index (1-based) of the row; 0=no anchoring). So the beginning of
97
Creating Professional Tables
the next line definition will be forced to the beginning or the end of another line
definition. Hence the cells can overlap.
Note: This function is not supported by all export formats.
Figure 5.25: Anchor data lines
Let’s assume that you want to create 2 lines next to an image column:
1.
Define in the first line with 3 columns: "Item.No" (column width 1), empty
content, a space (column width 1), "Item.Description" (column width 3).
2.
Define in the second line with 2 columns: empty content, "Item.Picture" (both
column width 1).
In the line properties set "Anchor to Row" to "1" to anchor this line to the first line
definition.
3.
Define the third line also with 2 columns: empty content (column width 2),
"Item.Description2" (column width 3).
4.
Thus, the second line is printed in the same starting position as the first line and
the cells may overlap:
98
Table Layouts
Figure 5.26: Column contents across two lines
5.8.11 Expandable Regions
When you activate the property "Expandable Region", the sub-elements of an
element are not printed into the preview at first during printing, and a drop-down
symbol will be displayed on the line itself. To be able to use this feature, defined data
lines are required.
Figure 5.27: Expandable Regions
99
Creating Professional Tables
Clicking on the symbol expands the region for the corresponding line, providing a
drill-down option without having to leave the current preview, and without having to
design a separate project.
Using the context menu of this drop-down symbol, you can collapse or expand all
entries of a layer or expand all details of an entry.
5.9 Sort Orders in the preview
You can configure header fields such that you will be able to change the sort order of
the data in the preview by clicking on the corresponding field. This will allow you to
e.g. quickly list customers from A to Z.
To do so, proceed as follows:
1.
In a customer list, the corresponding desired sort orders for the header fields are
defined via the properties "Sort Orders> Ascending" and "Sort Orders >
Descending".
Figure 5.28: Sort Orders for Header Fields
2.
100
Small symbols then appear next to the headers in the preview window which
allow the sort order to be changed. Clicking on the country causes the
customers to be sorted accordingly.
Sort Orders in the preview
Figure 5.29: List of customers with Sort Orders in the Preview
101
Producing Analyses
6. Producing Analyses
You can make use of charts, gauges, crosstabs, footer lines in tables or drilldown
reports to analyze your data.
6.1 Creating Charts
This object is used to evaluate and display data graphically in diagrams. This gives
you an overview of your data and lets you recognize anomalies immediately.
For example, you can analyze sales trends, illustrate percentage shares and show
data in multiple dimensions. You have a wide range of different types of diagrams at
your disposal:
Circle/Donut chart
Bar/Ribbon chart (also displayed as cylinders, pyramids, cones, octahedrons)
Simple (e.g. sales per customer)
Multi-row (e.g. sales to various customers over the years, scaled by customer)
Clustered (e.g. sales to various customers over the years, grouped by year)
Stacked (e.g. percentage of sales to various customers stacked over the
years)
100% stacked (e.g. respective sales percentages for various customers over
the years)
Line/Symbol: Simple, Multi-row, Stacked, 100% stacked
Area: Simple, Stacked, 100% Stacked
Bubbles/Dots: Distributed, Sorted (Displayed as circle, drop or picture file)
Funnel/Pipeline
Map/Shapefile
Various LL.ChartObject-fields are available for diagrams. You will find more
information about this in the chapter "Overview of Fields".
6.1.1 Inserting a Chart Object
There are various ways of outputting chart objects:
1.
102
A chart as an element in the report container. Add the object via the "Objects"
tool window. If you have not yet added a report container to the workspace,
select Insert > Report Container (Objects > Insert > Report Container) and pull
the object to the right size in the workspace while holding down the left mouse
button. A selection dialog will appear for the chosen element type. Choose the
"Chart" element type.
Creating Charts
2.
You can output charts and gauges in a table cell. To do this, select the relevant
entry from the menu in the object dialog for the table. If you want to output the
aggregated data, a good way of doing this is to use a footer line.
Figure 6.1: Chart object in a footer line
3.
In the following dialog, now select the data source. All available tables are
shown hierarchically, in other words, under the tables you will find the relational
tables in each case.
To evaluate sales per country, for example, choose the "Customers > Orders >
Order Details" table in the Sample Application so that you have all three tables at
your disposal. The "Customers" table contains the country, the "Orders" table the
order date and the "Order_Details" table the sales.
4.
The chart object dialog is displayed. In the drop down lists in the top left you can
select the base type and the corresponding sub type.
5.
The axes are defined in the tabs (Category Axis, Series Axis, Value Axis, Data
Source, Segment, Funnel Segment, Shapefile Selection). You can click directly
into the live preview (e.g. onto the title or axis label) to quickly jump to the
corresponding property.
103
Producing Analyses
Figure 6.2: Chart object dialog
6.
On the "Diagram" tab, select the general diagram options (e.g. perspective, color
mode). Also see chapter "Overview of Properties".
7.
On the "Object" tab, select the general layout options for the entire chart object
(e.g. Title, Background). Also see chapter "Overview of Properties".
8.
On the "Colors" tab, you can specify the colors for the display:
Design Scheme: Specifies the colors and color sequences for the data rows
that are not specified by the "Fixed Colors". You can select a predefined color
set from the drop down list. These colors can still be adjusted in the
properties.
Fixed Colors: You can assign fixed colors to particular axis values. If you click
the "New" button, you can create a new assignment e.g. Customers.Country
= "Germany".
6.1.2 Pie, Donut or Circle Chart
Let's assume that you want to evaluate the sales per country. The pie chart is the
right choice for this. It lets you read off the percentages immediately. Proceed as
follows in the Sample Application:
104
Creating Charts
1.
As the data source, select the "Customers > Orders > Order_Details" table.
2.
For the diagram type, choose Circle/Donut > Pie.
3.
You should first specify the coordinate values for the data source, i.e. the values
that define the individual segments, e.g. Customers.Country.
Figure 6.3: Definition of the data source in the object dialog
4.
Switch to the "Segment" tab to specify the coordinate values for size of the
segment, i.e. the sales. Double-click the "Coordinate Value" property.
Now select the aggregate function that you want for the contents in the
"Coordinate Value" dialog that follows. You want to create a sales evaluation so
choose the "Sum" function.
Figure 6.4: Wizard for creating the coordinate value formula
5.
In the upper part of the dialog, you can specify the contents by clicking the
formula button to start the formula wizard. In the Sample Application, the sales
per order value is not supplied directly as a field so you must calculate it using
the "Order_Details.Quantity * Order_Details.UnitPrice" formula.
105
Producing Analyses
6.
The "Label on Object" property is already set to "Yes" so that a label with the
percentage value is shown on the segments. Define the value as "percent"
without decimal places by means of the "Format" property.
Figure 6.5: Definition of the segment in the pie chart object
7.
The "Explosion Offset" property lets you specify a distance to the center for the
segment. With the "ArcIndex" chart field, which numbers the segments
according to their size, you can even display the largest segment with a greater
offset. Example:
Cond (LL.ChartObject.ArcIndex=1,20,10)
8.
On the "Diagram" tab, select the general diagram options. Various properties are
available including:
The degree of perspective, e.g. strong.
The color mode, e.g. single color
Also see chapter "Overview of Properties".
9.
On the "Diagram Area" tab, select the general layout options for the entire chart
object. Various properties are available for this including:
Title
Background including filling, border and shadow, e.g. border = transparent
Also see chapter "Overview of Properties".
10. On the "Colors" tab, you can specify the colors for the display:
Design Scheme: Specifies the colors and color sequences for the data rows
that are not specified by the "Fixed Colors". You can select a predefined color
set from the drop down list. These colors can still be adjusted in the
properties.
Fixed Colors: You can assign fixed colors to particular axis values. If you click
the "New" button, you can create a new assignment e.g. Customers.Country
= "Germany".
11. The pie chart now looks like this:
106
Creating Charts
Figure 6.6: Pie chart
6.1.3 Multi-Row Bar Chart
Let's assume that you want to evaluate the sales for various countries over the years,
scaled by country. A multi row bar chart is perfect for this. You get a diagram in
which you can see the turnover achieved in the respective country for each quarter.
Proceed as follows in the Sample Application:
1.
As the data source, select the "Customers > Orders > Order_Details" table.
2.
Choose Bar/Ribbon > Multi-Row (3D) as the diagram type.
3.
First specify the coordinate value for the category axis, i.e. the value of the xaxis. Select the "Customers.Country" field via the formula wizard.
Figure 6.7: Definition of the category axis
4.
Now specify the coordinate value for the series axis, i.e. the value of the y-axis.
In the Sample Application, the order year is not supplied directly as a field so you
must calculate it using the "Year$(Orders.OrderDate)" formula.
107
Producing Analyses
If you want to evaluate the data by year, simply enter "Year$(Orders.OrderDate)"
as the coordinate value. Type "Year" as the text for the "Axis Label".
Figure 6.8: Definition of the series axis
5.
Now specify the coordinate values for the value axis (z-axis), i.e. the height of the
bars representing the turnover. Double-click the "Coordinate Value" property.
Now select the aggregate function that you want for the contents in the
"Coordinate Value" dialog that follows. You want to create a sales evaluation so
choose the "Sum" function.
6.
In the upper part of the dialog, you can specify the contents by clicking the
formula button to invoke the formula wizard. In the Sample Application, the sales
per order value is not supplied directly as a field so you must calculate it using
the "Order_Details.Quantity * Order_Details.UnitPrice" formula.
Figure 6.9: Definition of the value axis
7.
Various other properties are available on this tab including the following layout
options:
Maximum Value Automatic: You can limit the height of the displayed area,
e.g. to cater for "anomalies".
Presentation: The data can be presented in various ways: cylinders, bars,
pyramids, ribbons, octahedrons, cones
Thickness of the bars
Zebra mode for the background
108
Creating Charts
Also see chapter "Overview of Properties".
8.
On the "Diagram" tab, select the general diagram options. Various properties are
available including:
The Projection, e.g. flat.
Color Mode: Specifies which axis determines the color, e.g. the y-axis values.
Also see chapter "Overview of Properties".
Figure 6.10: Definition of the diagram options
9.
On the "Diagram Area" tab, select the general layout options for the entire
diagram. Various properties are available for this including:
Title
Background including filling, border and shadow, e.g. border = transparent
Also see chapter "Overview of Properties".
10. The multi-row bar chart now looks like this:
Figure 6.11: Multi row bar chart
109
Producing Analyses
6.1.4 100% Stacked Bar Chart
The pie chart in the first example gave you an overview of the percentages for the
entire evaluation period. But in order to be able to recognize trends, it would be good
to see how the percentages have changed during the course of the evaluation
period. The 100% stacked bar chart can be used for precisely these types of
applications. The respective percentage of the length of the bars relates directly to
the turnover percentage of the respective country.
Proceed as follows in the Sample Application:
1.
As the data source, select the "Customers > Orders > Order_Details" table.
2.
Choose Bar/Ribbon > 100% stacked as the diagram type.
3.
First specify the coordinate values for the category axis, i.e. the values of the xaxis. Select the "Customers.Country" field via the formula wizard.
4.
Now specify the coordinate values for the series axis, i.e. the values of the yaxis. In the Sample Application, the order year is not supplied directly as a field
so you must calculate it using the "Year$(Orders.OrderDate)" formula.
5.
Specify the coordinate values for the value axis (z-axis), i.e. calculate the turnover
with "Sum(Order_Details.Quantity * Order_Details.UnitPrice)".
6.
On the "Diagram" tab, choose "Left to Right" for the "Alignment" to create a
horizontal diagram.
7.
The multi-row bar chart now looks like this:
Figure 6.12: 100% Stacked bar chart
6.1.5 Multi-Row Line Chart
A line diagram offers an alternative to a multi-row bar chart. You can read off the
values faster here.
110
Creating Charts
Figure 6.13: Multi-row line chart
Proceed as follows in the Sample Application:
1.
As the data source, select the "Customers > Orders > Order_Details" table.
2.
Choose Line/Symbol > Multi-Row as the diagram type.
3.
First specify the coordinate value for the category axis.
"Orders.OrderDate" field via the formula wizard.
4.
Select the property "Coordinate Label > Format" and select "%q/%y" in the Datesection (user-defined).
5.
Now specify the coordinate value for the series axis. Select the "CategoryName"
field via the formula wizard.
6.
Specify the coordinate values for the value axis and calculate the turnover with
the "Sum(Order_Details.Quantity * Order_Details.UnitPrice)" formula.
Select the
6.1.6 Stacked Area Chart
The stacked area chart is available as an alternative to the multi row line chart. This
chart allows you to compare statistical relationships more swiftly as the areas
between the lines are colored in.
111
Producing Analyses
Figure 6.14: Stacked area chart
Proceed as follows in the Sample Application
1.
Select the "Customers > Orders > Order Details" table as the data source.
2.
Select Area > Stacked as the chart type
3.
First specify the coordinate value for the category axis. Select the
"CategoryName" field via the formula wizard.
4.
Specify the coordinate values for the series axis. In the Sample Application, the
order year is not supplied directly as a field, so you must calculate it using the
"Year$(Orders.OrderDate)" formula.
5.
Specify the coordinate values for the value axis (z-axis), i.e. calculate the turnover
with the "Sum(Order_Details.Quantity * Order_Details.UnitPrice)" formula.
6.1.7 Distributed Bubble Chart
Bubble charts allow for a four-dimensional representation of statistics in that, along
with the position on the y and x axes, the color and the size can be defined by
statistical information. Diverse options are available regarding how you would like the
bubbles to be displayed.
112
Creating Charts
Figure 6.15: Distributed bubble chart
Proceed as follows in the Sample Application
1.
Select the "Customers > Orders > Order Details" table as the data source.
2.
Select Bubbles/Dots > Distributed as the chart type
3.
First specify the coordinate value for the category axis.
"Customers.Country" field via the formula wizard.
4.
Specify the coordinate values for the series axis. In the Sample Application, the
order year is not supplied directly as a field so you must calculate it using the
"Year$(Orders.OrderDate" formula.
5.
Specify the coordinate value for the value axis and the value for the Bubble Size
and calculate for both the turnover with the "Sum(Order_Details.Quantity *
Order_Details.UnitPrice)" formula.
6.
Under this tab you will also find the options for how you would like the bubbles
to appear. Please also refer to the "Overview of Properties" chapter.
Select the
6.1.8 Funnel
With a funnel or a pipeline, you can e.g. display your sales processes in the various
phases. There are a variety of options for the way the data is presented.
To do so, proceed as follows:
1.
Select the appropriate data source.
2.
As the diagram type, select Funnel > Vertical Funnel.
3.
First of all, define the coordinate value of the data source, i.e. the value that will
define the individual funnel segments (the sales phase).
113
Producing Analyses
4.
Switch to the tab "Funnel Segment" to define the coordinate value for the size of
the funnel segment (number of sales opportunities). Double-click on the
"Coordinate Value" property. Now, in the subsequent dialog "Coordinate Value",
select the desired aggregating function "Count" for the content.
5.
For the labeling of the funnel segments with percentage values, the option
"Label on Object" has already been set to "Yes". Then, via the property "Format",
define the value as "Percentage (Without Decimal Places)" or as "Absolute Value".
6.
You can enter an offset for the funnel values via the property "Explosion Offset".
7.
In the "Chart" tab, select the general diagram options. The following properties
are available (among others):
▪
8.
▪ Color Mode, e.g. monochrome
In the "Chart" tab, select the general layout options of the entire object. The
following properties are available (among others):
▪
9.
Relative Width of Funnel End/Start.
Title
▪ Background incl. filling, border and shadow, e.g. border = transparent
In the "Colors" tab, you can configure the color options.
Figure 6.16: Funnel chart
114
Creating Charts
Figure 6.17: Vertical Funnel chart (Pipeline)
6.1.9 Map/Shapefile
Shapefiles enable a diverse range of visualization options via a standardized vector
description format. Via corresponding templates, a wide range of maps, seating
charts or floor plans can be generated. The Shapefile determines the shape, and an
associated attribute database enables the shapes to be referenced to the properties
(e.g. country names).
Tip: The availability of this chart depends on the application.
Example: A visualization of the temperature distribution of the earth is to be
generated.
Figure 6.18: Example of a map
115
Producing Analyses
To do so, proceed as follows:
1.
Select the table "ClimateData" as the data source.
2.
As the diagram type, select Map/Shapefile. At this point, a selection dialog
appears for the Shapefile templates provided with the software. Select "World
With Seas and Lakes".
Figure 6.19: Template Selection
3.
116
You will now see the preconfigured data Shapefile in the tab "Shapefile
Selection". In addition to the data itself, you can also select foreground and
background Shapefiles in order to e.g. display the oceans in the background and
the rivers and lakes in the foreground.
Creating Charts
Figure 6.20: Shapefile Selection
4.
Click on the "Assignment" tab in order to link the data with the shapes.
Figure 6.21: Assignment
Link the coordinate value "ISO_CODES" from the data with the attribute "iso_a3"
from the Shapefile. By doing this, the data that is related to e.g. "USA" is linked
to the outline of "USA"; the temperature from "United States of America" is linked
to "United States of America", and so on.
117
Producing Analyses
5.
Go to the tab "Value" and select the mean temperature as the "Value", i.e. the
field "ClimateData.Tmean".
6.
Go to the tab "Colors" to define the legend. As the first entry, define the color via
the function HeatmapColor(LL.ChartObject.AxisCoordinate,-20,40) and set the
condition to "True". The value will then be used for the actual color fill, and you
will obtain a continuous fill color.
7.
For the other discrete legend values, enter the corresponding functions, e.g.
HeatmapColor(5,-20,40) with the legend text "5°" and set their condition to
"False". This means that the value will only be used for the legend.
Figure 6.22: Colors and Legend
6.1.10 Using Series to Determine the Values
With three-axis diagrams, you can also determine the values of the series axis (y-axis)
by means of rows. This means that you define the different rows (e.g. measured
value/target value/actual value) with a single data record and can show them parallel
e.g. in a bar chart.
As an example, we will create a diagram which shows the currency percentages of
the 3 economic areas. Data for APAC, EMEA and NAFTA is supplied as rows.
118
Creating Charts
Figure 6.23: Example of a diagram using rows
Proceed as follows in the Sample Application:
1.
Select the "Sales" table as the data source.
2.
Choose Bar/Ribbon > 100% stacked as the diagram type.
3.
First specify the coordinate values for the category axis, i.e. the values of the xaxis. Select the "Sales.Year" field with the formula wizard. Remove the 2 decimal
places using the "Str$(Sales.Year,0,0)" formula.
4.
Now specify the coordinate values for the series axis, i.e. the values of the yaxis. Select the "Use rows as data source" entry from the drop-down list above
the properties.
Figure 6.24: Option for using rows to determine the value
This option changes the properties of the series axis and displays a dialog for
defining the rows when you click the "Row Definitions" property. Create the
119
Producing Analyses
individual rows choosing "Sales.APAC", "Sales.EMEA" or "Sales.NAFTA" in each
case as the coordinate value.
Figure 6.25: Row definitions dialog
6.1.11 Mixing Chart Types
You can mix bar charts with line charts. In addition to the ability to display another
data series as a line at the same time as the bar chart, you may also make use of the
calculation options such as moving averages and aggregation options. This will allow
you to see total turnover, trends in the data, or outliers (both upwards and
downwards) at a glance.
Example: Combining a straight line mean with a bar chart (turnover for each country)
1.
Select the table "Customers > Orders > Order Details" as the data source.
2.
As the diagram type, select Bar/Ribbon > Clustered
3.
First, define the coordinate value of the category axis. Use the formula assistant
to select the field "Customers.Country".
Now define the coordinate value of the series axis. Use the combo box above the
property list to select the entry "Use series to determine the values".
120
Creating Charts
Figure 6.26: Define Series to determine the values
By doing this, the properties of the series axes change and a dialog appears for
the property "Series Definitions" for the definition of the series.
4.
Define a new series "Single Turnover" and calculate the turnover using the
formula "Sum(Order_Details.Quantity * Order_Details.UnitPrice)" with the
calculation type "normal" and display type "Cylinder".
5.
Define another series named "Mean" and calculate the turnover using the
formula "Sum(Order_Details.Quantity * Order_Details.UnitPrice)" with the
calculation type "Average" and display type "Line".
Figure 6.27: Series definitions dialog
6.
The result is a turnover analysis with a mean line.
121
Producing Analyses
Figure 6.28: Average line
7.
When using the calculation type "Line of best fit", a trend line will be displayed:
Figure 6.29: Line of best fit
6.2 Creating a Checkbox
Checkboxes are a good way of presenting boolean values. Let's assume you want to
visualize the availability of a product or the result of any other condition (true, false),
then you can realize that with a checkbox. A selection of several different pictures is
available; your own files can be used as well.
122
Creating a Checkbox
Figure 6.30: Checkbox object for presenting true/false.
6.2.1 Inserting a Checkbox
There are various ways of outputting checkboxes:
1.
A checkbox as an object. Select Insert > Checkbox (Objects > Insert >
Checkbox) and pull the object to the right size in the workspace while holding
down the left mouse button.
2.
You can output Checkboxes in a table cell. To do this, select the "Checkbox"
entry from the menu in the tables object dialog. If you want to output
aggregated data, use the output in a footer line.
Figure 6.31: Checkbox object in a table cell
6.2.2 Specify Properties
1.
In the content property, enter the field or formula that defines the appearance of
the checkbox.
123
Producing Analyses
2.
Select the picture for 'True', i.e. if the calculation of the content formula returns
'true'. Select one of the internal pictures or select an external picture. You can
adjust the frame and icon color of the internal pictures.
3.
Now select the picture for 'False' and 'NULL'.
Please also refer to the chapter titled "Overview of Properties".
6.3 Creating a Data Graphic
Assuming you have a collated data series detailing the sales figures of your products
over the period of a year in the form of a table, you may now want to integrate the
associated chart next to it without wasting space. Or you may want to display the
customer rating of a product as a symbol. A data graphic can do this for you. These
simple charts display entire information series or actual values in a single cell. This
allows you to get a quick overview of the development of your data. You can select
from bar graphs and symbols (e.g. arrows, stars, traffic lights).
Figure 6.32: Data graphic with symbols
Figure 6.33: Data graphic with bars
6.3.1 Inserting a Data graphic
There are diverse options for displaying data graphics:
1.
A data graphic as an object. Select Insert > Data Graphic (Objects > Insert >
Data Graphic) and enlarge it to the desired size in the workspace by holding the
left mouse button.
2.
A data graphic can be displayed in a table column. For this option, select the
"Data Graphic" item in the table object dialog box in the context menu. If you
want to represent aggregated data there is the option of displaying the data
graphic as a footer line.
124
Creating a Data Graphic
Figure 6.34: Data graphic in a table column
6.3.2 General
Under the "General" tab, you can now specify the value you would like to display in
the data graphic. This determines the bar length and the symbol display.
The minimum and maximum value relates to the upper and lower limits of the
representation, i.e. the minimal value is 0% in the case of percent scaling and the
maximum value is 100% in the case of percent scaling. The scaling is specified in the
respective "Sections" setting.
Figure 6.35: Value of the Data Graphic
6.3.3 Define Bar
Under the "Bar" tab you can define a bar graphic. You can choose from options such
as:
Alignment: If you select "originating from the baseline to the left or the right", a
base value can be given, on which the display of the bar to the left or the right
will depend. The Precalc()- function could be useful here.
Rounding, Bar Height
125
Producing Analyses
Sections: Define various sections in the start and end value in order to assign
colors to the partitions.
Please also refer to the chapter titled "Overview of Properties".
Figure 6.36: Value of the Data Graphic
6.3.4 Define Symbol
You can define symbols under the "Symbol" tab. Various properties are available for
this including:
You can choose from diverse symbol groups such as stars, arrows, traffic lights
and bar charts.
Symbol height
Sections: You can use the start and end value to define specific areas and
assign each group with the symbol that you would like to represent it.
Please also refer to the Chapter titled "Overview of Properties".
Figure 6.37: Value of the Data Graphic
6.4 Creating Gauges
Gauges are a good way of presenting actual values.
Let's assume that you want to output the current turnover in relation to the target
value. A gauge is the right choice for this. It provides you with the value at a glance.
126
Creating Gauges
6.4.1 Inserting a Gauge
There are various ways of outputting gauges:
1.
A gauge as an object. Select Insert > Gauge (Objects > Insert > Gauge) and pull
the object to the right size in the workspace while holding down the left mouse
button.
2.
You can output gauges in a table cell. To do this, select the "Gauge" entry from
the menu in the tables object dialog. If you want to output the aggregated data,
use the output in a footer line.
Figure 6.38: Gauge object
6.4.2 Specify Properties
1.
Choose the type, form, shadow and pointer properties for the gauge using the
drop-down lists.
2.
The "Value" property lets you determine the value that the pointer is to display,
e.g. the customer's turnover or rating.
3.
You can also make use of various other layout options including:
Appearance: Filling, pointer options, glass properties.
Lettering: Rotation angle, white space before and after the scale range,
tickmarks, scale labels, signal ranges, text fields
Values: Minimum and maximum vales of the scale
Also see the chapter "Overview of Properties".
127
Producing Analyses
Figure 6.39: Gauge properties
4.
Indicate the optimal area, e.g., by specifying the color of the signal range.
Figure 6.40: Gauge with colored signal ranges
To do this, set the "Signal Ranges" property to "Show" and click the "..." button to
open the dialog for defining the regions. In this dialog, click the "New" button to
create the respective ranges with start and end values and assign the colors that
you want.
128
Creating Gauges
Figure 6.41: Signal range definition dialog
5.
You can also define text areas in the same way, i.e. you can output text to any
position, as you wish.
Figure 6.42: Gauge with text area
To do this, set the "Labels" property to "Show" and click the "..." button to open
the dialog for defining the regions. In this dialog, click the "New" button to create
the respective ranges with position, rotation, frame size, background, font and
formatting. You specify the position in relation to the area of the gauge
(measured from left to right). For example, a vertical and horizontal position of
50% each positions the label precisely in the middle.
129
Producing Analyses
Figure 6.43: Text label definition dialog
6.5 Creating a Crosstab
Crosstabs are used for evaluating and presenting data in multiple dimensions.
Crosstabs (or contingency tables) are tables containing information about the
frequency of the occurrence of combinations of certain characteristics.
These frequencies are extended by their marginal totals which form "contingencies."
With a three-dimensional crosstab, (three characteristics), the table includes an
additional column grouping.
For example, you can examine turnover trends per year and region, evaluating sales
according to quantities and customers, and create marginal totals for quarters and
years.
A normal ("flat") table has the attribute names in the first row and the occurrences of
these attributes in all other rows. A crosstab is different. The titles of both columns
and rows receive characteristic occurrences and, at the point of intersection of the
respective column and row, a value is shown that depends on the characteristics
specified for the column and row in each case.
130
Creating a Crosstab
Figure 6.44: Example of a three-dimensional crosstab
For the schematic presentation of two-dimensional crosstabs, the 3D multi-row bar
chart is the best choice. You can find more information about this in chapter
"Creating Charts".
6.5.1 Creating a Crosstab Object
Let's assume that you want to examine the development of turnover per year, quarter
and country. Proceed as follows in the Sample Application:
1.
Crosstabs are elements in the report container. Therefore, you add these objects
in the "Objects" tool window. If you have not yet added a report container to the
workspace, select Insert > Report Container (Objects > Insert > Report
Container) and pull the object to the right size in the workspace while holding
down the left mouse button.
2.
A selection dialog will appear for the chosen element type. Choose the
"Crosstab" element type.
3.
In the following dialog, now select the data source. All available tables are
shown hierarchically, in other words, under the tables you will find the related
tables in each case.
For our turnover analysis, e.g. choose the "Customers > Orders > Order Details"
table so that you have all three tables at your disposal. The "Customers" table
contains the country, the "Orders" table the order date and the "Order Details"
table the turnover.
4.
A wizard appears which will lead you through the 3 configuration dialogs for
crosstabs.
6.5.2 Defining Groupings
In the wizard's first dialog, or alternatively on the "Axis Definition" tab, you first define
the grouping for the rows and columns, i.e. the characteristics.
1.
In the "Rows" pane, click on the "Insert a row grouping" button.
2.
In the formula wizard, you now enter the field or the expression for the row
grouping e.g. Customers.Country. You have now created a row grouping and the
data will be grouped by this characteristic.
3.
In the "Columns" pane, click on the "Insert a column grouping" button.
131
Producing Analyses
4.
In the formula wizard, you now enter the field or the expression for the column
grouping.
5.
Since you first want to group the data by year, you must enter an expression
here that returns the year of the order date. You have the Year() function in the
formula wizard at your disposal; i.e. you select this function from the list and
insert the order date as the parameter by double-clicking. The formula looks like
this: Year(Orders.OrderDate).
6.
Since we also want to examine the data at another level, insert an additional
column grouping via the "Insert a column grouping" button.
7.
Now enter an expression to return the quarter of the order date. You can use the
Quarter() function in the formula wizard for this. The formula then looks like this:
Quarter(Orders.OrderDate).
Note: You can change the order of the groupings with the arrow button. The
column at the bottom is the inner grouping.
To swap lines and rows (Pivot function) use the button on the lower right on
the "Axis Definition" tab. This button is only available in the object dialog, not in
the wizard.
Figure 6.45:Swap all rows and lines
8.
You have now created the groupings and you can go on to define the value for
the intersection of the respective columns and rows. Click on the "Edit group
result formula" button located under "Value of the result cells".
9.
Now select the aggregate function that you want for the contents in the "Cell
Contents" dialog that appears. You want to create a sales evaluation so choose
the "Sum" function. In the upper part of the dialog, you can specify the contents
by clicking the formula button to start the formula wizard.
10. In the Sample Application, the sales per order value is not supplied directly as a
field so you must calculate it using the "Sum(Order_Details.Quantity *
Order_Details.UnitPrice)" formula.
132
Creating a Crosstab
Figure 6.46: Definition of the axes of a three-dimensional crosstab
6.5.3 Defining Cell Properties
In the wizard's second dialog or, alternatively, on the "Cell Definition" tab, you edit the
properties of the different cells.
You can select the cells directly in the drawing in the upper pane of the dialog and
then edit their properties. To select multiple cells, hold down the CTRL key or you can
draw a border around the cells with the mouse.
1.
Let's assume that the countries shouldn't be listed alphabetically but descending
by turnover. Select the corresponding line header (here: Germany) and select the
value "Result Descending" in the property "Sort Order" then. In combination with
the property "Limit To" you will get a Top-N analysis by that.
2.
Assuming that you want to prefix the number of the quarter with a "Q" as the title
of a column. Select the respective column title and then double-click on the
"Displayed Contents" property.
With this property, you can now specify the text that is to be displayed in this
cell (independent of the value that you have defined for this column grouping).
Now define either a suitable formula, e.g. "Q" + Str$(Quarter(Orders.OrderDate))
in the formula wizard
3.
Alternatively use the "Format" property. Then remove the "Quarter$()" here, i.e.
only the date field remains in the field, and format the value by means of the
property.
133
Producing Analyses
Figure 6.47: Cell definition for the crosstab
To do this, click the "Formatting" property, choose "Date" as the formatting type,
and finally select the "User-defined" entry from the drop-down list. At the end of
the list you will find an example for formatting a quarter plus the number of the
year. Since we don't need the number of the year, shorten the formula's string to
"Q%q".
Figure 6.48: Formatting for date values
134
Creating a Crosstab
4.
This cell is now formatted and you can go on to format all other cells in the same
way. Various properties are available including:
Rotation of the content in increments of 90°
Background
Frame
Font
Vertical and horizontal alignment
Maximum width, minimum width and minimum height
Also see chapter "Overview of Properties".
6.5.4 The Layout Option and Wrapping Behavior
In the wizard's third dialog or, alternatively, on the "Properties" tab, you edit the layout
properties and specify the wrapping behavior.
Various layout properties are available including:
Background
Default frame
Minimum size (%) and minimum height
In addition, as crosstabs are often wider and higher than the specified page format,
you can also specify the wrapping behavior for columns and rows. It creates as many
pages (shadow pages) as necessary. The row labels are repeated on all pages as
standard while the column labels are not repeated.
Various wrapping properties are available including:
Repeat Labels: Specifies whether the labels of columns or rows are to be
printed again in the case of a page break.
Break Level: Specifies the optimum break level, e.g. "0". This corresponds to
the lowest group, i.e. the quarter.
Column > Page Break on Shadow Pages: If the cross table is too wide, the
wrapped parts are printed on shadow pages. A shadow page does not count
as a "real" page and therefore does not have a page number. The default
setting specifies that the wrapped parts are to be output below the table.
Also see chapter "Overview of Properties".
135
Producing Analyses
Figure 6.49: Crosstab properties
6.5.5 Special Functions
Various additional functions are available in crosstabs including:
Crosstab.Value() returns the content of the cell (as a value).
Crosstab.Cells.Avg() returns the average value of the volume of data.
Crosstab.Cells.Sum() returns the sum of the cell contents.
Crosstab.Col$() or Crosstab.Row$() returns the description of the column or the
row for the current cell.
With this, you can, for example, assign a particular color to the background of a
column or row. The following example sets the background color to orange for
all cells in a row where the cell descriptor is "Germany":
Cond(Crosstab.Row$()="Germany",LL.Color.Orange,LL.Color.White)
Figure 6.50: Coloring a particular row
136
Creating a Crosstab
Crosstab.Cells.Max() or Crosstab.Cells.Min() returns the largest or smallest value
in the entire crosstab. With this, you can, for example, emphasize the largest or
smallest value of the volume of data or perform calculations. The following
example sets the background color of the cell with the largest value to green:
Cond(Crosstab.Value=Crosstab.Cells.Max(),LL.Color.Green,
Cond(Crosstab.Row$()="Germany",LL.Color.Orange,LL.Color.White))
Figure 6.51: Coloring a particular cell
Crosstab.Col() or Crosstab.Row() returns the index of the column or the row for
the current cell. Here, for example, you can set the background color of alternate
rows thereby producing a zebra pattern. Example:
Cond(Odd(Crosstab.Row()),LL.Color.LightGray,LL.Color.White)
Figure 6.52: Creating a zebra pattern
Join$() returns a collection of strings, separated by a particular character. For
example, you can output the individual turnover amounts in addition to the total
turnover. Example:
Fstr$(Sum(Order_Details.Quantity*Order_Details.UnitPrice),"-##,###,###") +
"¶["+ Join$(Fstr$(Sum(Order_Details.Quantity*Order_Details.UnitPrice),"##,###,###"))+"]"
137
Producing Analyses
Figure 6.53: Display detailed information
You can use Total() for calculations across all cells. Otherwise, calculations are
always made across all values that affect the respective cell.
Also see chapter "Overview of Functions".
6.6 Creating a Gantt Chart
This chart type provides you with a visual representation of activities ("Tasks") in their
chronological order on a time axis.
The individual activities are visualized with lines on a horizontal bar. The longer the
bar, the longer the period of the activity is. Activities that overlap are depicted with
overlapping bars. The bars can be configured flexibly, e.g. with color areas that can
be freely defined.
6.6.1 Insert
Let us assume that you would like to represent the increase in pollen release over
the period of a year. A colored identification could indicate weak, moderate and
strong incidences.
138
Creating a Gantt Chart
Figure 6.54: Gauge with colored signal areas
Proceed as follows in the Sample Application:
1.
The Gantt chart is an element in a report container. Therefore, you need to use
the "Objects" tool window to insert this object. If you have not yet added a report
container to the workspace, select Insert > Report Container (Objects > Insert
> Report Container) and adjust the object to the desired size in the workspace
while holding down the left mouse button.
2.
A selection dialog will appear for the chosen element type. Select the "Gantt
Chart" element type.
3.
You can now select the data source in the following dialog. All available tables
will be displayed hierarchically. In other words, you will find the related tables
under each of the respective table. Select the "Pollen" table.
4.
A properties dialog for the Gantt chart will appear.
6.6.2 Properties
In the "Field Assignments" area first select the groupings for the lines and columns,
i.e. the tasks and the time axis.
Please note: No aggregate functions or LL.FCount…fields can be used in a Gantt
chart.
1.
Select the "PollenDescriptionEN" field as the summary task name in the formula
wizard. The summary task name defines a superior operation in a project, e.g.
main projects and sub-projects. If you do not want to indicate any summary
tasks, enter the same value you entered under "Task Name".
139
Producing Analyses
Please note: A summary task must always be a real record which can either
come from the "Base Table" or from the table that the Gantt chart itself is based
on.
2.
Please select the "PollenDescriptionEN" field as the task name in the formula
wizard. The task name defines the task; in the case of pollen, examples could be
alder or hazel.
Please note: In the case of multiple tasks in a single line (e.g. a holiday plan
layout), these records must be separated from one another successively, i.e. the
records must be sorted.
3.
Please choose the "PeriodBegin" field for the beginning of the task. For summary
tasks (i.e. tree-pollen for example), this value is automatically placed at the
beginning of the first task.
Figure 6.55: Properties of the Gantt chart
4.
Select the "PeriodEnd" field for the end of the task. For Summary Tasks (i.e. treepollen for example), this value is automatically placed at the end of the last task.
The task is interpreted as a milestone, if the end time corresponds with the start
time and the duration is 0.
5.
Select the duration of a task in days. In our example, the difference of start and
end: DateDiff(Pollen.PeriodEnd,Pollen.PeriodBegin). With summary tasks this is
calculated with the difference between the days.
6.
Select the progress of an action if you would like to indicate this value (e.g. with
a project task).
140
Creating Statistical Reports With Footers
7.
Various layout options are available in the "Appearance" area:
Define the background and font of the title row, summary task row and task
row.
The color of the bar is defined via the property "Task Rows > Row Properties
> Filling (Unfinished) > Color". It is possible to define a formula to fill in areas
with different colors, e.g. Cond(Pollen.PeriodType=1,LL.Scheme.Color3
,Cond(Pollen.PeriodType=2,LL.Scheme.Color8,LL.Color.Red))
Under "Table Area" you can specify which additional values should be
indicated in the columns. The selection includes an ongoing index, the task
name, the start of the task, task duration, end of task and task progress.
Define the indicated time period under "Chart Area". For our pollen chart we
will select "Months". The superordinate unit of time is "Years". With a project
chart the example would be "Days" as time unit with the superordinate unit
being "Months".
Please also refer to the "Overview of Properties" chapter.
8.
Furthermore, you can define the page break behavior for columns and lines, as
Gantt charts are often wider than the assigned page format. It creates as many
extra pages (shadow pages) as necessary. In this process, the line identifiers are
uniformly repeated on all pages, but the column identifiers are not repeated.
The following break properties are available:
Page Break on Shadow Pages: If the Gantt chart becomes too wide, the
wrapped parts are printed on shadow pages. A shadow page does not count
as a "real" page and therefore does not have a page number. The default
setting specifies that the wrapped parts are to be output below the table.
Repeat Labels: Specify whether or not the labels of lines should be reprinted
in the case of a page break.
Break Evenly: Specify whether a page break should run on to the edge of the
time interval (e.g. month).
6.7 Creating Statistical Reports With Footers
When you enable the "Data Lines.Suppress" object property in tables, all data lines
are completely suppressed. This option is particularly useful in combination with the
"Force Sums" option. The latter option specifies that totals are also calculated when a
data line is not printed. By combining both options, you can output footer lines with
totals and produce interesting statistics in this way.
Let's assume that you want to output the turnover per country:
141
Producing Analyses
Figure 6.56: Creating statistical reports with footers
Proceed as follows in the Sample Application:
1.
Create a new element in the report container and choose "Table" as the object
type.
2.
In the following dialog, now select the data source. All available tables are
shown hierarchically, in other words, under the tables you will find the relational
tables in each case.
To evaluate sales per country, for example, choose the "Orders > Order Details"
table so that you have both tables at your disposal. The "Customers" table has a
1:1 relationship with the "Orders" table so you don't need to select it. The
turnover is held in the "Order_Details" table.
Figure 6.57: Hierarchical tables for statistical reports
3.
Create a data line with the "OrderID" field in the "Orders.Order_Details" table.
Although the data line is not output (it is suppressed), but it still needs a field so
that the table can be printed at all.
4.
Define the actual statistic as a footer line, i.e. with the country name in the first
column, and total the turnover in the second column. Now calculate the total
again with the "Sum(Order_Details.Quantity * Order_Details.UnitPrice)" formula.
142
Creating Statistical Reports With Footers
Figure 6.58: Creating footer lines for a statistical report
5.
In the "Orders" table, create a data line with the "Country" field from the linked
table "Customers". Although the data line is not output (it is suppressed), but it
still needs a field so that the table can be printed at all.
6.
Define the grand total across all countries as a footer line, i.e. with "Total" in the
first column, and total the turnover again in the second column.
7.
Now select the "Orders" table in the "Objects" tool window and set the "Data
Lines.Suppress" property to "Yes".
8.
Finally, also select the "Orders" table and set the "Data Lines.Suppress" property
to "Yes" here as well.
Figure 6.59: Suppressed data lines for statistics
143
Producing Analyses
6.8 Drilldown Reports (Increase Detail Level)
Navigation in hierarchical data is known as drilling down. Drilling down makes it
possible to "zoom in" to examine the data at different levels of detail. Different print
templates are linked to each other to achieve this.
These reports make it possible for anyone to find the information they are looking for
quickly, even with very large and complex data.
Only one level is printed to start with (e.g. customers). A new detail report opens
(e.g. orders) when you click on a customer.
This drilldown report can be opened in the context menu either in the same window
(navigation via the green arrow button in the preview window), or in a new
foreground or background tab.
The drilldown function is only available in the preview. You can export any drilldown
report to another format from the preview, e.g. PDF.
Drilldown reports linked via relations can be embedded in the preview file to allow
them to be sent or saved as a complete unit. You will find the respective option
"Embed Drilldown Reports" in the project properties.
A drilldown link in a table relates either to a single field or an entire table row. A
drilldown link in a chart relates to a Bar/Segment/Line. A whole series of links can be
associated with each of these elements, e.g., to present the data in different ways.
For drilldown links different types are available:
Link data via relations (only tables)
Link data by setting report parameters (also charts, crosstab)
144
Drilldown Reports (Increase Detail Level)
Figure 6.60: Example of a report with an open drilldown report
6.8.1 Drilldown via Relations
This property is only available with hierarchical tables. The link branches in a report
that is based on data linked with the data source of the current report container
element. Only the child data is available in the Drilldown report.
Proceed as follows to create a drilldown report:
145
Producing Analyses
1.
Choose Insert > Report Container (Objects > Insert > Report Container). In the
workspace, hold down the left mouse button and pull the object to the required
size. A selection dialog will appear for the chosen object type. Choose the
"Table" object type.
2.
In the following dialog, now select the data source. All available tables are
shown hierarchically, in other words, under the tables you will find the related
tables in each case.
In order to be able to open a sub-report in drilldown mode, you must select a
table here that also has a sub-table! In the Sample Application, select the
"Customers" table, for example, as it has "Orders" as a sub-table.
3.
Now define the columns of the table with the wizard, i.e. CustomerID,
CompanyName, ContactName, City.
4.
In the object dialog for the table, now define an additional column for the
drilldown link. Enter the text "Show..." as the content.
5.
Now open the dialog for creating the drilldown link by means of the "Drilldown
Links" column property.
Figure 6.61: Data line with additional column for a drilldown link
6.
146
Create a new drilldown link with the "Insert new link" button in the dialog that
appears.
Drilldown Reports (Increase Detail Level)
Figure 6.62: Dialogs for defining the linked drilldown report
7.
A dialog appears where you can create the print template for the sub-report.
Select the "Create a new project" option and enter the name for the print
template.
8.
A second instance of the Designer opens for you to create the print template.
Proceed as usual to create this sub-report. I.e. you create a report container,
choose the "Table" object type, choose "Orders" as the data source and define
the columns of the orders table that are to be shown in the report.
9.
Once you have completed the report, close this second Designer instance.
10. Back in the "Drilldown Links" dialog, you now define the "Menu Text" property for
this link. If you have more than one link, its text will be shown in a context menu.
If the text is variable (e.g. "Chart for " + Customers.CompanyName) it will also be
used as the title for a tab if multiple drilldown reports are shown in a preview
window.
11. You have now finished the drilldown report and you can display it in the preview.
6.8.2 Drilldown via Report Parameters
This link type is available for charts, crosstabs and hierarchical tables. The link
branches in a report with report parameters. The parameter value has to be provided
in the link properties. All data is available in the Drilldown report.
Proceed as follows to create a drilldown report via Report Parameters:
1.
Choose Insert > Report Container (Objects > Insert > Report Container). In the
workspace, hold down the left mouse button and pull the object to the required
size. A selection dialog will appear for the chosen object type. Choose the
"Chart" object type.
147
Producing Analyses
2.
In the following dialog, now select the data source. All available tables are
shown hierarchically, in other words, under the tables you will find the related
tables in each case.
In the Sample Application, select the "Categories" table.
3.
4.
In the object dialog for the chart, now define a simple bar chart:
a.
Category Axis (x): the 1:1-field "CategoryName"
b.
Value Axis (y): Sum (Order_Details.Quantity * Order_DetailsUnitPrice)
c.
Chart: Alignment Left to Right
Now open the dialog for creating the drilldown link via the "Drilldown Links"
property (Value Axis Tab).
Figure 6.63: Drilldown-Report with Report Parameters
5.
148
Create a new drilldown link with the "Insert new link" button in the dialog that
appears. A dialog appears where you can create the print template for the subreport. Select the "Create a new project" option and enter the name for the print
template.
Drilldown Reports (Increase Detail Level)
Figure 6.64: Dialogs for defining the linked drilldown report
6.
7.
A second instance of the Designer opens for you to create the print template.
Proceed as usual to create this sub-report. I.e. you create a report container,
choose the "Table" object type, choose "Categories>Products>Order_Details" as
the data source and define the columns of the table that are to be shown in the
report.
a.
Table Categories: A Footer Line with 2 columns: Text "Total" and a sum
column "Sum (Order_Details.Quantity * Order_Details.UnitPrice)".
b.
Table Products: A Group Footer grouped by "Products.ProductName"
with 3 columns: Sum (Order_Details.Quantity), 1:1-field ProductName,
Sum (Order_Details.Quantity * Order_Details.UnitPrice).
c.
Table Order_Details: A Data Line with any column. In this table, set the
property "Suppress Data Lines" to "Yes".
Now we create the report parameter to limit the displayed values. Select Project
> Report Parameters, click on "Insert a parameter" and name it with a
corresponding name, e.g. "Category". All other properties are not relevant for a
Drilldown report.
For more information about Report Parameters see chapter "Report Parameters".
149
Producing Analyses
Figure 6.65: Edit Report Parameter
8.
Define the corresponding formula for limiting the data in the property "Filter" of
the table "Categories". Pay attention to the notes in chapter "Filter".
Figure 6.66: Formula for the filter
9.
Once you have completed the report, close this second Designer instance.
10. Back in the "Drilldown Links" dialog you now only have to define the report
parameter of the project, i.e. we're assigning the corresponding database field
"CategoryName" to @Category.
11. In addition you define the "Menu Text" property for this link. If you have more
than one link, its text will be shown in a context menu. If the text is variable (e.g.
"List for " + CategoryName) it will also be used as the title for a tab if multiple
drilldown reports are shown in a preview window.
150
Drilldown Reports (Increase Detail Level)
Figure 6.67: Report Parameter
12. You have now finished the drilldown report and you can display it in the preview.
151
Producing Analyses
Figure 6.68: Drilldown-Report with Report Parameters
6.9 Multi-Column Reports
With complex projects containing many different diagrams, it may be a good idea to
present them over several columns.
To make this possible, the "Column Count" property is provided in the report
container and also in tables. You can define up to five columns whereby the report
container and the included tables can have different column count values.
Hint: Please also note the hints for using 2 side-by-side report containers in
chapter "Multiple Report Container".
152
Multi-Column Reports
Figure 6.69: Multi-column report container
Creation is easy:
1.
Select the "Report Container" object in the "Objects" tool window.
2.
Set the "Column Count" object property to "2".
3.
If you select individual objects, you will then have various properties for
controlling column breaks at your disposal:
Column Break Before: A column break will be performed before the object is
output.
Column Break Condition: If the result is "True" when a data line is output in a
multi-column table, a column break will be triggered. Tip: the
"LL.CurrentTableColumn" field returns the index of the current column.
(Page) Break Before: A page break is performed before the object is output. If
you have multiple multi-column objects, a page break is triggered
automatically after an object if the column counts for the objects are different
(e.g. 2-column table followed by a 3-column table) and if there would be
insufficient room for the object that follows.
153
Advanced Functions
7. Advanced Functions
In this chapter, we will concern ourselves with topics that you will probably only use
very rarely. Nevertheless, the possibilities offered by linking objects and by sum and
user-defined variables provide you with an important and useful tool for producing
sophisticated printed outputs.
7.1 Linking Objects
By interlinking objects, you can influence the order of printing causing some objects
to be printed after others thereby overlaying them in the event that they overlap
("sequential (temporal) linking"). Another possibility is to cause the size and position
of some objects to be adjusted automatically to correspond to changes to other
objects ("spatial linking"). Designer differentiates between three kinds of interlinking:
Sequential
Individual size and position adaptation
At end, keep size
When linking objects, there is a hierarchy: the main object and the attached
(interlinked) object.
7.1.1 Object List
The object list defines the implicit print order of the objects, thus they are
automatically sequentially interlinked with one another. Unlinked objects are printed
first, followed by the tables and finally the objects that are linked in any other way.
There are arrow-buttons in the top toolbar for moving elements and objects up and
down.
Figure 7.1: Object list in the tool window
Note: Depending on the application, the objects will either be printed in exactly
this order (variant 1), or first the non-concatenated objects, then the tables, and
finally those which are concatenated with other objects in some way (variant 2).
Hence, if an object is to be printed over another object, it must be printed after
154
Linking Objects
this object. A temporal concatenation is therefore only necessary for variant 2,
namely when a non-concatenated object is to be printed after the concatenated
objects, an object is to be printed over a report container, or content is only
known when another object is printed.
7.1.2 Creating Interlinks
You create interlinks or edit existing ones in the "Object List" dialog. This dialog
opens up via Project > Object list (Object > Object List; NUM* on the number pad)
or by double-clicking the "Objects" tool window.
Figure 7.2: Defining interlinks in the object list
You can interlink the selected object with other objects via the "Link with..." button.
The link is shown in the object list in the form of a tree structure in which you can
see the defined interlinks. You can also interlink several objects with one object.
To change the order of the linked objects use "Arrange" in the object list context
menu or the ribbon's "Forward" and "Back" buttons.
When you select the interlinked object, you can choose from the three different kinds
of interlink in the lower part of the dialog.
The "Detach link" button lets you remove an existing interlink. The interlinked object
will then be shown in the object list as an independent object.
155
Advanced Functions
7.1.3 Sequential Interlinking
Sequential, or temporal interlinking makes sense if the content of the interlinked
object can only be filled once the main object has been printed or if an object is to be
printed over another object.
Note: Depending on the application, the objects will either be printed according to
the order in the object list (variant 1), or first the non-concatenated objects, then
the tables, and finally those which are concatenated with other objects in some
way (variant 2). A temporal concatenation is therefore only necessary for variant 2,
namely, when a non-concatenated object is to be printed after the concatenated
objects, an object is to be printed over a report container, or content is only
known when another object is printed.
Example 1: You are printing an article list and want to output the number range of
the articles on this page.
Figure 7.3: Range of article numbers at the top of the list
But the "Article To" object only knows the last article number on the page once the
table has been printed. Therefore, the "Article To" text object must be interlinked
sequentially with the "Article List" table.
Select the "Article To" object in the object dialog and interlink it with the "Article List"
table. The "Sequential" interlink type is already selected.
You must also interlink the table with the "Article From" object. Sequential interlinking
is sufficient here as you don't want to change the size or position of the object.
156
Linking Objects
Figure 7.4: Object list with sequential interlinking
Example 2: You want to output "Copy" over a table.
You therefore create a text object containing "Copy". Because objects that are not
interlinked are printed first and tables are printed last, the text object must be linked
sequentially with the table. Otherwise it would be printed before the table and
therefore under the object.
Figure 7.5: Text object over the list
Select the text object in the object dialog and interlink it with the "Article List" table.
The "Sequential" interlink type is already selected.
157
Advanced Functions
Figure 7.6: Object list with sequential interlinking
7.1.4 The Individual Size and Position Adaptations
Individual size and position adaptations are spatial interlinks, i.e. the size and position
of the main object determines the size and position of the linked object. This
automatically causes sequential interlinking as well.
If the size or position of the main object changes because the variables that it
contains take up less room as the object provides, the linked objects adjust their size
automatically to these changes.
Two kinds of interlinking are therefore available:
Position adaptation: If the position of a main object changes, the position of the
linked object changes too. You have three options here:
Relative to begin: The interlinked object moves in relation to the upper left
corner of the parent object.
Relative to end: The interlinked object moves in relation to the lower right
corner of the parent object.
To end: The upper edge of the interlinked object starts at the end of the main
object, irrespective of its original position. This causes an implicit size change
on the first page on which the child object is printed.
Size adaptation: If the size of a main object changes, the position of the linked
object changes too. You have two options here:
Proportional: The size of the linked object changes exactly like that of the
parent object. E.g. if the main object becomes 10 mm shorter, the interlinked
object will also become 10 mm shorter.
Inverse: The size of the interlinked object is adjusted inversely to the size of
the main object. E.g. if the main object becomes 10 mm shorter, the
interlinked object will become 10 mm longer.
You can specify whether the interlinking is to be horizontal and/or vertical in each
case:
158
Linking Objects
Vertical interlinking: The linked object adjusts its position or size to changes in
the vertical position or height of the main object.
Horizontal interlinking: The linked object adjusts its position or size to changes in
the horizontal position or width of the main object.
Example of vertical, relative to end position adjustment: You print an invoice and
want to output a closing text after the table.
You therefore create a text object and position it below the table.
Figure 7.7: Text object below the list
Select the text object in the object dialog and interlink it with the table. Choose
"Individual size and position adaptation" as the type of interlink. On the "Vertical
Interlink" tab, enable the "Vertical" check box for the position adaptation and choose
the "Relative to end" option so that the interlinked text object adjusts its size
depending on the position of the lower right corner of the table.
159
Advanced Functions
Figure 7.8: Diagram of vertical, relative to end position adjustment
If the table becomes smaller, the text object moves upwards proportionally. It
doesn't matter where the table ends, the text object will always be output after the
table in the specified size.
Figure 7.9: Closing text below the list
Example of vertical, relative to end position adjustment and vertical inverse size
adjustment: On a multi-page invoice, the item table is to start on the first page below
the address. On following pages it is to start at the upper page margin.
1.
Create an invisible frame by inserting a rectangular object.
2.
The upper edge of the object is positioned precisely where the invoice table is to
begin on the following pages. The lower edge is positioned precisely where the
invoice table is to begin on the first page.
3.
Assign the "Page()=1" appearance condition to the rectangle so that it is only
printed on the first page.
4.
Create a table. This begins directly below the rectangular object.
160
Linking Objects
Figure 7.10: Invisible rectangular object above the table
5.
Now interlink the table with the rectangle (main object) and select "Individual size
and position adaptation" as the type of interlink.
Figure 7.11: Spatial interlinks in the object list
6.
On the "Vertical Interlink" tab, choose the position option "Relative to end" and
the size option "Inverse".
Figure 7.12: Interlink options in the object list
The table now changes its position based on the lower right corner of the
rectangle (main object) and adjusts its height inversely in proportion.
161
Advanced Functions
Figure 7.13: Diagram: Vertical, relative to end position adaptation and vertical inverse size
adaptation
The Page()=1 appearance condition prevents the rectangle from being printed
on the second page. Therefore, it "shrinks" by 80 mm on the second page, and
the table moves upwards proportionally and becomes 80 mm larger.
Figure 7.14: Position and size adaptation on the second page
Example: position adaptation, vertical to end: The interlinked object changes its
position based on the main object. The size is also adjusted implicitly because the
upper edge of the interlinked object changes based on the main object but the
position of the main object does not change. The interlinked object must overlap the
162
Linking Objects
main object. The main object must be larger than the interlinked object. If the main
object becomes smaller, the interlinked object only changes its position from above
and increases its size. If the main object becomes larger, the linked object shrinks
(the main object must be in the foreground).
Figure 7.15: Diagram: Position adaptation vertical, to end
Example: position adaptation, vertical, relative to begin: The interlinked object
changes its position based on the upper left corner of the main object. This type of
interlink is the exact opposite of "vertical, relative to end". Example: The main object
moves upwards due to the "Alignment bottom = True" setting in the Designer and
the interlinked object follows this position adaptation in an upwards direction.
Figure 7.16: Diagram: Position adaptation, vertical, relative to begin
163
Advanced Functions
7.1.5 The "at end, keep size" Interlink
This kind of interlink is similar to position adaptation. But here, the main object's
available space is taken into consideration and the interlinked object always keeps its
size. In other words, the object is always output within the boundary of the main
object. If the available space is not sufficient, a page break will be triggered.
Figure 7.17: Function of the "At end, keep size" type of interlink
The interlinked object must overlap the main object in the Designer. It is crucial that
the main object is always larger than the interlinked object. The interlinked object
always tries to occupy the space remaining from the original size of the main object
and, if the interlinked object is larger, this leads to an infinite loop because there is
never enough space.
Example: Assuming you want to output a scanned signature after a text. The size of
the signature must not change and it must be output within the border of the text
object.
You therefore create a picture object and position it directly on the formatted text
object. The height of the picture object is less than that of the table object.
Figure 7.18: The interlinked picture object overlaps the main object in the Designer
164
Filter
Select the picture object in the object dialog and interlink it with the formatted text
object. Choose "At end, keep size" as the type of interlink.
Irrespective of where the text ends, the picture object will always be output after the
text in the specified size. If there is no longer sufficient space after the text, the
picture object will be output on the next page so that the size can be kept.
Figure 7.19: The signature is output at the end without changing the size
In this way you can also position multiple objects after each other (e.g. charts,
pictures etc.).The "Base object" of the chain is the first object in the interlink hierarchy
with an active page break.
7.2 Filter
7.2.1 Project Filter
Choose Project > Filter to define a filter condition. Only the records matching the
condition displayed in the report.
7.2.2 Data Filters for Objects
Use the property Data Filter to also define a filter condition for report container
elements. Only the records matching the condition are displayed in the object or
element.
The filter condition – depending on data source and application – will be checked for
compatibility with the database system and then executed there completely or
partially. This can result in a considerable performance increase.
There are three different modes for a filter:
165
Advanced Functions
1.
Full compatibility to database. Many of the built in functions can be fully
translated to native database statements. If the data source, for example, is a
SQL Server, many operators and functions can be supported (Left$, Right$,
Mid$, Round, StartsWith, EndsWith, Contains, Upper$, Lower$, Year, Month,
Day, Len, Empty, DateInRange, NumInRange, Artim$, LTrim$, RTrim$).
Microsoft's SQL Server can support some additional date functions like
AddDays, AddWeeks and the like.
Figure 7.20: Full compatibility to database
Partial compatibility to database. This means, a part of an expression can be
translated where another part (that is concatenated with "and") can not. In this
case, the supported part is done using native filtering whereas the unsupported
part is done by the reporting engine.
Figure 7.21: Partial compatibility to database
2.
No compatibility to database. The filtering is performed by the reporting engine.
You should try to change the filter condition to a supported syntax.
Figure 7.22: No compatibility to database
166
Sum Variables
7.3 Sum Variables
Sum variables offer another way of creating totals and counters and work
fundamentally across tables.
They are therefore a good choice whenever you want to create totals across different
table hierarchies.
In all other cases, we recommend the use of the aggregate functions Sum(), Count()
and CountIf() for totals and counters. Aggregate functions are always table-specific.
You can even produce statistical analyses directly with aggregate functions e.g.
Median(), Variance(), StdDeviation(). You will find a list of all functions in the
"Aggregate functions" function category in the formula wizard.
Sum variables can be used to create totals over data sets, e.g. to add up the
"Item.UnitPrice" fields in a table in order to calculate the total price. Such totals are
permitted for all numeric variables or for expressions that return a numeric value as
the result.
But sum variables are also a convenient way of defining a counter which can be
updated accordingly for each data record that is printed.
You can create a total across all data sets of a printed page (page totals) or across
the entire project (grand totals).
Figure 7.23: Totaling with sum variables.
Proceed as follows to define the variables:
1.
Choose Project > Sum Variables or the "Edit sum variables" button in the formula
wizard.
2.
In the dialog that follows, create a new sum variable via the "Insert a new
variable" button.
167
Advanced Functions
3.
An input dialog appears where you can enter a description of the new variable.
Give the variable a meaningful name, the "@" character will be added
automatically as a prefix.
4.
Click the "Edit" button to open the formula wizard and assign a field or an
expression to the new sum variable.
For example, select the numeric field "Item.UnitPrice" if you want to add up the
"Item.UnitPrice" column.
You can, however, also perform aggregations with complex expressions
provided that the result is a numeric value. For instance, you can add up the
gross price from the net price and the VAT. Enter the following expression, for
example, in the "Sums over" field:
Item.UnitPrice+ Item.UnitPrice* (Item.VAT/100)
5.
If you don't want to add up any values but merely want to create a counter or a
numeration, the definition is simple: In the "Sums over" field, simply enter the
value that is to be added to the existing counter.
The simplest case is a consecutive number that is increased by 1 for each data
record. Just enter the value "1".
6.
The "Page sum" checkbox lets you specify whether the totals are to be set to 0 at
the end of a page. In this way, you can define page totals and counters.
7.
Once you have defined which sums are to be stored in which sum variables, you
can use these sum variables in your objects. In the formula wizard, you will find
the sum variables at the end of the variable list in the "Sum variables" folder. In
the tool window "Variables-/Field-List", the sum variables can be directly edited
by double clicking and via a context menu.
7.4 User Variables
User variables are a way of saving values and expressions for later use. This saves
you having to enter them anew each time if they are frequently needed in precisely
this form or if user-defined data is to be output repeatedly. They are, so to speak,
"formula building blocks".
You can then store these user variables in project includes if they are also to be used
in other projects.
Note: User variables cannot be used within appearance conditions for layers.
You can also use the SetVar() and GetVar() functions if you only want to save values
in the variable repository for later use. You will find more information about functions
in the chapter "Overview of Functions".
Proceed as follows to define user variables:
168
Collection Variables
1.
Choose Project > User Variables or the "Edit user variables" button in the
formula wizard.
2.
In the dialog that follows, create a new user variable via the "Insert a new
variable" button.
3.
An entry dialog appears where you can enter a description of the new variable.
Give the variable a meaningful name, the "@" character will be added
automatically as a prefix.
4.
Click the "Edit" button to open the formula wizard and assign a field or an
expression to the new user variable.
Figure 7.24: Edit user variables
5.
You can use the arrow to specify the evaluation order. The variables are
evaluated from top to bottom.
6.
Once you have defined the user variables, you can use them in your objects. In
the formula wizard, you will find the user variables at the end of the variable list
in the "User variables" folder. In the tool window "Variables-/Field-List" the user
variables can be directly edited by double clicking and via a context menu.
7.5 Collection Variables
As with user variables, collection variables enable you to save values and
expressions for use at a later point in time. Collection variables also allow you to
summarize and categorize data, as well as label it with additional attributes.
These collection variables can also be transferred to project includes if they are also
to be used in other projects.
Example: Displaying average price for each article category as a chart.
169
Advanced Functions
What we have are article numbers which reflect their category:
Article number begins with "EX": Travel
Article number begins with "RNT": Rentals
Article number begins with "TRP": Short trips
Hence, there is no category field in the data that you can e.g. use in a chart in order
to display the average price of an article for each category. With collection variables,
you have the ability to combine the data of the various categories and to define
properties such as a category name or a color.
For the definition of collection variables, proceed as follows:
1.
Select Project > Collection Variables or click on the button "Edit Collection
Variables" in the formula assistant.
2.
In the dialog that appears, click on "Insert new Variable" to create a new variable.
An input dialog then appears asking you to name the new variable. Give it a
distinctive name, e.g. "Category". The "@" character is automatically appended to
the front of the name.
Figure 7.25: Edit Collection Variables
By clicking on the arrow buttons, you can define the order in which the analysis
takes place. Variables are analyzed from top to bottom.
3.
170
A dialog appears for the editing of the collection variable "Category". Click on the
button "Insert New Variable (Column)" to add 2 sub-variables: "Name" and "Color".
Collection Variables
Figure 7.26: Define Variables for the Collection
4.
Click on the button "Insert new collection" to insert the category definition. For
our example with the article number, select the entry "Wildcard".
Figure 7.27: Definition of the Collection Type
5.
A dialog appears for wildcard matching. Select the field "Article Number" and
enter the wildcard string: EX*. Add multiple entries as single lines. Supported
wildcards are "*" and "?".
171
Advanced Functions
Figure 7.28: Edit Wildcard Matching
6.
Repeat this step for the desired categories, adding a name and a color for each
one. The dialog will then look like this:
Figure 7.29: The Collection Variables
7.
Once you have defined the collection variable, you can use it in your objects. In
the formula assistant, you can find the variables at the end of the variable/field
list in the folder "Collection variables".
8.
You can now use the collection variable "@Category.Name" in the diagram as a
coordinate value for the x-axis.
9.
Output the average price of all articles as the y-value.
172
Project Includes
10. Use the collection variable "@Category.Color" as the color. To do so, click on the
tab "Colors". Under "Fixed Colors", enter "True" as the condition and place the
collection variable "@Category.Color" in the field "Formula".
Figure 7.30: Average Price per item
7.6 Project Includes
If you design several similar projects, it's a good idea to include other projects as
"Includes" to avoid having to create elements that occur repeatedly in each new
project. In this way, you can easily include a letter head, for example, and any
changes can be made centrally, e.g. if the design changes.
Figure 7.31: Dialog for project includes
173
Advanced Functions
Or user variables that are used repeatedly (e.g. complex formulas in address fields)
can be stored in includes.
Includes may contain other includes.
Elements can be interlinked with elements in includes; the element in the
include is always the parent element because it is printed first.
Via Project > Include, you can add other projects as includes.
You can see the objects in the workspace and the object list. Project includes
are always inserted at the beginning of the object list
A button allows you to hide includes in the object list.
Totals and user variables are read and used in the same way. When designing
includes, please make sure that you do not cause any overlaps (e.g. use a
project with a sum variable as a include which is already contained in the current
project).
You can specify the name, visibility and appearance condition for each include
by means of the property list. The buttons let you specify the (print) order.
Use the Edit button to open and edit the include in a 2nd instance of the
Designer. After you edit the objects close this 2nd instance of the designer.
7.7 Insert PDF Pages
PDF objects are used for displaying multipage PDF content.
Also see "PDF" in chapter "Overview of Properties".
7.8 Insert HTML Pages
HTML objects are used for displaying HTML content. You specify the HTML page by
specifying the file name (e.g. combit.htm) or the URL (e.g. www.combit.net) in the
object properties, or by means of the formula wizard.
Also see "HTML Text Objects" in chapter "Overview of Properties".
7.9 Insert OLE Documents
Use the OLE container object to embed OLE server documents. In this way, you can
embed documents from other applications (e.g. Word, Excel, Visio, MapPoint) in a
report. Only the first page will be displayed as there is no standard for multi-page
OLE objects. For the content, there are three options available:
Filename: Link to a file that needs to be available at print time.
Embedded: You select the object type via the standard Windows dialog "Insert
Object". Here you can choose an existing file ("Create from File") or create a new
174
Insert Form Template Objects
file. The object will be embedded in the project. This can be useful e.g. for
simple drawings or rather static objects.
Formula: Allows a formula for the file name.
7.10 Insert Form Template Objects
Form templates are images, i.e. scanned forms, which you place in the background
of your workspace as a template. This lets you position objects in a project precisely
to fit the form. Although form templates are shown in the workspace, they are not
printed and cannot be modified.
The best way of positioning them is by means of the property list.
To place a form template in the background of your workspace, choose Insert >
Form Template (Objects > Insert > Form Template). Once you have created the
template, it's best to use the objects tool window to select it. Form templates cannot
be selected by clicking in the workspace.
For more information about the properties, see "Form Template Objects" in the
chapter "Overview of Properties".
175
Page Layout
8. Page Layout
You can influence the layout of your report in many different ways. In this chapter,
we will examine the possibilities offered by different layout regions, define a multipage report and control the page break behavior.
8.1 Specifying the Page Layout
Your first task in a new project is to set up the page layout that you want. Choose
Project > Layout Regions (Project > Page Setup) to specify properties such the
choice of printer, paper size and orientation. There are different layout options
depending on the project mode (label or list).
With multi-page projects, it is sometimes a good idea to choose different layout
settings, e.g. printer, page size, orientation, paper bin, for the different pages. You
will find more information about this in the chapter "Page Layout".
Figure 8.1: Definition of the layout regions
When you modify the orientation (portrait/landscape), a dialog will allow you to
determine if the objects are to be automatically adjusted to the new orientation.
8.1.1 Printer Settings
By means of the properties, you can make different settings for each layout region
for printer, page size, orientation, duplex print, number of copies, sort copies and
paper bin (e.g. first page on company letterhead and normal paper for the following
pages).
176
Specifying the Page Layout
The printer settings (and changed export format options) are saved in a special file
(e.g. Article_List.lsp). If the respective file is not available when printing, the current
default Windows printer is used.
Size Adjustment
Specifies whether the project is to be adjusted to fit the page when different printers
are used when printing from the preview or whether the scale is to be kept.
Use Physical Page
Specifies whether the whole physical page, including the non printable margin area,
is to be available in the Designer. This is sometimes necessary in order to position
labels correctly, e.g. if you use sheets of labels without margins. The non-printable
page margins are shown as hatched areas in the preview.
This enables you to use the complete page when defining the layout of your project
but, of course, the printer cannot print these margins. If you place objects on such
projects, you must still consider the non-printable margins. If this property is set to
"False", only the area that can actually be printed is shown in the workspace.
Force Paper Size
If there is no printer definition file, the application tries to force the page size set
during design (e.g. Letter) as far as possible. This is only possible, however, if the
selected printer supports either exactly this size or the "user-defined" option. If this is
not the case, it will first check whether the printer's default size is large enough,
otherwise it will choose the next largest size.
8.1.2 Export Media
This list shows the various export possibilities.
177
Page Layout
Figure 8.2: Default setting for the output format
With the two buttons on the upper right, you can define a selected format as the
default value for the later print and specify the options for this format. These options
are saved in a special file (e.g. Article_List.lsp).
8.1.3 Templates for Label Formats
Via the "Templates" tab in the page layout for labels, you can make your selection
from numerous predefined label formats from different manufacturers. This
automatically specifies the size of the individual labels, how many are to appear on
the sheet and how they are to be distributed.
178
Specifying the Page Layout
Figure 8.3: Definition of the label size
8.1.4 Defining Your Own Label Format
You can also define your own label formats if you can't find the layout that you want
among the templates. You can make the required settings with the "Layout
Definition" region property; there is a special dialog for this:
Offset: The offset specifies the horizontal or vertical distance of the upper left
label to the margin of the chosen page region (physical/printable)
Note: In the screen display, the upper left corner of the workspace always
starts at coordinates 0/0 irrespective of the chosen page size and specified
offset. However, you will see the effect of the offset in the preview or when
printing.
179
Page Layout
Figure 8.4: Defining customized label layouts
Size: This value defines the size (horizontal=width / vertical=height) of the label.
Distance: The distance to the next label is specified here. With single-column
labels, only the vertical distance must be entered.
Number: This option specifies the number of labels per page (horizontal number
= number of columns per page, vertical number = number of rows per page).
Print Order: Specifies the order of the print if multiple labels are printed on a
page. Possible values: 0 (horizontal), 1 (vertical), 2 (horizontal bottom up), 3
(vertical bottom up).
The default is to print labels row by row from the upper left to the lower right
(horizontal). However, in the case of sheets of labels that have already been
started, it is possible that the first label row has already been used. This causes
a loss of stiffness in the upper part of the sheet. Many printers have problems
feeding in sheets that have already been started, resulting in a paper jam. In this
case, it helps to print the labels in reverse, from the bottom upwards instead of
from the top downwards. In this way, the upper row of labels on the sheet is
always printed as the last and the sheet retains the stiffness required for feeding
in.
Saving your own label formats in the label template list
To save your own label formats, you can edit the file "cmll2101.inf".
Layout of a label definition (all measurements in 1/1000 mm):
<A> <B>, <C> = <D>, <E>, <F>, <G>, <H>, <I>, <J>, <K>
180
Layout Regions
A: code, B: description, C: page size, D: label width, E: label height, F: horizontal
distance between labels, G: vertical distance between labels, H: number horizontal,
I: number vertical, J: margin left and right, K: margin top and bottom
e.g. 3420 universal labels, 70 x 16.9 mm = 70000, 16900, 0, 0, 3, 17, 0, 4850
8.2 Layout Regions
With multi-page projects, it is sometimes a good idea to choose different layout
settings, e.g. printer, page size, orientation, paper bin, for the different regions.
You define the layout regions with Project > Layout Regions (Project > Page Layout).
You create a new region with the relevant button on the "Layout" tab and then define
the properties for this region.
You will find a detailed explanation of the properties in chapter "Overview of
Properties".
8.2.1 Active Design Layout
If you define different layouts, you can decide which layout is to be displayed as the
workspace. The "Active Design Layout" project property lets you choose from all
defined layout regions.
Figure 8.5: Selecting the active design layout
8.2.2 Practice: Report With Different Page Orientations
Let's assume that you want to change the page orientation within a report: the first
section with the bar chart is to be printed in portrait mode, the second section with
the cross tab in landscape mode and the remaining section with the pie charts in
portrait mode again.
181
Page Layout
The report should look like this:
Figure 8.6: Report with different layout regions
Proceed as follows:
1.
Position the report container on the workspace and create the bar charts, pie
charts and the cross tab. You can find more information about this in the chapter
"Producing Analyses".
2.
Since you want to change the page orientation, you must also adjust the height
and the width of the report container. If you don’t do this, the crosstab data will
be truncated when the report container is positioned in portrait mode.
Select the report container in the "Objects" tool window and use the
LL.Device.Page variables and the UnitFromSCM() function to specify the height
and width:
Figure 8.7: Size of the report container defined variably
3.
Create headings by adding a Table > Free Content element in each case.
4.
Enter "Orders per Customer" as the name of the crosstab's heading. This
element name will then be available later in the "LL.CurrentContainerItem" field.
182
Layout Regions
5.
So that the titles are always printed at the beginning of a page, set the
"Pagebreak before" property to "Yes" in each case. This will produce a page break
before outputting the element.
6.
Now define the layout regions. Select Project > Page Setup.
7.
The dialog for defining the layout will now appear. The default region "Standard
Layout" is always the last area with the "True" condition and cannot be renamed.
Leave "Portrait" as the orientation for this layout.
Figure 8.8: Layout definition for a particular element
8.
Create a new region with the "New" button. Enter a meaningful name for this
layout in the "Description" property, e.g. "Landscape".
9.
Then specify the specific properties for this layout. Change the "Orientation"
property to "Landscape".
10. You can specify when this layout region is to be used as a "Condition." In this
example, the mode must change when the element with the name "Orders per
Customer" is printed. The formula for the logical condition is therefore:
LL.CurrentContainerItem = "Orders per Customer".
8.2.3 Practice: Managing Issues (Copies)
Let's assume that you want to produce two copies of an invoice. The first copy is to
be printed on a company letterhead in paper bin 1. The second copy is to be printed
on the cheaper paper in paper bin 2.
1.
In the project properties, enter "2" in the "Number of issues" property.
2.
Open the dialog for the report container via Project > Page Setup.
183
Page Layout
3.
Create a new region "Original". In this case, use the IssueIndex() function as the
"Condition". This function returns the number of the issue. So you define the
logical condition "IssueIndex()=1". Select paper bin 1 for this layout.
4.
Create a layout called "Copy" and define the logical condition "IssueIndex()=2".
Select paper bin 2 for this layout.
Figure 8.9: Definition of the layout regions
If you want to endorse the second copy additionally with the text "Copy", carry out
the following steps:
1.
Create a text object containing "Copy".
2.
Select the text object in the object dialog and set the value of the "Display
condition for issue print" object property to IssueIndex()=2. This text object will
now only be printed on the second copy.
8.2.4 Practice: Payment Form on the Last Page
Let's assume that you want to print a payment form on the last page of a multi-page
invoice. The payment form is preprinted on a special paper in paper bin 2 in the lower
range of the page. The field contents have to be printed exactly at the correct
positions.
Proceed as follows:
1.
Open the dialog for the layout regions by Project > Page Setup.
2.
Create a new region "Last page". Use the function Lastpage() as a condition that
returns the value "True" if the last page is printed. Choose paper bin 2 for this
region so the last page will always be printed on the special payment form
preprint from paper bin 2.
184
Layout Regions
Figure 8.10: Invoice with fields and placeholders for payment order
3.
Position the text objects for the field contents of the payment form exactly at the
correct position. You can put a scanned-in picture of the payment form in the
background by choosing/clicking Objects > Insert > Form Template.
4.
Set the appearance condition of all text objects to Lastpage() to make sure they
are only printed on the last page.
5.
You have to link all text fields with the table as the function Lastpage() can only
be evaluated correctly in tables, layout regions or objects linked to tables.
Links are created and edited in the "Object List" dialog. Open this dialog by
choosing/clicking Objects > Object List. Select the table object and link via text
object of the payment form to it by clicking "Link with...". The interlink type
"Sequential" is already selected. The sequential interlink is sufficient here as no
changes in object position or object size are desired.
Repeat these steps for all text objects.
6.
Now you have to avoid that the fields of the payment form are printed on top of
the table if the table ends on the last page in the area of the payment order.
185
Page Layout
Therefore create a placeholder by inserting a rectangle object without border
and filling. The rectangle has the exact height of the payment form and has to
overlap the table necessarily! Select the table in the object dialog and link the
rectangle to it. Choose "At end, keep size" as interlink type. No matter where the
table ends, the rectangle is always output in the selected size after the text. If
there is not enough space after the table, the rectangle is output on the next
page and a page break is triggered.
8.3 Report Sections
Via Project > Report Sections you can define a table of contents, an index and
reverse side printing.
Via Project > Include, you can add other projects as includes. For more information
about Includes see "Project Includes" in chapter "Advanced Functions".
8.3.1 Table of Contents and Index
Via Project > Report Sections it is possible to automatically create a table of
contents and an index for reports. Contents and index are normal projects with
predefined reference fields.
Figure 8.11: Dialog for integrating table of contents and index
In the Designer an entry for the table of contents and index can be defined for almost
every element by means of its respective property "Table of Contents Level" or "Index
Level". Via File > Options > Project you can set the maximum folder depth and index
depth.
At the time of printing the corresponding values are read and the table of contents
and index are added at the beginning and end of the project. The directory entries
are also active links in the PDF and preview.
186
Report Sections
Proceed as follows:
1.
Open the dialog to define the steps in the report via Project > Report Sections.
2.
Select either the "Table of Contents" or "Index" section.
3.
Click on the "Edit" button at the top in order to launch the wizard for creating the
table of contents or index.
4.
A dialog will open in which you will be able to create a new project. During this
process you will be able to use a pre-configured, adjustable standard template.
Alternatively, you could also open a pre-existing project.
5.
Adjust the template as needed. You can open this print template and work on it
at any time via the "File Name" property.
For the link text and the page number use the fields Reference.Text and
Reference.PageNumber or Reference.Index.
To set the Table of Contents Level or Index Level in the Appearance Condition
use the field Reference.Level.
Figure 8.12: Separate project for the table of contents
187
Page Layout
8.3.2 Reverse Side
Project > Report Sections can be used to define a reverse side for printing. The
corresponding values will be evaluated at print time and the file will be output on
every reverse side or only on the first or after the last page.
This function is useful to print the general terms and conditions on the reverse side
of the last page of an invoice for example.
Proceed as follows:
1.
Open the dialog via Project > Report Sections.
2.
Select the "Reverse Side" section.
3.
Define the print position for duplex print in the property list: Reverse Side of the
First Page, Reverse Side of All Pages, After the Last Page. Define also the
position for Non-Duplex Print or Export.
Hint: In the preview the reverse side is displayed at the end.
Figure 8.13: Dialog to create a Reverse Side
4.
Click on the "Edit" button at the top in order to launch the wizard for creating the
Reverse side.
5.
A dialog will open in which you will be able to create a new project. During this
process you will be able to use a pre-configured, adjustable standard template.
Alternatively, you could also open a pre-existing project.
6.
Adjust the template as needed. You can open this print template and work on it
at any time with the "File Name" property.
188
Report Sections
Figure 8.14: Separate project for the reverse side
189
Output Options
9. Output Options
There are two ways of printing projects: Start the print from the higher-level
application or via the real data preview in the Designer (if supported by the
application).
9.1 Output Options
You can start the print function directly from the higher-level program, via a menu
item or from the preview.
If you start the print from the higher-level program, the print settings dialog will
normally appear once you have selected the project to print.
Figure 9.1: Output options
You have various configuration options here:
Under "Print Target", you can change the printer settings. If you have defined
different layout regions in the page layout dialog, you can also change the printer
settings here for the various regions. Enter the number of copies under "Issues".
Select the output format (e.g. preview, printer, PDF) under "Direct to".
The "Preview" option lets you view the output first on the screen as it would be
printed. In this way, you can check the result before printing.
If you select the "Save options permanently" setting, your choice of printer and
output format will be saved as default values for this print template.
With "First Page", you specify the page number which the numbering starts with.
190
Real Data Preview
"Pages" lets you select certain pages or a page range for printing, e.g. 1, 3-4, 10-.
The "Print" drop-down list lets you restrict the output to even/odd pages or the
pages that you have selected above.
When printing labels, you have an extra "Select" button which you can use to
specify the position where you want to start printing the sheet of labels.
In this way, you can also print sheets of labels that have already been partly
used. You will find a sample label sheet for your label project in the dialog for
selecting the start position. Click the label where the print is to start. Please take
note of the selected print order. You can print not only in rows from upper left to
lower right but also column for column or in the reverse direction. The labels will
be printed in the specified direction starting with the selected label.
Figure 9.2: Additional print settings for labels
9.2 Real Data Preview
The real data preview function is also available directly in the Designer provided that
your application supports it. In this way, you can check the layout of a printout
without wasting paper in order to do so. The screen preview is accurate down to the
last detail (WYSIWYG – What You See Is What You Get), exactly as it would be when
printed. After checking the layout, the actual print can be started from the preview
without having to use the print command again.
191
Output Options
Figure 9.3: Real data preview in the Designer
The pages are continuously displayed. Via "Move" you can move the viewing area
with the mouse, otherwise use the scroll bar.
Use "Zoom In", "Zoom Out", "Page width" and "100%" to adjust the view in the
workspace.
If you zoom out, multiple pages are displayed.
A double click on a page gives a full page view.
Use the Zoom slider in the status bar to slide to the zoom percentage you
requires (50% - 500%).
Hold the CTRL key and simultaneously rotate the mouse wheel to zoom with
the mouse.
With the find function, you can search all pages of the preview.
The "Pages", "Directory", "Index" tabs are for fast, direct navigation. Information of
contents and index, see "Report Sections" in Chapter "Page Layout".
192
Export in another Format (PDF, XLS ...)
Via File > Options > Preview, you can specify the maximum number of pages
that are to be displayed in the real data preview.
The "Number of copies" specified in the print options is ignored in the preview as
this is only relevant for the actual print.
9.3 Export in another Format (PDF, XLS ...)
You can also output a print in different file formats. Available are – depending on the
application – e.g. PDF, DOCX, PPT, XHTML, MHTML, HTML, Excel, RTF, XPS, TIFF,
PNG, JPEG, Bitmap, EMF, TTY, CSV, Text, XML.
To do this, choose the relevant output medium in the Print Options dialog, which you
reach via File > Export or via "Export" from the preview.
Please consider:
Due to the format, the layout cannot always be taken over 1:1 because there are
specific restrictions when converting to these formats.
Printing issues is only supported for the PDF export.
The Microsoft® Word export format creates DOCX files that are compatible with
Microsoft® Office 2007 and higher. Tables will be exported on continuous pages
to support later editing.
RTF: A mix of different page formats is not supported.
Many formats have various possibilities for configuration. You can make use of these
by clicking the "Options" button.
With Excel formats, you can reduce the number of columns and rows to the
minimum required by means of the "Only data from table object(s)" option. Also
all pages can be exported into one sheet and the output formats 'xls' as well as
'xlsx' are available.
The picture export to JPEG, TIFF and PNG supports optional automatic cropping
of the results to the content. An exported barcode is therefore only exactly as
large as required to display the complete content.
With PDF exports, you will find e.g. the option for creating a file that is PDF/A
compliant and security options. You will find more information about creating a
PDF table of contents in "Report Sections " in chapter "Page Layout".
193
Output Options
Figure 9.4: Output settings for PDF
When you start the print, choose the storage location in the following "Save As"
dialog and enter a name for the file to be created in the "File name" field.
By checking the option "Open the file in the registered application after the
output", you can display the file after creation directly in the respective program
(e.g. Excel).
The option "Send exported files by email" lets you send the files directly by email.
You can add a digital signature to your files by means of the "Digitally sign
created files" option (not available in all applications).
194
Test Print in the Designer
Figure 9.5: Output options
9.4 Test Print in the Designer
Choose File > Print > Test Print (File > Print Sample) to print the current project with
sample data. In the print sample, fixed text appears as it is defined in the project;
variables and fields however are replaced by a predefined sample text or by a single
repeated sample data record.
9.5 Report Parameters
The report parameters allow for the parameterization of reports; i.e. the result of the
output can be influenced. This allows e.g. a date range to be selected or only certain
invoice numbers to be printed.
This functionality can also be used to create drill-down reports. For more information,
see chapter "Drilldown Reports (Increase Detail Level)"
Parameters can be defined via Project > Report Parameters.
Tip: The availability of this chart depends on the application.
Example: Filtering a report according to category and date in the preview.
To do so, proceed as follows:
1.
What we have is product statistics spanning multiple product groups and years:
195
Output Options
Figure 9.6: Sample-Report "Different chart types"
2.
196
Now add the parameters at Project > Report Parameters. Give distinctive
names, e.g. "Categories". The "@" character is automatically appended to the
front of the name. For "Available Values", select "From Data Source" and the data
source "Categories" with the field "CategoryID".
Report Parameters
Figure 9.7: List of Report Parameters - From Data Source
3.
For the remaining report parameters "StartDate" and "EndDate", select "Manual
Input" for "Available Values". Choose "Date" for "Type" and "Control Type" and give
them a distinctive name, e.g. "StartDate" and "EndDate".
Figure 9.8: List of Report Parameters - Manual Input
4.
The parameters are now available in the variable/field list.
Figure 9.9: Parameters in the variable/field list.
197
Output Options
5.
Under the property "Filter" in the chart object, now define the corresponding
formula for the constraints on the data.
Pay attention to the notes in section "7.2 Filter".
Figure 9.10: Report Parameters in the Variables-/Field-List and Formula for the Filter
6.
198
When printing to preview, the parameters can then be configured as desired the report will be filtered according to categories and date:
Report Parameters
Figure 9.11: Filtered Report
7.
If you are not printing to preview, but instead e.g. to a PDF file, the parameter
selection will appear as a dialog before printing.
Figure 9.12: Report Parameter Selection in the export
8.
You can now define yet another parameter — in the example above e.g. a
"Products" parameter that is dependent on the selection in "Categories". Select
the corresponding parameter via the property "Depending on".
199
Output Options
Figure 9.13: Definition of a dependent Report Parameter
9.
After doing so, for the second parameter "Products", only those values that also
match the selected first parameter will be available. In this example, it is only the
beverages that are shown:
Figure 9.14: Dependent Report Parameter
200
Variables-/Field-List
10. Variables, Fields and Expressions
Information such as a return address line on an address label or a heading over a list
can be entered directly into the project as "fixed text". Fixed text is printed exactly as
it is held in the project.
Alternatively, this information can be taken over dynamically from a higher-level
program. Such information is entered into the projects as "variables" or "fields".
Fields are the data that changes for each line of a table. Variables remain the same
throughout the page. For example, you might choose the TELEPHONE field for the
contents of a column of a table. The different telephone numbers for the data
records in the database are printed in this column. In other words, variables and
fields are placeholders.
With these two kinds of information, attractive projects can already be designed that
are adequate for many purposes. However, the Designer offers much more. With the
aid of formulas and expressions, the information held in variables and fixed text can
be joined or modified in almost any conceivable way. The "formulas" and
"expressions" make this possible. In formulas and expressions, fixed text and
variables can be used in "functions" and joined by "operators".
For example, with projects for printing address labels, you can use an expression to
automatically add the text "PO Box" to a PO Box number held in a variable called
POBOX. In this way, not just the number alone will be printed on the label but
something like "PO Box 111111" instead.
Or, consider this: The net price of an article is held in a variable called PRICE.
However, you want to print the price including VAT in your list. A formula that
calculates the VAT from the net price and then adds it on will help you here. The
gross price will then be printed.
10.1 Variables-/Field-List
The variable list displays all variables available in the current project; for list type
projects, all available fields are also displayed.
The hierarchical list differentiates between variables, fields, database tables, user
variables and sum variables.
User-defined variables and fields can also be structured hierarchically. The contents
of variables normally remain unchanged at least throughout a page; fields change
from table row to table row.
If you want to assign variables or fields to existing objects, you can simply select the
variables and fields that you want in the list and drag them to the object with the
mouse (Drag & Drop). It inserts them automatically where possible. If you drag a
variable to a free area on the workspace, a new text object will be created there. The
size relates to the size of the last object whose size was changed.
201
Variables, Fields and Expressions
Figure 10.1: Variable list
10.2 The Elements of an Expression
Fixed text, variables, formulae, functions, operators and the like – generally referred
to below as "Elements of expressions" – are all inserted and combined by means of a
common dialog.
The formula wizard helps you with your entries in several ways:
202
Function syntax display: A tooltip appears describing the chosen function; it lists
the required parameters and shows the result type.
The Elements of an Expression
Auto complete: When you type a letter, the available functions, fields and
variables are listed that begin with this letter. Within functions, suitable values
are suggested for parameters.
Syntax coloring: Functions, parameters, operators and comments are shown in
different colors.
Automatic type conversion: Variable and field types are converted automatically
when inserted in existing expressions to ensure that the data type corresponds
to that expected.
Figure 10.2: Autocomplete in the formula wizard
10.2.1 Different Expression Modes
Please note that there are two ways of writing expressions. Which mode is being
used is set by the application.
On the one hand, there is the normal expression mode, in which you can enter
names of variables/fields and functions without brackets. Fixed text must be
enclosed in quotation marks. The individual variables/fields must be joined with the
"+" operator.
On the other hand, there is the extended mode, in which you can enter fixed text
without quotation marks. You must enclose variables with "<" and ">" and functions
with chevrons ("«" and "»").
203
Variables, Fields and Expressions
In this mode, you can insert the chevrons by clicking the "Insert chevrons" button
(e.g. if you want to enter a function directly". You can also use ALT+174/175. It is not
necessary to use an operator to join individual operators in this mode. The extended
mode is easier to use.
Figure 10.3: Extended mode
10.2.2 The Tabs
This dialog consists of a series of tabs, each containing different elements to be
edited.
Tab
Contains the elements
Data and Functions
The variables and functions available for this object type
Condition
Special dialog for defining IF-THEN-ELSE conditions
Text
Dialog for entering fixed text and options for setting tab stops (only
text objects)
Date Format
Available date formats
Number Format
Available number formats
Operators
Available logical operators
Colors
Available colors.
You will find an "Insert" button on each of these tabs with which you can add the
selected element to the editing line. A double-click on the relevant element has the
same effect. In addition, you can also add the elements to the editing line with Drag
& Drop (also in and from the function list).
For the different elements of an expression (variables, text, functions etc.), certain
rules apply for the way of writing and for joining individual elements to give an
expression. A wizard integrated in the dialog makes sure that these rules are
observed. For this reason, you should always add the different elements to the
editing line by means of the respective tab in this dialog. Thus, you should use the
"Data and Functions" tab to enter variables and the "Text" tab to enter text etc.
Experienced users can also enter the expression that they want directly in the edit
box or modify the text that is there (e.g. put something in brackets).
204
The Elements of an Expression
10.2.3 The Editing Line
The editing line contains the expression that you have compiled by means of the
various tabs, entered directly or created with Drag & Drop.
The expression is checked continuously as you create it to make sure that the syntax
is correct. Any syntax errors are shown in the information pane under the editing line,
together with an explanation of the cause of the error. The syntax checker will
normally produce an error until the expression is complete. Don't let this worry you.
When the expression is complete, the resulting text should be shown with the
Designer's sample data.
To make complex expressions clearer, you can split them across several lines with
RETURN. This has no effect on the result.
With the different buttons on the right next to the input field you can
mark brackets belonging to the formula expression.
mark the expression between matching brackets.
edit sum, user and collection variables.
Comment out or uncomment the selection
undo the last operation.
redo the last undo operation.
10.2.4 Inserting Data
There are different data types for variables and fields: "string", "number", "date",
"Boolean" (logical values), "picture" and "barcode". The data type is important if you
want to use data as parameters in functions as they normally only accept certain data
types. Thus you can only multiply a numeric value with a numeric value.
The "Data and Functions" tab includes an overview of all available variables and fields,
an icon indicating the data type in front of the variable as well as the available
functions.
You can filter the data by means of the input field above the data list.
To add a variable or field, double-click the data that you want, use the "Insert" button
or drag the variable/field to the editing line (also via the function list). The
variable/field in question will be added to the editing line in the correct syntax.
Repeat the above steps to add more variables/fields to your expression. If you want
to have spaces between the individual variables, e.g. to separate FIRST_NAME and
NAME, make sure that you enter this space in the editing line.
You can also insert variables by "dragging" the one you want to the target object in
the workspace with Drag & Drop. The variable is then automatically added to the
object as a new line.
205
Variables, Fields and Expressions
Figure 10.4: Joining variables and free text
10.2.5 Insert Fixed Text
Another important element in expressions is fixed text, with which you can prefix a
variable with an identifier, e.g. "Telephone: 1234567".
With the "Text" tab, you can insert free text in your expression, set tab stops and
page breaks.
Enter the text that you want and click "Insert" to add your entry to the editing line. The
text will be placed automatically in quotation marks.
In the below example, the fixed text "Name" is first inserted via the "Text" tab followed
by the variables "Customer.Firstname" and "Customer.Lastname" by means of the
"Data and Functions" tab. The "Name:" text will then be printed first followed by title,
first name and last name from the database.
Please consider that spaces that are to appear between variables or between
variables and text, e.g. as separators, also count as "fixed text".
Depending on the mode, variables and fixed text cannot be simply placed together
but must be joined by the "+" joining operator. In this example, the fixed text "Name"
is joined to the "Customer.Firstname" variable with the "+" operator.
206
The Elements of an Expression
Figure 10.5: Fixed text in the formula wizard
Inserting Linefeed
With the "Linefeed" button, you insert a line break ("¶") into your text line.
Figure 10.6: Insert line break by clicking the button
However, such a break only has an effect if you have specified that breaks are
allowed for the object in question (line of a text object or column of a table object). In
this case, the words that don't fit in the line/column are continued on a new line
causing the lines below to be moved down by one line. (Caution: If the text contains
just one long word, it will not be broken but will be truncated instead).
With text objects, the value of the "Line Wrap" property in the property list for the
respective paragraph must be "Wrap".
With table objects, the value of the "Fit" property in the property list for the respective
column must be "Wrap".
Inserting Tab Stops
Tab stops are only allowed in text objects. Therefore this button is not displayed in
table objects.
207
Variables, Fields and Expressions
Figure 10.7: Insert tab stop by clicking the button
Since a tab stop is also a character, it must also be enclosed in quotation marks.
Alternatively, in this example, you can insert the tab stop with "Insert" to the existing
"Invoice date" text.
You create a tab stop with the "Tab" button and you define the position (in mm) and
alignment with the "Properties" button.
Figure 10.8: Tab properties
Only one tab stop can be inserted on each line. A tab stop causes the preceding text
to run only as far as the tab stop. A tab stop that is right aligned will cause the text
that follows it to be justified to the right. The distance from the left margin
determines the position of the tab stop.
10.2.6 Inserting Comments
You can add comments to formulas provided that this is supported by the
application. You can do this in two ways:
"/* <text> */" for comments in the middle of a formula
"/* <text>" for comments at the end of the formula. With this variation, all the
remainder of the formula becomes a comment – not just the line.
With the respective buttons to the right of the input field, you can directly comment
out or uncomment a selection.
Figure 10.9: Inserting comments
208
Working With Functions
10.3 Working With Functions
Functions open up countless possibilities and make defining expressions really
interesting. With the aid of these functions, you can calculate values, influence the
results of variables or their appearance, convert value types and perform many more
tasks.
10.3.1 Notation of Functions
Functions all use the same notation which is based on the BASIC programming
language:
return value = function(arguments)
You only specify the function and the arguments. Whether you use capitals or small
letters is irrelevant for the names of the functions, but not for the arguments.
Capitals or small letters are especially important when variables are used as
arguments.
It evaluates the expression and interprets it replacing the "function(arguments)" part
by the "return value".
I.e., the return value.is produced from the function(arguments) input line.
The elements have the following meanings:
Element
Meaning
Function()
The name of the respective function in its correct syntax. The brackets ()
for the arguments belong to the function name. The brackets must
always be present even if a function does not have any arguments.
Arguments
The values that a function uses in order to produce the return value. The
arguments follow the name of the function immediately without any
spaces in between. A function can have zero, one or more than one
argument(s). Functions usually expect arguments of a certain value type
(see below). It is important that the value types of the arguments
conform to the types expected by the function.
Return value
The result of a function. The type of the return value depends on the
function in question or the value types of the arguments.
10.3.2 Value Types
Value type
Explanation
Boolean
The logical values "True" or "False". If the condition is met, the result is
true otherwise false.
String
Any string. This string can contain letters, digits and special characters. It
must be placed in quotation marks ("") so that it can be differentiated
from names of variables.
Date
Date values according to the Julian calendar.
Number
A string containing only the digits 0 - 9, the decimal point and the minus
209
Variables, Fields and Expressions
sign, other characters are not permitted. Number strings do not have to
be enclosed in quotation marks.
Barcode
A string that is made up of the characters used for barcodes.
Picture
One of the supported picture formats.
RTF
Formatted text
10.3.3 Overview of the Functions
You will find an overview of the available functions on the "Data and Functions" tab.
You will also see an explanation of the currently selected function. The explanation
informs you of the nature of the function and the type of the arguments that it
expects (parameters).
If no arguments are given for a function, this means that the function does not
expect any (apart from the empty brackets). Otherwise, the function expects exactly
the number of arguments as shown. Arguments that appear in square brackets ([ ])
are optional, i.e. they can be omitted.
The argument "All" means that the argument can be any of the following types
(Boolean, string, date, number, picture, barcode, RTF).
You will find a more detailed explanation of all functions and parameters under
"Overview of Properties".
The functions available on the "Data and Functions" tab are sorted alphabetically or
shown by function group. There are the following function groups:
Numerical functions
Mathematic functions
Date functions
Character functions
Miscellaneous functions
Aggregate functions
Barcode functions
Conversion functions
Binary functions
Drawing functions
Project and print-dependent functions
Logical functions
Currency functions
You can filter the functions by means of the input field above the list of functions.
210
Working With Functions
When you select a function, you are shown a short explanation in the information
pane at the bottom. To add the function to the editing line, double-click the function
that you want or use the "Insert" button.
Figure 10.10: List of functions with help text and tooltip
10.3.4 Using Functions
Examples of some selected functions are explained below.
Convert a Number to a String With Str$()
The Str$ function converts a number to a string.
The (optional) second parameter specifies the length of the string. However, if this
number is too large for this format, the resulting string may be longer than you want.
If the number is too small, the result will be padded with spaces, according to the
sign, on the right (negative) or the left (positive).
The (optional) third parameter specifies the number of decimal places. If it is positive,
the number is shown as a floating point number or in scientific notation if it is
negative. If the third parameter is not specified, the number of decimal places is set
to 0 with integers and, for reasons of compatibility, to 5 with floating decimal values.
Examples:
211
Variables, Fields and Expressions
Str$ (Constant.Pi())
Str$ (Constant.Pi(),0,3)
Str$ (Constant.Pi(),6,3)
Str$ (-Constant.Pi(),12,-3)
Result: "3.14159"
Result: "3.141"
Result: " 3.141"
Result: "-3.141e+00"
To enter the expressions, proceed as follows:
1.
Locate the function in the alphabetical list or filter the functions by entering Str$
in the filter field above the list.
2.
Double-click the "Str$ ()" function to add it to the editing line. This also adds
placeholders for the parameters that are expected or accepted by the function.
The first of these parameters is selected automatically and you will be prompted
to replace this placeholder with a valid value. It's a good idea to first replace all
the function's parameters with the respective values before you go on to define
the expression.
Functions are also accepted as values for most parameters. The Designer takes
care of the correct syntax provided that you also use the "Functions" tab for
entering them.
3.
The "Constant.Pi()" function was inserted here as a parameter {number}.
4.
To insert a variable and a function at the same time, use the mouse to drag the
variable that you want to the relevant function folder (e.g. "Numerical functions").
The folder opens up automatically and you can select the function that you want
with the mouse. If you move the mouse upwards or downwards, the list scrolls
automatically in the corresponding direction. If you "drop" the variable onto a
function, the function will be inserted with the selected variable as the first
parameter.
Convert a String to a Number With Val().
The Val() function converts a string to a number. If there is an error, the result will be
0. The decimal point character must always be given as "."
Example:
Val ("3.141")
Result: 3.14
The "LocVal()" functions converts a string to a number and presents the result in a
format that is valid for the country.
Examples:
LocVal ("12.00","de-de")
Result: 12,00
LocVal ("12.00","en-us")
Result: 1200,00
Convert a String to a Date With Date()
The Date() function converts a string to a date. When doing so, the separator is
evaluated accordingly:
Example:
212
Working With Functions
Date ("04.07.1776")
Result: 04.07.1776
Convert a String to a Barcode With Barcode()
The Barcode() function converts a string to a barcode. This function can only be used
in a table or barcode object.
For the second parameter, the wizard offers you the possible barcode types as
autocomplete options. Some barcodes have special formats which must be adhered
to. You will find detailed information about this in chapter "Barcode Objects".
Example:
Barcode ("Hello World","GS1 128")
Convert a String to a Picture With Drawing()
The "Drawing()" function converts a string to an image file.
Example:
Drawing("sunshine.gif")
Truncate Strings
The "Left$()" function shortens a string from the left by a specified number of
characters. The "Right$()" function shortens a string from the right and the "Mid$()"
function cuts out part of the string.
The second parameter specifies the maximum number of places in the result.
Examples:
Left$ ("combit", 1)
Result: "c"
Mid$("combit",1,2)
Result: "om"
Right$("combit",3)
Result: "bit"
The "StrPos()" and "StrRPos()" functions return the position of the nth occurrence of a
search string in a string. You can supply a third parameter specifying which
occurrence of the search string is to be returned. The first character of the string
corresponds to position 0. This means that with this function, you can extract a
substring from the string, e.g. from the first space onwards.
Example:
Left$ ("John Smith",StrPos("John Smith"," "))
Result: "John"
The "Rtrim$()" function removes spaces at the end of a string, the "Atrim$()" function
removes them from the beginning and the end of a string.
Example:
RTrim$ ("Hello World
")
Result: "Hello World"
213
Variables, Fields and Expressions
Formatting a Data Value With Date$()
You can format date values with the Date$() function. To avoid having to enter the
formatting parameters yourself, you can select the parameters from a list on the
"Date Format" tab.
Figure 10.11: Example with Date$()
In this way, for example, you can specify whether days or months are to be written in
words or whether the year is to be output with two or four digits etc. You should
generally proceed by first selecting the date format that you want from the "Date
Format" tab and then insert the value to be formatted or the expression as a
parameter.
In the format list, you will see the respective formatting instructions on the left and
the respective result on the right.
The "Now()" function, which returns the current date, is selected automatically as the
date value. But if you want to format a different date value, simply replace "Now()"
with the value that you want. You will find more information about the "Date$ ()"
function under "Overview of Functions".
214
Working With Functions
Formatting a Number Value With Fstr$()
You can format numerical values with the Fstr$() function. To avoid having to enter
the formatting parameters yourself, you can select the parameters from a list on the
"Number Format" tab.
Figure 10.12: Example with Fstr$()
In this way you can specify the number of positions before and after the decimal
point, leading zeros and similar. You should generally proceed by first selecting the
number format that you want from the "Number Format" tab and then insert the value
to be formatted or the expression as a parameter. With complex expressions
containing calculations, make sure that you format the result and not a value in the
calculation formula. Otherwise you will not be able to perform the calculation.
In the format list, you will see the respective formatting instructions on the left and
the respective result on the right. You can add the number format that you want to
the editing line by double-clicking or with "Insert".
Insert the number value to be formatted as a parameter. You will find more
information about the "FStr$ ()" function under "Overview of Functions".
Formatting Currencies With LocCurrL$() or LocCurr$()
The "LocCurrL$()" function returns a string with the currency format and symbol that
is valid for the country. Insert the number value to be formatted as a parameter. The
215
Variables, Fields and Expressions
(optional) second parameter is the ISO 3166-Country code for the country whose
currency format is to be used.
Example:
LocCurrL$ (1000)
Result: "$1,000.00 "
The "LocCurr$()" function returns a string with the currency format that is valid for the
country but without the currency symbol.
Example:
LocCurr$ (1000)
Result: "1,000.00"
You will find more information about this function under "Overview of Functions".
Page Numbers With Page$() or Page()
The "Page$()" function returns the page number of the page being printed as a string.
Example:
"Page " + Page$ () + "/" + TotalPages$ ()
Result: Page 1/3
The "Page()" function returns the page number of the page being printed as a
number, thus giving you the opportunity of using an expression or a formula, e.g. in
conditions.
Example:
Cond(Page()>1, "Page " + Page$())
Counting Values With Count()
The "Count()" function counts the number of values of the first argument.
The first parameter specifies the values to be counted. The (optional) second
parameter specifies whether the values used for the calculation are to be deleted
after outputting.
Examples:
Count (Order_Details.ProductID)
Count (1)
Only Count Certain Values With CountIf()
The "CountIf()" function counts the number of values that satisfy the condition. You
should also use the "Distinct()" function if multiple occurrences of values are only to
be counted once.
The first parameter specifies the expression for the compare. The (optional) second
parameter specifies whether the values used for the calculation are to be deleted
after outputting (default: True).
Examples:
CountIf (Customers.Region="US")
CountIf (Distinct(Customers.Region="US"))
are only counted once
216
multiple occurrences of values
Working With Functions
CountIf (IsNull (Orders.OrderDate)) counts all values whose content is empty
Totaling With Sum()
The "Sum()" function adds up the values of the first argument.
The (optional) second parameter specifies whether the values used for the
calculation are to be deleted after outputting (default: True).
Example:
Sum (Order_Details.UnitPrice)
Obtaining User Input via a Dialog With AskString$()
You can use the "AskString$()" function to obtain information from the user during the
print process. A dialog appears when printing in which the user is required to enter
the information that you need.
The first parameter contains the text for the request that is to appear in the dialog.
With the second parameter, you can specify whether the user request is only to
appear once when printing starts (default: False), or whether the information is to be
requested for each individual data record (True).
The third parameter contains the string that you want to display as a recommended
value in the dialog's input field.
The last parameter specifies the maximum number of characters that the user may
enter. Example:
AskString$ ("Insert Subject",False,"Your request from " + Date$(Now()))
Figure 10.13: Input dialog with AskString$()
Appearance Conditions With Lastpage()
The "Lastpage()" Boolean function returns whether the actual page is the last page,
i.e. the result of this function is "True" or "False".
This function can only be used in footer lines of tables, as a condition in a layout
region condition, or in objects linked to a table. In all other cases, Lastpage() is
always "False".
Logical Conditions With Cond()
The "Cond()" and "If()" functions let you formulate a wide variety of conditions. The
first argument is a logical expression that is evaluated for truth. If the expression is
true, the second argument is returned as the result. If the expression is false, the
third argument is returned as the result.
217
Variables, Fields and Expressions
A simple example: Let us assume that you want to output the total of the article
prices on a page in an invoice footer line. You also want to output the grand total of
article prices on the last page.
Figure 10.14: Example of the use of Cond()
You enter this function in the formula wizard either directly in the editing line or via
the "Condition" tab.
1.
As a "condition" (1st parameter), enter the expression that is to be tested for
TRUE or FALSE. In our example, we want to use the "not Lastpage()" function to
determine whether this is the last page.
2.
As the "expression, if condition is TRUE" (2nd parameter), enter the expression
that is to apply if the above condition is TRUE. In our example, the condition is
true if this is not the last page and in this case the page total is to be output
(parameter of the "Sum()" function is "True").
3.
As the "expression, if condition is FALSE" (3rd parameter), enter the expression
that is to apply if the above condition is FALSE. In our example, the condition is
false if this is the last page and in this case the grand total is to be output
(parameter of the "Sum()" function is "False").
4.
If you have entered this function via the "Condition" tab, you can use the "Insert"
button to add the finished condition to your editing line.
218
Working With Operators
Working With Null Values
There are various functions for working with Null values (undefined field contents).
If there are Null values in an expression, the entire expression can become Null. To
prevent this, use the "NullSafe()" function for fields that could be empty (e.g.
salutation or title). This function checks to see whether the field value is Null and
returns a substitute value if this is the case; otherwise, it returns the result of the
expression.
Example:
Cond (Empty(COMPANY),NullSafe(FIRSTNAME)+ " " + NAME)
With the "IsNull()" or IsNullOrEmpty() function, you can check whether the value
passed to the function or the result of the expression is Null, i.e. an empty field.
Example:
Cond (IsNullOrEmpty(COMPANY),FIRSTNAME + " " + NAME)
You can set a Null value with the "Null()" function.
10.4 Working With Operators
Open the list of available operators by clicking the "Operators" tab. The operators are
used to join variables and free text to give more complex conditions and to perform
compares or calculations.
On the "Operators" tab, you will find the respective operators in the column on the
extreme left; the syntax is shown in the middle column and the value types with
which the respective operator can be used in the right column.
Operators join two or more values or variables to give a new value. In this way, you
can formulate arithmetic expressions (basic arithmetic operations) or logical
expressions. The value type of the result of an expression depends on the value type
of the individual elements of the expression.
The "+" operator has a special meaning. It is not only used for additions ("Number"
and "Date" (value types) but also for joining strings and fixed text ("string" value type).
You can combine multiple operations in one expression. The normal rules of
precedence apply in this case: Logical operators are evaluated before arithmetic
operators which are evaluated before relational operators. You must use brackets if
you want a different processing order. The "innermost" brackets are evaluated first.
The general processing hierarchy is
Priority
Operator
1
brackets ()
2
Functions
219
Variables, Fields and Expressions
3
logical operators
4
arithmetic operators
5
relational operators
Figure 10.15: Example of multiplying two fields
10.4.1 Arithmetic Operators
The familiar rules of precedence – multiplication and division before addition and
subtraction –- apply for arithmetic operators. The "Modulo" operator is evaluated first
followed by multiplication/division ("*" and "/") and finally addition and subtraction ("+"
and "-"). Example: NET_PRICE+(NET_PRICE*0.19)
Operator
Meaning
Data types
+
Addition
string, date, number
-
Subtraction
date, number
*
multiplication
number
/
Division
number
%
modulo (remainder with division)
number
220
Working With Operators
10.4.2 Relational Operators
Relational operators consist of two values of the same data type which are compared
with one another returning a true/false value. The result (return value) is the Boolean
value true or false. Example: Page()<>1
Operator
Meaning
Data types
>
Greater
string, number, date
>=
greater or equal
string, number, date
<
less than
string, number, date
<=
less than or equal
string, number, date
=
Equal
string, number, date
==
Equal
string, number, date
<>
not equal
string, number, date
!=
not equal
string, number, date
10.4.3 Logical Operators
A logical operator is a function that returns a true/false value. The result (return value)
is the Boolean value true or false.
Depending on the type of logical operator, the compound expression is true if both
joined expressions are true (AND conjunction) or if at least one of the joined
expressions is true (OR conjunction).
The rules of precedence are: Negations are evaluated first, then the "logical AND"
and finally the "logical OR".
Example: Zip code >=70000 AND zip code <=80000
Operator
Meaning
Data type
NOT or .NOT.
negation
Boolean
AND or .AND.
logical AND
Boolean
OR or .OR.
logical OR
Boolean
XOR or .XOR.
logical exclusive OR
Boolean
10.4.4 Formula Errors
The tool window "Formula errors" is opened automatically if errors are found when
the project is opened.
221
Variables, Fields and Expressions
Figure 10.16: Formula Errors window
The syntax and argument errors are listed in the section on the left. When an error is
selected, its location is shown in a tree diagram. Double-click on an error to open the
properties dialog and select the corresponding location. Double-clicks work for all
locations at which you can create a formula, i.e. for columns, paragraphs, properties,
sum variables etc.
When an error has been rectified, you can mark it as complete with the
corresponding button or click on the "Refresh list" button to regenerate the list of
errors.
222
Overview of Variables
11. Overview of LL Variables and LL Fields
There are several variables and fields automatically – depending on the application.
You will find the variables and fields in the "LL" sub-folders in the variable list.
11.1 Overview of Variables
Name
Explanation
LL.Color.*
Color value of the corresponding color.
LL.Device.Name
Identification of the output device (printer).
LL.Device.Page.Name
Designation of the selected paper size (example "A4").
LL.Device.Page.Size.cx
Physical page width of the output device in the project’s
unit of measure. Can be used in formulas to adjust the
size of objects dynamically to fit larger output formats.
Example: In the property list, set the Position.Left
property to the value 0 and the Position.Right property
to LL.Device.Page.Size.cx. The object will now always
occupy the total page width.
LL.Device.Page.Size.cy
Physical page height in the project’s unit of measure.
LL.Device.PrintableArea.Offset.cx
Width of the unprintable left margin in the project’s unit
of measure.
Example: In the property list, set the Position.Left
property to the value LL.Device.PrintableArea.Offset.cx.
The object will now always be positioned precisely at
the left margin of the printer's printable area.
LL.Device.PrintableArea.Offset.cy
Height of the unprintable top margin in the project’s
unit of measure.
LL.Device.PrintableArea.Size.cx
Printable page width in the project’s unit of measure.
LL.Device.PrintableArea.Size.cy
Printable page height in the project’s unit of measure.
LL.Scheme.*
Color value of the respective Design Scheme color.
LL.CountData
(not with multiple tables)
Number of data records transferred by the program.
This number also includes the data records that were
not printed because of their filter condition. This
counter is incremented for each data record.
LL.CountDataThisPage
(not with multiple tables)
Number of data records transferred by the program on
the current page. This number also includes the data
records that were not printed because of their filter
condition. This counter is incremented for each data
record.
223
Overview of LL Variables and LL Fields
LL.CountPrintedData
(not with multiple tables)
Number of records actually printed.
LL.CountPrintedDataThisPage
(not with multiple tables)
Number of data records actually printed on the current
page.
LL.CurrentContainer
Description of the current report container
LL.CurrentContainerItem
Value of an element's "Name" property in the report
container. Is used e.g. for display and layout region
conditions.
LL.CurrentLanguage
Returns the print language, e.g. "en-EN"
LL.CurrentTableColumn
Returns the index of the current column in the case of
multi-column projects.
LL.FilterExpression
Selected project filter.
LL.IsForcedPage
Specifies whether the page was forced due to the
"Minimum page count" project property.
LL.OutputDevice
Output medium. Can be used e.g. for formatting
objects for output in a particular way (e.g. "HTML",
"RTF", "PDF" etc.
LL.SortStrategy
224
Format
Value
PDF
HTML
RTF
MS Word
PowerPoint
SVG
Bitmap
EMF
TIFF
Multi-TIFF
JPEG
PNG
MS Excel
XPS
MHTML
XHTML/CSS
XML
Text
Pinwriter
Preview
Printer
File
Presentation
JQuery Mobile
PDF
HTML
RTF
DOCX
PPTX
SVG
PICTURE_BMP
PICTURE_EMF
PICTURE_TIFF
PICTURE_MULTITIFF
PICTURE_JPEG
PICTURE_PNG
XLS
XPS
MHTML
XHTML
XML
TXT
TTY
PRV
PRN
FILE
PRES
JQM
Sort order selected by the user. This function is
Overview of Fields
deprecated and should no longer be used.
ReportSection.Description
Returns the name of the section of the report: index or
table of contents
ReportSection.Maximum
DirectoryDepth
(only table of contents)
Value of the property "max. Contents depth" in the
project options.
ReportSection.PageRelativ
(only index)
Relative number of pages for the index: the page
numbers start at 1.
@LLFAX.RecipName
Fax dispatch: Recipient name
@LLFAX.RecipNumber
Fax dispatch: Recipient's fax number
@LLFAX.SenderBillingCode
Fax dispatch: Sender's billing code
@LLFAX.SenderCompany
Fax dispatch: Sender company
@LLFAX.SenderDept
Fax dispatch: Sender department
@LLFAX.SenderName
Fax dispatch: Sender's name
11.2 Overview of Fields
Name
Explanation
LL.ChartObject.ArcIndex
(only with pie charts)
Index of the segment. The segments are sorted by size.
The largest segment has index 1.
LL.ChartObject.ArcPerc
(only with pie charts)
Size of the segment in percent.
LL.ChartObject.ArcTotal
(only with pie charts)
Absolute value of the entire data volume.
LL.ChartObject.ArcTypeIsOthers
(only with pie charts)
True, if the current segment is the "other" segment.
LL.ChartObject.ArcValue
(only with pie charts)
Absolute value of the current segment.
LL.ChartObject.AxisCoordinate
(only with charts)
Coordinate value (can be used in axis labels).
LL.ChartObject.AxisPercentage
(only with charts)
Coordinate value in percent (can be used in axis labels).
LL.ChartObject.ValueIsOthers
(only with rel. stacked bar charts)
True, if the current bar is the "other' bar.
LL.ChartObject.Shape.Attribute
Shapefile Attributes
LL.CurrentRelation
(only with multiple tables)
Description of the current relationship to the higherlevel table.
225
Overview of LL Variables and LL Fields
LL.CurrentSortOrder
(only with multiple tables)
Description of the current sort order in the table.
LL.CurrentTable
(only with multiple tables)
Identification of the table currently in use.
LL.CurrentTablePath
(only with multiple tables)
Identification of the table currently in use (hierarchically
with higher-level tables), e.g.
Customers.Orders.Order_Details.
LL.FCountData
Number of data records transferred by the program.
This number also includes the data records that were
not printed because of their filter condition.
LL.FcountDataThisPage
Number of data records transferred by the program on
the current page. This number also includes the data
records that were not printed because of their filter
condition.
LL.FcountPrintedData
Number of records actually printed.
LL.FcountPrintedDataThisPage
Number of data records actually printed on the current
page.
LL.Relations.*
(only with multiple tables)
Available relationships.
LL.TableLineIndex
Returns the index of the data line in a table.
LL.VisibleTableLineIndex
Returns the index of the visible data line in a table.
LL.Tables.*
(only with multiple tables)
Available tables.
Reference.Level
Level in the table of contents or index. Can be defined
using the appropriate property. See also "Report
Sections" in Chapter "Page Layout".
Reference.PageIndex
Page number for the index entry.
Reference.PageNumber
Page number for the directory entry.
Reference.Text
Text to the table of contents or index to be displayed.
Can be defined via the corresponding property.
226
Overview of Fields
12. Overview of Functions
All functions are listed here alphabetically. In the formula wizard, you also have an
additional list sorted by functional group.
Abs
Purpose:
Calculate the absolute value of a number. A negative value will be returned as
positive and a positive value will remain unchanged.
Parameter:
Number
Return value:
Number
Example:
Abs(-3)
Result:3
Abs(3.12)
Result: 3.12
AddDays
Purpose:
Adds the given number of days to the date, or subtracts the number of days
when a negative value is entered.
Parameter:
Date
Number
Return value:
Date
AddHours
Purpose:
Adds the given number of hours to the date, or subtracts the number of hours
when a negative value is entered.
Parameter:
Date
Number
Return value:
Date
227
Overview of Functions
AddMinutes
Purpose:
Adds the given number of minutes to the date, or subtracts the number of
minutes when a negative value is entered.
Parameter:
Date
Number
Return value:
Date
AddMonths
Purpose:
Adds the given number of months to the date, or subtracts the number of
months when a negative value is entered.
Parameter:
Date
Number
Return value:
Date
AddSeconds
Purpose:
Adds the given number of seconds to the date, or subtracts the number of
seconds when a negative value is entered.
Parameter:
Date
Number
Return value:
Date
AddWeeks
Purpose:
Adds the given number of weeks to the date, or subtracts the number of
weeks when a negative value is entered.
Parameter:
Date
228
Overview of Fields
Number
Return value:
Date
AddYears
Purpose:
Adds the given number of years to the date, or subtracts the number of years
when a negative value is entered.
Parameter:
Date
Number
Return value:
Date
Alias$
Purpose:
Returns the value that is specified for the key (first parameter) in the
key/value-pairs (second parameter).
Parameter:
String
Expression for the value to be searched.
String
List of values (Form: <key=value>| [<key=value>]. To be
able to use "|" or "=" in the value or key, place a "\" infront of
it.
String (optional) Default if the value cannot be found.
Return value:
String
Example:
Alias$("USA", "DEU=Deutschland|USA=United States of America|GB=United
Kingdom") Result: United States of America
ApplicationPath$
Purpose:
Returns the path of the application.
Parameter:
Boolean
(optional) Defines if the path is returned including the file
name (Default: False)
Return value:
229
Overview of Functions
String
Example:
ApplicationPath$()
Result: "C:\Program Files (x86)\combit\LL\"
ArcCos
Purpose:
Calculates the arccosine of the value.
Parameter:
Number
Value
Number
(optional) Mode (0=Degree, 1=Radian). Default: 0.
Return value:
Number
Example:
ArcCos (0)
Result: 90
ArcSin
Purpose:
Calculates the arcsine of the value.
Parameter:
Number
Value
Number
(optional) Mode (0=Degree, 1=Radian). Default: 0.
Return value:
Number
Example:
ArcSin (0.5)
Result: 30,00
ArcTan
Purpose:
Calculates the arccotangent of the value.
Parameter:
Number
Value
Number
(optional) Mode (0=Degree, 1=Radian). Default: 0.
Return value:
Number
Example:
230
Overview of Fields
ArcTan (1)
Result: 45,00
Asc
Purpose:
Returns the ASCII-Code of the first character of the string.
Parameter:
String
Return value:
Number
Example:
Asc("A")
Result: 65
AskString$
Purpose:
With this function, information can be requested from the user during
printing. A typical example of use for this function would be in a project for a
bank transfer form. Information that remains constant, such as name and
bank details of the sender, can be integrated directly into the project as fixed
text or variables. The transfer amount, however, will almost always be
different. With the function AskString$(), this information can be requested
from the user during printing.
At print time, a dialog will appear in which the needed information can be
entered.
The dialog allows the entered value to be carried over. Abort with "Cancel".
With the button "All", the entered value will be automatically used for all future
result for the AskString$ function during thus print job. This is useful when the
value remains constant over all records.
Parameter:
String
The first parameter contains some descriptive text that will
appear in the dialog. Since this is a formula, fixed text must
be entered in quotation marks, for example "Transfer
amount:”. This first parameter must be entered, all
remaining parameters are optional. If no other parameter(s)
is/are entered, the first string is also the default setting for
the user input.
Boolean
(optional) The second parameter allows you to define
whether the dialog should be shown once prior to printing
(default, FALSE), or if the dialog should be shown for each
record (TRUE).
231
Overview of Functions
String
(optional) The third parameter contains the string that
appears as the recommended value for the user input. Since
this is a formula, fixed text must be entered in quotation
marks, for example "50.00 USD".
Number
(optional) The last parameter defines the number of
characters that can be entered by the user. A value of 16, for
example, allows the user to enter a maximum of 16
characters.
Return value:
String
Example:
AskString$("Transfer amount",True,"50.00 USD",16)
Opens a dialog with the title "Transfer amount”, a recommended value of
"50.00 USD” and a maximum of 16 characters. Since the second parameter is
TRUE, the dialog will be shown for each record to be printed.
AskStringChoice$
Purpose:
Prompts the user to choose a value for the specified variable from a
combobox at print time.
Parameter:
String
Text, which is displayed and should specify what is to be
entered.
Boolean
(optional) Sets whether the dialog should be shown once
prior to printing (default, FALSE), or if the dialog should be
shown for each record (TRUE).
String
(optional) The combobox entries. The single entries of the
combo box are separated by "|". If one of the entries is '***'
(three asterisks), the text is editable. So a new value which
may be different from the list items can be entered.
Number
(optional) Maximum length (Default: 8192 characters).
Return value:
String
Example:
AskStringChoice$ ("Document type".F.,"Offer|Invoice|Delivery note|***)
ATrim$
Purpose:
Removes spaces from the beginning and end of a string.
232
Overview of Fields
Parameter:
String
Return value:
String
Example:
Atrim$(" combit GmbH
")
Result: combit GmbH
Avg
Purpose:
Generates the mean of the set of values that is produced by the first
argument.
Parameter:
Number
Expression of the value to be calculated.
Boolean
(optional) TRUE: After the output, the values which were
stored for the calculation are deleted. (default: TRUE).
Please note that the stored calculation values are generally
deleted for every (sub)table end. The second parameter only
decides whether the values are already deleted within the
table.
Return value:
Number
Example:
Avg(Order_Details.Quantity*Order_Details.UnitPrice)
Barcode
Purpose:
This function converts a string to a barcode.
Parameter:
String
Barcode value (contents)
String
Barcode type. The possible barcode types will be listed by
the auto-complete function of the wizard. If the barcode
cannot be correctly interpreted it will not be printed. Some
barcodes require special formats that must be used. Further
information can be found in Chapter "Supported Barcode".
Return value:
Barcode
Example:
Barcode(Upper$(Name),"3of9")
233
Overview of Functions
Barcode$
Purpose:
Returns the text contents of a barcode.
Parameter:
Barcode
Return value:
String
Example:
Barcode$(BC_3OF9)
Result: "Item 4711"
BarcodeType$
Purpose:
Returns the type of the barcode as a string.
Parameter:
Barcode
Return value:
String
BasedStr$
Purpose:
Returns the value to any radix.
Parameter:
Number
Value.
Number
Radix (2 to 36).
Number
(optional) Minimum length of the string (without optional
prefix). 0 for the minimal length (Default).
Boolean
(optional) Defines if a prefix ('0b' for radix 2, '0o' for radix 8,
'0x' for radix 16) is inserted before the string (Default: False).
Return value:
String
Example:
BasedStr$ (1,2,1,True)
BinaryAND
Purpose:
234
Result: 0b1
Overview of Fields
Links the two (integer) parameters binary with 'and' and returns the result.
Parameter:
Number
Value.
Number
Value.
Return value:
String
Example:
BinaryAND (01,10)
Result: 0
BinaryAND (10,11)
Result: 10
BinaryNOT
Purpose:
Negates the value binary and returns the result.
Parameter:
Number
Value.
Return value:
String
Example:
BinaryNOT (10)
Result: 5
(ten equivalent 1010, five equivalent 0101)
BinaryOR
Purpose:
Links the two (integer) parameters binary with 'or' and returns the result.
Parameter:
Number
Value.
Number
Value.
Return value:
String
Example:
BinaryOR (01,10)
Result: 11
BinaryOR (10,11)
Result: 11
BinarySHL
Purpose:
235
Overview of Functions
Shifts the value binary to the left.
Parameter:
Number
Value.
Number
Number of bits, the value is shifted.
Return value:
String
Example:
BinarySHL (1,1)
Result: 2
BinarySHR
Purpose:
Shifts the value binary to the right.
Parameter:
Number
Value.
Number
Number of bits, the value is shifted.
Return value:
String
Example:
BinarySHR (2,1)
Result: 1,00
BinaryXOR
Purpose:
Links the two (integer) parameters binary with 'exclusive or' and returns the
result.
Parameter:
Number
Value.
Number
Value.
Return value:
String
Example:
BinaryXOR (01,10)
Result: 11
BinaryXOR (10,11)
Result: 1
BMPMapToGray
Purpose:
236
Overview of Fields
Converts the picture to greyscales. Only the BMP-format is supported.
Parameter:
Picture or String
Return value:
Picture
Example:
BMPMapToGray ("sunshine.gif")
BMPRotate
Purpose:
Rotates a picture by the given degree. Only the BMP-format is supported.
Parameter:
Picture or String
Number
Rotation angle
Number
(optional) Mode (0=Degree, 1=Radian)
Return value:
Picture
Example:
BMPRotate(Article.Picture,90)
Capitalize$
Purpose:
Returns a string in which the first letter of the individual words is a capital
letter and the rest are small letters.
Parameter(s):
String
Return value:
String
Example:
Capitalize$ (Product.Category)
Result: “Tea, Coffee, And Soft Drinks“
Case$
Purpose:
Converts a number, dependant upon the value, into a string. Assignment is
made with a formatting string that contains the replacement string for the
number values in ascending order.
237
Overview of Functions
Parameter:
Number
Number to be converted (n). The n-th value of the string will
be copied to the return value string. If enough values do not
exist, the string will remain empty.
String
Collection of strings separated by a particular character. If a
third parameter does not exist, this is the "|" character,
otherwise the first character of this parameter.
String
(optional) Separator for the formatting string (default: "|")
Return value:
String
Example:
Case$(Page(),"0|I|II|III|IV|V|VI|VII|VIII|IX|X")
Result: "III", if Page() = 3
Ceil
Purpose:
Calculates the next bigger integer based on the given value. See also function
Floor().
Parameter:
Number
Value.
Return value:
Number
Example:
Ceil(5.6)
Result: 6
Century
Purpose:
Returns the century of the date.
Parameter:
Date
Boolean
(optional) sets whether the calculation should be carried out
'simply' (century starts with year 0) or 'historically' (century
starts with year 1). Default: False
Return value:
Number
Example:
Century(Date("01.01.2000"))
238
Result: 20
Overview of Fields
Century(Date("01.01.2001"))
Result: 21
Century(Date("01.01.2000"),True)
Result: 21
ChangeLightness
Purpose:
Changes the lightness of the given color value.
Parameter:
Number
Color (e.g. per RGB function)
Number
Factor by which the color is darkened or brightened. E.g.
the color is half as bright with '0.5' and twice as bright with
'2'.
Return value:
Number
Example:
ChangeLightness(LL.Color.Red,2)
CheckMod10
Purpose:
Calculates the modulo 10 checksum digit of the string. A special function with
the weight values "{ 0, 9, 4, 6, 8, 2, 7, 1, 3, 5 }" for the corresponding digits.
This is used in some barcodes.
Parameter:
String
A string of digits.
Return value:
Number
Chr$
Purpose:
Converts a number to a character. This character has the entered number as
its ASCII-Code . For Unicode, the value is the Unicode code point. See also
www.unicode.org.
Parameter:
Number
Number
(optional) Defines the type of the parameter. 0=multibyte
character sets, 1=Unicode. Default is Unicode.
Return value:
String
239
Overview of Functions
Example:
Chr$(64)
Result: "@"
ChrSubst$
Purpose:
Searches a string for a string that is contained in the second parameter. Every
occurrence of this string will be replaced by the string defined in the third
parameter. If no third parameter exists, the strings will be removed.
Parameter:
String
String
String
(optional)
Return value:
String
Example:
ChrSubst$("Otto", "Oo", "_")
Result: "_tt_"
ChrSubst$("Normalconsumer", "aeiou","??") Result: "N??rm??lc??ns??m??r"
ChrSubst$("Normalconsumer", "aeiou")
Result: "Nrmlcnsmr"
ChrSubst$("3.1415926535",".",",")
Result: "3,1415926535"
Cond
Purpose:
Allows to define conditions. The first parameter is a logical expression that
will be evaluated as "True” of "False”. If the first expression is "True”, the
second expression will be returned as the result. If the expression is "False”,
the third expression will be returned as the result. If no third expression is
entered, the return value will assume the following standard values,
dependent upon its type:
240
2. Argument Type
Return value if expression = False
Boolean
False
String
"" (empty String)
Date
Julian Date value 0
Number
0
Picture
"" (empty String)
Barcode
"" (empty String)
Overview of Fields
Parameter:
Boolean
All
All
(optional) The third parameter must be the same type as the
second parameter.
Return value:
All
Example:
Cond(COUNTRY<>"USA",COUNTRY_LONG)
Cond(PRICE=0,"on request",Str$(PRICE,0,2))
Cond(empty(COMPANY),SALUTATION,COMPANY)
Constant.Pi
Purpose:
Returns the value of Pi.
Parameter: Return value:
Number
Example:
Constant.Pi()
Result: 3,14159 (depending on the number of decimals)
Contains
Purpose:
Evaluates if a string contains another string (second parameter).
Parameter:
String
String
Number
optional: 0 for case-sensitivity, 1 for ignoring. Default: 0.
Return value:
Boolean
Example:
Contains("Itemnumber: 12345", "1234")
Result: True
Continued
Purpose:
241
Overview of Functions
Indicates that a text or RTF-object had a page break. This means that the
current page is a result of the page break.
Parameter:
Return value:
Boolean
Cos
Purpose:
Calculates the cosine of the value.
Parameter:
Number
Value
Number
(optional) Mode (0=Degree, 1=Radian). Default: 0.
Return value:
Number
Example:
Cos (90)
Result: 0
Count
Purpose:
Counts the number of values of the first argument. With this function, all Null
values in the argument are included in the count. Use the CountIf() function
when you want to disregard Null values.
Hint: Sum variables (see "Sum Variables") are an alternative way of creating
counters. Sum variables are principally applicable to whole tables. Aggregate
functions principally table specific.
Parameter:
All
Values to count (sets the value to count). Needed to define
the table (subtable) for which the records shall be counted.
Boolean
(optional) TRUE: The values which were stored for the
calculation are deleted after output. (default: TRUE). Please
note that the stored calculation values are generally deleted
for every (sub)table end. The second parameter only decides
whether the values will be already deleted within the table.
Return value:
Number
Example:
Count(Order_Details.ProductID)
242
Overview of Fields
NthLargest(Article.Price,Count(Distinct(Artikel.Stkpreis),True)-1, True)
Calculates the second-smallest value, only taking repeated values into
account once.
CountIf
Purpose:
Counts the number of values that comply with the condition. Use the function
Distinct() when repeated values are only to be counted once.
Parameter:
Boolean
Expression for the comparison.
Boolean
(optional) TRUE: The values which were stored for the
calculation are deleted after output. (default: TRUE). Please
note that the stored calculation values are generally deleted
for every (sub)table end. The second parameter only decides
whether the values will be already deleted within the table.
Return value:
Number
Example:
CountIf(Customers.Region="EMEA")
CountIf(IsNull (Orders.OrderDate)) counts all values with empty fields.
Crosstab.Cells.Avg
Purpose:
Returns the average of the cell contents. Only available in crosstab objects.
Parameter:
Boolean
(optional) True: Only defined values are entered into the
calculation (Default: False). Defined values: if you are, for
example, analyzing customers and quarters, the quarters
without turnover constitute an undefined value and can be
treated separately in the calculation.
Number
(optional) Row layer (0= bottom layer or innermost group,
1= next lowest, ...). Default: 0.
Number
(optional) Column layer (0= bottom layer or innermost
group, 1= next lowest, ...). Default: 0.
Return value:
Number
243
Overview of Functions
Crosstab.Cells.Max
Purpose:
Returns the largest value of the cell contents. Only available in crosstab
objects. For the parameters and their meaning, see function
Crosstab.Cells.Avg().
Crosstab.Cells.Min
Purpose:
Returns the smallest value of the cell contents. Only available in crosstab
objects. For the parameters and their meaning, see function
Crosstab.Cells.Avg().
Crosstab.Cells.Sum
Purpose:
Returns the sum of the cell contents. Only available in crosstab objects. For
the parameters and their meaning, see function Crosstab.Cells.Avg().
Crosstab.Col$
Purpose:
Returns the column header for the cell currently being output. Only available
in crosstab objects.
Parameter:
Number
(optional) Column layer (0= lowest layer or innermost group,
1= next lowest, ...). Default: 0.
Return value:
String
Crosstab.Col
Purpose:
Returns the column index for the cell currently being output. Only available in
crosstab objects.
Parameter:
Boolean
Return value:
Number
244
(optional) True: layer (only cells in this layer count), Default:
False.
Overview of Fields
Crosstab.Row$
Purpose:
Returns the row header for the cell currently being output. Only available in
crosstab objects.
Parameter:
Number
(optional) Row layer (0= lowest layer or innermost group,
1= next lowest, ...). Default: 0.
Return value:
String
Crosstab.Row
Purpose:
Returns the row index for the cell currently being output. Only available in
crosstab objects.
Parameter:
Boolean
(optional) True: layer (only cells in this layer count), Default:
False.
Return value:
Number
Crosstab.Value
Purpose:
Returns the cell's content.
Parameter: Return value:
Number
CStr$
Purpose:
Formats a number according to a format string. This is identical to the
formatting information for the function printf() in the language C. The first
parameter is a number of double precision, and the conversion operator can
assume i.e. the following values: 'f', 'g', 'G', 'e', 'E'.
Parameter:
Number
String
format string in C-notation, i.e. '%<format>f'.
245
Overview of Functions
Return value:
String
Example:
CStr(Pi,"%5.1f")
Result: " 3.1"
CStr(100*Pi,"num: %g")
Result: "num: 3.141593e+02"
CurrentDataLineIndex
Purpose:
Returns the continuous index of the output data lines of a table.
Parameter:
String
Tabel name (incl. hierarchy). Default: active table.
Return value:
Number
CurrentLineIndex
Purpose:
Returns the continuous index of the line definition where the function is used.
Lines that are hidden via a condition won´t be counted.
Parameter: Return value:
Number
CurrentLineTypeIndex
Purpose:
Returns the continuous index of the line type (Header, Footer, Data, …) where
the function is used. Blocks that are hidden via a condition won´t be counted.
Parameter: Return value:
Number
Date
Purpose:
Converts a string to a date.
▪
246
If the string Contains a dot ".", it will be read in the "d.m.y" format (German).
Overview of Fields
▪
If the string contains a diagonal slash "/", it will be read in the "m/d/y"
format (US English).
▪
If the string contains a dash "-", if will be read in the "y-m-d" format (ANSI).
▪
If the input cannot be correctly interpreted, then the date represents a
value that is larger than all other values, (1e100). The return value can be
evaluated for correctness using "JulianToDate(1e100)".
▪
When one or two digits represent the year, all values under 30 will be
applied to the 21st century (20xx) and all values over 30 will be applied to
the 20th century (19xx).
Parameter:
String
Return value:
Date
Example:
Date("17.10.2015")
Date("10/17/2015")
Date("2015-10-17")
Date$
Purpose:
Converts a date, using a format string, into an appropriately formatted string.
Composition of the format string: this is a normal string into which
placeholders can be embedded.
Place holder
Description
%d
Day (1..31)
%<n>d
Day to <n> digits
%0<n>d
Day to <n> digits, filled on left with '0's
%w
Weekday (1..7)
%<n>w
Weekday to <n> digits
%0<n>w
Weekday to <n> digits, filled on left with '0's
%W
Week of year
%<n>W
Week of year to <n> digits
%0<n>W
Week of year to <n> digits, filled on left with '0's
%m
Month (1..12)
247
Overview of Functions
%<n>m
Month to <n> digits
%0<n>m
Month to <n> digits, filled on left with '0's
%y
Year
%<n>y
Year, to <n> digits
%0<n>y
Year, to <n> digits, filled on left with '0's
%q
Quarter
%D
Weekday, written out
%M
Month, written out
"%e", "%<n>e"
Year in the local calendar (Japan: Emperor's year)
"%g", "%<n>g"
Era of the local calendar (Japan: Emperor’s era)
"%g", "%1g"
Single letter, Latin letters
"%gg", "%2g"
Single letter, localized
"%ggg", "%3g"
Long name, localized
"%gggg", "%4g"
Long name, Latin letters
"%x"
Localized date, short form
%H
Hours in 24h-format
%h
Hours in 12h-format
%<n>h
Hours in <n> digits
%i
Minutes
%<n>i
Minutes in <n> digits
%s
Seconds
%<n>s
Seconds in <n> digits
%PM
AM or PM
As long as one of the above formats is used, the optional third parameter can
be used to set the locale. If the second parameter contains a valid ISO 3166Country code, the third parameter can be used to set either the short "0” or
long "1” format.
Parameter:
Date
Value to be formatted.
String
(optional) Format description or ISO 3166-Country code.
String
(optional) ISO 3166-Country code or date format.
Return value:
String
248
Overview of Fields
Example:
Date$(Today(),"%D, %d/%m/%y")
Result: Thursday, 8/11/2015
Date$(Today(),"%2WthWeek; %D, %2d/%2m/%4y")
Thursday, 8/11/2015
Result:
45th
Week,
Date$(Today(),"%D, %3d/%02m/%4y")
Result: Thursday, 8/11/2015
Date$ (Now(),"%02h:%02i:%02s %PM")
Result: 04:03:50 PM
DateDiff
Purpose:
Returns the difference between two dates in days.
Parameter:
Date
First date value
Date
Second date value
Return value:
Number
Example:
DateDiff(Date("01.01.2015"),Date("01.03.2015"))
Result: 59
DateDiff$
Purpose:
Returns the difference between two dates in days as string.
Composition of the format string: this is a normal string into which
placeholders can be embedded.
Place holder
Description
%y
Number of years
%<n>y
Years to <n> digits
$y
String "Years"
%m
Number of months
%<n>m
Months to <n> digits
$m
String "month" or "months"
%w
Number of weeks
%<n>w
Weeks to <n> digits
$w
String "week" or "weeks"
249
Overview of Functions
%d
Number of days
%<n>d
Days to <n> digits
$d
String "day" or "days"
%h
Number of hours
%<n>h
Hours to <n> digits
$h
String "hour" or "hours"
%i
Number of minutes
%<n>i
Minutes to <n> digits
$i
String "minute" or "minutes"
%s
Number of seconds
%<n>s
Seconds to <n> digits
%.<n>s
Seconds with <n> decimals
$s
String "second" or "seconds"
Parameter:
Date
First date value
Date
Second date value
String
(optional) Format
Return value:
String
Example:
DateDiff$(Date("01/01/2015"),Date("03/01/2015"))
Result: 2 Months
DateHMS
Purpose:
Converts three numbers for hour, minute and second into a date.
Parameter:
Number
Hour
Number
Minute
Number
Second
Return value:
Date
250
Overview of Fields
DateInLeapYear
Purpose:
Checks if the given date is in leap year or not. The calculation is made
according to the proleptic gregorian calendar.
Parameter:
Date
Return value:
Boolean
Example:
DateInLeapYear("01.01.2015")
Result: True
DateInRange
Purpose:
Evaluates if the date falls within the entered time interval:
Minimum Date: JulianToDate(0)
Maximum Date: JulianToDate(1e100)
Parameter:
Date
Date to be evaluated.
Date
Lower limit of the test interval.
Date
Upper limit of the test interval.
Return value:
Boolean
Example:
DateInRange(Date("2015.10.20"),Date("2015.2.29"),Today())
Result: True
DateToJulian
Purpose:
Calculates the Julian value of a date. Each day (even those in the past) are
assigned a unique number.
Parameter:
Date
Return value:
Number
Example:
DateToJulian(Today())
Result: 2457023
251
Overview of Functions
DateYMD
Purpose:
Converts three numbers for day, month and year into a date.
Parameter:
Number
Year
Number
Month
Number
Day
Return value:
Date
Example:
DateYMD(2015, 11, 1)
Result: 01.11.2015
Day
Purpose:
Determines the day (1...31) of the month and returns it as a number.
Parameter:
Date
Return value:
Number
Example:
Day(Date("17.10.2015"))
Result: 17
Day$
Purpose:
Determines the day (1…31) of the month of a date and returns it as a string.
Parameter:
Date
Return value:
String
Example:
Day$(Date("17.10.2015"))
Decade
Purpose:
252
Result: "17"
Overview of Fields
Returns the decade of the date. Hint: The value is always relative to the start
of the century (1..10)!
Parameter:
Date
Boolean
(optional) sets whether the calculation should be carried out
'simply' (decade starts with year 0) or 'historically' (decade
starts with year 1). Default: False
Return value:
Number
Example:
Decade(Date("01.01.2015"))
Result: 2
Decade(Date("01.01.2000"))
Result: 10
Decade(Date("01.01.2000"),True)
Result: 1
DisplayValues$
Purpose:
Converts the report parameter contents into their display values (according to
the parameter configuration).
Parameter:
All
Report Parameter
Return value:
String
Example:
DisplayValues$ (@Param1)
Result: "Value1; Value2; Value3"
Distinct
Purpose:
Affects the higher order aggregate function (e.g. Sum(), Avg(), Count()...) and
causes equal values only to be used once in the calculation.
Parameter:
All
Return value:
All
Example:
Count(Distinct(Customers.Country))
253
Overview of Functions
Dow
Purpose:
Returns the day of the week to a number(1...7), 1=Sunday, 2=Monday, ...
Parameter:
Date
Return value:
Number
Example:
Dow(Date("04.07.1776"))
Result: 5
Dow$
Purpose:
Returns the day of the week as a string in accordance with the country
settings, "Sunday", "Monday", ...
Parameter:
Date
Return value:
String
Example:
Dow$(Date("04.07.1776"))
Result: Thursday
Drawing
Purpose:
Converts a string type file path into a picture.
Parameter:
String
Return value:
Drawing
Drawing$
Purpose:
Converts a picture into a string type file path.
Parameter:
Picture
Return value:
254
Overview of Fields
String
DrawingHeightSCM
Purpose:
Returns the height of the Picture in SCM units (1/1000 mm).
Parameter:
Picture
Return value:
Number
DrawingWidthSCM
Purpose:
Returns the width of the Picture in SCM units (1/1000 mm).
Parameter:
Picture
Return value:
Number
Empty
Purpose:
Evaluates if a string is empty. If it is empty, "True” will be the return value,
otherwise "False”. Useful, for example, to determine if the field "ADDRESS” is
empty, and if it is, in combination with the IF-THEN-ELSE condition cond(),
either print the contents of the field "ADDRESS” or "POBOX”.
The third parameter allows the removal of leading and trailing spaces. If this is
evaluated as "True”, a string consisting only of multiple spaces will be
recognized as empty.
Parameter:
String
Boolean
(optional)
Return value:
Boolean
Example:
Empty("xyz")
Result: False
Empty("")
Result: True
255
Overview of Functions
EndsWith
Purpose:
Checks whether the string in the first argument ends with the string in the
second argument.
Parameter(s):
String
String
Boolean
Specifies whether capitals/small letters are relevant. Default
value: False
Return value:
Boolean
Examples:
EndsWith ("Hallo World","rld")
Result: True
EndsWith ("Hallo World","llo")
Result: False
Evaluate
Purpose:
Evaluates the expression passed as parameter.
Parameter:
String
Return value:
All
Example:
Evaluate("3*4")
Result: 12
Evaluate("4-3")
Result: 1
Even
Purpose:
Evaluates if a number is even. If the number is even, "True” will be returned,
otherwise "False”.
Parameter:
Number
Return value:
Boolean
Example:
"Page number "+Cond(Even(Page()),"even","odd")
256
Overview of Fields
Exists
Purpose:
Checks if a variable or field is defined. Is often used in connection with
GetValue() and Evaluate().
Parameter:
String
Return value:
Boolean
Example:
Exists("CustomerID")
Result: False
If(Exists("Customer.Status"),Evaluate("Customer.Status"),"no customer status")
Exp
Purpose:
Calculates the exponential (ex).
Parameter:
Number
Return value:
Number
Example:
Exp(3)
Result: 20.08553692
Exp10
Purpose:
Calculates 10 raised to the power of number (10x).
Parameter:
Number
Return value:
Number
Example:
Exp10(3) Result: 1000
ExtractDate
Purpose:
Returns the argument as date without time.
257
Overview of Functions
Parameter:
Date
Return value:
Date
Example:
ExtractDate(Date('04.07.1776 12:00:00'))
Result: 04.07.1776
ExtractTime
Purpose:
Returns the argument as time without date.
Parameter:
Date
Return value:
Date
Example:
Date$(ExtractTime(Date('04.07.1776 12:11:10')), "%02h:%02i:%02s")
Result: 12:11:10
FirstHeaderThisTable
Purpose:
Returns whether the header of the table is being output for the first time. The
function can be used as an appearance condition for the header to prevent it
being printed more than once if the table continues onto the next page due to
space limitations. The header is then only printed at the beginning of the
table.
Parameter:
Return value:
Boolean
Floor
Purpose:
Calculates the next smaller integer based on the given value. See also
function Ceil().
Parameter:
Number
Return value:
258
Overview of Fields
Number
Example:
Floor(5.6) Result: 5
Frac
Purpose:
Calculates the fractional part of a number
Parameter:
Number
Return value:
Number
Example:
Frac(Pi)
Result: 0.1415926535
FStr$
Purpose:
Formats a number according to the format string.
These consist of the following characters ("if negative" refers to the value to
be formatted):
*
Digit or '*'-Prefix
$
Local currency symbol
-
Digit or sign, if negative
+
Digit or sign
(
Digit or '('-Prefix if negative
)
')'-Postfix if negative
#
Digit or space prefix
&
Digit or '0'
.
Decimal point
,
Comma, or space prefix
A prefix is a sign that precedes a value, when needed. The expression
Fstr$(1, "***") results in "**1". The value "1" is preceded by the
characters "**".
A Postfix is a character that, when needed, is placed after a number.
259
Overview of Functions
These formatting characters can be combined as needed. If the number is too
large for the desired format, a "*” string will be returned.
With the third
accomplished.
1
(optional)
parameter,
additional
formatting
can
be
Removal of leading spaces.
The use is similar to the functions RTrim$() and LTrim$().
2
Empty string if value Null.
3
Removal of leading spaces and empty strings when value is 0
Parameter:
Number
String
Format string
Number
(optional) Additional formatting
Return value:
String
Example:
Fstr$(3.142, "#")
Result: "3"
Fstr$(5003.1,"#,###.&&")
Result: "5.003,10"
Fstr$(3.142,"#.###")
Result: "3,142"
Fstr$(3.142,".######")
Result: "*******"
Fstr$(3.142,"(#.###)")
Result: " 3,142 "
Fstr$(-3.142,"(#.###)")
Result: "(3,142)"
Fstr$(3.142,"+#.###")
Result: "+3,142"
Fstr$(3.142,"-#.###")
Result: " 3,142"
Fstr$(-3.142,"-#.###")
Result: "-3,142"
Fstr$(3.142,"&&&.&&&")
Result: "003,142"
Fstr$(3.142,"***.***")
Result: "**3,142"
Fstr$(3.142,"$$$.$$$")
Result: "$$3,142"
Fstr$(3.142,"###.***")
Result: " 3,142"
Fstr$(5003.1,"#,###.&&")
Result: "5.003,10"
Fstr$(3.142,"#####")
Result: "
3"
GeometricAvg
Purpose:
Calculates the geometric average of the set of values that result from the first
parameter / formula.
Parameter:
260
Overview of Fields
Number
Expression for the value to be averaged.
Boolean
(optional) True: The values which were stored for the
calculation are deleted after output. (default: True). Please
note that the stored calculation values are generally deleted
for every (sub)table end. The second parameter only decides
whether the values are already deleted within the table.
Return value:
Number
GetValue
Purpose:
Returns the value of a variable or field. Is often used in connection with
Exists().
Parameter:
String
Return value:
All
Example:
GetValue("Customers.CustomerID") Result: 1234
If(Exists("Customer.Status"),Evaluate("Customer.Status"),"no customer status")
GetVar
Purpose:
Fetches a value that was set with the SetVar() function from the variable
repository. The purpose of these functions is to provide a simple buffer for
values. You shouldn't execute complex nesting with GetVar/SetVar or combine
both functions with each other - especially for header, footer and group lines
unexpected effects can occur here.
Parameter(s):
All
Description of variable
Return value:
All
Example:
GetVar ("Page")
Result: contents of "Page", set by SetVar()
HeatmapColor
Purpose:
261
Overview of Functions
Calculates a color value within a color gradient with 7 levels according to the
value of the first parameter..
Parameter:
Number
Value to be displayed
Number
Lower limit
Number
Upper limit
Return value:
Number
Example:
HeatmapColor (70,-60,100)
Result: Locates 70°F on
between -60°F and 100°F.
a
scale
Hour
Purpose:
Determines the hour of the date and returns it in number format. If the
parameter is not used, the hour of the print time will be returned.
Parameter:
Date
(optional)
Return value:
Number
Example:
A condition can evaluate if the current hour has the value "10”. The value of
the current hour must be determined and then compared to the value "10”.
Hour()=10
HSL
Purpose:
Calculates a color value in the HSL color space (Hue, Saturation, Lightness)
Parameter:
Number
Hue [0-360] (0°=red, 120°=green, 240°=blue)
Number
Saturation [0-1]
Number
Lightness [0-1] (0=no lightness, 1=full lightness)
Return value:
Number
Example:
HSL (0,0.5,1)
262
Result: Green with half-saturation and full lightness
Overview of Fields
HTMLtoPlainText$
Purpose:
Returns the plain and unformatted text of the HTML content.
Parameter:
String
HTML Content
Return value:
String
Hyperlink$
Purpose:
The function Hyperlink$ creates a hyperlink text that can be inserted using an
export module. When available, the hyperlink will only be embedded if the
third parameter returns a result of "True" (=default).
To optionally use a hyperlink only on a HTML page, you need to use the
variable LL.OutputDevice:
Hyperlink$("combit","http://www.combit.net",LL.OutputDevice="HTML")
If an object text contains the string:
<!--begin:hyperlink="target"-->"Display text"<!--end:hyperlink-->
then a hyperlink will be automatically created in the exported HTML page. The
hyperlink function automatically creates a string with the correct syntax.
Parameter:
String
Text
String
Hyperlink
Boolean
(optional) Embedded
Return value:
String
Example:
Hyperlink$("combit","http://www.combit.net")
If
see Cond
IssueIndex
Purpose:
Returns the Issue Index (1..) for display and layout region conditions, if
multiple issues are selected in the project parameters
263
Overview of Functions
Parameter:
Number
Return value:
Number
Int
Purpose:
Calculates the integer value of a number. The value will be truncated.
Parameter:
Number
Return value:
Number
Example
Int(3,1)
Result: 3
IsNull
Purpose:
Checks whether the transferred value or the result of the expression is Null,
e.g. an empty date field.
Parameter:
All
Return value:
Boolean
IsNullOrEmpty
Purpose:
Checks whether a string is empty or Null.
Parameter(s):
String
The string to be checked
Boolean
(optional) If the value is True, then spaces at the beginning
and end of the string are removed. Default value: False
Return value:
String
Example:
IsNullOrEmpty (“
264
“, True)
Result: True
Overview of Fields
Join$
Purpose:
Collection of strings separated by a particular character.
Parameter:
String
Collection of strings separated by a particular character.
String
(optional) Separator for the formatting string (default: ";")
Number
(optional) Maximum number of values ('...' will be appended).
Default: all values.
Boolean
(optional) True: The values which were stored are deleted
after output. (Default: True). Please note that the stored
values are generally deleted for every (sub)table end. The
second parameter only decides whether the values will be
already deleted within the table.
Return value:
String
JulianToDate
Purpose:
Interprets a number as a Julian date (each day is assigned a unique number)
and returns the appropriate date.
Parameter:
Number
Return value:
Date
Example:
JulianToDate(2457023)
Result: 01/01/2015
LangCase$
Purpose:
Returns one of the substrings according to the language that is set.
Parameter(s):
String
String that is returned if a localization string is not found. The
localization string must be a valid ISO 639 language code.
String
String with translation substrings, separated by "|" (or by an
optional third argument). Translation texts must be
formatted as follows "ISO 639 language code = translation
text|[ISO 639 language code = translation text|…]. If the
265
Overview of Functions
characters "|" or "=" are to be used in the value or the key,
they must be preceded by "\", e.g. "USA=He\=llo".
String
(optional) separator (default: "|")
Return value:
String
Example:
LangCase$("Hallo","USA=Hello|ESP=Hóla")
result: " Hóla " (with Spanish systems)
LastFooterThisTable
Purpose:
Returns whether the footer of the current table is being output for the last
time. This function can be used as an appearance condition for the footer, in
order to prevent the footer being printed if the table is continued on the next
page due to space limitations. The footer is then only printed on the last page
of the table.
Parameter:
Return value:
Boolean
Lastpage
Purpose:
Returns if the current page is also the last page. This function can only be
used in the footer lines of tables, in objects linked with tables or in the layout
regions condition! In all other cases, the result of Lastpage() is always False.
Parameter:
Return value:
Boolean
Example:
Cond(Lastpage(),"Total sum","Subtotal")
Left$
Purpose:
266
Overview of Fields
Reduces a string from the right so that only the number of characters set
under Number remain. If the original string is already small enough, it is not
affected.
Parameter:
String
The value to be shortened
Number
maximum number of positions of the result
Boolean
(optional) True: The cut off value is ended with "..." (Default:
False). With numbers < 3 the setting is ignored.
Return value:
String
Examples:
If you had a customer database that contains, amongst other things, the field
NAME for the surname. You now wish to search for all customers whose
surname starts with "C". To do this, you must first identify the starting letters.
Left$(NAME, 1)
Result: the first letter of the NAME string.
Left$("combit", 2)
Result: "co"
Left$("combit", 4,True)
Result: "c…"
Left$("combit", 2, True)
Result: "co"
Len
Purpose:
Returns the number of characters in a string.
Parameter:
String
Return value:
Number
Example:
Len("1234"+"12")
Result: 6
LibraryPath$
Purpose:
Returns the path of the List & Label DLL.
Parameter:
Booelan
(optional) Defines if the path is returned including the file
name (Default: False)
Return value:
String
267
Overview of Functions
Example:
LibraryPath$()
result: "C:\Program Files (x86)\combit\LL\"
LoadFile$
Purpose:
Outputs the contents of the file as a string.
Parameter:
String
String
(optional) When the file is not available, the value set here is
used.
Return value:
String
Example:
LoadFile$("C:\log.txt","File not found!")
Locale$
Purpose:
Returns information about the country settings, for example currency,
decimals, separators, language and country code. The code for the
appropriate country is entered in the second parameter, if no second
parameter is used the default country settings will be used.
Parameter:
Number
Index of Locale Entry
http://msdn.microsoft.com/en-us/library/bb507201.aspx
String
(optional) Country code/ISO Code of country, whose format
is to be used. Format: <ISO639>-<ISO3166> e.g. de-de or
en-us.
http://msdn.microsoft.com/en-us/library/0h88fahh%28VS.85%29.aspx
Return value:
String
Example:
Locale$(42,"en-us")
Result: "Monday"
LocCurr$
Purpose:
Returns a string with the valid currency format without the currency symbol
for the entered country.
268
Overview of Fields
Parameter:
Number
Value to be formatted
String
(optional) Country code/ISO Code of country, whose format
is to be used. Format: <ISO639>-<ISO3166> e.g. de-de or
en-us.
http://msdn.microsoft.com/en-us/library/0h88fahh%28VS.85%29.aspx
Return value:
String
Example:
LocCurr$(123,"en-us")
Result: "123.00"
LocCurrL$
Purpose:
Returns a string with the valid currency format and currency symbol for the
entered country.
Parameter:
Number
Value to be formatted
String
(optional) Country code/ISO Code of country, whose format
is to be used. Format: <ISO639>-<ISO3166> e.g. de-de or
en-us.
http://msdn.microsoft.com/en-us/library/0h88fahh%28VS.85%29.aspx
Return value:
String
Example:
LocCurr$(123,"en-us")
Result: "$123.00"
LocDate$
Purpose:
Returns a string with the valid date format for the entered country.
Parameter:
Date
Value to be formatted
String
(optional) Country code/ISO Code of country, whose format
is to be used. Format: <ISO639>-<ISO3166> e.g. de-de or
en-us.
http://msdn.microsoft.com/en-us/library/0h88fahh%28VS.85%29.aspx
Number
(optional) 0=Short (default), 1=Long, 2=Short, alternative
calendar, 3=Long, alternative calendar
Return value:
269
Overview of Functions
String
Example:
LocDate$ (Date("04.07.1776"),"en-us")
Result: 07/04/1776
LocDate$ (Date("04.07.1776"),"en-us",1)
Result: Thursday, July 04, 1776
LocDateTime
Purpose
Converts the string into a date (with time if required). The string is expected to be in
the relevant format for the country.
Parameter:
String
Date
String
(optional) Country code/ISO Code of country, whose format
is to be used. Format: <ISO639>-<ISO3166> e.g. de-de or
en-us.
http://msdn.microsoft.com/en-us/library/0h88fahh%28VS.85%29.aspx
Return value:
Date
Example:
LocDateTime("04.07.1776","en-us")
Result: 07/04/1776
LocNumber$
Purpose:
Returns a string with the valid number format for the entered country.
Parameter:
Number
Value to be formatted
String
(optional) Country code/ISO Code of country, whose format
is to be used. Format: <ISO639>-<ISO3166> e.g. de-de or
en-us.
http://msdn.microsoft.com/en-us/library/0h88fahh%28VS.85%29.aspx
Return value:
String
Example:
LocNumber$(123,"en-us")
Result: "123.00"
LocTime$
Purpose:
Returns a string with the valid time format for the entered country.
270
Overview of Fields
Parameter:
Date
Value to be formatted
String
(optional) Country code/ISO Code of country, whose format
is to be used. Format: <ISO639>-<ISO3166> e.g. de-de or
en-us.
http://msdn.microsoft.com/en-us/library/0h88fahh%28VS.85%29.aspx
Number
(optional) Format value: 0=normal (default), 1=24h format,
2=no AM/PM, 3=24h format, no AM/PM, format value +10
= no seconds, format value +20 = no minutes and no
seconds.
Return value:
String
Example:
LocTime$ (Now(),"en-us")
Result: current system time
LocTime$ (Now(),"",11)
Result: always 24h format, no seconds
LocVal
Purpose:
Interprets the string as a number and returns its value (while respecting any
localized decimal or 1000 separators).
Parameter:
String
Number (as string)
String
(optional) Country code/ISO Code of country, whose format
is to be used. Format: <ISO639>-<ISO3166> e.g. de-de or
en-us.
http://msdn.microsoft.com/en-us/library/0h88fahh%28VS.85%29.aspx
Return value:
Number
Example:
LocVal ("12","de-de")
Result: 12,00
LocVal ("12,00","en-us")
Result:1200,00
Log
Purpose:
Calculates the natural logarithm ln(x).
Parameter:
Number
271
Overview of Functions
Return value:
Number
Example:
Log(Exp(1))
Result: 1
Log10
Purpose:
Calculates the base-10 logarithm log(x).
Parameter:
Number
Return value:
Number
Example:
Log10(1000)
Result: 3
Lower$
Purpose:
Converts the characters of a string into lower case letters.
Parameter:
String
Return value:
String
Example:
Lower$("George") Result: "george"
LTrim$
Purpose:
Removes the leading spaces of a string.
Parameter:
String
Return value:
String
Example:
LTrim$(" George")
272
Result: "George"
Overview of Fields
Max
Purpose:
Returns the largest of the two values.
Parameter:
Number or Date
Number or Date
Return value:
Number or Date
Maximum
Purpose:
Calculates the maximum of the set of values that result from the first
parameter / formula.
Parameter:
Number
Boolean
(optional) TRUE: The values which were stored for the
calculation are deleted after output. (default: TRUE). Please
note that the stored calculation values are generally deleted
for every (sub)table end. The second parameter only decides
whether the values are already deleted within the table.
Return value:
Number
Example:
Maximum([email protected]:UnitsInStock)
Median
Purpose:
Calculates the median of the set of values that result from the first parameter /
formula.
Parameter:
Number
Expression for the value to be averaged.
Boolean
(optional) The values which were stored for the calculation
are deleted after output. (default: TRUE). Please note that
the stored calculation values are generally deleted for every
(sub)table end. The second parameter only decides whether
the values are already deleted within the table.
Return value:
273
Overview of Functions
Number
Example:
Median(UnitsInStock)
Mid$
Purpose:
Returns a part of a string. The desired number of characters starting at the
starting position will be returned.
If the third parameter is not used, the string will be returned from the starting
position to the end.
The first character of the string has the Position 0.
Parameter:
String
Number
Starting position
Number
(optional) Number of characters to be displayed.
Return value:
String
Example:
Mid$("Normalconsumer",6)
Result: "consumer"
Mid$("Normalconsumer",6,30)
Result: "consumer"
Mid$("Normalconsumer",6,3)
Result: "con"
Mid$(Name,0,6)
Result: "Normal"
Min
Purpose:
Returns the smallest of the two values.
Parameter:
Number or Date
Number or Date
Return value:
Number or Date
Minimum
Purpose:
Calculates the minimum of the set of values that result from the first
parameter / formula.
274
Overview of Fields
Parameter:
Number
Boolean
(optional) TRUE: The values which were stored for the
calculation are deleted after output. (default: TRUE). Please
note that the stored calculation values are generally deleted
for every (sub)table end. The second parameter only decides
whether the values are already deleted within the table.
Return value:
Number
Example:
Minimum (Quantity * UnitPrice)
Result: [Lowest Total Price]
Minute
Determines the minute of the entered date, and returns the result as a
number. If the parameter is not used, the minute of the time of printing will be
returned.
Parameter:
Date
(optional)
Return value:
Number
Mode
Purpose:
Calculates the mode (most common value) of the set of values that result
from the first parameter / formula.
Parameter:
Number
Expression for the value to be examined.
Boolean
(optional) The values which were stored for the calculation
are deleted after output. (default: TRUE). Please note that
the stored calculation values are generally deleted for every
(sub)table end. The second parameter only decides whether
the values are already deleted within the table.
Return value:
Number
Month
Purpose:
Determines and returns the month (1...12) as a number.
275
Overview of Functions
Parameter:
Date
Return value:
Number
Example:
Month(Date("2015.10.17"))
Result: 10
Month$
Purpose:
Determines and returns the month (1...12) as a string.
Parameter:
Date
Return value:
String
Example:
Month$(Date("2015.10.17"))
Result: "10"
NativeAvg
Purpose:
Returns the average value.
Parameter:
All
Field or expression to aggregate.
Boolean
(optional) Filter expression for the field or the expression to
be aggregated. Default: True (all data).
Boolean
(optional) Defines that only the unique values should be
aggregated (DISTINCT). Default: False.
Return value:
Number
Example:
NativeAvg(Order_Details.Quantity*Order_Details.UnitPrice)
NativeCount
Purpose:
Returns the number of value.
Parameter:
All
276
Field or expression to aggregate.
Overview of Fields
Boolean
(optional) Filter expression for the field or the expression to
be aggregated. Default: True (all data).
Boolean
(optional) Defines that only the unique values should be
aggregated (DISTINCT). Default: False.
Return value:
Number
Example:
NativeCount (Order_Details.Quantity*Order_Details.UnitPrice)
NativeMax
Purpose:
Returns the maximum value of the field or expression.
Parameter:
All
Field or expression to aggregate.
Boolean
(optional) Filter expression for the field or the expression to
be aggregated. Default: True (all data).
Boolean
(optional) Defines that only the unique values should be
aggregated (DISTINCT). Default: False.
Return value:
Number
Example:
NativeMax (Order_Details.Quantity*Order_Details.UnitPrice)
NativeMin
Purpose:
Returns the minimum value of the field or expression.
Parameter:
All
Field or expression to aggregate.
Boolean
(optional) Filter expression for the field or the expression to
be aggregated. Default: True (all data).
Boolean
(optional) Defines that only the unique values should be
aggregated (DISTINCT). Default: False.
Return value:
Number
Example:
NativeMin(Order_Details.Quantity*Order_Details.UnitPrice)
277
Overview of Functions
NativeStdDevPop
Purpose:
Returns the statistical standard deviation for the population of all values of the
field or expression.
Parameter:
All
Field or expression to aggregate.
Boolean
(optional) Filter expression for the field or the expression to
be aggregated. Default: True (all data).
Boolean
(optional) Defines that only the unique values should be
aggregated (DISTINCT). Default: False.
Return value:
Number
Example:
NativeStdDevPop(Order_Details.Quantity*Order_Details.UnitPrice)
NativeStdDevSamp
Purpose:
Returns the statistical standard deviation of all values of the field or
expression.
Parameter:
All
Field or expression to aggregate.
Boolean
(optional) Filter expression for the field or the expression to
be aggregated. Default: True (all data).
Boolean
(optional) Defines that only the unique values should be
aggregated (DISTINCT). Default: False.
Return value:
Number
Example:
NativeStdDevSamp(Order_Details.Quantity*Order_Details.UnitPrice)
NativeSum
Purpose:
Returns the sum of all values.
Parameter:
278
All
Field or expression to aggregate.
Boolean
(optional) Filter expression for the field or the expression to
be aggregated. Default: True (all data).
Overview of Fields
Boolean
(optional) Defines that only the unique values should be
aggregated (DISTINCT). Default: False.
Return value:
Number
Example:
NativeSum(Order_Details.Quantity*Order_Details.UnitPrice)
NativeVarPop
Purpose:
Returns the statistical variance for the population of all values of the field or
expression.
Parameter:
All
Field or expression to aggregate.
Boolean
(optional) Filter expression for the field or the expression to
be aggregated. Default: True (all data).
Boolean
(optional) Defines that only the unique values should be
aggregated (DISTINCT). Default: False.
Return value:
Number
Example:
NativeVarPop(Order_Details.Quantity*Order_Details.UnitPrice)
NativeVarSamp
Purpose:
Returns the statistical variance of all values of the field or expression.
Parameter:
All
Field or expression to aggregate.
Boolean
(optional) Filter expression for the field or the expression to
be aggregated. Default: True (all data).
Boolean
(optional) Defines that only the unique values should be
aggregated (DISTINCT). Default: False.
Return value:
Number
Example:
NativeVarSamp(Order_Details.Quantity*Order_Details.UnitPrice)
279
Overview of Functions
Now
Purpose:
Returns the current date and time.
Parameter:
Return value:
Date
NthLargest
Purpose:
Calculates the nth-largest value of the set of values that result from the first
parameter / formula.
Parameter:
Number
Number
<n>, i.e. the index for the value which is to be returned (1based).
Boolean
(optional) TRUE: The values which were stored for the
calculation are deleted after output. (default: TRUE). Please
note that the stored calculation values are generally deleted
for every (sub)table end. The second parameter only decides
whether the values are already deleted within the table.
Return value:
Number
Example:
NthLargest(Order_Details.ProductID,2)
calculates the 2-largest number
NthLargestIndex
Purpose:
Calculates the index of the nth-largest value of the set of values that result
from the first parameter / formula.
Parameter:
Number
280
Number
<n>, i.e. the index for the value which is to be returned (1based).
Boolean
(optional) TRUE: The values which were stored for the
calculation are deleted after output. (default: TRUE). Please
note that the stored calculation values are generally deleted
Overview of Fields
for every (sub)table end. The second parameter only decides
whether the values are already deleted within the table.
Return value:
Number
Example:
NthLargestIndex(Order_Details.ProductID,2)
NthValue
Purpose:
Calculates the nth value of the set of values that result from the first
parameter / formula.
Parameter:
All
Number
<n>, i.e. the index for the value which is to be produced,
calculated e.g. with NthLargestIndex().
Boolean
(optional) TRUE: The values which were stored for the
calculation are deleted after output. (default: TRUE). Please
note that the stored calculation values are generally deleted
for every (sub)table end. The second parameter only decides
whether the values are already deleted within the table.
Return value:
Number
Example:
NthValue(NthLargestIndex(Order_Details.ProductID,2))
Null
Purpose:
Returns a Null value (value not available).
Parameter:
Return value:
All
NullSafe
Purpose:
Checks if the parameter is Null and returns a substitute value if it is, otherwise
it returns the value of the parameter.
281
Overview of Functions
Parameter:
All
Return value:
All
NumInRange
Purpose:
Evaluates if a number falls within the desired range.
Parameter:
Number
Number
Upper limit
Number
Lower limit
Return value:
Boolean
Example:
NumInRange(Page(),1,10)
Result: True, if page number is between 1 and 10.
Odd
Purpose:
Evaluates if a number is odd. If the number is odd "True” will be returned,
otherwise "False”.
Parameter:
Number
Return value:
Boolean
Example:
"Page number "+Cond(Odd(Page()),"odd","even")
Ord
Purpose:
Returns the ASCII value of the first character.
Parameter:
String
Return value:
Number
282
Overview of Fields
Example:
Ord("combit")
Result: 99
Page
Purpose:
Returns the current page number.
Parameter:
Return value:
Number
Example:
Case(Odd(Page()),"Even","Odd")+" page number"
Page$
Purpose:
Returns the page number of the printed page as a string.
Parameter:
Return value:
String
Example:
"Page "+Page$()+"/"+TotalPages$() Result: Page 1/3
PlainTexttoHTML$
Purpose:
Returns the unformatted text as HTML content.
Parameter:
String
text context
Return value:
String
Pow
Purpose:
Corresponds to the function (Base) ^ (Exponent).
Parameter:
283
Overview of Functions
Number
Base
Number
Exponent
Return value:
Number
Example:
Pow(2,3) Result: 8
Precalc
Purpose:
Calculates the value of the aggregate function for the table. Only available in
the report container.
Parameter:
All
Function (typically a aggregate function)
All
Optional grouping function for the Precalc() function to
output a group sum in the group header for example.
Normally the same value as 'Group by'.
All
opt.: Condition for the aggregation (the value is only
aggregated if the condition is matched).
Return value:
All
Example:
Precalc(Sum(Item.UnitPrice))
Result: Sum of the following item prices.
Previous
Purpose:
Returns the previous value of the variable, field or formula, i.e. the value it had
for the last record.
Parameter:
All
Variable, field or formula
Return value:
All
Example:
Previous(NAME)
PreviousUsed
Purpose:
284
Result: "consumer"
Overview of Fields
Returns the value the given variable or expression had when it was last
evaluated.
Parameter:
All
Variable, field or formula
Return value:
All
Example:
PreviousUsed(NAME)
Result: e.g. "Miller"
ProjectParameter$
Purpose:
Returns the value of a project parameter. Available parameters:
LL.FAX.Queue
Print queue
LL.FAX.RecipName
Recipient name
LL.FAX.RecipNumber
Recipient fax number
LL.FAX.SenderBillingCode
Sender billing code
LL.FAX.SenderCompany
Sender company
LL.FAX.SenderDept
Sender department
LL.FAX.SenderName
Sender name
LL.MAIL.To
Mail address
LL.MAIL.CC
Mail address for carbon copy
LL.MAIL.BCC
Mail address for blind carbon copy
LL.MAIL.Subject
Subject line
LL.MAIL.From
Sender mail address
LL.MAIL.ReplyTo
Reply To mail address
LL.MinPageCount
Minimum page count.
LL.ProjectDescription
Project Description
LL.SlideShow.TransformationID
Default transition effect for the preview´s
slideshow mode.
LL.MAIL.ShowDialog
Show mail dialog before sending
Parameter:
String
Name of the project parameter
285
Overview of Functions
Boolean
(optional) sets whether the return value (possibly a formula)
should be returned directly (True), or should be evaluated
(False). Default: False
Return value:
String
Example:
ProjectParameter$("LL.ProjectDescription")
Result:"Article list"
ProjectPath$
Purpose:
Returns the path of the project file, optionally including the file name
(otherwise with "\" at the end)
Parameter:
Boolean
True: Sets that the path is returned including the file name
(Default: False).
Return value:
String
Example:
ProjectPath$()
Result: C:\Program Files\LL\
ProjectPath$(True)
Result: C:\Program Files\LL\crosstab.lsr
Quarter
Purpose:
Returns the quarter of the year (1..4)
Parameter:
Date
Boolean
(optional) sets whether the quarter calculation should be
returned relative to the year (1..4) or in absolute terms since
1.1.0001 (1..). Default: False (relative).
Return value:
Number
Example:
286
Quarter(Date("01.01.2015"))
Result: 1
Quarter(Date("01.05.2015"))
Result: 2
Quarter(Date("01.05.2015"),true)
Result: 8058
Overview of Fields
RainbowColor
Purpose:
Calculates a color value between blue and red corresponding to the value of
the first parameter e.g. for rainbow colors in crosstabs.
Parameter:
Number
Value to be displayed.
Number
Until this value the color is "blue".
Number
Until this value the color is "red".
Return value:
Number
RegExMatch$
Purpose:
Returns the part of the string that corresponds to the regular expression or
the group passed in the third parameter.
The regular expression corresponds to Pearl 5 Syntax, which in most details
equals the regular expression syntax of the Visual Basic Scripting engine.
Parameter:
String
String
Number
Return value:
String
Example:
Division of the "STREET" field to street and number:
"Street: " + RegExMatch$(STREET,"((?:\w* )+)(\d+[\w ]*$)",1) "Number: " +
RegExMatch$(STREET,"((?:\w* )+)(\d+[\w ]*$)",2)
RegExMatch$("test1234xyz0815", "[0-9]+")
Result: "1234"
RegExSubst$
Purpose:
Replaces the substrings of the first argument with a new value if they match
the regular expression.
Parameter(s):
String
The string to be checked
String
Regular expression
287
Overview of Functions
String
Replacement expression (can contain "\0" for the entire
match or "\1"… "\9" for the respective group.
Boolean
(optional) Specifies whether only the first occurrence is to be
replaced. Default value: False
Return value:
String
Example:
RegExSubSt$("1234xyz6789","[0-9]+", "a")
Result: "axyza"
RegExSubSt$("1234xyz6789","[0-9]+", "a")
Result: "axyz6789"
RemainingTableSpace
Purpose:
Returns the space available to data and group lines in a table object. The
parameter defines the unit of the return value. The function can be used to
carry out conditional page breaks before group lines, e.g. "Page break before
only 5% space is left”.
Parameter:
Boolean
(optional) TRUE: the value is in units which are independent
of the system (SCM-units), FALSE: the value is a percentage
of the entire table size (default: FALSE).
Return value:
Number
Rep$
Purpose:
Returns a string that contains the appropriate number of strings defined in the
first parameter.
Parameter:
String
Number
Return value:
String
Example:
288
Rep$("-",10)
Result: "----------"
Rep$("+-",5)
Result: "+-+-+-+-+-"
Overview of Fields
ReportSectionID$
Purpose:
Returns the name of the report section ("IDX" for index, "TOC" Table of
Contents).
Parameter: Return value:
String
Example:
ReportSectionID$()="IDX"
RGB
Purpose:
Calculates the color value using the relative red, green and blue saturation
values (between 0 and 255). No saturation has the value 0, full saturation the
value 255. This function can be used to set the font color using a formula.
Parameter:
Number
red saturation
Number
green saturation
Number
blue saturation
Return value:
Number
Example:
Cond(Amount<0, RGB(255,0,0), RGB(0,0,0)
Result: red for negative amounts
Right$
Purpose:
Reduces a string from the left so that only the number of characters set under
Number remain. If the original string is already small enough, it is not
affected.
Parameter:
String
Number
Boolean
(optional) True: The cut off value starts with "..." (Default:
False). If Number < 3 the setting is ignored.
Return value:
String
289
Overview of Functions
Example:
Right$("normalconsumer", 8)
Result: "consumer"
Right$("normalconsumer", 11,.T.)
Result: "...consumer"
Roman$
Purpose:
Returns the roman display of the absolute value of the given number.
Parameter:
Number
Value to be formatted
Number
(optional) Display type: 0=upper case, 1=Lower case,
2=Upper case Unicode, 3=Lower case Unicode. Default: 0.
Return value:
String
Example:
Roman$(11)
Result: "XI"
Round
Purpose:
Rounds a value to the entered number of decimal places. Default is 0.
Parameter:
Number
Number
(optional)
Return value:
Number
Example:
Round(3.1454,2)
Result: 3,15
Round(3.1454)
Result: 3
RTFtoPlainText$
Purpose:
Returns the plain, unformatted text of a RTF text.
Parameter:
String
Return value:
String
290
RTF text
Overview of Fields
Rtrim$
Purpose:
Removes spaces from the end of a string.
Parameter:
String
Return value:
String
Example:
RTrim$("John
")
Result: "John"
Script$
Interprets the result of a script as string. This function is not available for all
applications.
Parameter:
String
Script language (e.g. 'CSharpScript', 'VBScript')
String
Code
Boolean
(optional) Function
Return value:
String
Example:
Script$("CSharpScript", LoadFile$(ProjectPath$(False) + "Script.cs"))
ScriptBool
Interprets the result of a script as boolean. This function is not available for all
applications.
Parameter:
String
Script language (e.g. 'CSharpScript', 'VBScript')
String
Code
Boolean
(optional) Function
Return value:
Boolean
Example:
ScriptBool("CSharpScript", "WScript.Result=DateTime.IsLeapYear(1971);")
291
Overview of Functions
ScriptDate
Interprets the result of a script as date. This function is not available for all
applications.
Parameter:
String
Script language (e.g. 'CSharpScript', 'VBScript')
String
Code
Boolean
(optional) Function
Return value:
Date
Example:
ScriptDate("CSharpScript", "WScript.Result=new DateTime(1971,10,25);")
ScriptVal
Interprets the result of a script as number. This function is not available for all
applications.
Parameter:
String
Script language (e.g. 'CSharpScript', 'VBScript')
String
Code
Boolean
(optional) Function
Return value:
Number
Example:
ScriptVal("CSharpScript", LoadFile$(ProjectPath$(False) + "Script.cs"))
Second
Determines the second of the entered date and returns the result as a
number. If the parameter is not used, the second of the print time will be
returned.
Parameter:
Date
Return value:
Number
SetVar
292
(optional)
Overview of Fields
Saves a value in the variable repository for later use with the GetVar() function.
The purpose of these functions is to provide a simple buffer for values. You
shouldn't execute complex nesting with GetVar/SetVar or combine both
functions with each other - especially for header, footer and group lines
unexpected effects can occur here.
Parameter(s):
String
Description of variable
All
Value to store
Boolean
Defines if the function should also return the value or if the
result should be an empty string. Default: Return value
(True).
Return value:
All
Example:
SetVar ("Page", Page())
Sign
Purpose:
Returns the sign of the value (+1 for a positive value, -1 for a negative value or
0 if the value is 0).
Parameter:
Number
Value
Return value:
Number
Example:
Sign (-3)
Result: -1
Sin
Purpose:
Calculates the sine of the value.
Parameter:
Number
Value
Number
(optional) Mode (0=Degree, 1=Radian). Default: 0.
Return value:
Number
Example:
Sin (90)
Result: 1
293
Overview of Functions
Sqrt
Purpose:
Calculates the square root of a number.
Parameter:
Number
Return value:
Number
Example:
Sqrt(4)
Result: 2
StartsWith
Purpose:
Checks whether the string in the first argument begins with the string in the
second argument.
Parameter(s):
String
String
Boolean
False
Specifies whether capitals/small letters are relevant. Default value:
Return value:
Boolean
Examples:
StartsWith ("Hello World","hel")
Result: True
StartsWith ("Hello World","rld")
Result: False
StdDeviation
Purpose:
Calculates the standard deviation of the set of values that result from the first
parameter / formula.
Parameter:
Number
Boolean
Return value:
294
(optional) TRUE: The values which were stored for the
calculation are deleted after output. (default: TRUE). Please
note that the stored calculation values are generally deleted
for every (sub)table end. The second parameter only decides
whether the values are already deleted within the table.
Overview of Fields
Number
Example:
StdDeviation(Order_Details.Quantity*Order_Details.UnitPrice)
Str$
Purpose:
Converts a number or date into a string. The number will be formatted with 5
decimal places that may be rounded. The length is variable.
Parameter:
Number or Date
Number
(optional) Defines the length of the string (default:6). If the
number is too large for this format, the resulting string may
then be longer than desired. If the number is too small,
spaces will be attached dependent upon the prefix, right
(negative) or left (positive).
Number
(optional) Defines the precision (number of decimal places).
If the number is positive, the number will be displayed as a
floating-point number, if negative in scientific format.
Return value:
String
Example:
Str$(Constant.Pi())
Result: "3.14159"
Str$(Constant.Pi(),0,2)
Result: "3.14"
Str$(Constant.Pi(),5,2)
Result: " 3.14"
Str$(Constant.Pi(),12,-3)
Result: "-3.141e+00"
StrPos
Purpose:
Returns the position of the nth appearance of a search string. The third
parameter determines which appearance will be returned. Default is 1.
The first character in the string has the position 0.
-1 as return value signifies the search string no longer appears.
Parameter:
String
String
Search string
Number
(optional)
Return value:
295
Overview of Functions
Number
Example:
StrPos("Normalconsumer","or")
Result: 1
StrPos("Normalconsumer","r")
Result: 2
StrPos("Normalconsumer","r",1)
Result: 2
StrPos("Normalconsumer","r",2)
Result: 13
StrRPos
Purpose:
Returns the position of a search string within a string. This is a backwards
search. The third parameter, determines which appearance will be returned.
Default is 1.
The first character in the string has the position 0.
-1 as return value signifies the search string no longer appears.
Parameter:
String
String
Search string
Number
(optional)
Return value:
Number
Examples:
StrRPos("Normalconsumer","or")
Result: 1
StrRPos("Normalconsumer","r")
Result: 13
StrRPos("Normalconsumer","r",1)
Result: 13
StrRPos("Normalconsumer","r",2)
Result: 2
StrSubst$
Purpose:
Searches a string for the appearance of a search string and replaces it with
the string contained in the third parameter (replacement string). If no third
parameter is used, the string located using the search string will be deleted.
Parameter:
String
String
Search string
String
(optional) Replacement string
Return value:
296
Overview of Fields
String
Example:
Assume that you want to print address labels that contain the company name.
You do not have much space available on the label and cannot afford to
completely print long company names, for example, "Forrer Construction,
Incorporated”.
With the expression StrSubst$(COMPANY,"Incorporated","Inc.")
every appearance of "Incorporated" in the COMPANY field will be replaced
with "Inc."
Sum
Purpose:
Calculates the sum of the parameter / formula in the parameter.
Hint: Sum variables (see "Sum Variables") are an alternative way of creating
sums and counters. Sum variables are principally applicable to whole tables.
Aggregate functions principally table specific.
Parameter:
Number
Boolean
(optional) TRUE: The values which were stored for the
calculation are deleted after output. (default: TRUE). Please
note that the stored calculation values are generally deleted
for every (sub)table end. The second parameter only decides
whether the values are already deleted within the table.
Return value:
Number
Example:
Sum (Order_Details.UnitPrice)
TableWidth
Purpose:
Returns the width of the table object. Can be used to define column widths
relatively.
Parameter:
Boolean
(optional) True: the value is in SCM units (1/1000mm), False:
the value is in project units (Default: False).
Return value:
Number
Example:
297
Overview of Functions
TableWidth()*30/100
Result: Column takes 30% of the width.
Tan
Purpose:
Calculates the tangent of the value.
Parameter:
Number
Value
Number
(optional) Mode (0=Degree, 1=Radian). Default: 0.
Return value:
Number
Example:
Tan (45)
Result: 1,00
TextWidth
Purpose:
Returns the text width with the corresponding font.
Parameter:
String
Text
String
Font in the form of '{(0,0,0),12,0,0,0,0,400,0,0,0,0,40,0,0,0,
Arial}' – the size in pt, followed by the values of the
LOGFONT structure values.
Return value:
Number
Time$
Purpose:
Returns the current time in string format.
The following formats are available:
298
Placeholder
Description
%h
Hours in 24 hour format
%H
Hours in 12 hour format
%m
Minutes
%s
Seconds
%P
Display the part of day (A.M. / P.M.)
Overview of Fields
%p
Display the part of day (a.m. / p.m.)
Parameter:
String
Return value:
String
Example:
Time$("%02h:%02m:%02s")
Result: "18:30:45"
Today
Purpose:
Returns the current date.
Parameter:
Return value:
Date
Example:
Date$(Today(),"%D, %m.%d.%4y") Result: "Friday, 10/9/2015"
ToFrac$
Purpose:
Converts an number to a fraction.
Parameter:
Number
Boolean
optional: Create mixed fraction. Default: True.
Number optional: Maximum denominator (integer part) and maximum
deviation (fractional part). Default: 10000.00001.
Number optional: Defines to what extent Unicode characters can be used
fort he output. (0/1/2/3). Default: 2.
Return value:
String
Example:
ToFrac$(7.25,True,0.00001 )
Result: 7 1/4
Token$
See Case$
299
Overview of Functions
ToNumber
Purpose:
Returns the argument as number.
Parameter:
All
Return value:
Number
ToRTF$
Purpose:
Returns a string in RTF-format. This is necessary because some strings may contain
one of the specially defined RTF-format symbols. ('\', '{' or '}'). For compatibility
reasons, this function only processes the passed string if the optional second
parameter is explicitly set to True.
Parameter:
String
Boolean
Return value:
String
Example:
If, for example, the field PRODCODE could contain one of the characters, then
the text should be inserted in the following way:
"<<SALUTATION>> <<NAME>>, You have received
<<PRODUCT>>, Code <<ToRTF$(PRODCODE)>>..."
our
product
ToString$
Purpose:
Returns the argument as string. The function supports all data types.
Parameter:
All
Rückgabewert:
String
Example:
A chart axis labels must be a string, the data type of the axis is variable
(number, date, string).
300
Overview of Fields
Total$
Purpose:
Sets that the expression in the argument is calculated for the whole
crosstable-object.
Parameter:
All
Return value:
All
Example:
Sum(Sales)/Total(Sum(Sales))*100
TotalPages$
Purpose:
Returns the total number of pages. The returned string is replaced by the total
number of pages when printing.
Please note when using this function that the timing behavior of the print
process can be affected. A progress bar may reach 100% faster, but because
of further processing of the output, there may be a delay before the actual
printout is produced. No calculations may be performed with the result of this
function.
Parameter:
Return value:
String
Example:
"Page "+Page$()+"/"+TotalPages$()
Result: Page 1/3
Translate$
Purpose:
Translates the text in the argument provided that it is held in the dictionary
transferred by the application.
Parameter(s):
String
Return value:
String
Example:
Translate$("Page {0} of {1}", Page$(), TotalPages$())
301
Overview of Functions
Result in German e.g.: Seite 1 von 2
UnitFromSCM
Purpose:
Converts a SCM-Unit (1/1000 mm) to the print unit (inch/mm). Important for
the definitions of property values independent of the selected print unit.
Parameter:
Number
Return value:
Number
Example:
Cond(Page()=1,UnitFromSCM(100000),UnitFromSCM(20000))
Result: 10 cm for Page 1, 2 cm for the other pages.
URLDecode$
Purpose:
Returns the URL conformable text as plain unformatted text.
Parameter:
String
Return value:
String
Example:
URLDecode$ ("www.combit.net")
URLEncode$
Purpose:
Returns the plain unformatted text as URL conformable content.
Parameter:
String
Boolean
Encode reserved characters (!*'();:@&=+$,/?%#[]) also
Return value:
String
Example:
URLDecode$ ("www.combit.net")
302
Overview of Fields
Upper$
Purpose:
Converts the characters of a string to capital letters.
Parameter:
String
Return value:
String
Example:
Upper$("Otto")
Result: "OTTO"
Val
Purpose:
The string is interpreted and returned as a number. If an error occurs, the
return value is 0. The decimal sign must always be entered as ".".
Parameter:
String
Return value:
Number
Example:
Val("3.141")
Result: 3.141
Val("3,141")
Result: 3
Val("3.141e2")
Result: 314.2
Val(ChrSubst$("3,141", ",", "."))
Result: 3.141
Variance
Purpose:
Calculates the variance of the set of values that result from the first parameter
/ formula.
Parameter:
Number
Boolean
(optional) TRUE: The values which were stored for the
calculation are deleted after output. (default: TRUE). Please
note that the stored calculation values are generally deleted
for every (sub)table end. The second parameter only decides
whether the values are already deleted within the table.
Return value:
303
Overview of Functions
Number
Example:
Variance(Order_Details.Quantity*Order_Details.UnitPrice)
WildcardMatch
Purpose:
Returns if the content matches one of the wildcard strings.
Parameter(s):
String
String to check
String
Wildcard string(s)
Boolean
optional: Defines for passing multiple wildcard strings
Return value:
Boolean
Examples:
WildcardMatch ("1234xyz5678","*xyz*")
Result: True
Woy
Purpose:
Returns the week number of a given date.
The optional second parameter determines the setting for the first week of
the year.
0
Week with the first working day
1
Week of January, 1
2
First week with at least 4 days
3
First week with 7 days
4
Week with the first Monday
Parameter:
Date
Number
(optional)
Return value:
Number
Year
Purpose:
Determines the year of a date and returns it as a number.
304
Overview of Fields
Parameter:
Date
Return value:
Number
Example:
Year(Today())
Result: 2015
Year(Date("1.1.2015"))
Result: 2015
Year$
Purpose:
Determines the year of a date and returns it as a string.
Parameter:
Date
Return value:
String
Example:
Year$(Today())
Result: "2015"
Year$(Date("1.1.2015"))
Result: "2015"
305
Overview of Properties
13. Overview of Properties
All of the properties for projects and objects are described centrally here.
Properties are defined by means of the respective property lists.
Upon doing so, the properties can be sorted according to category or alphabetically via the corresponding buttons.
Press the +- buttons to hide or show constant formulas (e.g. False).
Use the input field to filter the properties.
Figure 13.1: properties tool window
If you select multiple objects, you can set their common properties at the same
time.
You can specify values in different ways depending on the property.
Open a drop down list of values by means of an "arrow down" button.
Example: Appearance condition, font color, font. At the end of the list of values,
you will almost always find the "Formula" entry.
You can set the value with a formula via the formula button or the "Formula"
entry in the list of values.
Example: If you want to set the font color to red for negative values, set the
default "property" for the font to "False" and define the "Font color" property using
a formula, e.g.:
Cond(Item.UnitPrice< 0,LL.Color.Red,LL.Color.Black)
Open a configuration dialog with the "..." button.
For example, there are dialogs for the following properties: formatting, font,
frames, position, label format.
Enter the value directly in the property fields.
Example: Project description in the project properties.
Set a file path with the open dialog.
Example: Name of the project include file or the image file.
306
Project Properties
13.1 Project Properties
The project's property window is displayed if no object is selected in the workspace.
The project properties are also available as fields (see "Overview of Fields") and can
be evaluated with the ProjectParameter$() function.
To copy the path of the currently opened project to the clipboard, right-click the
"Project" item in the "Objects" tool window and select "Copy Project Path" in the
context menu. This function is also available in the context menu of the workspace
when no object is selected.
13.1.1 General Settings
Project Description
You can enter a description for the respective project in the "Project description"
field. This description is then shown in the File > Open dialog making it easier for
you to find the project that you want. Alternatively, you can also enter the description
in the File > Save As dialog.
Figure 13.2: Project properties
307
Overview of Properties
Active Design Layout
With multi-page projects, it is sometimes a good idea to choose different layout
settings, e.g. page size, orientation for the different pages. You specify which layout
setting is to be shown in the workspace by means of the "Active design layout" field.
Number of Issues
Specifies the number of issues (copies) for printing and previewing. In addition, it
also enables the IssueIndex() function for display and layout region conditions.
If you specify multiple issues, you will then have the "Display condition for issue
print" property which you can use for printing of objects conditionally for the different
copies.
Printing issues is only supported for the PDF export.
Display Condition for Issue Print
Allows print conditions to be set for the pages of the different issues, e.g. if the last
page containing the GTC should be suppressed when printing the copy.
Example: If (IssueIndex()=2, not Lastpage(), True)
Design Scheme
It is possible to select a design scheme in order to quickly achieve optically appealing
results. Diverse pre-defined schemes are available in the list. This option is the
project-global pre-setting and is available in the objects via the "Project Design
Scheme" item.
Under the "User Defined" option there is a "…" button available for users to specify a
design scheme. This scheme is then provided in the objects via the "User Defined"
option.
308
Project Properties
Figure 13.3: Adjust Design Scheme
Property
Description
Color
Foreground
Ten scheme colors for the foreground:
available in objects as LL.Scheme.Color0…9
Color dialog
The color can be defined freely using a color
dialog, a selection list with predefined colors
or using a formula or function ("Formula"
option at the end of the list). Use the RGB() or
HSL() function for a function.
Selection of
predefined
colors and
formula
wizard
Four scheme colors for the background: can
also be selected in the objects as
LL.Scheme.BackgroundColor0…3.
Color dialog
Color
Background
Set To
If you select a design scheme here, the foreand background colors are reset to the colors
of the selected design scheme.
Value
Description
Selection of
predefined
colors and
formula
wizard
Liste
Scheme
Embedding Drilldown Reports
Drilldown reports can be embedded in the preview file to allow them to be sent or
saved as a complete unit.
309
Overview of Properties
Minimum Page Count
With index card projects, this property specifies the minimum number of pages that
are to be printed automatically. For example, if you want to output a four-page form
with different layouts for each of the four pages, you create a layer for each page and
position the objects on these layers as required for the output. Specify "4" as the
minimum page count.
With list projects, the number entered here determines the page number on which
the output of the table/report container will start. For example, if you need a covering
sheet, you can assign the "Following pages" layer to the table and design the "First
page" layer as you wish. Then specify "2" as the minimum page count.
Sort Order
For label projects, the sort order of data can be selected depending on the
application.
Transition Effects for Slideshow
Here you specify the default values for the kind of page transition in the preview's
slideshow mode.
13.1.2 Fax and Mail Variables
You send faxes by selecting the respective fax (printer) driver in the print process. A
fax program must be installed in order to be able to send faxes.
If the fax is to be sent via the Windows fax driver, the fax parameters (at least the fax
number) must be specified in the project properties. Enter the respective variables in
the "Fax Parameters" area.
If the fax is to be sent via a different fax (printer) driver, you enter the fax number and
other field information (as far as supported) by means of commands (e.g. DvISE
commands for Tobit David). You enter these commands directly in a text field in the
print project. Doing this suppresses the recipient dialog during printing because all
information is already embedded in the document. You will find the precise
procedure in the documentation for your fax software.
You can also send directly by email. You also define the required email variables in
the project's property window. The mail settings (SMTP, MAPI, XMAPI) can be
configured in the application.
13.2 Common Object Properties
You specify most of the object properties in the property list and/or in additional
dialogs. Each object type has its own individual properties. However, there are a
number of attributes that are common to all objects, such as size, position, name
and, appearance condition. These properties are described here centrally and
explained in more detail in the sections that follow.
310
Common Object Properties
13.2.1 Appearance Condition
You can assign an appearance condition to each object. This specifies under which
conditions the object is to be printed. You will find a guide to defining such
conditions under "Variables, Fields and Expressions".
Property
Description
Value
Description
Appearance
condition
Appearance condition for printing. There is no
output if the result is false.
True
Always show
In appearance conditions for table footers,
you can also use the predefined "Last page
only" value. Internally, this entry uses the
functions Lastpage() or LastFooterThisTable().
False
Never show
FirstHea
derThisT
able()
First page only
In appearance conditions for table headers,
you can also use the predefined "First page
only" value. Internally, this entry uses the
functions not Lastpage() or
FirstHeaderThisTable().
LastFoot
erThisTa
ble()
Last page only
Formula
wizard
Formula
13.2.2 Background / Filling / Zebra Pattern
The background/filling property lets you specify a block color or a gradient.
Property
Description
Value
Description
Filling /
Background
Select the kind of gradient that you want and
specify the properties for color, mid color, end
color and fading-in color, depending on
background.
0
Transparent
1
Pattern/block
color
2
Horiz. gradient
3
Vert. gradient
4
Horiz. 2-part
gradient
5
Vert. 2-part
gradient
6
Partly
transparent
7
Picture
8
Glass effect
Formula
Formula
wizard
Value 7 only with tables, charts, rectangles or
circles.
Color
Font color
311
Overview of Properties
13.2.3 Color
The "Color" property allows you to determine the font and background colors. For a
background color, you will also need to set the "Background" property to a value >0,
e.g. to "Sample/fixed color".
The color can be chosen from a fixed, predefined list of colors via a selection list or
freely chosen via a formula or function. A dialog is available for defining the color.
Figure 13.4: Color dialog
Property
Description
Color
You can define the color in a color dialog.
In the dialog, you can choose the color from
a list of fixed predefined colors or specify
your own color by means of a formula or a
function ("Formula" entry at the end of the
list).
(1) With the HSL() function, you define the
color by specifying the hue value (0-360),
the saturation value (0-1) and the lightness
value (0-1).
Value
Description
Color dialog
Selection of
predefined
colors and
formula
wizard
(2) The RGB() function defines a color by
means of red, green and blue values. Each
color portion can have a value between 0
and 255.
13.2.4 Conditional Formatting
The Conditional Formatting property allows the font and background colors, the
border, and the format to be modified. A dialog is available for editing the definitions.
You can add a new conditional formatting rule by clicking on the "New" button and
then defining the rule. Depending on the field type, you can then choose between
several predefined functions (text begins with/contains/is empty/is not empty, value
312
Common Object Properties
is empty/is not empty, value is greater/smaller than, value is greater/smaller or equal
to, value is, value is NULL/not NULL, value is between ... and) or select the entry "Edit
formula" and define the condition in the formula assistant. When doing so, use the
field "LL.CurrentValue".
Then, depending on the field type, define the formatting (e.g. font, border,
background color, format). For the font, you can choose the font color and various
font types; you can define the borders, background color, and format via the
respective properties dialogs you are already familiar with. Click on the arrow buttons
to reset the corresponding settings to the defaults.
The conditions will apply in the order shown. You can modify the order using the
arrow buttons. If you activate the "Stop" option for a particular condition, the
subsequent conditions will be ignored when the condition applies.
Figure 13.5: Conditional Formatting dialog
13.2.5 Content
Many objects cannot be defined solely by means of the property list. They contain
sub-objects (or "content"), such as text objects consisting of several paragraphs.
The "Contents" property (if available) opens up a dialog. You will find a description of
the respective content dialog accompanying the description of the individual objects.
13.2.6 Design Scheme
Specifies the selected design scheme. It is possible to select a design scheme in
order to quickly achieve optically appealing results.
Property
Description
Design
Scheme
Various predefined design schemes are
available via the list. The entries "Project
Design Scheme" and "User Defined" relate to
the scheme definitions in the project
Value
Description
Selection of
predefined
schema.
313
Overview of Properties
properties.
13.2.7 Display Condition for Issue Print
This option enables conditional printing of objects for the different issues. This
property is only available if you have defined multiple issues in the project properties.
The IssueIndex() function lets you specify the index of the issue, e.g. IssueIndex()=2.
You will find more information about managing issues in chapter "Project Properties".
Property
Description
Value
Description
Display
condition for
issue print
Enables conditional printing of objects for the
different issues, e.g. IssueIndex()=2.
True
Display
False
Hide
Formula
Formula
wizard
13.2.8 Export as Picture
For exporting objects in picture format if a vector-based export does not give the
desired results, or in order to achieve a better representation.
Property
Description
Value
Description
Export as
picture
If the result is "True", the object will be
exported as a picture.
True
Yes
False
No
Formula
Formula
wizard
13.2.9 Font
If the default value is set to "Yes", the default font will be used.
There is also a dialog for defining the values.
Property
Description
Font
You can define the font properties in a dialog.
If the default value is set to "True", the default
font will used.
Default value
The default font will be used instead of the
set values.
Name
Character set
314
Value
Description
Font dialog
True
Default font
False
No
Formula
Formula
wizard
Selected font. All installed fonts will be
displayed.
List
Font
Formula
Formula
wizard
Specifies the country version of the character
Number
Character set
Common Object Properties
set. All available character sets are displayed.
Size
Width
Bold
Italic
Underline
Strike out
Color
Font size in points. Lists all available sizes for
the selected font.
Number
Default size
Formula
Formula
wizard
Sets the width of the font. 0 means standard
width, otherwise the average character width
will be specified.
Number
Width
Formula
Formula
wizard
Turns the "bold" text property on and off
True
Yes
False
No
Formula
Formula
wizard
True
Yes
False
No
Formula
Formula
wizard
True
Yes
False
No
Formula
Formula
wizard
True
Yes
False
No
Formula
Formula
wizard
Turns the "italic" text property on and off
Turns the "underline" text property on and off
Turns the "strike out" text property on and off
Font color
13.2.10 Format
The format property is an alternative to formatting with the functions Date$() and
Fstr$() in the formula dialog. This property can be found, for example, in text,
crosstab and table fields. Note that the formatting will affect the expression's result.
If you only wish to format certain parts of an expression (e.g. for text and numbers
within one expression) use the functions Date$(), LocCurrL$ or Fstr$() in the formula
dialog.
With the format editor you can set the format for numbers, currency, date, time, date
and time, percentage, angle and date-/time difference.
By default, the respective application settings are used. Alternatively select the
system setting or a custom setting. If no application setting is passed by the
application, the application setting is the same as the system setting.
315
Overview of Properties
Figure 13.6: Formatting dialog
13.2.11 Frame
The "Frame" property group defines the frame properties and distances from the
frames.
There is also a dialog for defining the values:
Figure 13.7: Dialog for the frame properties
Property
316
Description
Value
Description
Common Object Properties
Frame
(default value)
Default frame
setting
(with table cells)
Layout
You can define frame properties and
distances in a dialog.
To apply the selected type of line, color or
width, click one of the default settings, the
lines of the preview or use the buttons.
If set to True, the default frame defined in
the table object will be used.
Describes the layout of the frame lines (only
relevant for multi-line frames).
Left/Top
Right/Bottom
Settings for the respective frame line.
Distance
Distance between content and frame.
Lines
Visibility of the frame line.
Color
Line color
Line type
Line type.
Width
Frame dialog
Line width.
True
Lines
False
No lines
Formula
Formula
wizard
0
Circumferential
1
Horiz. priority
2
Vert. priority
Formula
Formula
wizard
Number
Formula
Formula
wizard
True
Lines
False
No lines
Formula
Formula
wizard
Line
Selection of
predefined
lines (20)
Formula
Formula
wizard
Number
Formula
Formula
wizard
13.2.12 Index Level
It is possible to create an index via Project > Report Sections. The level of the entry
and the corresponding text are defined with this option. These values are then
317
Overview of Properties
available in the project as fields "Reference.Level" and "Reference.Text". The
maximum index depth can be defined via File > Options > Project.
Index depth
Specify the level in the index entry (0=not in
Index).
Number
formula
Formula
wizard
Text
The text included in the index (can be tabdelimited if multiple entries are desired)
Text
Formula
wizard
13.2.13 Locked
Locks the object to prevent it from being selected unintentionally by clicking. This
property is only relevant during design and has no effect on the later print. If you set
"Locked" to "True", the object in question can no longer be selected in the workspace
and will be marked with a small red logo. This property is not available for sub-tables.
Note: You can select a locked object as usual in the object list thereby making it
editable again. Since "locked" is only relevant during the project’s design phase,
there is no way in which you can determine the value of the property by means of
a formula.
Property
Description
Value
Description
Locked
Locks the object and prevents it from being
selected unintentionally by clicking in the
workspace.
True
locked
False
not locked
13.2.14 Name
When you add a new object to the workspace, a description of the object, made up
of the type of the object (e.g. "Text") and its coordinates, appears in the right section
of the status line. This is the default name for this object.
However, if your project has a large number of similar objects, these identifiers can
easily become confusing. For this reason, you can give your objects meaningful
names by means of the Objects tool window or with the object's property list. You
do this by simply clicking once on the existing name and then changing it.
Alternatively, you can enter a new name in the object name input field via Objects >
Object list or you can change it in the property list.
Property
Description
Value
Name
Name of the object
Name
Description
If you have enabled the Options > Workspace > Object info option, the object name
will also be shown in the tooltip that appears.
13.2.15 Page Break Before Outputting Object
Each object can trigger a page break before it is printed, i.e. the object begins on a
new page.
318
Common Object Properties
Property
Description
Value
Description
Page break
before
If the condition returns "True", a page break
will be triggered before printing the object.
True
Break
False
No break
Formula
Formula
wizard
Value
Description
13.2.16 Pattern
The pattern property lets you specify the texture of a color.
Property
Description
Pattern
Choose a pattern here from wide range of
predefined patterns. Each pattern is
represented by a number. You can specify
your own pattern/number by means of a
formula or a function ("Formula" entry at the
end of the list). This property is only evaluated
if "Filling" or "Background" is set to
"Pattern/Block color".
Selection of a
predefined
pattern and
formula
wizard
13.2.17 Position
An object's "Position" property group specifies the x and y coordinates of the upper
left corner of the object as well as the width and the height.
There is also a dialog for defining the values.
Property
Description
Position
Position and size of the object, all details
are given in the unit of measure for the
workspace
Left
Horizontal distance of the upper left corner
of the object from the upper left corner of
the workspace
Number
Vertical distance of the upper left corner of
the object from the upper left corner of the
workspace
Number
Width of the object
Number
Top
Width
Value
Position dialog
Formula
Formula
Formula
Height
Height of the object
Description
Formula
wizard
Formula
wizard
Formula
wizard
Number
Formula
Formula
wizard
319
Overview of Properties
13.2.18 Table of Contents Level
A table of contents can be created via Project > Report Sections. The level of the
entry and the corresponding text are defined with this option. These values are then
available in the project as fields "Reference.Level" and "Reference.Text". The
maximum directory depth can be defined via File > Options > Project.
Table of
Contents
Level
Specify the level of the directory entry (0=not
in the directory).
Number
Formula
Formula
wizard
Text
The text included in the index.
Text
Formula
wizard
13.3 Text Objects
Text objects let you place text in the workspace. A text object can hold as many
paragraphs as you want and they can all have completely different display properties.
These paragraphs and their properties present the contents of the text object.
Text objects should always be created in the maximum size you want, the object
shrinks at print time to the required size. This behavior is particularly useful for linking
objects.
In the paragraph properties dialog, you can edit the individual paragraphs that make
up the text object and fill them with content.
13.3.1 Object Properties
Also see chapter "Common Object Properties".
Property
Description
Value
Description
Bottom
aligned
Bottom aligned within the object's border. If
this option is enabled, the object's text will be
output at the lower margin of the object, or
otherwise at the upper margin. For this to be
possible, the paragraphs must not be larger
than the object otherwise the text will be
truncated as usual at the bottom or wrapped.
This option is very useful e.g. if text is to be
output at the lower margin of a page and the
length is not known.
True
Yes
False
No
Formula
Formula
wizard
Rotates the object anticlockwise. Please note
that only TrueType fonts can be rotated.
0
0°
1
90°
2
180°
3
270°
Formula
Formula
wizard
Rotation
320
Text Objects
Page break
Specifies whether the object can trigger a
page break. If this property is enabled, the
content will be wrapped to the next page
automatically if it exceeds the size of the
object. This is an interesting option e.g. with
text objects that are to cover several pages.
With labels, the next label will only be started
when all objects have been printed as a result
of this option in the previous label. You might
not be able to set this property if page breaks
are not supported by the higher-level
program.
True
Yes
False
No
Formula
Formula
wizard
Description
13.3.2 Paragraph Properties
Property
Description
Value
Paragraph
spacing
Distance to next paragraph ("Paragraph
spacing"). You specify the distance in points:
To achieve line spacing of 1.5 with a font size
of 10 points, enter 5 points. Negative values
are also allowed. You should always make the
settings under Options > Objects > Object
font.
Number
Formula
Formula
wizard
Alignment
You can specify the alignment in the same
way as in your text processing program.
0
Left
1
Centered
2
Right
Formula
Formula
wizard
True
Yes
False
No
Formula
Formula
wizard
Please consider that the formatting relates to
the result of the entire expression. Use the
Date$() and Fstr$() functions in the formula
wizard if you only want to format part of the
expression (e.g. with text and number within
an expression).
True
Dialog
The blank optimization option lets you remove
unwanted blanks (leading, embedded and
True
Justified
Block text is justified both right and left. This
property only takes effect if the line in
question is wrapped at the end of the line. In
other words, the line must be longer than the
available space, it must consist of more than
one word and the "Line wrap" option must be
enabled.
The last line is presented according to the
"Alignment" property.
Format
Blank
optimization
False
Yes
321
Overview of Properties
trailing).
False
No
Consider the following situation: In a label
project, you are printing a line with the
variables
Formula
Formula
wizard
True
Yes
False
No
Formula
Formula
wizard
0
Truncate
1
Wrap
2
Shrink
3
Compress
4
Optimal fit
Formula
Formula
wizard
<SALUTATION> <FIRSTNAME> <NAME>
whereby the individual variables are separated
by blanks in each case. If there is no
salutation for a data record, this variable
remains empty; the following blank would
however be printed. First name and name
would be shifted by one position (leading
blank).
If the "Firstname" variable is empty, there
would be two spaces (embedded blanks)
between "Salutation" and "Name".
If all three variables were empty, both blanks
would remain (trailing blanks). This means
that the line is not empty and would therefore
not be suppressed automatically.
The "Blank Optimization" option helps in such
cases. It can remove leading, embedded and
trailing blanks automatically. Multiple
embedded blanks are reduced automatically
to a single blank.
Inerasable
Lines that are completely empty are
suppressed automatically. In this case, the
following lines move upwards. This is
normally correct but can be unwanted in
some cases, e.g. when filling out forms.
With the "Untraceable" option, the line in
question remains, even if it is empty after
inserting the variables.
Line wrap
Sets the behavior if the text is too long for one
line.
0: The content will be truncated at the end of
the line.
1: The content will be wrapped. To prevent
longer words from getting truncated, you can
use the option "Force Wrap" to force a wrap
after the last fitting character.
2: The content will be shrinked if needed, so
that the paragraph can be displayed
completely without a wrap.
322
Line Objects
3: The character spacing will be decreased if
needed so that the paragraph can be
displayed completely without a wrap.
4: The font size will be increased or
decreased until the paragraph is filling the
object (vertical/horizontal). This option should
only be used for the last paragraph as
following paragraphs may be omitted.
The options 2-4 should only be used to a
certain extent to still guarantee the readability.
Page
break
Force
wrap
Line spacing
If the text object can trigger a
page break (see object property
"Pagebreak") you can use this
property to define that the
paragraph won't be separated in
case of a pagebreak.
True
Break
False
Keep together
Formula
Formula
wizard
If a long word cannot be
wrapped, a line break will be
forced after the last suitable
character.
True
Yes
False
No
Formula
Formula
wizard
Line spacing defines the distance between
the paragraph's individual lines.
You specify the distance in points: To achieve
line spacing of 1.5 with a font size of 10
points, enter 5 points. Negative values are
also allowed.
Number
Formula
Formula
wizard
You should always make the settings under
Options > Objects > Object font.
13.4 Line Objects
You define lines by their alignment, width and type.
13.4.1 Object Properties
Also see chapter "Common Object Properties".
Property
Description
Value
Description
Alignment
Bottom aligned within the object's rectangle.
If you hold down the SHIFT key when
changing the size with the mouse, the line
will be aligned either vertically or horizontally.
0
Diagonal \
1
Diagonal /
2
Horizontal
3
Vertical
323
Overview of Properties
Formula
Width
Line type
Formula
wizard
Width of line in the unit of measure of the
workspace. 0 means 1px.
Number
Formula
Formula
wizard
Line type selection.
0, 1, 3, 4
4 predefined
lines
Formula
Formula
wizard
13.5 Rectangle Objects
You define rectangles by their border, rounding and shadow.
13.5.1 Object Properties
Also see chapter "Common Object Properties".
Property
Description
Value
Description
Border
Here you specify whether the rectangle is to
have a border.
0
Transparent
1
Pattern/color
Formula
Formula
wizard
Rounding
Color
Color of the border.
Width
Width of the border in the unit of
measure of the workspace
Rounding factor for the corners of the
rectangle in % of the short edge of the
rectangle.
Number
Formula
Number
Formula
Formula
wizard
0
Transparent
1
Pattern/color
Formula
Formula
wizard
0% means square cornered; 100% means:
the short edge of the rectangle is completely
round (elliptical).
Shadow
324
Here you define whether the rectangle is to
have a shadow.
Pattern
Shadow pattern.
Color
Shadow color.
Formula
wizard
Circles and Ellipses
Width
Width of the shadow in the unit
of measure of the workspace.
Number
Formula
Formula
wizard
13.6 Circles and Ellipses
You define circles and ellipses by their borders and filling.
13.6.1 Object Properties
Also see chapter "Common Object Properties".
Property
Description
Value
Description
Pie (Flat)
This property lets you specify that the ellipse
is always displayed as a circle (centered in the
object rectangle).
True
Yes
False
No
This property can be set when dragging by
holding down the SHIFT key (smaller axis),
CTRL key (larger axis) or SHIFT and CTRL keys
(False).
Formula
Formula
wizard
Here you define whether the ellipse is to have
a border.
0
Transparent
1
Pattern/color
Formula
Formula
wizard
Border
Color
Color of the border.
Width
Width of the shadow, in the unit
of measure of the workspace.
Number
Formula
Formula
wizard
13.7 Picture Objects
Picture objects are used to display the content of fixed files or variables.
The following formats are available: WMF, EMF, BMP, DIB, PCX, SCR, TIFF, GIF,
JPEG, PCD, PNG and ICO. As a general rule, you should use the RGB color space
(not CYMK). Transparency in PNG files is supported by using the corresponding
Windows functions. In our experience the majority of printer drivers do not support
transparency so that reports with e.g. partly transparent PNG files should thoroughly
be tested on the actual hard-software combination. If that is not possible we
recommend doing without the alpha channel.
If the image is held in a file or a variable, you can select the data source by doubleclicking the object.
325
Overview of Properties
13.7.1 Object Properties
Also see chapter "Common Object Properties".
Property
Description
Value
Data source
Select the method of determining the image
data source, i.e. via file name, formula or
variable name.
File
name
Formula
Variable
File name
Fixed file name: is evaluated if
you have selected "File name"
as the data source property.
You then select the image file
that you want by means of the
file selection dialog. In this
dialog, you can also insert the
picture into the project by
enabling the ("Embed image in
project file" checkbox option.
This option copies the image to
the project thus making it
available even without the
external file. In this case,
"(embedded)" will be shown as
the file name.
Relative
path
The path is
relative to the
project path.
326
Formula
wizard
Open file
dialog
True
Yes
False
No
Formula
wizard
Formula
If you have selected "Formula"
as the data source property,
the file name is derived from a
formula. The formula must
return a "picture" value type.
You can also enter a valid file
name. However, this must first
be converted to the "picture"
type with the Drawing()
function.
Formula
Variable
If you have selected "Variable"
as the data source property,
the file name is taken from a
variable.
Variable
Select the variable that you
want from the drop-down box.
The drop-down box lists all
"picture" variables defined in
Description
Barcode Objects
your application.
Properties
Depending on your application,
a dialog may open up at this
point to allow you to define
more properties.
Save as
JPEG
Print the image as a JPEG file if
possible (not all file types
support this option).
Original size
Keep
proportions
Alignment
Opens dialog
True
Yes
False
No
Formula
Formula
wizard
Specifies whether the picture is
to be drawn in the original size
(if it can be determined), or if
the size of the picture’s frame
is to be adjusted to fit.
True
Yes
False
No
Not
defined
Not defined
With this option you can
specify whether the
height/width proportions are to
be kept (True) when inserting
the picture or if the picture's
frame is to be adjusted,
possibly leading to distortion
(False).
True
Yes
False
No
Formula
Formula
wizard
Describes how the image is to
be arranged in the available
area.
0
Centered
1
Next to each
other (tiled)
2
Left top
3
Left bottom
4
Right top
5
Right bottom
6
Left
7
Right
8
Top
9
Bottom
13.8 Barcode Objects
Barcodes can be used for product stickers, price labels, serial numbers and many
other purposes. A barcode normally consists of a series of bars and spaces in
different thicknesses whereby, depending on the code, the spaces between the bars
also hold information.
327
Overview of Properties
13.8.1 Object Properties
Also see chapter "Common Object Properties".
Property
Description
Value
Description
Bar width
The narrowest bar width in SCM units (1/1000
mm). 0 = automatic adjustment. Not
supported by all barcodes.
Formula
Formula
wizard
Orientation
0
Left
1
Centered
2
Right
Formula
Formula
wizard
0
0
1
90
2
180
3
270
Formula
Formula
wizard
True
Yes
False
No
Formula
Formula
wizard
Orientation of the barcode
within the object's frame
Bar color
Color of the selected barcode.
Rotation
Rotates the object anticlockwise
Optimum size
Sets the optimum size for the barcode. This
property has an effect when the size changes
and can be used with the following formats:
EAN 13 (all), DP-Leitcode, DP-Identcode,
German Parcel, Postnet and FIM.
Font
Font for the barcode text. Is only evaluated if
the "Show text" property is enabled.
Font dialog
Bar width
ratio
The relationship of the different widths of bars
or spaces. Not supported by all barcodes.
Formula
Formula
wizard
Show text
This property lets you specify whether the
content of the barcode is to be printed as
text.
True
Yes
False
No
Formula
Formula
wizard
13.8.2 Barcode Content
The content dialog for the barcode object lets you define the barcode more precisely.
328
Choose "Text" if you want to print fixed text as a barcode. Enter the value to be
printed in the first part of the input field. Choose the type of barcode that you
want in the second field.
Barcode Objects
There are additional configuration options for many barcodes, e.g.
Maxicode. You can edit these options in a further dialog.
Choose "Formula" if you want to use a formula as a barcode, and define a valid
formula expression with the "Edit" button. The formula must return a "barcode"
value type. You can, of course, also enter variables. However, they must first be
converted to the "barcode" type with the Barcode() function.
Choose "Variable" if you want to print a variable as a barcode. In the drop-down
box, you can choose from all available barcode variables.
13.8.3 Supported Barcode Formats
A range of barcode formats are supported. There is normally no need for special
printers, fonts etc. – the barcodes are printed directly.
Overview of the General 1-D Codes
Name
Formats and permitted characters
GTIN-13, EAN-13,
UCC-13, JAN-13
Formats:
cc|nnnnn|aaaaa
(normal EAN13)
cc|nnnnn|aaaaa|xx
"ISSN")
(EAN13 for newspapers,
cc|nnnnn|aaaaa|xxxxx
(EAN13 for books, "Bookland")
ppp|nnnn|aaaaa
(normal EAN13)
ppp|nnnn|aaaaa|xx
"ISSN")
ppp|nnnn|aaaaa|xxxxx
with
(EAN13 for newspapers,
(EAN13 for books, "Bookland")
cc = country code
ppp =
product code
nnnn, nnnnn = country code
aaaaa = article code
| = character code chr(124)
xx, xxxxx = supplemental code
Permitted characters: [0-9]
The check digit will be calculated and attached automatically. Each
character is 7 bar-widths wide, a code should have a minimum
width of (12*7+11)*0.3 mm = 2.85 cm.
Ideal size (bar symbol) nominal size SC2:
329
Overview of Properties
Width: 31.4 mm, Height: 24.5 mm
Minimum offset that should be kept free around the symbol:
left: 3.6 mm, top: 0.3 mm, right: 2.3 mm, bottom: 0.0 mm
The text may partially exceed this area.
EAN-14, UCC-14
Format: nnnnnnnnnnnnnn (14 digits)
Permitted characters: [0-9]
GTIN-8, EAN-8, UCC8, JAN-8
Formats: nnnnnnn, nn|nnnnn
(|= character code chr(124))
Permitted characters: [0-9]
Each character is also 7 bar widths wide, a code should then have a
minimum width of (8*7+11)*0.3 mm=2.01 cm.
Ideal size (bar symbol)
nominal size SC2:
dx : 22.1 mm, dy: 19.9 mm
Minimum offset that should be kept free around the symbol:
left: 2.3mm, top: 0.3mm, right: 2.3mm, bottom: 0.0mm (if printed,
otherwise 0.3 mm)
The text may partially exceed this area.
UPC-A
Format: c|nnnnn|aaaaa, cnnnnnaaaaa
with
c = number system
nnnnn
= company code
aaaaa
= article code
| = character code chr(124)
Permitted characters: [0-9]
The check digit will be calculated and attached automatically. Each
character is also 7 bar widths wide, a code should then have a
minimum width of (13*7+6)*0.3 mm=2.88 cm.
UPC-E
Format: c|nnnnnn, nnnnnnn
with
c = number system
|= character code chr(124)
depends on the last position
nnnnn
= code, interpretation
Permitted characters: [0-9]
The check digit will be calculated and attached automatically. Each
character is also 7 bar widths wide, a code should then have a
330
Barcode Objects
minimum width of (13*7+6)*0.3 mm=2.88 cm
2-of-5 Industrial
Format: any
Permitted characters: [0-9]
A code is (14*number of characters+18) bar widths wide.
2-of-5 Interleaved (ITF)
Format: any, must have an even number of characters
Permitted characters: [0-9]
A code is (9*number of characters+9) bar widths wide.
2-of-5 Matrix
Format: any
Permitted characters: [0-9]
A code is (10*number of characters+18) bar widths wide.
2-of-5 Datalogic
Format: any
Permitted characters: [0-9]
A code is (10*number of characters+11) bar widths wide.
Codabar
Format: fnnnnnf
Permitted characters: f = frame code [A-D], n = [0-9], [-$:/.+]
Every character is either 2*3+6*1 (characters '0'..'9', '-', '$') or
3*3+5*1 (characters ':', '/', '.', '+', 'A'..'D') bar widths wide. The
characters for the frame code will not be printed with the text.
CODE11
Format: any
Permitted characters: [0-9],[-]
Code 11 has, depending on the length, 1 or 2 check digits. It
calculates only 1 instead of 2 check digits if the length of the text is
a maximum of 10 characters.
Code39, 3-of-9,
Alpha39
Format: any
Extended code 39
Format: any
Permitted characters: [A-Z], [0-9], [-./$%+*]
Permitted characters: any
The expanded code can be activated by a combination of the
standard code: for example: '+A' -> 'a'. Every character is 16 bar
widths wide, a text has (16*number of characters –1) bars.
Code 39 with CRC
Format: any
Permitted characters: [A-Z], [0-9], [-./$%+*]
Code 93 (simple and
extended)
Code 93 is an extension of Code 39 and covers the complete 128
bytes of the ASCII Allowed characters, including NULL. This must
331
Overview of Properties
be transferred as chr$(255).
It contains two check digits that are automatically generated.
The characters consist of 9 bar widths, that each have 3 bars and 3
spaces. There are two options for the extended code:
a) transfer of the shift character from the host program as
$
chr$(254)
%
chr$(253)
/
chr$(252)
+
chr$(251)
b) transfer of the desired character, L&L adds the appropriate shift
character.
Code128
Format: any
Permitted characters: any
Determine the code set that should be used:
Use one of the following codes as a start character:
chr$(135) – start with code A
chr$(136) – start with code B
chr$(137) – start with code C
In order to switch between different code sets within the barcode,
you can use the usual control characters:
Starting from code A to
B: chr$(132)
C: chr$(131)
Starting from code B to
A: chr$(133)
C: chr$(131)
Starting from code C
A: chr$(133)
B: chr$(132)
Example:
<Subset B> "RL" <Subset C> "04432476" <Subset B> "0DE110"
Barcode(Chr$(136)+"RL"+chr$(131)+"04432476"+chr$(132)+"0DE1
10", "Code 128")
332
Barcode Objects
Code128-Full
EAN128-Full
GS1 128, EAN128
Unlike the "normal" Code128, this code allows the use of the entire
Latin-1 character set. Special characters must be replaced as
follows:
NUL:
chr$ (256)
FNC1:
chr$ (102+32)
FNC2:
chr$ (97+32)
FNC3:
chr$ (96+32)
Unlike the "normal" EAN128, this code allows the use of the entire
Latin-1 character set. The special character FNC1 after the start
character unambiguously defines the EAN128. Special characters
must be replaced as follows:
NUL:
chr$ (256)
FNC1:
chr$ (102+32)
FNC2:
chr$ (97+32)
FNC3:
chr$ (96+32)
The special FNC1 character following the start character uniquely
defines the EAN128 code. Special characters must be replaced as
follows:
NUL:
chr$ (255)
FNC1:
chr$ (254)
FNC2:
chr$ (253)
FNC3:
chr$ (252)
FNC4:
chr$ (251)
GS1 DataBar (Limited,
Stacked, Stacked
Omnidirectional,
Stacked Truncated)
Format: nnnnnnnnnnnnn (13 digits)
GS1 DataBar
Expanded)
Format: Data begins with AI. Max. 74 numeric/41 alphanumeric
characters
Permitted characters: [0-9]
Permitted characters: any
IM (4CB/4CB/USPS4CB)
Intelligent Mail Barcode (US Postal Services). Alternative name:
One Code Solution or 4-State Customer Barcode).
Format: 20, 25, 29 or 31 digits
Permitted characters: [0-9]
ISBN
Format: nnn|nnnnnnnnnn (12-digit, no check digit)
Permitted characters: [0-9]
333
Overview of Properties
MSI
Format: any
Permitted characters: [0-9], [A-F]
Pharma-ZentralNummer
Format: nnnnnn (6 digits)
Pharma-ZentralNummer (neu)
Format: nnnnnnn (7 digits)
SSCC/NVE
Format: {nn}nnnnnnnnnnnnnnnnn (17 or 19 digits)
Permitted characters: [0-9]
Permitted characters: [0-9]
Permitted characters: [0-9]
Overview of the General 2-D Codes
Name
Formats and permitted characters
Aztec
Format: any. Note the options dialog.
Permitted characters: any
Datamatrix
In order to enter non-printable characters (binary data) in the
barcode text, they must be packaged in a special string. The data is
inserted using the ~dNNN string, whereby NNN stands for ASCIICode.
Example: DEA~d065~d015~d000~d247~d220 (~d065 stands for
"A")
To represent an EAN data matrix, you can code the special FNC1
character as ~1.
The Datamatrix symbology uses the ECC 200 error correction code.
Further options like size, module format and encoding can be set in
the barcode's options dialog. Click the options symbol in the
barcode content dialog to enter this dialog.
PDF417
Can display all available and non-printable characters. Note the
options dialog.
In order to enter non-printable characters (binary data) in the
barcode text, they must be packaged in a special string. The data is
inserted using the "{binary:nn}" string, whereby nn stands for any
sequence of two-character hexadecimal numbers. This is especially
important if Maxicodes are to be created according to UPS
specifications; the special characters needed for this can be
entered in this way:
In order to pack a Null and a Backspace (BS) character in the data,
use "{binary:0008}" (corresponds to "{binary:00}{binary:08}").
Use "Hallo{binary:0d0a}World" to include a line break.
334
Barcode Objects
QR Code
Format: any. Note the options dialog.
Permitted characters: all characters
In order to enter non-printable characters (binary data) in the
barcode text, they must be packaged in a special string. The data is
inserted using the ~dNNN string, whereby NNN stands for ASCIICode.
Example: ~d065 stands for the letter "A".
Overview of Post Codes (1-D and 2-D Codes)
Name
Formats and permitted characters
DP-Identcode
Formats: nn.nnnnnn.nnn, nn.nnnnn.nnnn, nn.nnnn.nnnnn,
nn.nnn.nnnnnn
Permitted characters: [0-9]
A code is (9*number of characters+9) bar widths wide.
Width: 32.0 mm - 58–5 mm (at least 5 mm light zone right and left).
Height: 25 mm.
Check digit is calculated automatically; relation: 4:9; special “2 of 5
IL” code.
DP-Leitcode
Format: nnnnn.nnn.nnn.nn
Permitted characters: [0-9]
A code is (9*number of characters+9) bar widths wide.
Width: 37.25 mm - 67-5 mm (at least 5 mm light zone right and
left). Height: 25 mm.
Check digit is calculated automatically; relation: 4:9; special “2 of 5
IL” code.
FIM
Formats: A, B, C
Permitted characters: [A-C]
Minimum size: 1/2" * 5/8".
The FIM barcode is always printed in the size specified by the US
Postal Office. This means that it might extend beyond the available
object border.
German Parcel
Format: any, must have an even number of characters.
Permitted characters: [0-9]
A code is (14*number of characters+18) bar widths wide.
Relation: 1:2
335
Overview of Properties
Japanese Postcode
Japanese Postcode.
Format: Postcode as nnn-nnnn, then max. 13 character address
Permitted characters: n=[0-9], address=[A-Z], [0-9], [-]
Maxicode
Can display all available and non-printable characters. Note the
options dialog.
In order to enter non-printable characters (binary data) in the
barcode text, they must be packaged in a special string. The data is
inserted using the "{binary:nn}" string, whereby nn stands for any
sequence of two-character hexadecimal numbers. This is especially
important if Maxicodes are to be created according to UPS
specifications; the special characters needed for this can be
entered in this way.
Example: in order to pack a Null and a Backspace (BS) character in
the data, use "{binary:0008}" (corresponds to
"{binary:00}{binary:08}").
Example: use "Hallo{binary:0d0a}world" to include a line break.
Maxicode/UPS
Format: Formatting according to UPS specifications. Note the
options dialog.
Permitted characters: all characters
Postnet
Formats: nnnnn, nnnnn-nnnn, nnnnn-nnnnnn
Permitted characters: [0-9]
Minimum size: 1.245" * 4/16" (10-digits).
Bar distance at least 1/24".
Error correction digit will be appended automatically.
This bar code is automatically printed in the right size if the object
is larger than the maximum size of the barcode.
Premiumadress
Mail Barcode of Deutsche Post (German postal services).
Format: According to DPAG specifications. Note the options dialog.
Permitted characters: According to DPAG specifications.
RM4SCC, KIX
Permitted characters: [A-Z], [0-9], [a-z]
Royal Mail with CRC
Permitted characters: [A-Z], [0-9], [a-z]
Format: Either just the post code is coded (e.g. LU17 8XE) or the
post code with a supplementary "Delivery Point" (e.g. LU17 8XE 2B).
The maximum number of characters that can be used is therefore
limited to 9.
336
Report Container Object
13.9 Report Container Object
A report container can hold multiple table objects, cross tab objects and chart
objects.
13.9.1 Object Properties
Also see chapter "Common Object Properties".
Property
Description
Value
Description
Page break
before
If the condition returns "True", a page break
will be triggered before printing the report
container.
True
Break
False
No break
Formula
Formula
wizard
Default font
Default font setting for the elements.
Font dialog
Frame
Frame properties and spacing.
Dialog
Number
Column count
Formula
Formula
wizard
Number of columns in the container.
1
1-column
Note: the "LL.CurrentTableColumn" field
returns the index of the current column.
2
2-column
3
3-column
4
4-column
5
5-column
Formula
Formula
wizard
Distance
Spacing of the columns in
the container.
Number
Formula
Formula
wizard
13.9.2 Element Properties
To display the properties of the elements, mark the element in the "Objects" tool
window.
Also see chapter "Common Object Properties".
Property
Description
Value
Name
Name of the element (stored in the
"LL.CurrentContainerItem" variable).
Name
Separator ticks
To align (sub) tables exactly with one
another, additional tick marks can be shown
True
Description
Yes
337
Overview of Properties
(only tables)
on the ruler.
Spacing
(only charts,
gantt and
crosstabs)
Distance of the object (including frame) from the report container's print
area.
Distance After
Distance to the following element (omitted if
the element ends at the page end).
Number
Distance
Before
Distance from the previous element (not
required if the element starts at the
beginning of the page.
Number
Output height
(only charts)
Height of the object (including frame).
Sort order
(only tables,
gantt and
charts)
Multi-level sort orders can be defined in a
dialog (if supported by the application), e.g.
sort the data by country first and then by city.
Pagebreak
before
Column count
False
Formula
Formula
wizard
Formula
wizard
Dialog
Single-level sort orders can be selected from
the drop down list.
List
If the condition returns "True", a page break
will be triggered before printing the object. If
you have multiple multi-column objects, a
page break is triggered automatically after an
object if the column counts for the objects
are different (e.g. 2-column table followed by
a 3-column table) and if there would be
insufficient room for the following object.
True
Break
False
No break
Formula
Formula
wizard
Number of columns in the object.
0
Container
default
1
1-column
2
2-column
3
3-column
4
4-column
5
5-column
Formula
Formula
wizard
If you have multiple multi-column objects, a
page break is triggered automatically after an
object if the column counts for the objects
are different (e.g. 2-column table followed by
a 3-column table) and if there would be
insufficient room for the following object.
Note: The "LL.CurrentTableColumn" field
returns the index of the current column.
Distance
338
Formula
No
Spacing of the columns in
the object.
Number
Formula
Formula
wizard
Table Objects
Column break
condition
(only tables)
A column break will be
triggered if the result of
the condition is "True".
Column break
before
A column break will be
performed before the
object is output.
True
Yes
False
No
Formula
Formula
wizard
True
Yes
False
No
Formula
Formula
wizard
13.10 Table Objects
Table objects are elements of the report container.
13.10.1 Object Properties
Also see chapters "Common Object Properties" and "Report Container Object".
Property
Description
Value
Description
Fixed size
The "Fixed height" property lets you specify
that the size of the table is not to be adjusted
automatically when it has fewer data lines
than the available space in the table object,
after the field names are replaced with
content. If the property is disabled, the end of
the table moves upwards automatically.
If a footer line is defined, "fixed size" will
cause it to be separated from the rest of the
table by a space of at least one line. This
space accommodates the frame as defined in
the data line definition 1. Otherwise, the
footer line will appear immediately below the
table.
True
Yes
False
No
Formula
Formula
wizard
True
Yes
False
No
Formula
Formula
wizard
(not available
for sub-tables)
Please consider that any objects interlinked
with the table can only adjust their position
automatically to correspond with changes in
the table size if "fixed size" is disabled.
Separators
fixed
If this property is enabled, the
separators are also drawn
through the empty area of the
table between the last data
line and the footer line. If the
option is disabled, the
separators are only drawn as
far as the last data line. This
property is only available with
339
Overview of Properties
"fixed size" tables.
Background
Color and type of the background of the table.
(Only available in the report container for
certain applications).
Default frame
Default value for the table's frame.
Default font
Default value for the table's font (not available
for sub-tables).
Pagebreak
condition
With this property, you can specify a
condition that causes a page break after a
data line as soon as the condition is met.
True
Yes
False
No
If "Pagebreak condition" is set to “True”, a
page break will be triggered after each line.
“False” specifies that a page break is only to
be triggered when necessary.
Formula
Formula
wizard
Number of columns in the table.
0
Note: The "LL.CurrentTableColumn" field
returns the index of the current column.
Container
default
1
1-column
2
2-column
3
3-column
4
4-column
5
5-column
Formula
Formula
wizard
Column count
Distance
Column break
condition
Column break
before
Pagebreak
before
Spacing of columns in the
table.
Number
Formula
Formula
wizard
If the result is "True" when a
data line is output, a column
break will be triggered.
True
Break
False
No break
Formula
Formula
wizard
True
Break
False
No break
Formula
Formula
wizard
True
Break
False
No break
A column break will be
performed before the object
is output.
If the condition returns "True", a page break
will be triggered before printing the object.
If you have multiple multi-column objects, a
340
Font dialog
Formula
Table Objects
page break is triggered automatically after an
object if the column counts for the objects are
different (e.g. 2-column table followed by a 3column table) and if there would be
insufficient room for the following object.
Formula
wizard
Suppress
When you enable the "Data
lines.Suppress" object
property in tables, all data
lines are completely
suppressed. This option is
particularly useful in
combination with the "Force
Sums" option. The latter
option specifies that totals
are also calculated when a
data line is not printed. By
combining both options and
using groups and sum
variables, you can print
more interesting statistics.
True
Yes
False
No
Formula
Formula
wizard
Sum variables are
calculated even if you
suppress data lines.
True
Yes
False
No
Formula
Formula
wizard
Data lines
Force sums
Zebra pattern
The "Zebra pattern" option in
the "Data line" field specifies
whether data lines are to
have alternating
background colors. This can
improve readability,
especially with large tables.
Keep rows
together
In the event of a page
break, data lines are kept
together as far as possible,
i.e. they are printed
together on the next page.
True
Yes
False
No
Formula
Formula
wizard
In the event of a page
break, footer lines are kept
together as far as possible,
i.e. they are printed
together on the next page.
True
Yes
False
No
Formula
Formula
wizard
Footer lines
Keep rows
together
Group footer
341
Overview of Properties
lines
Also empty
groups
Keep rows
together
Output group footer lines
even if the groups are
empty.
True
Yes
False
No
Formula
Formula
wizard
In the event of a page
break, group footer lines are
kept together as far as
possible, i.e. they are
printed together on the next
page.
True
Yes
False
No
Formula
Formula
wizard
Where possible, a group
header line will not be
separated from the
following data line because
of a page break.
True
Yes
False
No
Formula
Formula
wizard
In the event of a page
break, group header lines
are kept together as far as
possible, i.e. they are
printed together on the next
page.
True
Yes
False
No
Formula
Formula
wizard
Group header
lines
Keep together
Keep rows
together
13.10.2 Special Functions
Function
Purpose
FirstHeaderThisTable()
Returns whether the header of the table is being output for the
first time.
LastFooterThisTable()
Returns whether the footer of the current table is being output for
the last time.
RemainingTableSpace()
Returns the space available to data and group lines in a table
object.
TableWidth
Returns the width of the table object. Can be used to specify
relative column widths.
13.10.3 Line Properties
Also see chapter "Common Object Properties".
Property
Description
Value
Description
Show in
With this property, you can hide lines in the
workspace – this is very useful if you have a
True
Yes
342
Table Objects
Designer
lot of line definitions.
False
No
Formula
Formula
wizard
Default font
You can set the default font for the entire
table row. Newly inserted columns are
created with this font.
Anchor to row
Index (1-based) of the row, whose position
will be anchored with the starting position of
the selected row. 0=no anchoring. This function is not supported by all export formats.
Number
Formula
wizard
Anchor
True
Top
False
Bottom
Formula
Formula
wizard
Value
Description
Spacing
Describes if the line is
printed at the start or the
end of a reference line.
Here you define the top, bottom, right and left
spacing of the line. The "top" or "bottom"
values result in a corresponding space
between the individual table rows. With the
"left" and "right" spacing values, you can
specify the margin in relation to the table
object, i.e. you can indent lines or columns.
Font dialog
13.10.4 Group Line Properties
Group lines have the following additional properties:
Property
Description
Group sums
The selected sum variables are set to "0"
when the condition for the group line is met.
Dialog
This setting is useful to create so-called group
sub-totals, for example to add up the prices of
all articles in a particular article group.
Group by
This expression represents a key. Whenever
the result of the expression changes, a group
change is triggered.
Formula
Formula
wizard
Repeat as
header
Outputs the group header again after a page
break.
True
Yes
False
No
Formula
Formula
wizard
True
Yes
False
No
Formula
Formula
wizard
Break before
A page break will be triggered before
outputting the group header, i.e. each group
begins on a new page. If several group lines
are printed with this option at the same time,
they will appear one after the other on the
343
Overview of Properties
new page.
The RemainingTableSpace() function lets you
perform conditional breaks before outputting
group headers, e.g. "If there are only 2 inches
left on the page then break before outputting
the object". You will find more information in
chapter "Overview of Functions".
Break after
A page break will be triggered after outputting
the group footer lines, i.e. each group begins
on a new page.
True
Yes
False
No
Formula
Formula
wizard
13.10.5 Column Properties
The column properties correspond with the properties of the respective object type,
with some table-related restrictions.
Text and RTF text columns are special cases. A column property lets you switch
between these two text variations later on. The property list also changes
accordingly depending on this property.
Also see chapter "Common Object Properties".
Property
Description
Value
Options
(only with
some field
types)
Opens the "Content" dialog for the relevant
object type.
Content dialog
Drilldown
links
Opens the dialog for editing the drilldown
links. A drilldown report can also be started
from the preview.
Drilldown
dialog
Link
Link that is accessed when you click the
object (in the real data preview, with PDF or
HTML export).
Link
Formula
Formula
wizard
True
Yes
False
No
Formula
Formula
wizard
0
0
1
90
2
180
Example: file://c:\users\public\x.log or URL
Save as JPEG
(only with
pictures)
Rotation
Print the image as a JPEG file if possible (not
all file types support this option).
Rotates the object anticlockwise. For
example, you can rotate the column title or
barcode by 90° with this function.
3
344
Description
Table Objects
Formula
270
Formula
wizard
Format
Bar width
(only with
barcodes)
Please consider that the formatting relates to
the result of the entire expression. Use the
Date$() and Fstr$() functions in the formula
wizard if you only want to format part of the
expression (e.g. with text and number within
an expression).
True
The narrowest bar width in SCM units (1/1000
mm). 0 = automatic adjustment. Not
supported by all barcodes.
Formula
Formula
wizard
Orientation
0
Left
1
Centered
2
Right
Formula
Orientation of the barcode
within the object's frame
Dialog
False
Formula
Bar color (only
with
barcodes)
Color of the barcode.
Bar width
ratio (only
with
barcodes)
The relationship of the different widths of bars
or spaces. Not supported by all barcodes.
Formula
Formula
wizard
Show text
(only with
barcodes)
This property lets you specify whether the
content of the barcode is to be printed as
text.
True
Yes
False
No
Formula
Formula
wizard
True
Normal text
False
RTF Text
Background
The background of the columns.
Text format
For presenting the text column differently.
Sort Orders
(only header)
Sort orders (ascending+descending) for
interactive switching in the preview.
Stacked sort orders can be defined via a
dialog (requires application support), e.g. the
data is first sorted by country, and then
according to city/town.
Dialog
List
Single-tiered sort orders can be selected via
the list.
345
Overview of Properties
Alignment
(pictures)
Vert.
Alignment
Describes how the image is to be arranged in
the available area.
Vertical alignment of the content in the
available space.
(barcodes)
Alignment
(text)
Text alignment. Decimal means that numbers
are aligned by their decimal points.
Decimal
position
Justified
Width
Fit
346
The position of the decimal
point within the field, measured
from the left edge of the
previous frame.
Text is aligned to the right and the left (block
text).
0
Centered
1
Next to each
other (tiled)
2
Left top
3
Left bottom
4
Right top
5
Right bottom
6
Left
7
Right
8
Top
9
Bottom
0
Top
1
Centered
2
Bottom
Formula
Formula
wizard
0
Left
1
Centered
2
Right
3
Decimal
Formula
Formula
wizard
Number
Formula
Formula
wizard
True
Yes
False
No
Formula
Formula
wizard
The width of the column. You will get an error
message if the sum of the column widths
exceeds the total width of the table object.
Number
Formula
Formula
wizard
Specifies the behavior if the text is too long
for one line.
0
Truncate
Table Objects
To prevent long words from being truncated
with value "1" (wrap), you can use the "Force
wrap" option to ensure that a break occurs
after the last suitable character. Value "3"
(compress) reduces the character spacing and
should only be used to a limited extent in
order to guarantee legibility.
1
Wrap
2
Shrink
3
Compress
Formula
Formula
wizard
Widow/
Orphan
control
True
Yes
False
No
Formula
Formula
wizard
True
Yes
False
No
Formula
Formula
wizard
Prevents widow and orphan
lines.
The last line of a paragraph is
referred to as a widow line if it
is also the first line of a new
column or page.
If a new page or column is
triggered after the first line of a
new paragraph, this line would
appear alone at the end of the
page or column. In this case, it
is referred to as an orphan line.
Force
wrap
If a long word cannot be
wrapped, a line break will be
forced after the last suitable
character.
Height (not
text or RTF
text).
Fixed height of the field, the content is scaled
(0: no fixed height). The highest column
determines the overall height of a table row.
Number
Formula
Fixed height
(text or RTF
text).
Fixed height of the field irrespective of the
content. Excess text is discarded (0: no fixed
height). The highest column determines the
overall height of a table row.
Number
Formula
Blank
Optimization
Leading and double spaces are removed.
True
Yes
False
No
Formula
Formula
wizard
Line spacing
(only with
text)
Spacing between the text lines.
Frame
Specifies the frame characteristics and
margins for the individual table cells. Together
with the selected font, the "top" and "bottom"
cell margins determine the height of the table
rows.
Number
Formula
Formula
wizard
Formula
wizard
Formula
wizard
Dialog
Number
Formula
Formula
wizard
347
Overview of Properties
13.11 Chart Objects
Chart objects are elements of the report container.
13.11.1 Object Properties
See chapters "Common Object Properties" and "Report Container Object".
13.11.2 Special Fields
Fields
Purpose
LL.ChartObject.ArcIndex()
Returns the index of the current segment. The
largest segment has index 1, the second largest
has index 2 and so on.
LL.ChartObject.ArcPerc()
Returns the percentage share of the current
segment.
LL.ChartObject.ArcTotal()
Returns the absolute value of the total data volume
with pie charts.
LL.ChartObject.ArcTypeIsOthers()
Returns True, if the current segment is the "other"
segment.
LL.ChartObject.ArcValue()
Value of the segment.
LL.ChartObject.AxisCoordinate()
Describes the content of the source value.
13.11.3 Circle/Donut
Data Source
On the "Data source" tab, you can specify the coordinate values for the data.
Property
Description
Value
Description
Coordinate
value
Choose the data source for the segments
(name of the customer or employee, name of
the product category, month or quarter in the
case of dates etc.).
Formula
Formula
wizard
Minimum
share
Especially if you have a lot of values that have
small shares, it's sometimes a good idea to
group them together under "others". You can
define threshold values here which specify
when individual segments are to be grouped
together in one segment.
Number
Formula
wizard
Sort
coordinates
Specifies whether the segments are to be
sorted (alphanumeric or alphabetical).
True
Yes
False
No
Formula
Formula
wizard
348
Chart Objects
Number of
records for
design
The Designer does not yet have the "real" data
that appears in your chart when it is printed.
So that you can still get a picture in the
Designer preview of how your chart will look,
you can use this option to specify the number
of segments that are to be displayed in the
Designer.
Number
Formula
wizard
Filter
You can define a filter condition here. Only
data records that fulfill the condition will then
be used for the diagram. All data will be used
if you select "True".
True
True
False
False
Formula
Formula
wizard
Defines the text for the coordinate label on
the segment.
Formula
Formula
wizard
Fixed font
size
True
Yes
False
No
Formula
Formula
wizard
Formula
Formula
wizard
Coordinate
label
The font size is to be fixed
(otherwise it will become
smaller as necessary in order to
prevent overlapping).
Coordinate
label "Others"
Defines the text for the coordinate label on
the segment for the data grouped as "others".
Legend
Placement of the legend.
None
At chart
Top, Left,
Right, Bottom
Equidistant
(only if
placement is
"bottom" or
"top")
Describes, if the distance
between legend entries is
constant (Yes) or minimal
(No).
Border
Border of the legend.
Percentage
for Legend
Percentage of the area of the
available space for the legend.
0 means automatic
calculation.
True
Yes
False
No
Frame dialog
Formula
Formula
wizard
Segment
The "Segment" tab lets you make settings for calculating and presenting the
segment.
Property
Description
Value
Description
Coordinate
Here you specify the formula for the
Formula
Formula
349
Overview of Properties
value
coordinate value that determines the size of
the segment (total turnover, average turnover,
number of sales etc.).
Explosion
offset
The individual segments are accentuated by
bringing them forward out of the pie. The
value describes the distance by which the
segment is to be raised (as a percentage of
the pie's radius).
Number
Formula
wizard
Label on
object
Specifies whether a label is to be output on
the segment.
0
No
1
Yes
Formula
Formula
wizard
Formula
Formula
wizard
Number
Formula
wizard
Content
Width
Label text on the segment.
LL.ChartObject.ArcPerc
returns the percentage share
of the current segment.
Pie width in percent.
wizard
Chart
The "Chart" tab lets you make settings for the appearance of the pie.
Property
Description
Value
Description
Color mode
The segments are marked in different
colors so that the individual values can be
differentiated more easily. Color settings by
means of the "Colors" tab.
0
Monochrome
Segments
1
Colored
Segments
Formula
Illuminated
Formula
wizard
Sets whether the chart should be
illuminated.
True
Yes
False
No
Inner radius
Donut diagram: Relative position of the
inner donut radius (5-95%).
Number
Formula
wizard
Perspective
This property lets you choose whether the
diagram is to be created with a slight or a
strong perspective. Alternatively, you can
also use a simple parallel projection.
0
None
1
Slight
perspective
2
Strong
perspective
Formula
Formula
wizard
350
Chart Objects
Perspective
gradient
Separator lines
X axis rotation
angle
The perspective gradient produces a
brightness gradient across the surface of
the pie chart. Gradient in percent.
Number
Formula
wizard
Accentuat
e frame
True
Yes
False
No
Formula
Formula
wizard
True
Yes
False
No
Formula
Formula
wizard
Number
Formula
wizard
Number
Formula
wizard
Raise the edge of the pie
Display separator lines between the
segments.
The rotation angle upwards around the xaxis in degrees, maximum 90° (vertical).
Determines the horizontal positioning of the
pie. You can also specify this angle by
means of the rotation buttons that appear
on the workspace when you select a
diagram.
Y axis rotation
angle
The rotation angle in degrees around the
center of the pie, anticlockwise.
You can also specify this angle by means of
the rotation buttons that appear on the
workspace when you select a diagram.
13.11.4 Bar/Line/Areas/Bubbles
Category and Series Axes
If you have decided in favor of a three-axis diagram, you have both of these axes at
your disposal (x axis and x axis). With two-axis charts (e.g. a simple bar chart), you
only need the category axis (x axis).
Property
Description
Value
Description
Coordinate
value
Here you choose the data source for the
coordinate, e.g. "name" with persons or
"month" with dates.
Formula
Formula
wizard
Minimum
share (only
rel. stacked
charts)
Especially if you have a lot of values that have
small shares, it's sometimes a good idea to
group them together under "others". You can
define threshold values here which specify
when individual segments are to be grouped
together in one segment.
Number
Formula
wizard
351
Overview of Properties
Sort
coordinates
Specifies whether the coordinates are to be
sorted (alphanumeric or alphabetic).
True
Yes
False
No
Formula
Formula
wizard
Number of
sample
records
The Designer does not yet have the "real" data
that appears in your chart when it is printed.
So that you can still get a picture in the
Designer preview of how your chart will look,
you can use this option to specify the number
of sample records that are to be displayed in
the Designer.
Number
Formula
wizard
Start and end
values
rounded
Sets axis start values and axis end values to
round interval limits in cases where the
exploited data range is not too small (at least
80% of the entire value of the axis).
True
Yes
False
No
Formula
Formula
wizard
Defines the text for the axis label.
Formula
Formula
wizard
Rotation
Number
Formula
wizard
Defines the text for the coordinate label or the
legend.
Formula
Formula
wizard
Rotation
Rotation of the coordinate label
in degrees (with long texts).
Number
Formula
wizard
Fixed font
size
The font size is to be fixed
(otherwise it will become
smaller if necessary in order to
prevent overlapping).
True
Yes
False
No
Formula
Formula
wizard
Axis label
Coordinate
label
Legend
Rotation of the axis label in
degrees.
Placement of the legend (values differ
according to type and axis).
None
At Axis
Top, Left,
Right, Bottom
Use series to
352
Equidistan
t (only if
placement
is "bottom"
or "top")
Describes, if the distance
between legend entries is
constant (Yes) or minimal (No).
Border
Border of the legend.
True
Yes
False
No
Frame dialog
For the series axis (y-axis) in a three-axis diagram, you can also specify the
Chart Objects
determine the
values
values by means of series instead of formulas.
This means that you define the different series (e.g. measured value/target
value/actual value) with a single data record and can show them parallel
e.g. in a line diagram.
Select the "Use rows as data source" entry from the drop-down list above
the properties. This option changes the properties of the series axis and
you also have the "Series Definition" property. You define the individual
series by opening the "Series Definitions" dialog. You can define the
properties differently for each series and move it with the arrow buttons.
The property "Calculation Type" allows to display e.g. a moving average or
the aggregation of data.
Value Axis Settings
On the "Value axis" tab, you can make settings for calculating and presenting the
value axis of a bar chart or line diagram.
Primary axis/secondary axis: These charts support a second value axis. The second
axis is enabled on the "Diagram" tab. Use the drop-down box to switch to the
properties for the respective axis.
Property
Description
Value
Description
Coordinate
value
Here you specify the formula for the
coordinate value (total turnover, average
turnover, number of sales etc.).
Formula
Formula
wizard
Axis scale
Type of axis scaling.
0
None (linear)
1
Logarithmic,
base 10
(decimal)
2
Logarithmic,
base 2 (binary)
Calculation
Type
Formula
Formula
wizard
Allows to display e.g. a moving average.
0
Normal
Not available if the values of the series axis
are determined by series. Then this property
is available for each series in the "Series
Definitions" dialog.
1
Cumulative
Sum
2
Cumulative
Average
3
Simple
Moving
Average
4
Symmetrical
Moving
353
Overview of Properties
Average
5
Difference to
Previous Value
6
Average
7
Line Of Best
Fit
Number
Formula
wizard
True
Yes
False
No
Formula
Formula
wizard
Number
Formula
wizard
Do you want the value axis to start at a certain
minimum value or do you want to determine
the start value automatically?
True
Yes
False
No
You can limit the minimum height of the
displayed area, e.g. to cater for "anomalies”. If
you keep the default value "No", the diagram
will be adapted so that all values are
displayed.
Formula
Formula
wizard
Threshold
Number
Formula
wizard
0
No
1
Yes
Formula
Formula
wizard
Formula
Formula
wizard
1
Circle
Number of values
(only Calculation
Type 3 and 4)
Maximum
Value
Automatic
Number of preceding
or encircling values
that will be used for
the calculation.
Do you want the value axis to continue until it
reaches a certain maximum value or do you
want to determine the end value
automatically?
You can limit the maximum height of the
displayed area e.g. to cater for "anomalies”. If
your values contain extremely high peaks, you
can cap them by setting a maximum value
and show the progression of the "small"
values more clearly. If you keep the default
value "No", the diagram will be adapted so
that all values are displayed.
Threshold
Minimum
Value
Automatic
(only Lines,
Areas,
Bubbles)
Label on
object
354
Minimum axis value
Specifies whether a text is to be output on the
objects.
Content
Bubble
Design (only
Maximum axis value
Label text on the object.
Design of the bubbles.
Chart Objects
bubbles)
Presentation
2
Filled Circle
3
Filled circle
with frame
4
Light
Incidence
From Left
5
Light
Incidence
From Above
6
Light
Incidence
From Top Left
7
Ball
8
Glass Drop
9
Glass Drop,
Partially Trans.
Formula
Picture-File
Visual presentation.
1
Cylinder
Pie, Areas, Bubbles: -
2
Bar
Bar simple, clustered: 1, 2, 3, 8, 9
3
Pyramid
Bar Multi-Row: 1, 2, 3, 4, 8, 9
4
Ribbon
Bar stacked: 1, 2, 8
5
Line
Lines: 5, 6, 7
6
Symbols
7
Line+Symbols
8
Octaeder
9
Cone
Formula
Formula
wizard
Width
Bar/line width in percent
Number
Formula
wizard
Coordinate
lines
Specifies whether coordinate lines are to be
drawn on the background.
True
Yes
False
No
Formula
Formula
wizard
Zebra Mode
Specifies whether the background is to be
output in a zebra pattern.
Transparent
Pattern/block
355
Overview of Properties
color
Horiz.
Gradient
Vert. Gradient
Horiz. 2-part
gradient
Vert. 2-part
gradient
Partly
transparent
Axis label
Coordinate
label
Defines the text for the axis label.
Formula
Formula
wizard
Rotation
Number
Formula
wizard
Defines the text for the coordinate label or the
legend.
Formula
Formula
wizard
Rotation
Rotation of coordinate label in
degrees.
Number
Formula
wizard
Fixed font
size
The font size is to be fixed
(otherwise it will become
smaller as necessary in order
to prevent overlapping).
True
Yes
False
No
Formula
Formula
wizard
Rotation of the axis label in
degrees.
Coordinate
label "Others"
Defines the text for the coordinate label on
the bar for the data grouped as "others".
Formula
Formula
wizard
Coordinate
tick distance
Calculation of the distance between two
coordinate ticks.
True
Automatic
False
Manual
Formula
Formula
wizard
Legends
Placement of the legend for this axis.
None
At axis
Marker Color
Color of the coordinate marker lines
(tickmarks).
Number of
ticks
The number of subdivisions separated by tick
marks between the main coordinate
markings.
356
Color
Number
Formula
wizard
Chart Objects
Chart
The "Chart" tab lets you make settings for the appearance of bar charts and line
diagrams.
Property
Description
Value
Description
Secondary axis
Supports a secondary axis on the left hand
side. The axis properties are set on the
"Value Axis" tab. You select the respective
axis from a drop-down box.
True
Yes
False
No
Formula
Formula
wizard
Axis
assignment
0
Primary axis
1
Secondary
axis
Formula
Formula
wizard
Alignment
Specifies which value axis
the value is assigned to.
Alignment of the graphic elements, e.g. for
a horizontal bar chart.
Left to right
Axis Color
Color of the axes (or the frame with 3Ddisplay).
Color
Illuminated
Specifies whether the chart is to be
illuminated.
Linear Data Axis
Color mode
Bottom to top
True
Yes
False
No
Formula
Formula
wizard
Sets if numeric or date values should be
placed at the axis according to their value.
True
Yes
False
No
Specifies which axis determines the color.
0
Monochrome
1
x axis
2
y axis
Formula
Formula
wizard
Background
color
Background behind the diagram.
Isotropic
Specifies that both data axes (x and y axis)
use the same units.
Transparent
Pattern/block
color
True
Yes
False
No
Formula
Formula
wizard
357
Overview of Properties
Perspective
This property lets you choose whether the
diagram is to be created with a slight or a
strong perspective. Alternatively, you can
also use a simple parallel projection.
Projection (only
for 3D charts)
For flat projections, the front axis always
remains straight.
X axis rotation
angle
The rotation angle upwards around the x
axis in degrees, maximum 90° (vertical).
0
None
1
Slight
perspective
2
Strong
perspective
Formula
Formula
wizard
0
flat
1
3D
Formula
Formula
wizard
Number
Formula
wizard
Number
Formula
wizard
True
Yes
False
No
Formula
Formula
wizard
Determines the horizontal positioning of the
diagram in the available space. You can also
specify this angle by means of the rotation
buttons that appear on the workspace
when you select a diagram.
Y/Z axis rotation
angle
The rotation angle in degrees around the
center of the diagram, anticlockwise.
You can also specify this angle by means of
the rotation buttons that appear on the
workspace when you select a diagram.
Separator lines
Display separator lines between the
segments.
13.11.5 Funnel
Data Source
On the "Data source" tab, you can specify the coordinate values for the data.
Property
Description
Value
Description
Coordinate
value
This formula determines the coordinate value
of the data.
Formula
Formula
wizard
Filter
You can define a filter condition here. Only
data records that fulfill the condition will then
be used for the diagram. All data will be used
if you select "True".
True
True
False
False
Formula
Formula
358
Chart Objects
wizard
Axis label
Defines the axis label text.
Formula
Formula
wizard
Coordinate
label
Defines the text for the coordinate label on
the segment.
Formula
Formula
wizard
Fixed font
size
True
Yes
False
No
Formula
Formula
wizard
Legend
The font size is to be fixed
(otherwise it will become
smaller as necessary in order to
prevent overlapping).
Placement of the legend.
None
At chart
Top, Left,
Right, Bottom
Equidistant
(only if
placement is
"bottom" or
"top")
Describes, if the distance
between legend entries is
constant (Yes) or minimal
(No).
Border
Border of the legend.
Percentage
of Text
Percentage of the reserved
area of the available space for
the text.
True
Yes
False
No
Frame dialog
Formula
Formula
wizard
Funnel Segment
The "Funnel Segment" tab lets you make settings for calculating and presenting the
section.
Property
Description
Value
Description
Coordinate
value
Here you specify the formula for the
coordinate value that determines the size of
the section.
Formula
Formula
wizard
Explosion
offset
Describes the distance of the funnel
segments (100% = 50% of the total height of
the funnel).
Number
Formula
wizard
Label on
object
Specifies whether a label is to be output on
the segment.
0
No
1
Yes
Formula
Formula
wizard
Formula
Formula
Content
Label text on the section.
359
Overview of Properties
wizard
Chart
The "Chart" tab lets you make settings for the appearance.
Property
Description
Value
Description
Color mode
The funnel sectors are marked in different
colors so that the individual values can be
differentiated more easily. Color settings by
means of the "Colors" tab.
0
Monochrome
Funnel
Segments
1
Formula
Illuminated
Sets whether funnel should be illuminated.
Relative Width
of Funnel End
Width of the funnel end relative to the
funnel start. A width of 100% results in a
bar chart (pipeline).
Percentag
e of Funnel
End
Percentage of the funnel end
(in percent, -100% for the
length of the last funnel
segment
Colored
Funnel
Segments
Formula
wizard
True
Yes
False
No
Number
Formula
wizard
Number
Formula
wizard
Relative Width
of Funnel Start
Width of the funnel start relative to the
diagram size (respecting the legend if
necessary).
Number
Formula
wizard
Separator lines
Display separator lines between the
segments.
True
Yes
False
No
Formula
Formula
wizard
13.11.6 Map/Shapefile
Shapefile Selection
On the "Shapefile Selection" tab, you can specify the underlying shapefile data.
Property
Description
Data shapefile
This shapefile will be used for the data
(coloring etc.).
360
Value
Name
Object name.
File name
File name
Description
Name
Open file
Chart Objects
Formula
Background
Border
The fill color of a shape (might
be replaced by the color defined
on the 'Colors' tab).
The color of a shape
dialog
Formula
wizard
True
Visible
False
Invisible
Formula
Formula
wizard
0
Transparent
1
Pattern/Block
Color
Formula
Formula
wizard
Filter
This filter allows selecting
which shapes or lines from the
Shapefile shall be used for
displaying. The selection can be
limited using the shapes'
attributes
(LL.ChartObject.Shape.Attribute
…' fields).
Formula
Formula
wizard
Area
Selection
Select the area to display with
this filter.
True
Formula
False
Coordinates
True
Visible
False
Invisible
Formula
Formula
wizard
0
none
1
Mercator
(Cylindrical)
Rectangle (with Coordinates):
The displayed area will be
restricted to these coordinates.
For maps the typical coordinate
area is -180°…180° in x- and 90°…90° in y-direction.
Formula: 'True' for all
information (shapes, lines) of
the Shapefile data. The
selection can also be limited by
attributes (LL.ChartObject.
Shape.Attribute…' fields).
Centered
Projection
Centered display (only for
azimuthal projection). The data
will be centered according to
the area selection filter.
The projection type. Only reasonable for
Shapefiles with world coordinates (coordinate
area -180°…180°, -90°…90°)
361
Overview of Properties
2
Braun
(Cylindrical)
3
Kavrayskiy
(Azimuthal)
4
Sinusoidal
(Azimuthal)
5
EckertGreiffendorff
(Azimuthal)
6
Hammer
(Azimuthal)
7
Winkel III
(Azimuthal)
Background
Shapefiles
Shapefiles in this list will be placed 'behind'
the data to be able to display seas or similar.
Dialog
Foreground
Shapefiles
Shapefiles in this list will be placed 'over' the
data to be able to display rivers or similar.
Dialog
Assignment
The "assignment" tab lets you make the reference between the attributes and the
shapefile data.
Property
Description
Value
Description
Coordinate
value
This formula determines coordinate value of
the data.
Formula
Formula
wizard
Filter
Pie width in percent.
Number
Formula
wizard
Shape
Assignment
The individual segments are accentuated by
bringing them forward out of the pie. The
value describes the distance by which the
segment is to be raised (as a percentage of
the pie's radius).
Number
Formula
wizard
Axis Label
Axis label text.
Text
Formula
wizard
Legend
Placement of
the legend.
Placement of the axis´
legend.
None
At chart
Top,
Left,
Right,
Bottom
Equidistant
362
Describes, if the distance
True
Yes
Chart Objects
(only if
placement is
"bottom" or
"top")
between legend entries is
constant (Yes) or minimal
(No).
Border
Border of the legend.
Percentage
for Legend
Percentage of the area of the
available space for the
legend. 0 means automatic
calculation.
False
No
Frame dialog
Formula
Formula
wizard
Value
The "Value" tab lets you make settings for the appearance.
Property
Description
Value
Description
Coordinate
value
This formula determines coordinate value of
the data.
Formula
Formula
wizard
Label on Object
Sets the text to be displayed on the objects.
0
No
3
Centered
Formula
Formula
wizard
Colors
Property
Description
Value
Description
Shape
Legend
Define the legend of the chart here by making
a fix assignment of axis values to color a text.
'LL.ChartObject.AxisCoordinate' is the result
value of the current shape.
Color
Color dialog
Formula
Formula
wizard
Example: For the actual coloration you choose
the condition "True" and the formula
HeatmapColor (LL.ChartObject.
AxisCoordinate, -20.40).
For the discrete legend values, choose the
condition "False", for the legend-text '0 F' and
for the color 'HeatmapColor (0, -20.40)' etc.
13.11.7 Diagram Area (All Diagram Types)
On the "Diagram Area" tab you will find the settings for the title and the background.
Property
Description
Value
Description
Title
You can specify the title of your diagram
here. It will then be displayed at the upper
margin of the object. You can also select a
Formula
Formula
wizard
363
Overview of Properties
formula with the formula button. The "Font"
button lets you change the font for the title.
Click it with the left mouse button to open a
font selection dialog; a right-click resets the
font to the default value for the object.
Title Position
Background
Position of the diagram's title.
Select the color that you want to use for the
background of the available area. You can
also make it transparent. You can select a
color in the upper drop-down box or click
"..." to open a standard color selection
dialog.
Filling
0
Top
1
Bottom
2
Top, Centered
3
Bottom,
Centered
Formula
Formula
wizard
True
Yes
False
No
Formula
Formula
wizard
Filling for the available area
Transparent
Pattern/block
color
Horiz.
Gradient
Vert. Gradient
Horiz. 2-part
gradient
Vert. 2-part
gradient
Partly
transparent
Picture
Border
Border for the available area
Transparent
Pattern/block
color
Shadow
Shadow for the available area
Transparent
Pattern/block
color
Rounding
364
Rounding factor in percent for
the corners of the available
Number
Formula
wizard
Crosstab Objects
area: 0=rectangular (square
corners), 100=elliptical (short
edge is round)
13.11.8 Colors (All Diagram Types without Shapefiles)
Property
Description
Value
Description
Design
Scheme
Specifies the colors and color sequences for
the data rows that are not specified by the
"Fixed Colors". You can select a predefined
color set from the drop down list. These colors
can still be adjusted in the properties.
Color
Color dialog
Fixed Colors
You can assign fixed colors to particular axis
values. If you click the "New" button, you can
create a new assignment e.g.
Customers.Country = "Germany".
Color
Formula
wizard
13.12 Crosstab Objects
Crosstab objects are elements of the report container.
13.12.1 Object Properties
See chapters "Common Object Properties" and "Report Container Object".
13.12.2 Special Functions
Function
Purpose
Crosstab.Cells.Max() or
Crosstab.Cells.Min()
Returns the largest or smallest value in the entire crosstab.
Crosstab.Cells.Avg()
Returns the average value for the entire crosstab.
Crosstab.Col$()
or Crosstab.Row$()
Returns the description of the column or the row for the current
cell.
Crosstab.Value()
Returns the content of the cell (as a number).
Total()
You can use this function for calculations across all cells.
Otherwise, calculations are always made across all values that
affect the respective cell.
Join$()
Returns a collection of strings, separated by a particular
character.
365
Overview of Properties
13.12.3 Cell Properties
Select the respective column in the object dialog on the "Cell definition" tab. To select
multiple cells, hold down the CTRL key or you can draw a border around the cells with
the mouse.
Property
Description
Value
Description
Value
Formula for the value of the cell. This will be
evaluated by the Crosstab.Cells functions.
Formula
Formula
wizard
Displayed
contents
Text to be displayed in the cells. This can
differ from the value specified in the "Value"
property, e.g. if it is formatted.
Formula
Formula
wizard
Link URL
Link that is accessed when clicked (only real
data preview, PDF or HTML export).
Link
Link
Formula
wizard
Example: file://c:\users\public\x.log or URL
Rotation
Vert.
alignment
Alignment
(text)
Appearance
Condition
(only
366
Rotates the object anticlockwise. For
example, you can rotate the column title by
90° with this function.
Vertical alignment of the content in the
available space.
Text alignment Decimal means that numbers
are aligned by their decimal points.
0
0
1
90
2
180
3
270
Formula
Formula
wizard
0
Top
1
Centered
2
Bottom
Formula
Formula
wizard
0
Left
1
Centered
2
Right
3
Decimal
Formula
Formula
wizard
Decimal
position
Position of the decimal point
(only valid with decimal
alignment, negative means:
from the right.)
Number
Formula
Formula
wizard
Before
Entries
Sets wether the summary is to
be output before or after the
True
Yes
False
No
Crosstab Objects
summary cell)
Blank
Optimization
data line.
Leading and double spaces are removed.
Limit To
(only result
cell)
Limits the number of entries on this level to
the defined number (Top-N report in
combination with sort order by result.
Maximum
width
Specifies the maximum width for a cell. A line
break will be triggered if the text is wider.
Formula
Formula
wizard
True
Yes
False
No
Formula
Formula
wizard
Number
Entries
Formula
Formula
wizard
You can use this property in combination with
the Join$() function to display the individual
values in one cell.
Minimum
height
Sets the minimum height for the type of cell.
Minimum
width
Sets the minimum width for the type of cell.
Sort Order
(only Axis
Definition)
Sets sort order to be either ascending or
descending.
Number
Formula
Formula
wizard
Number
Formula
Formula
wizard
0
Ascending
1
Descending
2
Unsorted
3
Result
Ascending
4
Result
Descending
Formula
Formula
wizard
13.12.4 Properties for the Crosstab Area
Property
Description
Value
Description
Link URL
Link that is accessed when clicked (only real
data preview, PDF or HTML export).
Link
Formula
wizard
Number
Formula
wizard
Example: file://c:\users\public\x.log or URL
Minimum size
Specifies the minimum size to which the
crosstab may be reduced in order to avoid a
367
Overview of Properties
horizontal page break. 50=reduced by up to
50% to avoid a page break; 100=keep original
size.
Minimum
height
Specifies the minimum height that must be
available for the object. A page break will be
triggered if less space is available.
Number
Formula
wizard
Columns
Specifies the column properties in the event
of a page break
Formula
Formula
wizard
Repeat
labels
True
Yes
False
No
Formula
Formula
wizard
True: If the cross table is too
wide, the wrapped parts are
printed on shadow pages. A
shadow page does not count
as a "real" page and therefore
does not have a page number.
False: The wrapped parts are
output below the table.
True
Yes
False
No
Formula
Formula
wizard
Distance
before
Distance from the previous
element.
Number
Break level
Specifies the ideal break level.
0=inner group, i.e. the bottom
line of the column definitions.
Number
Formula
Formula
wizard
Forces a break after each
corresponding group.
True
Yes
False
No
Formula
Formula
wizard
True
Yes
False
No
Formula
Formula
wizard
Page Break
on Shadow
Pages
Force
Rows
Repeat
labels
Break level
Force
368
Specifies whether row labels
are to be repeated if there is a
column break.
Specifies whether column
labels are to be repeated if
there is a line break.
Formula
Formula
wizard
Specifies the ideal break level.
0=inner group, i.e. the bottom
line of the line definitions.
Number
Formula
Formula
wizard
Forces a break after each
corresponding group.
True
Yes
Gantt Chart
False
No
Formula
Formula
wizard
13.13 Gantt Chart
Gantt Charts are elements of the report container.
13.13.1 Object Properties
See chapters "Common Object Properties" and "Report Container Object".
13.13.2 Special Fields
Fields
Purpose
LL.GanttObject.CurrentBarLabel
Returns the bar label of the current bar.
LL.GanttObject.CurrentProjectDepth
Returns the index of the current Summary Task.
13.13.3 Content
Property
Description
Value
Description
Summary
Task Name
Field or formula for the name of a summary
task
Formula
Formula
wizard
This setting is a mandatory field. If you do not
want to display any summary tasks, enter the
same value in this field as for "Task Name".
Task Name
Field or formula for the name of a task
(Mandatory field).
Formula
Formula
wizard
Start
Field or formula for the starting time of a task.
It is automatically set to the start of the first
task for summary tasks (Mandatory field).
Formula
Formula
wizard
End
Field or formula for the end time of a task. It is
automatically set to the end of the last task
for summary tasks. The task is interpreted as
a milestone if the end time equals the start
time and the duration is 0 (Mandatory field).
Formula
Formula
wizard
Duration
Field or formula for the duration of a task (in
days). It is automatically calculated by the
date difference for summary tasks.
Formula
Formula
wizard
Progress
Field or formula for the progress of a task (in
percent).
Formula
Formula
wizard
Bar Label
Field or formula for the bar label of the task.
Formula
Formula
wizard
369
Overview of Properties
Regard Time
Defines if the given start and end values are
exact (start=end corresponds to 0 days) or
should be calculated in days (start=end
correspond to 1 day).
Title Line
Properties of the title lines
Summary
Task Rows
Properties of the summary task rows.
Row
Properties
Task Rows
True
Yes
False
No
.
See Task Rows
Properties of the task rows.
Row
Properties
Table Area
Rounding
Rounding of the bar.
Formula
Formula
wizard
Bar height
(Finished)
Bar height of the finished
fraction of the task in percent
of the row height. (0: don't
show bar)
Formula
Formula
wizard
Bar height
(Unfinished)
Bar height of the unfinished
fraction of the task in percent
of the row height. (0: don't
show bar)
Formula
Formula
wizard
Filling
(Finished)
Properties of the bar filling for
the finished fraction of the
task.
See chapter "Common
Object Properties"
Filling
(Unfinished)
Properties of the bar filling for
the unfinished fraction of the
task.
See chapter "Common
Object Properties"
Defines the table area displayed in the Gantt
Chart.
Index/
Name/
Start/
End/
Duration/
Progress
Chart Area
True
Show
False
Don't Show
Null()
Automatic
Formula
Formula
wizard
Defines the period.
Start
Time/Date
370
Defines if a continuous index
for (summary) tasks /
the task name /
the task start /
the task end /
the task duration /
the task progress is displayed.
Defines the start time or the
start date.
Gantt Chart
End
Time/Date
Defines the end time or the
end date.
Null()
Automatic
Formula
Formula
wizard
Time Unit
Defines the time unit
1
Decades
2
Years
3
Quarters
4
Months
5
Weeks
6
Days
7
Hours
Format
Defines the format of the time
unit.
Format
Formula
wizard
Highlighted
Days
If the time unit is 'Days' or
'Weeks', you can select here if
and which days should be
highlighted. The value is a
comma-separated list,
1=Monday, 7=Sunday (e.g.
"6,7")
Commaseparate
d list
Formula
wizard
Superordin
ate Time
Unit
Defines the superordinate time
units.
0
Centuries
1
Decades
2
Years
3
Quarters
4
Months
5
Weeks
6
Days
Formula
Formula
wizard
Minimum
Width
The minimum width of a time
interval cell.
Range Marker
You can mark the point in time or a range
here.
Grid Mode
For monochrome printers that have problems
displaying gray lines the black and white
mode for printing to a black and white printer
can be enabled.
0
Off
1
Gray
2
Black/White
Link that is accessed when clicked (only real
data preview, PDF or HTML export).
Link
Link
Link URL
Formula
371
Overview of Properties
wizard
Example: file://c:\users\public\x.log or URL
Distance
before
Distance between the diagram blocks for a
horizontal break.
Formula
Formula
wizard
Minimum
Height
Sets the minimum height required for the
object. If less space is available, a page break
is triggered.
Formula
Formula
wizard
Page Break
on Shadow
pages
If the object is too wide, the remaining
contents will be printed on shadow pages. A
shadow page does not count as a "real" page
and therefore does not have a page number.
True
Yes
False
No
Formula
Formula
wizard
True
Yes
False
No
Formula
Formula
wizard
True
Yes
False
No
False: The wrapped parts are output below
the table.
Repeat
labels
Break evenly
Sets whether the row labels
are to be repeated in case of a
horizontal page break.
Defines if a horizontal break is made at the
borders of the superordinate time interval if
possible.
13.14 Gauge Objects
Gauges can be placed in table lines or as an object.
13.14.1 Object Properties
See chapter "Common Object Properties".
13.14.2 Content
You define the appearance of the gauge on the "Content" tab.
Property
Description
Background
Filling properties (background of the gauge).
Value
Color. Color of the background.
Fading-in factor. Value ranging from 0
(transparent) to 100 (opaque).
Description
Color
Value
Formula
wizard
Pointer options
Color. Color of the pointer.
(only linear
Gauge)
372
Background.
Color
Gauge Objects
(only speedo)
Size factor. Specifies the size of the pointer
in relation to the scale range.
Value
Formula
wizard
Display Range. Describes the percentage
range of the available area (the radius or the
width) in which this element is displayed.
Value
Formula
wizard
Glass properties
Color. Glass color.
Color
Fading-in factor. Value ranging from 0
(transparent) to 100 (opaque).
Value
Formula
wizard
Length/width
ratio (only linear
Gauge)
Specifies the length/width ratio for the
linear gauge. The bigger the value, the
smaller it will be drawn in the available
space.
0
area-filling
1 -5
1:1 - 5:1
Scale range
rotation angle
Clockwise rotation angle for the scale (0°=
down).
Value
Formula
wizard
White space
before scale
range
Specifies the free space between the
beginning of the gauge and the beginning
of the scale (max. 50%).
Value
Formula
wizard
White space
after scale
range
Specifies the free space between the end
of the gauge and the end of the scale (max.
50%).
Value
Formula
wizard
Tickmarks
Scale type
0
None
1
Scale type 1
2
Scale type 2
3
Scale type 3
Value
Formula
wizard
Display range. The "Minimum" and
"Maximum" values describe the percentage
range of the available area for the tickmark.
Color. Color of the tickmark.
Color
Tickmark width. Specifies the width of the
scale tickmark (percentage value).
Value
Formula
wizard
Detail level. Specifies the maximum
tickmark level to be output. 0=top level
only.
Value
Formula
wizard
True
Automatic
Filling.
Intermediate tick position. Specifies where
the intermediate tickmarks are to be placed.
Calculation type. Calculation type of the
373
Overview of Properties
coordinate tickmark distance (ticks).
Scale labels
Signal ranges
Scale Labels
False
Manual
Value
Formula
wizard
Distance. The user-defined distance
between two coordinate ticks.
Value
Formula
wizard
Scale label properties.
True
Show
False
Hide
Display range. The "Minimum" and
"Maximum" values describe the percentage
range of the available area for the tickmark.
Value
Formula
wizard
Rotated. Specifies whether the font is
rotated.
True
Yes
False
No
Size adjustment. Specifies whether the font
size may be reduced so that the lettering
fits the area.
True
Yes
False
No
Alignment. Text alignment.
0
Left
1
Centered
2
Right
Value
Formula
wizard
The properties of the signal ranges. You can
give the ranges different colors, e.g. to
signalize an optimum range. You define the
start value, start color, end value and end
value of the different ranges in a dialog.
True
Show
False
Hide
Display range. The "Minimum" and
"Maximum" values describe the percentage
range of the available area for the tickmark.
Value
Formula
wizard
List of labels. You can open a dialog to
define the rotation, frame size, background,
font, format and position of the individual
labels.
True
Show
False
Hide
Dialog
Dialog
You specify the position in relation to the
area of the gauge (measured from left to
right). For example, a vertical and horizontal
position of 50% each will position the label
precisely in the middle.
Minimum value
374
Minimum value of the scale. Calculated e.g.
Value
Formula
Data Graphic
with Precalc().
Maximum value
Start value
Value
wizard
Fit to distance The minimum value is
adjusted automatically to fit the coordinate
tickmark distance.
True
Yes
False
No
Maximum value of the scale. Calculated e.g.
with Precalc().
Value
Formula
wizard
Fit to distance The maximum value is
adjusted automatically to fit the coordinate
tickmark distance.
True
Yes
False
No
Defines where the bar for displaying the
value starts. 'Automatic' means: if the scale
is exceeding 0, it is 0, otherwise it is the
minimum value.
True
Automatic
False
Manual
Value to be indicated by the pointer.
Value
Formula
wizard
13.15 Data Graphic
Data Graphics can be placed in table lines or as an object.
13.15.1 Object Properties
See chapter "Common Object Properties".
13.15.2 General
Property
Description
Value
Description
Value
Value displayed in the data graphic. Defines
the bar length and/or the symbol.
Value
Formula
wizard
Visible
True
Yes
False
No
The value is also displayed as
text.
Minimum
Value
Minimum Value (corresponds to 0% for
percentage scaling).
Value
Formula
wizard
Maximum
Value
Maximum Value (corresponds to 100% for
percentage scaling).
Value
Formula
wizard
13.15.3 Bar Properties
Property
Description
Value
Description
Rounding
Rounding of the bar.
Value
Formula
wizard
Alignment
Alignment of the bar
0
Left
375
Overview of Properties
Vertical
Alignment
1
Centered
2
Right
3
Originating
from the
baseline to
the left or
right
Base Value
(Alignment
= 3)
Below this value the bar is
running to the left, above to the
right.
Value
Formula
wizard
Base Line
The base line is displayed.
True
Yes
False
No
0
Top
1
Centered
2
Bottom
Value
Formula
wizard
Vertical Alignment
Bar Height
Height of the bar (0: no fixed height).
Value
Formula
wizard
Ranges
Defines how the value ranges for the data
graphic are defined.
True
Automatic
False
User Defined
Ranges
List
List with value ranges for the
bar color assignment.
Dialog
13.15.4 Symbol-Properties
Property
Description
Value
Description
Alignment
Alignment of the symbol
0
Left
1
Centered
2
Right
Value
Formula
wizard
0
Top
1
Centered
2
Bottom
Value
Formula
Vertical
Alignment
376
Vertical Alignment
Checkbox Objects
wizard
Symbol Group
Desired symbol group.
Symbol
Height
Height of the symbol (0: no fixed height).
Value
Formula
wizard
Ranges
Defines how the value ranges for the data
graphic are defined.
True
Automatic
False
User Defined
Ranges
List
List
List with value ranges for the
symbol assignment.
Dialog
13.16 Checkbox Objects
Checkboxes can be placed in table lines or as an object.
13.16.1 Object Properties
See chapter "Common Object Properties".
Property
Description
Value
Description
Picture for
'True', 'False'
or 'NULL'
Sets how the 3 checkbox states should look
line if the calculation of the content formula
returns true/false/NULL.
0
No Picture
1
Internal Pic.
2
External Pic.
List
Picture
Internal
Source
Selected internal picture.
Frame Color.
Icon Color.
External
Source
Source of the external picture.
File name
Formula
Variable
13.17 Formatted Text Objects
As opposed to the normal text object, with this object, you can also change the
formatting of the text within a line.
Formatted Text objects should always be created in the maximum size you want, the
object shrinks at print time to the required size. This behavior is particularly useful for
linking objects.
Note that Windows converts embedded pictures in Formatted Text Objects (inserted
e.g. via the clipboard) to bitmaps. To minimize the file size, we suggest using a
377
Overview of Properties
picture object directly and linking it to the formatted text – this object supports image
compression.
A right-click menu provides various formatting options (e.g. Superscript, Subscript).
Figure 13.8: Context menu
Note: Normal text objects can be printed considerably faster. You should
therefore only use formatted text objects if you need particular formatting that you
cannot achieve - or cannot achieve without difficulty - in normal text objects.
13.17.1 Object Properties
Also see chapter "Common Object Properties".
Property
Description
Value
Description
Rotation
Rotates the object anticlockwise.
0
0
1
90
2
180
3
270
Formula
Formula
wizard
True
Yes
False
No
Formula
Formula
wizard
Page break
Specifies whether the object can trigger a
page break or a text overflow.
If this property is enabled, the content will be
wrapped to the next page automatically (or to
another interlinked RTF object) if it exceeds
the size of the object. This is an interesting
option e.g. with RTF objects that are to cover
several pages. With labels, the next label will
only be started when all objects have been
printed as a result of this option in the
378
Form Control Objects
previous label. You might not be able to set
this property if page breaks are not supported
by the higher-level program.
13.18 Form Control Objects
The user can fill out form control objects directly in the preview and in the PDF
format. He can also trigger actions such as send by email. You control the element's
basic behavior by selecting a type. The properties that you have at your disposal
change depending on the type that you select. Formula objects can also be inserted
into table columns.
Also see chapter "Common Object Properties".
Property
Description
Value
Description
Type
Specifies the type of the element.
0
Edit
1
Checkbox
2
Combobox
3
Button
Tooltip
Tooltip that is to appear
13.18.1 Edit
Property
Description
Value
Description
Force input
Specifies whether the user must make an
entry.
True
Yes
False
No
Formula
Formula
wizard
Field name
Specifies the field name for a possible data
export via XML/XFDF. Free text must be
enclosed in quotation marks.
Name
Validation
expression
Regular expression for validating the input.
Formula
wizard
Examples:
Field not empty: ".+"
Simple email validation: "^.+@.+\..{2,3}$"
Error
message
Message to be displayed if
validation fails.
Value
Default value for the input field.
Alignment
Text alignment.
Formula
wizard
Formula
wizard
0
Left
379
Overview of Properties
(text)
Background
1
Centered
2
Right
Formula
Formula
wizard
0
Transparent
1
Color
Formula
Formula
wizard
Specifies whether the input field can consist
of multiple lines. If you select single-line,
more characters can still be entered and the
input field scrolls automatically. However, in
this case, the excess characters will be
truncated when the field is output.
True
Yes
False
No
Formula
Formula
wizard
Specifies whether the object is to have a
border.
True
Yes
False
No
Formula
Formula
wizard
Specifies whether the field is to have a
colored background.
Color
Multi-line
Border
Background color
Color
Color of the border.
Width
Width of the shadow, in the unit
of measure of the workspace.
Number
Formula
Formula
wizard
13.18.2 Checkbox
Property
Description
Value
Description
Field name
Specifies the field name for a possible data
export via XML/XFDF. Free text must be
enclosed in quotation marks.
Formula
Name
Value
Default value for the input field.
Background
See edit type
Border
See edit type
Type
Appearance of the checkbox.
1
Tick
2
Cross
3
Filled
Formula
Formula
380
Form Control Objects
wizard
13.18.3 Combobox
Property
Description
Value
Description
Force input
Specifies whether the user must make an
entry.
True
Yes
False
No
Formula
Formula
wizard
Items
Default entries available in the combobox
List
List of items
for selection
Field name
Specifies the field name for a possible data
export via XML/XFDF. Free text must be
enclosed in quotation marks.
Formula
Name
Validation
expression
only with
variable text.
Regular expression for validating the input.
Only available when Editable=yes.
Formula
wizard
Error
message
Formula
wizard
Editable
Message to be displayed if
validation fails.
Specifies whether the user may enter other
values that are not included as selection
items.
Value
Default value for the input field.
Alignment
See edit type
Background
See edit type
Border
See edit type
True
Yes
False
No
Formula
Formula
wizard
Formula
wizard
13.18.4 Button
For PDFs, only value 4 is supported.
Property
Description
Value
Description
Action
Specifies the possible behavior. Only available
with buttons.
0
Send as mail
1
Save
2
Send via HTTP
POST
0: Send as mail: You can set default values
for the normal email-relevant fields.
1: Save: Saves the preview file or the input
data in the chosen format.
3
Link
381
Overview of Properties
2: Send: via HTTP POST
4
PDF signature
field
Formula
Formula
wizard
3: URL: Internet address to be accessed
when clicked. The object is transparent which
means that you can place it on top of other
objects to create links for all objects.
4: This will render as a signature field in your
resulting PDFs (only for PDF).
Text
Button label
13.19 HTML Text Objects
HTML objects are used for displaying HTML content.
For rendering HTML content a separate component is used that supports a limited
set of CSS properties. JavaScript is not supported. The correct reproduction of entire
web pages is not the main focus, but rather the ability to quickly and easily output
simple HTML streams.
13.19.1 Object Properties
See chapter "Common Object Properties".
13.19.2 Object Content
Property
Description
File
Choose this option if you want to display the content of a HTML file that
you have saved. The "Open" button displays a file selection dialog with
which you can locate the file that you want. The file must be located on a
local drive or network.
URL
This option lets you display the content of web sites (e.g. www.combit.net).
These web sites are loaded from the Internet or intranet online during run
time, which means that you must always have an active Internet
connection.
Formula
If your application provides certain content in HTML format, you can also
select it here. In this case, please consult the documentation for your
application.
Fit to object
If you enable this option, the entire content of the object will be adjusted to
fit the size of the object. Otherwise, the width will be adjusted and the
output will be spread across several pages.
13.20 PDF
The PDF Object is for displaying PDF documents.
382
PDF
If possible, the standard printer in the system is used to publish PDFs in EMF
format. The quality can therefore be improved as needed if the standard printer
has a sufficiently high resolution.
Unique feature of a PDF object inside a table when a variable line height (height
= 0) is configured: The same height will be used for all pages in the PDF
document. In this instance, the first page to be printed in the PDF document
(can be specified via the "Page Range" setting) will be checked. If this page fits
inside the line then the height will also be used for the following pages. If the
height does not fit, then the PDF object will, in some cases, be displayed
"shrunken".
Transparence: If the PDF object is used outside of a table then it will always be
transparent. Inside the table a background is supported.
So that the PDF object can also display an encrypted PDF document, a potential
mandatory password must be correct. In addition, the "Printing Allowed"
permission must be defined in the PDF document. Otherwise the PDF object will
not be able to display the defined PDF document.
13.20.1 Object Properties
See chapter "Common Object Properties".
13.20.2 Object Content
Property
Description
Value
Description
Data Source
Source of the PDF file.
File
Formula
wizard
File name
Fixed file name: is evaluated if
you have selected "File name"
as the data source property.
Open file
dialog
You then select the file by
means of the file selection
dialog.
Relative
Path
Relative path
True
Yes
False
No
Formula
If you have selected "Formula"
as the data source property,
the file name is derived from a
formula. The formula must
return a PDF-file.
Formula
Formula
wizard
Include in
Project
The PDF will be embedded in
the project.
True
Yes
False
No
383
Overview of Properties
Formula
wizard
Page
Range(s)
The displayed PDF pages can
be defined. A commaseparated list can be defined
as a formula, e.g. '1,3-4,10-'.
"1-."
All Pages
Formula
Formula
wizard
Password
If the PDF is password
protected the password can be
entered here.
Formula
Formula
wizard
Original
Size
Sets whether the PDF is
rendered in its original size or
fit to the object.
True
Yes
False
No
Not
Defined
Not Defined
Selects whether
the PDF is displayed with its
true proportions
or not.
True
Yes
False
No
Formula
Formula
wizard
Sets the
alignment of the
PDF within the
object's frame.
0
Centered
1
Tiled
2
Left Top
3
Left Bottom
4
Right Top
5
Right Bottom
6
Left
7
Right
8
Top
9
Bottom
Selects whether the object can
trigger a pagebreak.
True: All pages of the PDF file
will be printed.
False: Only the first page set in
"Page Ranges" will be printed
and repeated on all following
pages.
True
Yes
False
No
Formula
Formula
wizard
Define how fonts will be
handled. The option "as
outlines" is useful if the font is
0
Windows Font
Mapping
Keep
Proportions
Alignment
Pagebreak
Font
handling
384
Formula
OLE Container
not available on the target
system. When enabled, the
preview file may be larger and
search in the preview cannot
be used.
1
as outlines
2
Use
embedded
fonts
Formula
Formula
wizard
13.21 OLE Container
OLE containers are used for including OLE Server Documents in your project.
13.21.1 Object Properties
See chapter "Common Object Properties".
13.21.2 Object Content
For the content, there are three options available:
Filename: Link to a file that needs to be available at print time.
Embedded: You select the object type via the standard Windows dialog "Insert
Object". Here you can choose an existing file ("Create from File") or create a new
file. The object will be embedded in the project. This can be useful e.g. for
simple drawings or rather static objects.
Formula: Allows a formula for the file name.
13.22 Form Template Objects
Form templates are placed in the background of the workspace as a template so that
other objects can be aligned to them. This is helpful when designing complex forms
based on templates. The form template is a special case as it is not printed.
13.22.1 Object Properties
Property
Description
File name
Choose the file containing the form template
that you want.
Relative
path
Visible in
preview
Value
The path is relative to the
project path.
Specifies whether the template is to be visible
in the preview.
Description
Open file
dialog
True
Yes
False
No
True
Yes
False
No
Formula
Formula
wizard
385
Overview of Properties
Fade color
Keep
proportions
386
The selected color will be linked with “or” to
the template image in order to lighten the
image when displaying.
Selects whether the Template is displayed
with its true proportions or not.
Color dialog
Predefined colors and formula wizard
True
Yes
False
No
Formula
Formula wiz.
Index
14. Index
@
@CollectionVariable
@Report Parameters
@Sum
@User
169
195
167
168
A
Active design layout
Alignment
Alignment Grid
Analyses
Appearance condition
Arithmetic operators
AutoRecovery
181, 308
61
61
102
65, 311
220
64
B
Barcode Objects
Functions
Properties
Barcodes
2-of-5 Datalogic
2-of-5 Industrial
2-of-5 Interleaved
2-of-5 Matrix
3-of-9
4CB
Alpha39
Aztec
Codabar
Code 39 with CRC
Code 93
CODE11
Code128
Code128-Full
Code39
datamatrix
Deutsche Post
DP-Identcode
DP-Leitcode
233
327
327, 329
331
331
331
331
331
333
331
334
331
331
331
331
332
333
331
334
336
335
335
EAN128
333
EAN128-Full
333
EAN-13
329
EAN-14
330
Extended code 39
331
FIM Barcodes
335
GS1 128
333
GS1 DataBar
333
GS1 DataBar Expanded
333
GTIN-13
329
IM
333
ISBN
333
JAN-13
329
KIX
336
Maxicode
336
MSI
334
NVE/SSCC
334
PDF417
334
Postnet
336
Premiumadress
336
PZN
334
QR Code
335
Royal Mail
336
SSCC/NVE
334
UCC-13
329
UCC-14
330
UPC-A
330
UPC-E
330
USPS4CB
333
Boolean operators
219
Buffer for values
168, 169, 292
Building blocks
173
C
Change position
Change width individually
Charts
Calculation Type
Funnel
Map
Minimum share
Mixing Chart Types
59
91
102, 348
353
113
115
348, 351
120
387
Index
Pipeline
113
properties
348
Shapefile
115
Special Fields
348, 369
Straight Line Mean
120
Trend Line
120
Checkbox
Properties
377
Checkbox
377
Checkbox
122
Circle objects
325
Collection Variables
169
Color
312
Column properties
344
column width
64
Comments
208
Conditional Formatting
312
Conditions
240
Conjunctions
219
Content
313
Copies (Print)
176
Copies of Objects
60
Copy
308
Copy Formats
56
Counters
167, 216, 242
Create a mail merge project
68
Create invoice
27
enclosure
96
Crosstab
102, 130, 365
Crosstab-Functions
136, 243
Properties
365
D
Data Graphic
375
Properties
375
Data Graphic
124
Database tables
201
Date
calculating with
227
Format
214
Formats
247
Date-Functions
246
Design Scheme
308, 313
Diagrams
see charts
Display condition for issue print 314
388
Drag & Drop
15
Drawing objects See picture objects
Drilldown reports
99, 144
embedded reports
309
E
Ellipse objects
insert
properties
Errors
Exceeding text transfer
Expandable Region
Export
Excel
export as picture
other formats
PDF, RTF, XLS, XPS, HTML
Export media
Expressions
date formats
fixed text
functions
numerical formats
operators
variables
325
325
325
221
73
99
193
314
193
193
177
201
214
206
209
215
219
205
F
Fields
File
Importing
print sample
Test Print
File menu
Filter
First page
FirstHeaderThisTable
Fixed text
Form control objects
Form templates
Format painter
Formatted text objects
Properties
Formatting
Conditional Formatting
201, 225
61
195
195
11, 55
65, 165
65
258
206
379
175, 385
56
72, 377
377
315
312
Index
date format Date$
Format editor
number format FStr$
Formula Errors
Formula wizard
Autocomplete
Chevrons
Font
Formulas
comments
Frame
Functions
Abs
AddDays
AddHours
AddMinutes
AddMonths
AddSeconds
AddWeeks
AddYears
Alias$
ApplicationPath$
ArcCos
ArcSin
ArcTan
Asc
AskString$
AskStringChoice$
ATrim$
Avg
Barcode
Barcode$
BarcodeType$
BasedStr$
BinaryAND
BinaryNOT
BinaryOR
BinarySHL
BinarySHR
BinaryXOR
BMPMapToGray
BMPRotate
Capitalize$
Case$
Ceil
214
315
215
221
202
203
203
63
208
316
201, 209
227
227
227
228
228
228
228
229
229
229
230
230
230
231
217, 231
232
232
233
213, 233
234
234
234
234
235
235
235
236
236
236
237
237
237
238
Century
ChangeLightness
CheckMod10
Chr$
ChrSubst$
Cond
Constant.Pi
Contains
Continued
Cos
Count
CountIf
Crosstab.Cells.Avg
Crosstab.Cells.Max
Crosstab.Cells.Min
Crosstab.Cells.Sum
Crosstab.Col
Crosstab.Col$
Crosstab.Row
Crosstab.Row$
Crosstab.Value
CStr$
CurrentDataLineIndex
CurrentLineIndex
CurrentLineTypeIndex
Date
Date$
DateDiff
DateDiff$
DateHMS
DateInLeapYear
DateInRange
DateToJulian
DateYMD
Day
Day$
Decade
DisplayValues$
Distinct
Dow
Dow$
Drawing
Drawing$
DrawingHeightSCM
DrawingWidthSCM
238
239
239
239
240
217, 240
241
241
241
242
216, 242
216, 243
243
244
244
244
244
244
245
245
245
245
246
246
246
212, 246
214, 247
249
249
250
251
251
251
252
252
252
252
253
253
254
254
213, 254
254
255
255
389
Index
Empty
EndsWith
Evaluate
Even
Exists
Exp
Exp10
ExtractDate
ExtractTime
FirstHeaderThisTable
Floor
Frac
FStr$
GeometricAvg
GetValue
GetVar
HeatmapColor
Hexadecimal
Hour
HSL
HTMLtoPlainText$
Hyperlink$
If (Cond)
Int
IsNull
IsNullOrEmpty
IssueIndex
Join$
JulianToDate
LangCase$
LastFooterThisTable
Lastpage
Left$
Len
LibraryPath$
LoadFile$
Locale$
LoccCurr$
LocCurr$
LocCurrL$
LocDate$
LocDateTime
LocNumber$
LocTime$
LocVal
390
255
256
256
256
257
257
257
257
258
258
258
259
215, 259
260
261
261
261
234
262
262
263
263
217, 263
264
219, 264
264
263
265
265
265
266
217, 266
213, 266
267
267
268
268
215
268
215, 269
269
270
270
270
271
LocVal
Log
Log10
Lower$
LTrim$
Max
Maximum
Median
Mid$
Min
Minimum
Minute
Mode
Month
Month$
NativeAvg
NativeCount
NativeMax
NativeMin
NativeStdDevPop
NativeStdDevSamp
NativeSum
NativeVarPop
NativeVarSamp
notation
Now
NthLargest
NthLargestIndex
NthValue
Null
NullSafe
NumInRange
Odd
Ord
overview
Page
Page$
PlainTexttoHTML$
Pow
Precalc
Previous
PreviousUsed
ProjectParameters
ProjectPath$
Quarter
212
271
272
272
272
273
273
273
213, 274
274
274
275
275
275
276
276
276
277
277
278
278
278
279
279
209
280
280
280
281
219, 281
219, 281
282
282
282
227
216, 283
216, 283
283
283
284
284
284
285
286
286
Index
RainbowColor
RegExMatch$
RegExSubst$
RemainingTableSpace$
Rep$
ReportSectionID$
RGB
Right$
Roman
Round
RTFtoPlainText$
Rtrim$
RTrim$
Script$
Second
SetVar
Sign
Sin
Sqrt
StartsWith
StdDeviation
Str$
StrPos
StrRPos
StrSubst$
Sum
Sum
TableWidth
Tan
TextWidth
Time$
Today
ToFrac$
Token$
ToNumber
ToRTF$
ToString$
Total
TotalPages$
Translate$
UnitFromSCM
Upper$
URLDecode$
URLEncode$
Val
287
287
287
288
288
289
289
213, 289
290
290
290
291
213
291, 292
292
292
293
293
294
294
294
211, 295
295
296
296
297
217
297
298
298
298
299
299
299
300
300
300
301
301
301
302
303
302
302
212, 303
value types
Variance
WildcardMatch
Woy
Year
Year$
Funnel
209
303
304
304
304
305
113
G
Gantt
Gantt Chart
Properties
Gauges
Properties
Global variables
Group Lines
properties
Grouping of Objects
Guide
138
369
369
102, 126, 372
372
167, 168, 169
87
343
60
62
H
Hexadecimal
HTML object
234
382
I
If-Function
Importing
Index
Index Level
Insert
Barcode Objects
chart
Checkbox
crosstab
Data Graphic
ellipse objects
form control objects
form templates
formatted text objects
Gantt Chart
gauge
HTML objects
line objects
263
61
186
317
327
348
377
365
375
325
379
175, 385
72, 377
369
372
382
323
391
Index
OLE container
174, 385
PDF objects
174, 382
Picture objects
325
rectangle objects
324
report container
337
Report Parameters
195
RTF objects
72, 377
table objects
339
text objects
320
Interlinking
154
IsForcedPage
224
IsNull
264
Issues
display condition for objects 314
display condition for pages
308
managing issues
308
L
Labels
offset
saving templates
Last page
LastFooterThisTable
Lastpage
Layers
assign layers
Conditions
Layout
Layout preview
Layout regions
Line objects
insert
properties
Linefeed
LL fields
LL variables
LoadFile$
Logical operators
179
180
67
266
266
67
65
176
11, 50
181
323
323
323
207
225
223
97
221
M
Mail variables
Managing copies
Map
Mini toolbar
392
310
183
115
55
Minimum page count
Moving objects
Multi-column
Multiple Copies
310
59
152, 340
60
N
Names
Nested Tables
Null
318
89
281
O
Objects
10
Alignment
61
Appearance condition
311
Barcode
327
change size
59
chart
348
Checkbox
377
color
312
content
313
Copy Formats
56
crosstab
365
Data Graphic
375
Display condition
314
ellipse/circle
325
export as picture
314
form control
379
form templates
175, 385
formatted text
72, 377
frame
316
Gantt Chart
369
gauge
372
grouping
60
HTML text
382
Importing
61
Index Level
317
Insert
58
Interlinking
154
lines
323
move
59
multiple copies
60
names
318
OLE container
174, 385
page break before object
318
Index
PDF
174, 382
Picture
325
Position
319
Properties
310
rectangles
324
report container
337
RTF Text
72, 377
Table
339
Table of Contents Level
320
text
320
Offset
179
OLE container
174, 385
Operators
arithmetic
220
logical
221
relations
221
Output Options
190
P
P file
Page
Page break before
Page layout
Paper size
force
Paragraph properties
PDF
Contents/Index
editable forms
PDF export
PDF object
PDF/A
signature field
PDF signature field
Physical page size
Pi-Constant
Picture objects
Insert
Properties
Picture-Function
Pipeline
Pointer
Position
Position dialog
Precision
176
283
318
176
176
177
321
186
379
193
174, 382
193
381
381
177
241
325
325
325
254
113
See gauge
319
59
63
Preview
Expandable Region
99
Report Parameters
195
Sort Orders
100
Print sample
195
Printing
issues
308
other formats
193
p file
176
paper size
176
printing labels
49, 191
real data preview
50
select printer
176
slideshow mode
310
Procedure
10
Copy Formats
56
copy objects
60
Filter
65
group objects
60
move objects
59
operators
219
Redo
56
Undo
56
working with expressions
201
Produce report
12
Project
10
Building blocks
173
copy path
307
default project
13
description
307
Importing
61, 165
Index
186
mail variables
310
Options
62
Output Options
190
page layout
176
properties
307
Report Parameters
195
sending faxes, fax variables 310
Table of Contents
186
ProjectParameters
285
Properties
306
Barcode Objects
327
chart objects
348
Checkbox
377
393
Index
crosstab objects
365
Data Graphic
375
form control element objects 379
form templates
385
formatted text objects
377
Gantt Chart
369
gauge objects
372
HTML objects
382
line objects
323
Objects
310
OLE container
385
PDF objects
174, 382
picture objects
325
project
307
rectangles
324
report container object
337
table objects
339
text objects
320
Q
Quick Access Toolbar
54
R
RainbowColor
Real data preview
slideshow mode
Rectangles
insert
properties
Rectangle objects
Redo
Regions
Relational operators
RemainingTableSpace$
Report container
align sub-tables
Drilldown reports
Expandable Region
free content
Sort Orders
Report Parameters
Report Sections
RGB
Ribbon
394
287
50
310
324
324
324
56
181
221
288
76, 337
337
99, 144
99
96
100, 337
195
189
289
11, 52
Row definition
RTF export
RTF Text
118
193
72, 377
S
Sample application
12
SCM units
328
sending faxes, fax variables
310
Shapefile
115
Slide show mode
310
Sort Orders
100, 337
Special character
239
Speedo
See gauge
Status line
52
Str$
295
Sum variables
167
Sum-Function
297
Superscript, Subscript
378
T
Tab stops
207
Table objects
339
adjust size
93
align columns
91
align sub-tables
337
Anchored Lines
97
Change width individually
91
column count
340
column properties
344
column width
64
define lines
83
Drilldown reports
99, 144
Expandable Region
99
fixed height
92
format
315
frame
316
Group Line properties
343
Group Lines
87
header line
92
hide Line types
92
layout
91
Nested Tables
89
new page
93
properties
339
Index
report container
76
rotate column titles
344, 366
Sort Orders
100, 337
tickmarks
337
zebra pattern
341
Table of Contents
186
Table of Contents Level
320
Table structure
337
Tables in columns
89
Test Print
195
Text objects
320
Formatted Text
378
insert
320
Linefeed
207
paragraph properties
321
properties
320
Superscript, Subscript
378
tab stops
207
Text overflow
378
Text Tools
52, 53, 54, 81
Thermometer
See gauge
Tool windows
11
Toolbar
11
Top-N-Reporting
133, 367
Total
301
TotalPages$
301
Trend Line
120
U
Undo
User request
User variables
56
231
168
V
Variable List
Variables
LL...
201
201, 205
223
W
Widow & orphan lines
Workspace
guide
tool windows
View mode
viewing mode
347
62
11
50
11
X
XPS export
193
Z
Zebra pattern
341
395