1
Deparrtamento de Física da Unive
ersidade d
de Coimbrra SE
EM-Botany
Developm
ment of a digital system for the Acquisiition, Sttoring
and Prrocessingg Imagees from the SEM
M
Prroject Reeport
5th yeaar
Graaduation inn Biomediical Enginneering
C
Carla
Suusana Siilva Pereeira
Sepptemberr 2007
Faculd
dade de Meedicina da Univeersidade de Coimbra Faculdade de Ciências ee Tecnologiaa da Universidade de Coimbra This reeport is made fulfillingg the requireements of P
Project, a diiscipline th
of the 5 year of the Biom
medical Engineering graaduation co
ourse. Suppervisor
P
Prof.
Jorge Landeck
L
P
Physics
Deppartment FC
CTUC
Extternal Superrvisor
P
Prof.
Augusto Dinis
B
Botany
Department FCTUC
Acknowledgments
Acknowledgments
This report is the result of the work developed under orientation of Professor Jorge
Landeck, of the Physics Department of the University of Coimbra.
This work would not have been possible without the valuable aid of some people to
whom I would like to express my appreciation.
First I want to thank Professor Jorge Landeck for his orientation, support, availability
and aid, as well as to the professor Carlos Correia for his support and availability.
I want to thank the elements of the Center of Electronic and Instrumentation, as well
as the Laboratory of Electron Microscopy for the attention, availability and given support.
I want to thank my friends and colleagues for the support and incentive during these
last years.
In a special way I want to thank my family and closer friends for the constant moral
support and encouragement demonstrated during the good and bad moments I went
through during this period.
SEM-Botany
iii Resumo
Resumo
Actualmente o Microscópio Electrónico de Varrimento (MEV) existente no
Laboratório de Microscopia Electrónica do Departamento de Botânica da Faculdade de
Ciências e Tecnologia da Universidade de Coimbra é da marca JEOL modelo JSM-5400,
adquirido no início da década de 90.
Este equipamento produz uma imagem num ecrã LCD que pode ser capturada
usando um sistema fotográfico. No entanto, estas imagens (fotografias) são mais dificeis de
partilhar, armazenar e conservar do que as imagens digitais.
O principal objectivo deste projecto consiste no desenvolvimento de um sistema
digital para a aquisição, armazenamento e processamento de imagens provenientes do
MEV, que poderá ser substituir o actual sistema.
O desenvolvimento deste novo sistema involve a especificação e instalação de um
frame grabber, componente que envolve hardware, e a especificação, codificação e teste de
uma aplicação desenvolvida em Matlab, componente que envolve software.
SEM-Botany
iv Abstract
Abstract
The existing Scanning Electron Microscope (SEM) in the Laboratory of Electron
Microscopy belonging to the Botany Department of the Faculty of Sciences and
Technology from the University of Coimbra is a JEOL model JSM-5400, installed in the
beginning of the 1990s.
This equipment generates an image on a LCD that can be captured using a
photographic system that is attached to the microscope. However, these traditional images
(photographs) are more difficult to share, store and conserve than the now familiar digital
images.
The main objective of this project was the development of a digital system for the
acquisition, storing and processing the images from the SEM, one that may replace the
actual onerous system.
The development of the new system involved the specification and installation of a
frame grabber (hardware component) and the specification, coding and testing of a Matlab
application (software component).
SEM-Botany
v Acronyms
Acronyms
Acronyms
ADC
Description
Analog Digital Converter
EM
Electron Microscope
GUI
Graphical User Interface
GUIDE
Graphical User Interface Development Environment
MEV
Microscópio Electrónico de Varrimento
NTSC
National Television Standards Committee
PAL
Phase Alteration Line
RUP
Rational Unified Process
SECAM
SEM
Systeme Electronic Pour Colour Avec Memoire
Scanning Electron Microscope
STEM
Scanning Transmission Electron Microscope
TEM
Transmission Electron Microscope
UML
Unified Modelling Language
WWW
SEM-Botany
World Wide Web
vi Index
Index
CHAPTER 1
Introduction
1
1.1 Laboratory of Electron Microscopy
1
1.2 Objectives
3
CHAPTER 2
Background
4
2.1 Introduction
4
2.2 Scanning Electron Microscope
5
2.2.1 A Brief History
7
2.2.2 Basic Systems
8
2.2.3 Functioning
10
2.2.4 Image Formation
11
2.2.4.1 Detection of Secondary Electrons
12
2.2.4.2 Detection of Backscattered Electrons
12
2.2.4.3 Detection of X-Rays
13
2.2.4.4 SEM’s Output
13
2.3 Composite Video Signal
14
2.4 Digital Image
16
2.4.1 Digital Image Types
16
2.4.2 Digital Image Processing
17
2.4.2.1 Components of an Image Processing System
2.5 References
SEM-Botany
17
18
vii Index
CHAPTER 3
Analysis and Specifications
20
3.1 Introduction
20
3.2 SEM Analysis
20
3.2.1 Signal Analysis
21
3.2.2 Associated Calculi
22
3.3 Hardware Solution
3.3.1 DT3155
3.3.1.1 Characteristics
3.3.2 Computational Treatment
3.3.2.1 Language
3.4 References
22
22
23
25
25
26
CHAPTER 4
Methodologies
27
4.1 Introduction
27
4.2 Software Development Process
27
4.2.1 Software Life Cycle
28
4.2.2 Processes Models
30
4.3 Model Used
4.3.1 Initial Procedure
31
32
4.3.1.1 Insight and Objectives
33
4.3.1.2 Requirements Analysis
35
4.3.1.3 Architecture
37
4.3.1.4 Interface Prototype
41
4.3.1.5 Scheduling
42
SEM-Botany
viii Index
4.4 References
43
CHAPTER 5
Implemented Solution
45
5.1 Introduction
45
5.2 Hardware Component
45
5.3Software Component
46
5.3.1 Graphical User Interface
46
5.3.1.1 File
49
5.3.1.2 Tools
52
5.3.1.3 Back to the Original
58
5.3.1.4 Help
58
5.4 Testing
59
5.5 References
59
CHAPTER 6
Conclusions
61
6.1 Developed Work
61
6.2 Future Developments
62
APPENDIX
Appendix 1
63
Appendix 2
67
SEM-Botany
ix Chapter 1
1.
Introduction
This report documents the work realized for the final project course of the
Biomedical Engineering Degree, a project entitled “SEM-Botany”.
The main objective of this project was the development of a digital system for the
acquisition, storing and processing the images from the SEM, one that may replace the
actual onerous system.
This first chapter main purpose is to present the primary motivations that lead to this
project and a description of the objectives and the main requirements.
1.1 Laboratory of Electron Microscopy
The Laboratory of Electron Microscopy is an investigation laboratory integrated in
the Botany Department1 of the Faculty of Sciences and Technology of the University of
Coimbra. It offers its services to the academic community, to the students in the form of
laboratory classes and to other research teams in the form of specific analysis.
The most important equipments in the laboratory are the following:
9
Transmission electron microscope;
9
Scanning electron microscope;
9
Ultramicrotome;
9
Critic point device;
9
Metalizer;
9
Optic microscope with photographic camera;
9
Binocular magnifying glass with photographic camera;
9
Spectrophotometer.
1
Institued in 1991. SEM-Botany
1 1. Introduction
The Scanning Electron Microscope is a very important and indispensable tool in
some basic and applied functions, and the Laboratory of Electron Microscopy owns a
Scanning Electron Microscope, a JEOL model JSM-54OO, installed in the beginning of
the 1990s.
In a concise and simple way, the SEM operation consists on the scanning of the
sample using an electron beam, and the analysis of the reflected electrons. As a
consequence of that, we will obtain an image that corresponds to the surface of the sample.
Curiously, the image is a two-dimensional object while the surface of the sample is a threedimensional object. This created image can be visualized on SEM’s monitor.
In the existing microscope the registration of images from the samples is made using
a separated system which is connected to the SEM. This system can be compared to a
normal photographic system that makes possible the image registration on photographic
film.
With the development of the new technologies, this form of acquisition present in the
SEM is surpassed, and nowadays it does not respond to the existing requirements. Its
limitations emerge from the fact that not only the photographic film requires special care,
because it is very susceptive to damage, but also that this current system does not allow,
not in an easy and fast way, the image acquisition in digital format.
This reality places obstacles to the work developed in the laboratory, because it
creates a need of extra time in order to develop the film, as well as not allowing image
acquisition in digital format, which makes impossible image processing techniques in order
to improve the quality of the acquired images.
Therefore this new system is a development of the old one, and presents itself as an
eminent necessity.
SEM-Botany
2 1. Introduction
1.2 Objectives
The main objective of this project was the development of a digital system for the
acquisition, storing and processing the images from the SEM, in order to improve the user
conditions and avoid the high costs of a commercial adaptation.
In order for the project to be successful, the system must be easy to operate (userfriendly interface) and meet a set of requirements, namely:
9
Acquire the images from the SEM;
9
Offer some image processing techniques, thus increasing the quality of the
obtained or stored images:
•
Contrast and brightness adjustment;
•
Edges detection;
•
Re-sampling;
•
Filter;
9
Store and organize the digital images;
9
Allow the simultaneously visualization of the acquired (or stored) raw
image and the processed image.
The availability of digital images will enable the microscope technician to take
advantage, for example, of the following benefits:
9
It creates a more reliable storing method, increasing the preservation period
and conditions;
9
It facilitates de exchange of images;
9
It permits image visualization in rooms with poor or abusive lighting
conditions.
SEM-Botany
3 Chapter 2
2.
Background
To better understand the different aspects involved in this project, a technical
background will be presented in this section. Its main purpose is to cover all the subject
areas touched by the project.
First a brief description of the main problem will be made, following a brief
description of the Scanning Electron Microscopy (SEM) including references to its history,
basic components, main functions, image creation and the output signal.
Since this project involves acquisition of images, it was necessary to study the basic
principles of video signals, described in section 2.4, and of digital images in section 2.5.
2.1 Introduction
One of the laboratories of the Botany Department of the Faculty of Sciences and
Technology, from the University of Coimbra, more precisely the Laboratory of Electron
Microscopy, owns a Scanning Electron Microscope, a JEOL model JSM-5400, installed in
the beginning of the 1990s.
Image acquisition is accomplished with the help of a photographic system, which is
attached to the SEM, after the scanning of the specimen by an electron beam.
Nowadays, with the development of the new technologies, this existing system
presents some restrictions, more specifically related to the image acquisition and
processing in digital format, because the registration made on photographic film has to be
developed and scanned to obtain the monochromatic digital images.
This project’s main purpose is to provide a simpler and faster operation setup, by
way of developing an alternative image acquisition system (data acquisition), which
enables acquisition from the SEM, allowing image capture in a digital format. In addition,
it will offer some image processing techniques, whose function is to improve the acquired
images, thus increasing its quality and diminishing the necessity of applying these same
techniques afterward.
SEM-Botany
4 2. Background
Acquired images are representations of genuine samples, so obtained digital images
must be the as closer as possible to reality, restricting the processing techniques applied to
the contrast / brightness adjustment and to the edges detection.
2.2 Scanning Electron Microscope (SEM)
The SEM is a type of electron microscope capable of producing high-resolution
images of a sample surface [4] (biologic or not), which means that closely spaced features
can be examined at a high magnification. It has a large depth of field which allows a large
amount of the sample to be focused at one time. Due to the manner in which the image is
created, the images from the SEM have a characteristic three-dimensional appearance and
are very useful for judging the surface structure of the sample. [5]
Electron microscopy is, by definition, a specialized field of science that makes use of
the electron microscope tool. [13]
Electron microscope (EM) is a scientific instrument that uses a highly energetic
electron beam to examine objects, called specimen, on a very fine scale. These electrons
are accelerated to 10000 keV and have a wavelength equal to 0,12 Angstroms1 [6]. These
analyses can yield topography, morphology, composition and crystallographic information
[2]. Because of these characteristics it can be applied in several areas such as biology,
geology, chemistry, sciences of materials, paintings reconstruction and others. [1]
The EM has influenced our understanding of tissue organization and especially the
cell. It has offered us the capability to visualize molecules and even atoms. [13]
Electron microscopes were developed in the early 1930s, due to a scientific desire to
perceive the fine details of the interior structures of organic cells. This desire required
superior magnification which was not possible using light microscopes which are limited
by the physics of light; they have insufficient magnifications and resolution2. [2]
There are two different types of instruments also called electron microscopes. Both
were created at about the same time but they have essentially different uses: [13]
1 1 Angstrom = 10−10 m 2 Resolution refers to the ability of the instrument ‘separates’ two closely placed objects as two entities rather than a single object. SEM-Botany
5 2. Backgr
round
•
T
The
Transm
mission Ellectron Microscope
M
(TEM) – projects electrons
e
thhrough a veery thin slicce of specim
men to prodduce a two--dimensionaal image
inn a phosphoorescent scrreen. The brrightness off a particulaar area of th
he image
iss proportionnal to the number
n
of electrons
e
thhat are transsmitted thro
ough the
sppecimen.
F
Figure
1: Imaage proceeding
g from a TEM
M [5].
•
T Scannin
The
ng Electron
n Microsco
ope (SEM) – produces an image th
hat gives
thhe impression of three dimension
ns. This miccroscope usees a 2 to 3 nm spot
o electrons that scans the surfacee of the specimen to generate seecondary
of
electrons thaat are detectted by a sen
nsor.
F
Figure
2: Imaage proceeding from a SEM
M [5].
t
of EM to be develloped, in 19
931, was thee TEM, thenn in 1942, appeared
a
The first type
the SEM
S
[2]. They weree built by the engineeers Ernst Ruska 3 , w
who had deeveloped
electtromagneticc lenses, annd Max Knooll4. It wass based on the discoveeries of thee French
physicist Louis de Broglie5. Although these instru
uments werre primitivee, they weree capable
o
severral times [3].
of magnifying objects
3 Ern
nst Ruska (190
06‐1988) ‐ Thee Nobel Prize iin Physics 198
86; 4 Maxx Knoll (1897 ‐‐ 1969); 5 Luiss de Broglie (1892 – 1987) –– The Nobel Prize in Physicss 1929; SEM
M-Botany
y
6 2. Background
Electronic technologies have developed new electron microscopes with higher
versatility, higher magnifying parameters and resolution [1]; however they are still based
upon Ruska’s prototype [3].
Electron microscopes function involves some basic steps [2]:
•
First a stream of electrons is formed, using an electron source;
•
These electrons are then accelerated toward the specimen using a positive
electrical potential;
•
Before striking the specimen, this stream is restrained and focused, using
metal apertures and magnetic lenses into a thin, focused, monochromatic
beam;
•
After striking the specimen, and inside the irradiate sample, interactions
occur affecting the electron beam.
Electron microscopes are an integral part of many laboratories; however they present
some disadvantages, such as [3]:
•
They are expensive to buy and maintain;
•
They require extremely stable high-voltage supplies;
•
They require extremely stable currents to each electromagnetic coil/lens;
•
They require continuously-pumped high-vacuum systems, through the
lenses and pumps;
•
2.2.1
They are very sensitive to vibrations and external magnetic fields.
A Brief History
The developments on electron microscopy started in 1931 with Ernst Ruska and Max
Knoll [5].
SEM-Botany
7 2. Background
In 1938, Manfred Von Ardenne6 described a scanning electron beam; it was the first
scanning transmission electron microscope (STEM), using the electrons passing through a
thin sample for imaging [9].
In 1942, Zworykin et al.7 developed and described the first true SEM. The instrument
consisted of an inverted column, three electrostatic lenses and electromagnetic scan coils
placed between the second and third lenses. A photomultiplier tube detected the
scintillations on a phosphor screen caused by the secondary electrons emissions.
Further work made large changes to the electron optics. The electrostatic lenses were
replaced with electromagnetic coils; a double deflection scanning system was added as
were stigmator8 coils. To help improve imaging, non-linear signal processing was used,
also called gamma processing.
The main improvements were made to the signal collection process. The original
phosphor screen / photomultiplier were improved by the addition of a light pipe that
allowed for direct optical coupling between the scintillator and the photomultiplier tube,
improving efficiency.
These improvements were combined in one instrument, forming a new SEM, known
as SEM V, with an inverted column, electromagnetic lenses, double deflection scan
system, stigmatior coils and the Everhart-Thornley detector9 [9], which became the basis
for the first commercial SEM, the Cambridge Scientific Instruments Mark I, available in
1965 [13].
2.2.2
Basic Systems
The SEM may be subdivided into various component systems that carry out various
functions.
6 Manfred von Ardenne (1907‐1997) 7 V. K. Zworykin, J. Hiller and R. L. Snyder, ASTM Bull 8 The stigmator is a device that is used to control any distortions in the roundness of the spot formed by the electron beam that scans the specimen. 9 Everhart‐Thornley detector – carries the inventor’s names. It consists in a SEM’s improvement consisting on an addition of a light pipe to the photomultiplier.
SEM-Botany
8 2. Backgr
round
Image 3: Detail diaggram of colum
mn of standardd SEM. [13]
Certain coomponents present
p
on SEM
S
are ideentical to thhose found in the TEM..
We can foound a lens system whhich is invollved in the production
p
of a small, focused
electtron beam thhat are thenn rastered ovver a specim
men surfacee by means of a scan deeflection
systeem. A specimen stage is needed so that thee specimen may be innserted and situated
relatiive to the beam. A secondary
s
e
electron
deetector is used
u
to deteect and colllect the
electtrons and too generate a signal that is processeed by electrronics and uultimately displayed
d
on viiewing monnitors [13].
In order too permit an easy and non-turbulen
nt traveling, a vacuum system is needed to
remoove air mollecules that might inteerfere with the passagee of the higgh energy electrons
e
downn the colum
mn and in dirrection to thhe detector [13].
[
After the electron beeam leaves the bias shield,
s
it is restrained and focuseed using
metaal apertures and magneetic lenses to form an initial focuused spot w
which is dim
minished
usingg condenserr lenses [2]. The final condenser lens, calledd objective lens, does the final
demaagnificationn of the focuused electroon beam [13
3].
SEM
M-Botany
y
9 2. Background
2.2.3
Functioning
The functioning of the SEM can be resumed to:
•
A beam of electrons is produced [7], by a lens system [13] – electrons are
thermionically emitted from a tungsten10 or lanthanum hexaboride cathode
and are accelerated towards the anode. Usually, is used Tungsten because it
has the highest melting point and lower vapor pressure of all metals [4]; the
stream is condensed by the first condenser lens. This lens is used to form the
beam and to limit the amount of current [8]; the electron beam can achieve a
maximum energy of 100 keV;
•
In the condenser aperture11 some high-angle electrons are eliminated and the
beam is then constricted [8];
•
The second condenser lens forms the electrons into a thin, tight, coherent
beam and is usually controlled by the “fine probe current knob” [8];
•
In the objective aperture 12 high-angle electrons are eliminated from the
beam [8], transforming it to a very fine focal spot sized 1 to 5nm [4];
•
After that, the beam is scanned in a grid fashion, by a set of coils, dwelling
on points for a period of time determined by the scan speed [8], deflecting
the beam horizontally and vertically [4];
•
The final lens, placed between scanning coils and the electron detector,
focused the scanning beam onto the desired part of the specimen [8];
•
When the beam strikes the specimen, interactions inside the specimen occur
[8] and electrons, which had lost energy by repeated scattering and
absorption [4], are detected with various instruments [8]. The size of
interaction volume depends on the beam accelerating voltage and the
specimen’s atomic number and density.
10
Tungsten melting temperature = 3695 K Condenser aperture usually not user selectable; 12
Objective aperture usually user selectable; 11
SEM-Botany
10 2. Backgr
round
•
B
Before
the beam
b
moves to its nex
xt dwell poiint these insstruments count
c
the
n
number
of innteractions and display
y a pixel onn a monitorr whose intensity is
d
determined
b this num
by
mber (more reactions
r
reppresents a bbrighter pixeel) [8];
•
T processs is repeatedd until the grid scan is finished
This
f
andd then repeaated [8].
Image 4: SEM’s
S
schem
matic works [7]].
2.2.4
Im
mage Form
mation
At any givven momennt, a very sm
mall specim
men’s area iss bombardeed with elecctrons. A
very fine electroon beam geenerated in vacuum fo
ocuses and scans, in a series of liines and
mes, the speccimen’s surfface [12].
fram
Figure 5: Schematicaally reading.
Some resuulting signalls from the beam-speciimen interacction are coollected [10]].
The energgy exchange in the beeam-specim
men interactiion results in the emiission of
electtrons and electromagneetic radiatioon [4] which
h are converrted to a siggnal that is sent to a
view
wing screen [7], produciing an imagge.
SEM
M-Botany
y
11
1 2. Background
As a result of this beam-specimen interaction several effects can happen [11] [12]:
•
Electrons can be elastically reflected from the specimen, conserving the
energy;
•
Electrons can be absorbed by the specimen and give rise to secondary
electrons of very low energy, together with x-rays;
•
Electrons can be absorbed and give rise to the emission of visible light. This
effect is also known as Cathodoluminescence;
•
Electrons can give rise to electric current within the specimen;
All these effects, electrons and electromagnetic radiation, can be used to produce an
image.
2.2.4.1
Detection of Secondary Electrons
Secondary electrons are low energy electrons emitted from the sample as a result of
the beam-sample interaction. They are responsible for the surface-sensitive signal, once
they are emitted throughout the interaction volume, but due to their low energy they do not
travel far in the sample, only a few nanometers [4], before being re-captured. The highest
concentration of secondary electron is where the beam first enters the sample [11]. The
electrons are detected by a scintillator-photomultiplier device and the resulting signal is
rendered into a two-dimensional intensity distribution. The brightness of the signal is
related to the number of secondary electrons that reaches the detector. The threedimensional appearance and a well defined image happens because the “escape” distance
of electrons, which is related to the incident angle of the beam, that means that bigger
incident angle represents a less “escape” distance [4].
2.2.4.2
Detection of Backscattered Electrons
Backscattered electrons are the first electrons that suffer one or more elastic
collisions within the sample and eventually have bounced around enough to re-emerge
from the surface they came in, normally these electrons will also undergo several inelastic
SEM-Botany
12 2. Background
collisions during their time inside the solid as well, and so will typically have an energy
that is lower than the beam energy upon their escape [11].
Backscattered electrons may be used to detect contrast between areas with different
chemical compositions, especially when the average atomic number of the various regions
is different, since the brightness of the backscattered electrons image tends to increase with
the atomic number [4][11].
2.2.4.3
Detection of X-Rays
During the scanning, two types of x-rays can be produced from the sample; the
continuum also called Bremsstrahlung is formed from direct energy loss of the electron
beam as they are slowed in the sample, and form a continuous energy spectrum from 0eV
up to E0. The intensity of the Bremsstrahlung spectrum is directly proportional to the
atomic number of the sample. Characteristic x-rays are produced when a beam produces a
“hole”, that is when an electron knocks out an inner shell electron. This hole is filled with
another electron that lets free some energy, that free energy is an x-ray [11].
Detectors have as main purpose to convert the receipted signal into an electric
current [12]. These electric currents modulate the electrons beam’s intensity in order to
form, point by point, the image in the cathode ray tube [10].
The most important signals are those given for the secondary and backscattered
electrons, a time that supply the surface’s topography. The characteristic x-rays allow the
chemical characterization of the sample’s compounds [13].
2.2.4.4
SEM’s Output
The specimen’s reading, an electrical signal created by the detector, is received in a
monitor where images can be seen. However, SEM yields that same information to the
outside, in a composite video signal.
This type of signal was developed having in account the compatibility between
systems.
SEM-Botany
13 2. Background
2.3 Composite Video Signal
Formally, the video format is a signal type that describes the sequence and structure
of frames13 that create the moving video image. That describes how one device sends a
video picture to another [15].
There are two types of video format:
•
Analog – oldest; the most common formats in market are: [23]
PAL 14 /CCIR – video signal standard for 50Hz, where images have
625 lines, only 576 lines are visible;
NTSC 15 /EIA – color video signal standard for 60Hz, where the
monochromatic image is overlapped by color information, it had 525
lines, only 480 are visible;
•
SECAM16 - similar to PAL.
Digital – most recent; in fact, the most common formats in market are
ATSC, DVB and ISDB.
A video format describes a rectangular image carried within an envelope containing
information about the image [15].
Although video formats vary significantly in organization, there is a common
classification [15]:
•
Video format uses a sequence of frames that are organized in a particular
order. However, frames may vary small elements to represent further
information;
•
A frame is a series of lines that have a regular and constant length in order
to produce a rectangular image;
•
A frame can consist of two or more fields, sent separately, that assemble
together to form a rectangular picture. This type of assembly is identified as
interlace.
13
Frame is a photographic representation of a film; PAL (Phase Alteration Line) – European standard; 15
NTSC (National Television Standards Committee) ‐ Standard for North and Central America and Japan; 16
SECAM (Systeme Electronic Pour Colour Avec Memoire) – Standard for France, Russia, parts of Africa and Eastern Europe. 14
SEM-Botany
14 2. Background
Actually, there are three video signal standards, they are: [14]
•
Composite video ‐ is the standard that can connect almost all consumer
video equipment. It is a composite of three source signals called Y, U and V
(together referred to as YUV 17 ) with sync 18 pulses. Y represents the
brightness or luminance of the picture and includes synchronizing pulses, so
that by itself it could be displayed as a monochrome picture. U and V
between them transmit the colour information. They are first mixed with
two orthogonal phases of a colour carrier signal to form a signal called the
chrominance. Y and UV are then added together. Since Y is a baseband
signal and UV has been mixed with a “transporter”, this addition is
equivalent to frequency-division multiplexing;
•
S-Video ‐ also called Y/C uses two separate video signals, the luminance
(Y) and chrominance, or chroma (C). The luminance is the black and white
portion, providing brightness information and the chrominance is the colour
fraction, providing hue and saturation information. In real meaning, an Svideo signal is a composite signal that has been divided into two,
transmitting colour and brightness on two separate channels, making a
sharper picture image, with fewer granularities, on the receptor device;
•
Component video ‐ is a newer format of video signal, an improvement of
the S-Video. It has separated luma (brightness) and chroma (colour) which
is also separated into two signals, red and blue. The result is a triple-headed
RCA cable and an image cleaner than composite with fewer colours
bleeding than S-Video. Although common on newer equipments,
component video is very rare on older TV sets and VCR's.
17
YUV – color codification system, different from RGB; Synchronism ‐ the term used in electronics to describe the necessary alignment of two signals or functions. In video signals, the synchronism signals are essential elements for keeping the time that the receiving device is capable to interpret it and to remove information of when and where to draw the image. The horizontal synchronism is an impulse of small amplitude generated in the beginning of each line, indicating when a new line must be drawn. The vertical synchronism is also an impulse of small amplitude generated in the beginning of each picture, indicating when a new picture must be drawn, that is a new image. 18
SEM-Botany
15 2. Background
2.4 Digital Images
A digital image is a representation of a two-dimensional function of the intensity of
light f(x,y) where x and y represent the special coordinates in any point. It is a grid of n roes
and m column of pixels19, the indices of lines and columns indicate a point in the image
and the value of this element represents the gray level [23].
Typically, pixels are stored in computer memory as a raster image [24] or raster map
[16], which consists of a data structure representing a rectangular grid of pixels, or points
of color, viewable via a display medium.
Digital images can be created by a variety of input devices, normally a physical
device [24], and techniques that synthesized from arbitrary non-image data, such as
mathematical functions or three-dimensional geometric models. The field of digital image
processing is the study of algorithms for their transformation [16].
2.4.1
Digital Images Types
Each image pixel is associated to a particular 'position' in a two-dimensional region,
and has a value consistent with the signals related to that position.
Digital images can be classified according to the number and nature of those signals:
•
Binary or Bi-level - is a digital image that has only two possible values for
each pixel [18];
•
Grayscale - is an image in which the value of each pixel is one sample [19];
•
Color - is an image that includes color information for each pixel [20];
•
False-color - is an image that illustrates a subject in colors that differ from
human perception of the same subject [21];
•
Picture function - is a mathematical representation of a two-dimensional
image as a function of two spatial variables. The function f(x,y) describes
the intensity of the point at coordinates (x,y) [22].
19
Pixels are the smallest individual element in an image, holding quantized values that represent the brightness of a given colour at any specific point. SEM-Botany
16 2. Background
2.4.2
Digital Image Processing
Human perception in relation to the environmental information results in its bigger
part from the vision. After the achievement of a digital image, it is possible to enhance the
overall quality of that same image and to select features of interest for image analysis.
Images that are electronically manipulated in this way are said to undergo image
processing [13].
2.4.2.1
Components of an Image Processing System
In these last years, several models of image processing systems have been sold
throughout the world [17]. Basically, digital image processing involves computers
algorithms to perform image processing on digital images [25].
The concept of digital image processing started with the satellite imagery, in the
1960s, medical imaging and others; however it presented a high cost because the
computing equipment of that era [25]. But along the years, those equipments had suffered
some modifications to became cheaper and available to all persons [17].
With the development and cheapest versatile methods the digital image processing
had become the most common form of image processing [25].
These methods allow better graphic manipulation, for example [24]:
•
Selection is a procedure of select part or parts of an image, and manipulate
only that specific image area;
•
Image size alteration is a procedure also called image scaling, where
image editor programs use a mathematical process, called resampling, to
calculate new pixel values;
•
Cropping an image is a procedure similar to the selection, but in this case it
is created a new image by removing a desired rectangular portion from the
original image;
SEM-Botany
17 2. Background
•
Histogram is a graphical representation of the number of pixels in the
image with a particular brightness value, that is number of pixels vs.
brightness value;
•
Noise removal is a procedure using algorithms to add or remove noise in an
image;
•
Removal of unwanted elements is a procedure used to remove unwanted
branches;
•
Selective color change is a procedure that has the abilities of color
swapping, to change the color of specific items in an image;
•
Slicing of images is a procedure used to fragment images for graphical user
interfaces or web pages are easily sliced, labeled and saved separately from
whole images so the parts can be handled individually;
•
Lens correction is a procedure used to correct images for various lens
distortions;
•
Contrast and brightness adjustment;
•
Printing is a procedure used to control the print size and quality of digital
images.
2.5 References
[1] http://www.fc.ul.pt/centros/microscopia/
[2] http://www.unl.edu/CMRAcfem/em.htm
[3] ‘Electron Microscope’; 3 June 2007 from http://en.wikipedia.org/wiki/Electron_microscope
[4] ‘Scanning Electron Microscope’; 3 June 2007 from
http://en.wikipedia.org/wiki/Scanning_electron_microscope
[5] REIS, C., (2003), ‘Microscopia’; 3 June 2007 from
http://docentes.esa.ipcb.pt/lab.biologia/disciplinas/biologia/microscopia.pdf
[6] 3 June 2007 from http://mse.iastate.edu/microscopy/whatsem.html
[7] ‘How the SEM’s works’; 3 June 2007 from http://mse.iastate.edu/microscopy/path2.html
[8] ‘Scanning Electron Microscope’; 3 June 2007 from http://www.unl.edu/CMRAcfem/semoptic.htm
SEM-Botany
18 2. Background
[9] SAMPSON, A. R.; Scanning Electron Microscope; 3 June 2007 from
http://www.sem.com/analytic/sem.htm
[10] SEM Image Formation (2003), 5 June 2007 from
http://www.chems.msu.edu/curr.stud/mse.sops/sem.image.htm
[11] SEM Signal Types, Contrast Mechanisms and Imaging Schemes (2003), 5 June 2007 from
http://www.chems.msu.edu/curr.stud/mse.sops/contrast.htm
[12] SEM (1999), 4 June 2007 from http://acept.asu.edu/PiN/rdg/elmicr/elmicr.shtml
[13] BOZOLLA, John J.; RUSSEL, Lonnie D.; Electron Microscopy (2nd edition); Jones and Bartlett
Publishers, Inc (1999)
[14] Video and Broadcasting, 7 June 2007 from http://www.datapro.net/videodoc.html
[15] Video Format (2007), 7 June 2007 from http://en.wikipedia.org/wiki/Video_formats
[16] Digital Image (2007), 12 June 2007 from http://en.wikipedia.org/wiki/Digital_image
[17] GONZALEZ, Rafael C.; WOODS, Richard E.; Digital Image Processing (2nd edition); International
Edition (2002)
[18] Binary Image, 15 June 2007 from http://en.wikipedia.org/wiki/Binary_image
[19] Grayscale Image, 15 June 2007 from http://en.wikipedia.org/wiki/Grayscale
[20] Color Image, 15 June 2007 from http://en.wikipedia.org/wiki/Color_image
[21] False Color, 15 June 2007 from http://en.wikipedia.org/wiki/False-color_image
[22] Picture Function, 15 June 2007 from http://en.wikipedia.org/wiki/Picture_function
[23] PEREIRA, Mário J.T.; Reconhecimento do Padrão Óptico da Estrutura da Folha de Papel (2002)
[24] Image Editing, 15 June 2007 from http://en.wikipedia.org/wiki/Digital_image_editing
[25] Digital Image Processing, 15 June 2007 from http://en.wikipedia.org/wiki/Digital_image_processing
SEM-Botany
19 Chapter 3
3.
Analysis and Specifications
In this section, named Analysis and Specifications, the analysis itself will be
presented, describing the original problem, as well as all the related studies and the
possible solutions.
Firstly, the main problem will be described, and following that same line of thought,
the analysis made on the microscope signal will be discussed.
As the project consists on the development of an alternative data acquisition system,
the described solution has hardware and software components.
3.1 Introduction
As it was said previously, the SEM used in the Laboratory of Electron Microscopy
only allows the images to be registered using a photographic system, combined with the
SEM. This system can be compared to a normal photographic system where the results are
photographs, not immediately available in digital format.
This type of acquisition existing on the SEM is by far outdated, and nowadays a
digital format acquisition is a basic request, in order to improve the quality and speed of
the work developed on the laboratory and diminishing the waste of time with the actual
system.
So the main intention of this project is the development of a digital system for the
acquisition, storing and processing the images from the SEM, one that may replace the
actual onerous system improving the user’s work conditions.
3.2 SEM Analysis
In a study made to assimilate some information about the characteristics of the SEM,
an output signal jack on the microscope was exposed. This was a starting point to our
research because the acquisition system needs to be compatible with this output.
A small measure was carried out on the SEM’s output using an oscilloscope, whose
results are displayed in figures 6 and 7.
SEM-Botany
20 3. Analysi
A
s and Sp
pecifica
ations
Image 6: SEM’s eleectrical signal,, obtained usinng an oscillosccope.
Image 7: SEM’s
S
electriccal signal, obttained using an
a oscilloscopee.
3.2.1
S
Signal
Anallysis
From the output siggnal analysiis it was possible to confirm thaat the videeo signal
supplied by the SEM was a compositee video sign
nal, as can be seen froom the syncchronism
pulsees, which mark
m
the begginnings of the
t lines and
d frames.
With an analysis off the output signal, it was
w possiblee to identifyy the characcteristics
of thhat same viddeo signal. In
I image 6, it was posssible to visuualize the vertical syncchronism
whicch designatees the beginnning of onne frame; in
n image 7, it was posssible to iden
ntify the
horizzontal synchhronism whhich designaates the begiinning of onne line.
Betweenn two horizoontal synchhronisms it was possibble to identtify the info
ormation
concerning one line, which means the value of eacch pixel of one determined line.
SEM
M-Botany
y
21
1 3. Analysis and Specifications
3.2.2
Associated Calculi
A very important issue in data acquisition systems is related to data transfer rate,
which must be supported by the acquisition system.
The transfer rate is dependent on the images size, so the size of the images that will
be transferred must be estimated.
The image size can be calculated, knowing that it is the product between the
number of lines, number of points and the number of bits.
So we have:
Image size = number of lines x number of points x number of bits
1
1
=
= 262
frequencyx line time 60 Hz x 63,5 μs
¾
number of lines =
¾
number of points: 640points
¾
number of bits: 8 bits
lines per frame
(NOTE: As the resulting image is monochromatic, an 8bit ADC will be sufficient and will provide 256 distinct gray levels.)
Being thus, the image size can be estimated in 1 341 440bytes (262 x 630 x 8).
3.3 Hardware Solution
As it was referred before, the main goal of this project is the development of an
alternative system of acquiring, processing and storing data, in this particular case, images.
After an initial study, it was concluded that the obtained image is static, so each
image can be obtained using a small part of the output signal, which is the corresponding
frame.
Following this idea, and in a first inclination, we could think that the alternative
solution would be the creation of a circuit, implementing several components like a
synchronism separator, an ADC 1 , and other components whose functions would be to
obtain the relevant information to reconstruct an image, adding some computational
treatment.
1
ADC – Analogue ‐ Digital converter SEM-Botany
22 3. Analysis and Specifications
However, after some reflection and some research, it was possible to come across
another solution.
A market study was made in order to inquire some device capable of recognizing a
composite video signal, obtaining the necessary information to reconstruct an image.
The potential solution was found in a company named DATATRANSLATION that is
responsible for the development of PCI bus cards known as frame grabbers, which are able
to interpret video signals.
After congregating the requirements of our new alternative acquiring system, and
analyzing the characteristics of the produced frame grabbers, we chose the better one, the
one that better adjusted to the system requirements.
A viable choice was the DT3155 frame grabber. This card filled the essential
requirements having in account the real conditions and having the advantage of bringing its
own respective software.
3.3.1
DT3155
3.3.1.1
Characteristics
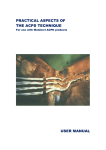
The acquisition card is a DATATRANSLATION model, a DT3155 (MACHI series). It
is a programmable monochromatic card with high accuracy.
Image 8: Monochrome frame grabber for the PCI bus, DT3155 [2].
The PCI bus velocity permits that this DT3155 card transfers, with a high speed (>
132MB/s), an unlimited number of consecutive images in real time. We can acquire and
store consecutive images until depletion the internal memory, or we can display
consecutive images in a monitor and in real time.
SEM-Botany
23 3. Analysi
A
s and Sp
pecifica
ations
The DT31155 card has 4 video siignals inputt, in severall monochrom
matic formaats, such
as:
•
R
RS-170
– monochroma
m
atic video signal stanndard for 60Hz wheree images
h
have
525 linnes, only 4800 lines are visible;
v
•
C
CCIR
– videeo signal staandard for 50Hz, wherre images hhave 625 lin
nes, only
576 lines aree visible;
•
N
NTSC/RS-3
here the
30 – coloour video signal stanndard for 60Hz, wh
m
monochroma
atic image is
i overlappeed by colouur informatioon, it had 52
25 lines,
o
only
480 aree visible;
•
P
PAL
– coloour video siignal stand
dard, where the monocchromatic image
i
is
o
overlapped
b colour innformation, and it has 625
by
6 lines, annd 576 are visible.
v
The DT31155 card diggitalises thee image and
d stores the resulting ddata in the computer
c
systeem memoryy or transferrs that samee data to thee computer sampling coontroller in order to
preseent real timee images.
The card works in an
a interlacedd mode, maaking an im
mage acquisition as so
oon as it
deteccts the synnchronism signal andd stops lateer when thhe image is completted. The
synchhronism coomes from the input channel
c
and
d it is usedd to create the horizontal and
vertical input tim
me.
In this carrd the blackk level is deffined as thee tension below of whicch all the otthers are
h all the
digitalised in bllack and thhe white levvel is defined as the teension abovve of which
otherrs are digitaalised in white. The pixxel value is placed
p
betw
ween 0 and 2255.
The DT3155 card uses
u
an intternal mem
mory to stoore images and the sampling
s
contrroller to dispplay imagess.
Image 9: Onboard
O
BNC
C connector. [22]
This frame grabber, DT3155,
D
will be conneected to thee SEM usingg the onboaard BNC
connnector.
SEM
M-Botany
y
24
4 3. Analysis and Specifications
3.3.2
Computational Treatment
This alternative system could be divided in two parts:
•
One involving hardware that is responsible for the acquisition;
•
Another, involving software that is responsible for the data processing.
For the analysis and image processing, it was necessary to develop and implement a
computer program that would meet the intended requirements and in this case, it had to be
compatible with the hardware the DT3155 frame grabber from DATATRANSLATION.
An application was developed and named of SEM-Botany.
3.3.2.1
Language
The chosen language for the application program development was MatLab, short
for “Matrix Laboratory”.
MATLAB is a numerical computing environment and programming language. It
was developed by TheMathWorks, and it is a system for scientific calculi which provides
an easy user environment with intuitive but very powerful notation. It allows the
accomplishment of numerical algorithms on matrixes with the minimum of programming.
Moreover, in MATLAB environment it is possible to create and manipulate matrixes
without the necessity of previous sizing. The manipulation of variables can be carried
through in an interactive way [1].
MATLAB was first adopted by control design engineers. Without possessing a
special focus, it quickly spread into other domains. It is now also used in education, in
particular in the teaching of linear algebra and numerical analysis, and is popular amongst
scientists involved with image processing [1], because it has a big library of toolboxes,
which are predefined functions that can be used.
MATLAB was chosen among others things for its diverse library that facilitates its
applications.
For this particular case it was used the Image Acquisition Toolbox and Image
Processing Toolbox.
The Image Acquisition Toolbox provides functions to connect and configure the
hardware [4] for acquiring images or/and video directly from it into MATLAB [3]. It can
continuously acquire image data while processes the acquired data and it supports any
color space provided by the device, such as RGB, YUV and in this particular case
SEM-Botany
25 3. Analysis and Specifications
grayscale. The image data is a multidimensional array compatible with standard MATLAB
functions. [4]
The Image Processing Toolbox provides several standard algorithms and graphical
tools for image processing, analysis, visualization and algorithms development.
3.4 References
[1] MATLAB, 25 October 2006 from http://en.wikipedia.org/wiki/MATLAB
[2] DT3155 Datasheet, from http://www.datx.com/images/pdfs/dt3155.pdf
[3] Image Acquisition Toolbox, 25 October 2006 from http://www.mathworks.co.uk/products/imaq/
[4] Image Acquisition Toolbox, 25 October 2006 from
http://www.mathworks.co.uk/products/imaq/description2.html
SEM-Botany
26 Chapter 4
4.
Methodologies
In this chapter, named methodologies, the main purpose is to categorize and examine
a number of software development processes. This is followed by a presentation of
software life cycle and the model used.
It also has the results of the initial procedure; this is the first accomplished step for
this project.
4.1 Introduction
In order to improve productivity and quality of the projects, several processes or
methodologies have been developed. In general they were used to formalize or apply
management techniques to the task of writing software.
4.2 Software Development Process
The software development process, known as software engineering process, is a set
of activities, commanded coherently with the purpose of developing or evolving a software
system. It is considered one of the main mechanisms resulting in quality software [2] [3].
Between these activities we find [4] [10] [11]:
•
Domain analysis – in a new project, it includes the design of new software
or an addition to an existing one; it is recommended that the first task is to
investigate the so-called “domain” of the software, the idea is to
comprehend the project to develop;
•
Software elements analysis – it consists in examining the requirements;
identifying the problems that are supposed to be solved, including the
operation capabilities, its desired performance characteristics, and the
resource infrastructure needed to support operation and maintenance;
SEM-Botany
27 4. Me
ethodol
logies
•
S
Specificatio
n – it consiists on the taask of formally describbing the softtware, in
a mathematiically rigoroous form. Basically,
B
itt is the deffinition of what
w
the
p
program
must be able too do;
•
S
Software
arrchitecture – it consistts on the task of represeenting the sy
ystem in
a abstract approach. The objecttives are too guaranteee that the software
an
s
m
meets
the prroduct requiirements. Itt defines thee interconneection and resource
innterfaces beetween systeem subsysteem componnents;
•
Im
mplementaation / Cod
ding – it con
nsists on thee task of redducing the design
d
to
a operationnal source coode;
an
•
T
Testing
– itt consists on the task of testing the
t softwaree, the purpo
ose is to
fiind mistakees in order too correct theem and to reach
r
superiior quality leevels;
•
D
Documentat
tion – it is an
a importan
nt task, and it consists oon documen
nting the
innternal design of the software, assistinng future maintenan
nce and
enhancemennt;
•
M
Maintenanc
ce – it consiists on main
ntaining andd enhancingg software to
o handle
n
newly
discovvered probllems or new
w requirements, it cann take a longer time
thhan the initiial developm
ment of the software.
4.2.1
S
Software
Liife Cycle
A Softwarre Life Cyccle model iss either a descriptive or
o prescriptiive characteerization
of hoow softwaree is or shoulld be develooped [11].
Software goes
g
througgh several phases
p
sincee its concepption until itt becomes outdated,
o
that is
i known ass software lif
ife cycle.
Figu
ure 10: Softw
ware Life Cycle schematicall representatioon.
SEM
M-Botany
y
28
8 4. Methodologies
Nowadays, several proposals and denominations for the different phases of the life
cycle exist; the following phases are the norm:
•
Definition – it is the set of activities that look to the knowledge deepened of
the current situation in order to identify the main problems and find a
possible solution [9], for example [1]:
System analysis – it is the identification, specification and description of
o
the software system requirements. The functional requirements can be
functional / not functional and for user / system;
Process modelling – it focuses on the software system abstraction using
o
models that describe it, being a powerful instrument for the
comprehension and understanding of the final product that will be
developed. The biggest difficulty lies in the balance between simplicity
and complexity. Four methods can be cited:
Structuralized analysis – it consists on the construction of models
using a proper notation of the method, with the purpose of
constructing models portraying the flow and the content of the
information used, describing the essence of what is to be developed
[2];
Essential analysis – it consists on the specification of the activities
that compose a functional model of transformation according to the
user’s necessities [12];
Object-oriented programming – it is based in the composition
and interaction between diverse units of software called objects and
it consists on the specifications of a set of objects that better
describe de software system;
Rational Unified Process (RUP) – it uses the boarding of the
object-oriented in its conception and it is project and register using
Unifies Modelling Language (UML) notation to illustrate the
process in action.
•
Development – it is the set of activities that have the purpose of
constructing the product. It includes [9]:
o
Design – it is the set of activities that have as objective describing how
the software will be implemented. It includes:
SEM-Botany
29 4. Methodologies
Conceptual design - it involves the elaboration of basic ideas and
concepts that determine the basic software elements;
User interface design – it involves the elaboration of the way how
the user can interact to carry through its tasks; it includes the
interface objects choice. The interface must guarantee the good
usability of the software, guaranteeing thus its success;
Architecture design – it involves the elaboration of a macroscopic
vision of the software, describing the interaction between
components;
Algorithms and data structures design, also known as detailed
design – it involves the algorithmic solutions;
Implementation – it involves codification, compilation, integration and
o
test activities;
Verification and validation – it involves activities that aim to
o
demonstrate that the system works properly;
•
Operation – is the set of activities that guarantee the distribution / delivery,
installation / configuration and maintenance [9];
•
Withdrawal – is the set of activities involved in the evolution of platforms
for new requirements incorporation [9].
Due to the singular characteristics of the different phases of the software life cycle,
and depending on the process model adopted, the different phases are delimited by a
different form, which is the same as saying that the beginning and end of each phase are
not rigorously defined.
4.2.2
Processes Models
Software process models represent a networked sequence of activities, objects,
transformations, and events that exemplify strategies for accomplishing software evolution.
Such models can be used to develop more precise and formalized descriptions of software
life cycle activities [11].
SEM-Botany
30 4. Methodologies
The existing models possess different degrees of sophistication and complexity and
must be adapted to the existing conditions, in particular to the team size. For as simple or
complex they might seem models are simpler versions of reality [8].
Various methodologies have been developed to guide the processes involved, as for
example the waterfall model, spiral model, prototyping, unified process and others.
Along these last years, several life cycle models have been developed with the main
purpose of finding a process or a predictable and repeatable methodology that could
improve the productivity and quality [3], after a long time of lack of agreement in terms of
used methods [8].
A software project that does not possess a good project management has a low rate of
success.
4.3 Model used
For the development of any project, including this one, a set of activities can be
defined in order to guarantee the success of the project development.
The model used was simplified adaptation of the Rational Unified Process (RUP), a
complete software development methodology.
The RUP lifecycle is an implementation of the spiral model, it has been created by
assembling the content elements into semi-ordered sequences. It organizes the tasks into
the following phases and interactions [15]:
•
Inception phase – establishment and global definition of the project, using
the initial requirements, defining the initial modules of the system and
architecture;
•
Elaboration phase – specification of the major risk points, defining the
remain requirements, refining the previously defined diagrams;
•
Construction phase – development of the system. This phase includes the
project implementation, and the accomplishment of tests;
•
Transition phase – the final phase, it corresponds to the adjustments and
transference of the system.
SEM-Botany
31 4. Me
ethodol
logies
The follow
wing figure illustrates the
t basic mo
odel adopted:
Figure 111: Basic modeel of RUP [15]].
The startinng point waas the underrstanding off the necesssities that haad led to thee project
proposal, as welll as the deffinition of thhe main requ
uirements.
After thee conclusionn of this phaase, a first id
dea was devveloped, aim
med at resollving the
descrribed necessities in thee previous phase.
p
This led
l to the developmentt of a protottype that
offerred an idea about
a
the innterface to be
b developed.
The next step was a critical analysis
a
of the prototyype in ordeer to perceeive if it
answ
wered to thee previouslyy described necessities,, in the requuirement annalysis phasse. As in
the beginning
b
o the projecct developm
of
ment it was determinedd that the reequirements should
not be
b altered frequently,
fr
w
which
woulld imply constant channges to the developmen
nt of the
workk, the defined requirem
ments were kept to thee end of thee project exxcept for so
ome that
weree eliminatedd.
Later the implementa
i
ation was cooncluded, using
u
MatLaab, followedd by several tests in
orderr to conferr its correcctness. Thaat is, the confirmation
c
n that the software not
n only
answ
wered the neecessities buut also madee it in the co
orrect modee.
4.3.1
In
nitial proceedure
As it was said previoously, the foollowed straategy consissted on subddividing thee project
in phhases and caarrying them
m through inn sequence.
It was staarted by wriiting some “documents” to help understand
u
the necessiities and
whatt should be done.
d
SEM
M-Botany
y
32
2 4. Methodologies
In this section, these initial written documents are presented.
4.3.1.1
Insight and objectives
This document has as main purpose to make a first general presentation of SEMBotany. It is also a brief description of the necessities that led to the proposal of this
project.
Insight
With the SEM-Botany it is intended the creation of an application that assists the use
of the acquired images through SEM. It consists on an attempt of resolving an existing
obstacle in the laboratory of electron microscopy.
It was thought that maybe this problem could easily be solved if some hardware and
software adaptations were made in the actual data acquisition system, which is a very
simple tool that consists only on a photographic system connected to the SEM, working as
two separate modules. This system remains this way since its creation.
The idea is the development of an application capable of registering, through the
SEM’s video signal, information concerning the image that is being analyzed, implying the
ability to record a section of the observed sample, and assisting the treatment of the
collected images upon the necessities of the user.
Objectives
In general, this project development has the main purpose of an advance of the actual
method concerning acquisition and posterior treatment of the images. Enabling the direct
access to digital images acquired via the output of the SEM, with fewer steps and lower
cost.
In more detail, what is requested is the development of an alternative data acquisition
system, capable of connecting the SEM to a computer, having associated an application
development that makes possible image capture and posterior treatment, responding to the
users most eminent needs.
SEM-Botany
33 4. Methodologies
These are, in general terms, the main ambitions of this project.
It is possible, with the projects development, modest application implementations, to
turn it more efficient, giving better response to the actual needs.
Application
After the presentation and description of the principal purposes, follows a
presentation of SEM-Botany utility.
The SEM-Botany does not have in mind the market, but an improvement of the SEM,
including some hardware and software adaptations, providing better user conditions,
following the development of the new technologies, even with alternative techniques.
Actually, the SEM (JEOL JSM-5400) system only allows image visualization in a
monitor and the posterior capture with a photographic mechanism connected to the
microscope, because of that, the system becomes very incomplete and impossibilities the
digital storage of the collected data, (in this case images), providing imperfect data for
posterior studies. Because it does not allow the digital images storage, it compromises
posterior studies, making the results of studies completely user dependent.
Therefore, the alternative consists on the use of an acquisition card, the
DATATRANSLATION frame grabber DT3155. That frame grabber is the sole responsible
for the capture of the SEM output signal, and the transformation of that video signal into a
digital monochromatic image. Simultaneously, and associated to this method, it is intended
that the application also developed in the scope of this project, can also be capable to
supply some image treatment and processing options.
Being so, the software that is pretended must only be able to:
•
Command the frame grabber to capture images;
•
Allow, via some options, the manipulation of some characteristics of the
images, facilitating the distinction of important aspects.
This is not a project whose idea is an innovation, much the contrary, the new SEM
already possesses technologies of acquisition and treatment of image.
SEM-Botany
34 4. Methodologies
However, as the existing microscope (on the laboratory of electron microscopy of the
University of Coimbra) is not exactly recent, it was build in the 90s, and a commercial
adaptation of this level would involve high costs that would prove themselves unviable by
the department. The solution was then found as an alternative to the data acquisition
system.
This method makes possible the “transformation” of the data acquired in a digital
format that can be easily stored, a time that that card possesses all the necessary circuits to
the recognition and conversion of the video signal into a digital image.
Moreover, the acquired data can remain stored in digital format and later visualized,
thus diminishing the deterioration that would occur printing or digitalizing.
4.3.1.2
Requirements analysis
This document has as main purpose the project requirements presentation, which
supports the SEM-Botany development, requirements that are part of this initial phase.
In general, the exposition of the functional requirements is made, as well as hardware
and software requirements that are necessary to posterior development.
As for the functional requirements respective section, a detailed description of the
project and of the application to develop is made, as well as the expected and probable
usages.
In the hardware requirements respective section, the necessary and used hardware
during the development of the SEM-Botany is listed, as well as during the phase of use.
In the software requirements respective section, a list is made of the necessary and
used software during the development of the SEM-Botany, as well as during the phase of
use.
Functional Requirements
Having in sight the growth and practicability of project, it is necessary to proceed to
the development of an application that has as main purpose to provide an improvement
upon the SEM’s use conditions.
SEM-Botany
35 4. Methodologies
This application development, for subsequent use, will have to be capable of
processing acquired data using a frame grabber that interprets the output video signal of the
SEM.
The idea is to supply the possibility of proceeding to the treatment of the acquired
images thus enhancing some characteristic, placing the investigators of the Botany
Department in brace with the possibility to follow the advances in its inquiry area.
Summarizing, this application must have the following characteristics and functions:
•
acquiring images, using the DATATRANSLATION Frame Grabber;
•
improving obtained image visualization;
•
allowing zoom in, and zoom out, of the acquired images;
•
allowing contrast/luminosity regulation;
•
allowing the contours recognition;
•
allowing the selection of regions of interest (ROI), as well as the posterior
treatment;
•
storing acquired images;
•
accessing previously acquired and stored images;
•
printing visualized image;
•
visualization, in real time, of the acquired and modified image;
•
counting events (cells for example).
These were the initial requirements that had suffered adjustments along the
development of the project, some of them were eliminated.
Use Cases
In this specific case and as it deals with a simple application, we only have the case
of one user, who will almost certainly be a Biology researcher.
It is planned to formulate an approach of the available and accessible options in the
application that may be useful to the user.
SEM-Botany
36 4. Methodologies
In a resume way, in this application the user is able to choose at the beginning if he
wants to make a new acquisition, or restudy a stored image.
Then the result is visualized, in a respective window. After that, the user must
analyse the image, and conclude that the image has, or not, the minimum ‘quality’ for his
study.
This application has available defined functions, as options, that can improve the
acquired images quality.
Simultaneously the initial and processed (posterior) images are presented, and the
user can compare them, and observe if the image as become better or worse.
When the study process is finished, the user has the choice of saving the images, with
the alterations made and some images notes.
Language
After some research, the possible chosen language for the computational program
development is MatLab, short for “Matrix Laboratory”.
MatLab was chosen because it provides an easy user environment with intuitive
notation but very powerful. It already possesses several powerful that help data acquisition
and processing.
4.3.1.3
Architecture
After some general thoughts and after having delimited objectives and applications
that SEM-Botany has to support, it is necessary to make a detailed study about the
application architecture.
This document has as main purpose the making of an exhausting presentation of this
application, bearing in mind that one does not exist preceding this type of application.
SEM-Botany
37 4. Methodologies
For the elaboration of this document, and in order to keep some coherence between
the diverse written documents, it was necessary a revision of the Insight and Objectives
and Requirement analyses.
Development and design
This alternative system can be divided in two different parts; one related to the
connection to the SEM and obtaining the output signal, it can be thought as a physical part;
and another related to processing de data, the software part.
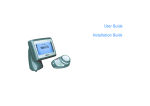
The physical architecture will consist on a computer that will be connected to the
SEM, having as intermediate the frame grabber.
Image 12: Physical architecture
The software architecture can be divided into sub-applications, they are:
•
The beginning phase - where the user must choose what he wants to do;
Image 13: Use case diagram 1.
When the application starts the user can choose to start with a new acquisition, or a stored image.
SEM-Botany
38 4. Methodologies
•
The image processing phase - where the user must choose from the
available choices which functions he wants to apply.
Image 14: Use case diagram 2.
The user must select between the processing options techniques to apply to the image.
•
The ending phase - where the user has to choose if he wants to save his
work.
Image 15: Use case diagram 3.
The application provides the possibility of saving all the work that had been
developed.
Technologies and Languages
As previously described, this application will have to be capable of acquiring data
from the SEM and do its posterior treatment, requiring for this, the support of an interface,
the DATATRANSLATION frame grabber.
SEM-Botany
39 4. Methodologies
Being so, this application will have to be capable of:
•
communicate with the frame grabber in order to obtain the desired data,
and/or execute specific functions;
•
allow the data visualization, in this particular case images;
•
allow data treatment, making possible a better posterior use of it.
Having in sight a better application performance, it was established that the MatLab
programming language would be used, because it has a huge performance in data
processing.
During the project development phase, which includes all the processes involving a
software project, it was necessary the use of following hardware:
•
Computer - support to the project, a time that this project consists on the
software development;
•
Frame Grabber – interface PCI card that connects the SEM to the
computer, responsible for the data interpretation.
During the posterior project development phase, it will be necessary the use of
following hardware:
•
Computer - base of execution of the application to develop;
•
Frame Grabber - interface PCI card that connects the SEM to the
computer, responsible for the data interpretation.
During the project development phase, which includes all the processes involving a
software project, it was necessary the use of following software:
•
Microsoft Office Word – used during the documents writing;
•
Microsoft Office Visio – project planning; elaboration of the diagram of
Gantt, and diagrams construction;
•
Adobe Acrobat Reader - documents visualization ( *.pdf format) and
posterior conversion of the written Word documents to *.pdf format;
•
MatLab 7.01 – code edition and compilation.
During the posterior project development phase, it will be necessary the use of
following software:
SEM-Botany
40 4. Methodologies
•
Adobe Acrobat Reader - documents visualization ( *.pdf format) and
posterior conversion of the written Word documents to *.pdf format;
•
MatLab 7.01 – code compilation.
4.3.1.4
Interface Prototype1
This document has as main purpose the presentation of the interface prototype that
was built to give us an idea about what have to be developed to answer to the described
necessities.
Main Functions
The main function of this program is related to acquisition and processing images.
Firstly the program is initiated and a primal window is displayed containing a menu
bar with several options, such as File, Tools, and Help, two empty regions and several
buttons with the available functions. The options are activated by pushing the bottoms in
the main window using the mouse. Each option has associated a descendent menu with
several executable functions, some of them executed immediately and others need some
confirmations or some parameters specifications. The images will be displayed on the
empty regions.
All windows can be moved with the mouse and when some parameter is incorrect or
missing an error message is displayed.
Now, a brief description of the visible options will be made:
•
File – this option will be used to initiate, load, print and save images. It will
be also used to quit the applications;
•
Tools – this option will be used after an image is chosen, and it will apply
some processing techniques such as filters, the contrast/luminosity
1
This was the first idea, so called prototype. Along the project development it suffered some transformations. SEM-Botany
41 4. Me
ethodol
logies
a
adjustment,
edges detection, resize images, count
c
eventts and add notes to
thhe associateed file;
•
H – this option
Help
o
will provide
p
the access to thhe "Instructiions Manuaal".
Using Maatlab, it waas made a first
f
prototy
ype, and a simple reppresentation
n of it is
preseented in imaage 14.
Imagee 16: Interfacee prototype.
4.3.1.5
Scheduling
p
of thee initial doccuments, it was
w necessaary to proceeed to its
After all thhe writing phase
schedduling, that consists off a managem
ment of the tasks
t
for thee available ttime.
The follow
wing imagee represents the Gantt Diagram
D
that shows thhe initial sch
heduling
of the tasks to thhe length off the projectt developmeent.
SEM
M-Botany
y
42
2 4. Methodologies
Image 17: Gantt Diagram – Initial schedule
During the project development, these stages previously defined had suffered some
alterations mainly due to the fact that the project had been developed from the beginning
and the time intervals for each stage were not defined.
The following image represents the final Gantt Diagram, which represents the real
scheduling of the tasks to the length of the project development.
Image 18: Gantt Diagram – Final schedule
4.4 References
[1] Engenharia do Software, 3 July 2007 from http://pt.wikipedia.org/wiki/engenharia_de_software
[2] Análise Estruturada, 3 July 2007 fom http://pt.wikipedia.org/wiki/An%C3%A1lise_Estruturada
[3]
Processo
de
desenvolvimento
de
Software,
3
July
2007
from
http://pt.wikipedia.org/wiki/processo_de_desenvilvimento_de_software
[4]
Especificação
de
programa,
5
July
2007
from
http://pt.wikipedia.org/wiki/Especifica%C3%A7%C3%A3o_de_programa
SEM-Botany
43 4. Methodologies
[5] Arquitectura de Software, 5 July 2007 from http://pt.wikipedia.org/wiki/Arquitetura_de_software
[6] Teste de spftware, 10 July 2007 from http://pt.wikipedia.org/wiki/Teste_de_Software
[7]
Análise
de
Software,
10
July
2007
from
http://pt.wikipedia.org/wiki/Documenta%C3%A7%C3%A3o_de_software
[8] Modelos de ciclo de vida, 10 July from http://pt.wikipedia.org/wiki/Modelos_ciclo_de_vida
[9] http://engenhariadesoftware.blogspot.com/2007/02/ciclo-de-vida-do-software-parte-1.html
[10]
Software
development
process,
11
July
2007
from
http://pt.wikipedia.org/wiki/Software_development_process
[11]
Walt
Scacchi,
“Process
Models
in
Software
Engineering”,
11
July
2007
from
http://www.ics.uci.edu/~wscacchi/Papers/SE-Encyc/Process-Models-SE-Encyc.pdf
[12] Projecto Estruturado, 14 July 2007 from http://pt.wikipedia.org/wiki/Projeto_Estruturado
[13] Architecture and Design, 14 July 2007 from http://www.cetus-links.org/oo_uml.html#oo_uml_books
[14]
Unified
Modeling
Language,
14
July
2007
from
September
2007
from
http://en.wikipedia.org/wiki/Unified_Modeling_Language
[15]
Rational
Unified
Process,
6
http://en.wikipedia.org/wiki/Rational_Unified_Process
SEM-Botany
44 Chapter 5
5.
Implemented Solution
In this chapter, it is intended to present the system that was implemented after a long
study and effort to find viable solutions.
It is intended to make a presentation of the system that was implement in the
Laboratory of Electron Microscopy.
5.1 Introduction
Such as was said previously, the objective of the SEM-Botany is the development of
a new alternative system of data acquisition to that used in the Laboratory of Electron
Microscopy, more specifically the development of system for the acquisition, processing
and storing of images from the SEM.
For better understanding, the complete system was divided in two components:
•
A component that involves the hardware, responsible for the acquisition of
images, where the hardware used will be described;
•
A component that involves software, responsible for the processing and
storage of the images, where the software will be presented, including the
development and usage.
5.2 Hardware Component
The part of the system that involves the hardware is responsible for the information
flow. It comprises (see figure 19):
•
A signal source – in this case a SEM composite video output;
•
A signal receiver – in this case the DT3155 a DATATRANSLATION frame
grabber, whose choice was already justified in chapter three. It was installed
on a computer dedicated to this system;
•
A transmitter – in this case a cable with BNC connectors in order to
connect the output of the SEM to the DT3155 frame grabber.
SEM-Botany
45 5. Imp
plement
ted Solution
Figgure 19: schem
matical repressention of the system.
The outpuut of the SEM
M is carriedd to the fram
me grabber, where it is digitalized.
5..3 Softwaare Compoonent
The develloped softw
ware is respoonsible for the acquisittion, processsing and sttoring of
the digital
d
imagees.
This sectiion intends to explainn the devellopment and operationn of the deeveloped
softw
ware, comm
menting the most
m importtant aspectss.
5.3.1
G
Graphical
U
User
Interfa
face (GUI)
A Graphiccal User Innterface, coommonly caalled GUI, is a pictoriial interfacee with a
progrram whose objective iss to facilitatte its use. Fo
or that reasoon it must ppresents a co
onsistent
appearance withh intuitive, understanddable and predictable
p
c
controls
in order that the user
only concentratees in its use [1].
The threee main requiired elemennts to create a GUI usinng MATLAB
B are: [1]
•
C
Component
ts - any MA
ATLAB item
m is a graphiical componnent, namelly:
o
graphhical controlls, like butto
ons, editionn boxes and lists;
o static elements,
e
liike pictures and chains of characteers;
o menuss;
o axis;
SEM
M-Botany
y
46
6 5. Implemented Solution
•
Figures - windows where components are arranged;
•
Return Calls - the code to be executed in reply to an event1.
For the development of the GUI, it was used a MATLAB graphical user interface
development environment (GUIDE) that provides a set of tools to assist GUIs creation.
It has a layout editor that enables us to create a GUI dragging the components into
the layout area, and change their properties, having in count what is intended [2].
When this layout is saved, it automatically generates an M-file with code to
initialize the GUI, and to which can be added code to execute when the components are
activated. [2] These events are defined as callback functions.
Since the main purpose of the application is related with the acquisition, processing
and storing of images, it was found convenient that the GUI must offers a way to visualize
the initial and processed images simultaneously, so it was then determined to make use of
two windows for this effect; a minor one, where the initial image is displayed, and a larger
one where the final image is displayed.
For the processing alternatives it was determined to present the functions, describe
latter in this section, available in the menu. The first idea was to offer these same functions
in several buttons, but for aesthetic reasons it was dropped.
In order to complete the studies carried through in the laboratory, the possibility to
associate information to the image was added, allowing annotations addition. For this
purpose a visualization window was created, where is possible to visualize the content of a
file that is associated with the image.
The organization of the menu had in account its practical use. For this it was
subdivided in four groups, originating sub-menus:
•
File, which contains:
o New Acquisition;
o Open stored images;
o Save / Save As;
o Quit;
1 Events can be defined as entrances, for example pressing the mouse button.
SEM-Botany
47 5. Implemented Solution
Its similarity with any WINDOWS used programs is not coincidence; therefore the
users will feel themselves more familiar with the interface.
•
Tools, which are the result of an attempt to group all the available
processing functions. Its organization tends to demonstrate a possible
sequence of its use. The available functions are:
o Filter;
o Contrast and Brightness Adjustment - using a pre-defined function or
manipulating the histogram;
o Edges Detection - using Canny, Log or Roberts method;
o Resize - using Bilinear, Bicubic or Nearest Interpolation;
•
Back to the original image offers the user the chance to return to the initial
image, that is, after the application of processing functions fail to work;
•
Help offers to the user the access to the user manual.
All the components are activated using the mouse or the shortcut keyboard keys
previously defined.
The final graphical interface has the following aspect:
Figure 20: Aspect of the developed GUI.
In the next sections it will be presented and justified the coded return calls in this
program.
SEM-Botany
48 5. Implemented Solution
5.3.1.1
File
New Acquisition
This is the activated function when the objective is to make a new acquisition, so it
has to acquire one image using the SEM, for this it will use the DT3155 frame grabber
from DATATRANSLATION, which have to be activated and its data collected for the
MATLAB.
As it was said previously, MATLAB was chosen among others things for its diverse
library that facilitates its applications.
For this particular case it was used the Image Acquisition Toolbox.
This toolbox help us providing functions to connect and configure the hardware for
acquiring images or/and video directly from it into MATLAB [3]. It can continuously
acquire image data while processes the acquired data [4] and it supports any color space
provided by the device, such as RGB, YUV and in this particular case grayscale. The
image data is a multidimensional array compatible with standard MATLAB functions. [4]
A function useful for open, initialize, configure, and control an acquisition device is
the function videoinput. The opening, initializing, and configuration occur once, at the start
of the model's execution, and it represents the connection between MALAB and a
particular acquisition device [5], in this case the DT3155 frame grabber from
DATATRANSLATION. To obtain a single image frame, the function getsnapshot is used.
When this option is activated, several checks are made do ensure that the program is
executed without errors, detecting for example the existence or not of an image for study or
if exists the risk of losing unsaved images, displaying specific warning dialog in each case.
The following code is responsible for the acquisition of images:
vid = videoinput ( 'dt' , 1 );
start ( vid );
IMG = getsnapshot ( vid );
delete ( vid );
After this process, the image is presented. First the initial/original image is displayed
on the small window, using the following code:
set ( handles.original , 'HandleVisibility' , 'ON' );
SEM-Botany
49 5. Implemented Solution
axes ( handles.original );
imagesc ( IMG );
colormap ( gray );
set ( handles.original , 'HandleVisibility' , 'OFF' );
set ( handles.original , 'XTickLabel' , '' , 'YTickLabel' , '' );
Next the processed image, initially similar to the original image, is displayed on the
large window, using the following code:
set ( handles.processed , 'HandleVisibility' , 'ON' );
axes ( handles.processed );
imagesc ( IMG );
colormap ( gray );
set ( handles.processed , 'HandleVisibility' , 'OFF' );
set ( handles.processed , 'XTickLabel' , '' , 'YTickLabel' , '' );
In this process the image data is stored in the variable IMG that is defined as global
variable, being available to the others callback functions.
Open
This is the activated function when the objective is to open a stored image, which
could be stored in any directory.
In order to help in this process, the uigetfile function is used, which displays a dialog
box that enables the user to select a file to be opened [6].
However, it is necessary to load the image information and for this is used another
toolbox, the Image Processing Toolbox.
The Image Processing Toolbox provides a set of algorithms and graphical tools for
image processing, analysis, visualization, and algorithm development [7]. Between them it
can be found the imread function, which is capable of reading a grayscale or color image
from a specified file [8]. The cd function is used to change working directory, which is
necessary to prevent a general exception.
The following code is responsible for opening images:
[filename,pathname]=uigetfile({'*.format’},'Choose Image.');
cd ( pathname );
IMG = imread ( filename );
cd ( current_pathname );
SEM-Botany
50 5. Implemented Solution
After this process, the images are displayed in the same manner that was described.
In this process the image data is stored in the variable IMG that is defined as global
variable, being available to the others callback functions.
Save /Save As
This is the activated function when the objective is to save an image.
Again the Image Processing Toolbox2 assists this task, with getimage and imwrite
functions, that are valuable in retrieving and saving the processed image.
The following code is responsible for saving images:
get_image = getimage(handles.processed);
[ savename , savedpathname ] = uiputfile ({'*.format'},'Save...');
cd ( savedpathname );
imwrite ( save_IMG , savename );
The get_image function returns the first image data contained in the handle graphics
object, in this particular case the processed image window; the uiputfile option offers the
possibility to specify the file name, in this case the image to save and the path where to
save it.
Close
This is the activated function when the objective is to terminate the application.
If there is no image to save or if it is discarded by the user the application is closed
and with it all the variables from the MATLAB environment.
For this described process is executed the following code:
fclose ( 'all' );
clear all
close all;
clc;
quit;
2
For further information consult http://www.mathworks.com/products/image/
SEM-Botany
51 5. Implemented Solution
5.3.1.2
Tools
An important fact of this project is centered in the processing of the images using
enhancement techniques to increase its quality.
To assist in this task the Image Processing Toolbox is used because, as was already
said, it has several standard algorithms and graphical tools for image processing, analysis,
visualization and algorithms development.
After the analysis of the application requirements, it was defined that the functions,
that will be described, are the ones that are necessary to address the most eminent and
initial requirements described in chapter four.
Filter
This is the activated function when the objective is to filter the image to analyze.
This option is available, not directly because the initial requirements but because
after some tests (acquisition of some images) it was detected a soft noise in the images.
The images presented random shining points, as well as an effect that was visible in the
contours, the lines were not finely delimitated.
With the purpose of reducing that noise in the images, some experiments showed that
it could be reduced or partially eliminated with the use of digital filters.
So in the Image Processing Toolbox was found a very useful filter that is defined by
the mefilt2 function.
The medfilt2 perform two-dimensional filtering with a nonlinear operation used to
reduce the “salt and pepper” noise preserving the edges [9].
The following code is responsible for filtering the images:
IMG_filter = medfilt2 ( IMG , [ 3 2 ] );
The filtered image is stored in the variable IMG_filter, and the following code is
responsible to display the ‘processed’ image in the corresponding window:
set ( handles.processed , 'HandleVisibility' , 'ON' );
imagesc (IMG_filter );
set ( handles.processed , 'HandleVisibility' , 'OFF' );
set ( handles.processed , 'XTickLabel' , '' , 'YTickLabel' , '' );
SEM-Botany
52 5. Imp
plement
ted Solution
Figure 21: Imagge before and
d after the proccessing
The variabble IMG_filter is definned as glob
bal variable, being avaailable to th
he others
callbback functioons.
Contrast and
a Brightneess Adjustm
ment
This is thee activated function when
w
the objjective is too provide soome adjustm
ments in
the contrast
c
and brightness of the imagge to process.
t contrastt and brighttness adjusttment usingg two methoods. One th
hat relies
It allows the
on thhe user inpuut and a simppler one thaat doesn’t.
To implem
ment this opption some functions provide
p
by the
t Image P
Processing Toolbox,
T
that contains seeveral imagge enhancem
ment routin
nes were used, in partiicular imadj
djust and
imcoontrast.
The imadjjust functioon increasess the contrasst of the im
mage by mappping the values
v
of
the input intenssity image to
t new valuues such thaat 1% of thhe data is saaturated at low and
high intensities of the inputt data [10].
The imconntrast functtion createss a tool of contrast addjustment inn a separatee figure,
howeever associated to the image, whhich provid
des an interactive conttrast and brrightness
adjusstment tool that containns a scaled histogram of
o pixel valuues that cann be changeed by the
user [11].
SEM
M-Botany
y
53
3 5. Imp
plement
ted Solution
The follow
wing code iss responsiblle for ‘adjussting’ the im
mages:
•
U
Using
imadjjust, or the auto
a
option from the menu:
m
IMG _auto = imadjust ( IMG
G ) ;
set ( handles.processed , 'HandleVi
isibility' , 'ON' );
imagesc (IMG_auto );
set ( handles.processed , 'HandleVi
isibility' , 'OFF' );
set ( handles.processed , 'XTickLab
bel' , '' , 'YTickL
Label' , '' );
Figure 22: Imagge before and
d after the proccessing
The imagee data after the adjustm
ment is storeed in the vaariable IMG
G_auto befo
ore being
displlayed.
•
U
Using
imconntrast, or thee histogram
m option from
m the menuu:
set ( handles.processed , 'HandleVi
isibility' , 'ON' )
imcontrast ( gca );
colormap ( gray );
set ( handles.processed , 'HandleVi
isibility' , 'OFF' );
set ( handles.processed , 'XTickLab
bel' , '' , 'YTickL
Label' , '' );
As this tool is associiated with the
t image, in
i this case to the winndow contaiining the
proceessed imagee, the changges made are instantaneeously displlayed.
SEM
M-Botany
y
54
4 5. Implemented Solution
Edges Detection
This is the activated function when the objective is to point out the edges of the
image to process.
To programming this option it was used some functions provide by the Image
Processing Toolbox that contains several image enhancement routines, in this particular
case a function named edge.
Edge function takes a grayscale or a binary image as its input, returning a binary
image with the same size, where 1’s designates the edges and 0’s elsewhere [12]. This
function supports several edge-finding methods, such as:
•
Canny method – detects edges by looking for local maxima of the gradient
of the image. The gradient is calculated using the derivative of a Gaussian
filter. The method uses two thresholds, to detect strong and weak edges, and
includes the weak edges in the output only if they are connected to strong
edges;
•
Sobel method – detect edges using Sobel approximation, that is where the
gradient is maximum;
•
Prewitt method – detect edges using Prewitt approximation, that is where
the gradient is maximum;
•
Roberts method - detect edges using the Roberts approximation, that is
where the gradient is maximum;
•
Laplacian of Gaussian method - detect edges by looking for zero crossings
after filtering the image with a Laplacian of Gaussian filter;
For this application there are available only edges detection using Canny, Log and
Roberts method.
The following code is responsible for finding the edges of the image:
edges_IMG = edge ( IMG , 'method' );
set ( handles.processed , 'HandleVisibility' , 'ON' );
imagesc (edges_IMG );
set ( handles.processed , 'HandleVisibility' , 'OFF' );
set ( handles.processed , 'XTickLabel' , '' , 'YTickLabel' , '' );
SEM-Botany
55 5. Imp
plement
ted Solution
Figure 23: Imagge before and
d after the proccessing
The imagee data after the edges detection
d
iss stored in the
t variablee edges_IMG
G before
beingg displayed.
Resize
This is thee activated function
f
whhen the objeective is to change
c
the analyze imaage size.
To programmin
p
ng this optioon it was ussed some fu
unctions proovide by thee Image Pro
ocessing
Toolbbox that contains sevveral imagee enhancem
ment routinnes, in thiss particularr case a
functtion named imresize.
Imresize function
f
retuurns an imaage B that is
i scale times the size of image A.
A In this
speciific case im
mage B willl be biggeer than the original im
mage, so it can be viewed as
‘zoom
ming’, and it requires the creatioon of new pixel
p
locatioons that neeeds new grray-level
valuees. This graay-level assiignment cann be made using
u
severaal methods: [13] [14]
•
B
Bicubic
inteerpolation - the outp
put pixel vaalue is a w
weighted aveerage of
p
pixels
in the nearest 4-bby-4 neighborhood;
•
B
Bilinear
intterpolation
n - the outp
put pixel vaalue is a w
weighted average of
p
pixels
in the nearest 2-bby-2 neighborhood;
•
N
Nearest-nei
ghbor interpolation – the outputt pixel is asssigned the value of
thhe pixel thaat the point falls
f
within..
SEM
M-Botany
y
56
6 5. Implemented Solution
The need to resize the images came as a necessity to increase the printing resolution,
due to the minimum value for Dots per Inch acceptable. So if we have an image to print
with a specific width and length, it will have a resolution proportional to the number of
pixels, that is, how higher the number of pixels greater the resolution.
Firstly the user must select the parameter for magnification, and then it needs
confirmation to change the size of the image.
magnifying_parameter = listdlg ( 'ListString' , [ '1' ; '2' ; '3' ;
'4' ] ,'SelectionMode' , 'single' , 'ListSize' , [ 150 70 ] , 'Name' ,
'Select...' , 'PromptString' , 'Magnifying parameter' );
[ x y ] = size ( IMG );
X = num2str ( magnifying_parameter .* x );
Y = num2str ( magnifying_parameter .* y );
confirm = questdlg( { [ 'Image has ' X ' x ' Y 'pixels.' ] ; 'Do you
want to continue?' } ,'Confirm Image Magnifying...' );
answer = length ( confirm );
if answer == 2 | answer == 5;
clear magnifying_parameter;
else
interpolation = ‘selected interpolation method’;
end
new_IMG=imresize(get_image, magnifying_parameter, interpolation);
The modified image is stored in the variable new_IMG and is available for others
Callback functions.
Add Notes
This is the activated function when the objective is to add notes to a file that is
associated to the image.
This idea appeared in the attempt to maximize the use of the application, that is, to
supply to the user the major number of possible resources, in this case the possibility to
register annotations in a file associated with the image.
When this option is selected, appears a new window where the user will be able to
write the annotations that desires to include in the file;
prompt = ( 'Enter a new comment... ' );
SEM-Botany
57 5. Implemented Solution
title = 'Add Notes ...';
numlines = 1;
new_add = char ( inputdlg ( prompt , title , numlines ) );
Following, this new entry will be added to the specific file, and its content visualized
in the correspondent window;
notes_length = length ( new_add );
if notes_length == 0;
warndlg ( 'Nothing added!!!' );
return;
else
fid = fopen ( [ name '.txt' ] , 'a' );
fprintf ( fid , [ '
- ' new_add '\n' ] );
visualize = char(fread(fopen([name '.txt' ], 'r' )));
fclose ('all');
set ( handles.note , 'HandleVisibility' , 'ON');
set(handles.note, 'String', visualize' );
end
5.3.1.3
Back to the Original
This is the activated function when the objective is to return to the original or initial
image, discarding all changes made.
The following code is responsible for return to the initial image:
-
Firstly the image data is collected from the original window
get_original = getimage ( handles.original );
-
Then, those data are displayed on the processed window
set ( handles.processed , 'HandleVisibility' , 'ON' );
axes ( handles.processed );
imagesc ( get_original );
set ( handles.processed , 'HandleVisibility' , 'OFF' );
set ( handles.processed , 'XTickLabel' , '' , 'YTickLabel' , '' );
5.3.1.4
Help
This is the activated option when the objective is to get some useful help or
clarification of doubts on the use of the application. The User Manual, available as a pdf
file, is opened.
SEM-Botany
58 5. Implemented Solution
For this described process is only executed the following line of code:
open ( 'User Manual.pdf' );
5.4 Testing
During the development of the project, several informal tests had been prepared, with
the intention to correct the errors and to confirm the correct operation of the implemented
functions.
5.5 References
[1] CHAPMAN, Stephen J.; Programação em MATLAB para Engenheiros (2nd edition); Thomson (2003)
[2] GUIDE, 3 August 2007 from
http://www.mathworks.com/access/helpdesk/help/techdoc/index.html?/access/helpdesk/help/techdoc/ref/guid
e.html&http://www.google.pt/search?hl=pt-PT&q=guide+matlab&meta=
[3] Image Acquisition Toolbox, 3 August 2007 from http://www.mathworks.co.uk/products/imaq/
[4] Image Acquisition Toolbox, 3 August 2007 from
http://www.mathworks.co.uk/products/imaq/description2.html
[5] http://www.mathworks.fr/products/imaq/functionlist.html
[6] MATLAB Function Reference, 3 August 2007 from
http://www.mathworks.com/access/helpdesk/help/techdoc/index.html?/access/helpdesk/help/techdoc/ref/uige
tfile.html&http://www.google.pt/search?hl=pt-PT&q=mathworks+uigetfile&meta=
[7] Image Processing Toolbox, 3 August 2007 from http://www.mathworks.com/products/image/
[8] imread, 5 August 2007 from
http://www.mathworks.com/access/helpdesk/help/toolbox/images/index.html?/access/helpdesk/help/toolbox/i
mages/imread.html&http://www.google.pt/search?hl=pt-PT&q=image+processing+toolbox+imread&meta=
[9] medfilt2, 5 August 2007 from
http://www.mathworks.com/access/helpdesk_r13/help/toolbox/images/medfilt2.html
[10] Image Processing Toolbox, 8 August 2007 from
http://www.mathworks.fr/products/image/demos.html?file=/products/demos/shipping/images/ipexcontrast.ht
ml
SEM-Botany
59 5. Implemented Solution
[11] imcontrast, 8 August 2007 from
http://www.mathworks.com/access/helpdesk/help/toolbox/images/index.html?/access/helpdesk/help/toolbox/i
mages/imcontrast.html&http://www.google.pt/search?hl=pt-PT&q=mathworks+imcontrast&meta=
[12] Image Processing Toolbox – Functions, 8 August 2007 from
http://www.mathworks.com/access/helpdesk/help/toolbox/images/index.html?/access/helpdesk/help/toolbox/i
mages/f3-23960.html&http://www.mathworks.com/products/image/
[13] imresize, 8 August 2007 from
http://www.mathworks.com/access/helpdesk/help/toolbox/images/index.html?/access/helpdesk/help/toolbox/i
mages/imresize.html&http://www.google.pt/search?hl=pt-PT&q=mathworks+imresize&meta=
[14] GONZALEZ, Rafael C.; WOODS, Richard E.; Digital Image Processing (2nd edition); International
Edition (2002)
SEM-Botany
60 Chapter 6
6.
Conclusion
The SEM-Botany project consisted on the development of a system of acquisition,
processing and storing images proceeding from SEM providing better condition for the
users of the Laboratory of Electron Microscopy.
It allows the acquisition of digital images, and the application of some processing
techniques to improve images quality.
After the terminus of the project some conclusions were made about the work
developed during this period, as well as the project itself including its future.
The final results are sufficiently positive, because the project was planned from the
beginning, following all the steps to succeed.
6.1 Developed Work
The project objectives, since the beginning, were the development of a system of
acquisition, processing and storage of images, to use in the Laboratory of Electron
Microscopy, in order to improve the conditions of use of the investigators that use SEM,
supplying images in digital format.
For that a system capable of acquiring digital images from the SEM using a DT3155
frame grabber from DATATRANSLATION was developed, and made available some
processing techniques that can be used to improve image quality, using MATLAB and its
toolboxes, more specifically the image processing and image acquisition toolbox.
The developed work, supported by the obtained experimental results, shows that it is
possible to use the new system of acquisition, processing and storage of digital images.
Along the project development, some complications appeared, considering it is a new
project development using a new language, as well as the appearance of some unexpected
problems from the part of the hardware that had led to the insertion of new functions to
SEM-Botany
61 6. Conclusions
solve small limitations, for example the necessity of the insertion of a filter in order to
reduce the noise.
Even with these misfortunes, it was possible to implement all that was intended
initially.
6.2 Future Developments
As it was already said, the requirements were delimited initially, upon the first
documents, and it was made an attempt to keep them stable, in order to limit the
development of the application.
At this moment it is possible, with the developed and implemented methods, to
acquire digital images proceeding from SEM, as well as reducing the present noise,
filtering them; it is also possible to adjust the contrast/brightness, detecting the contours
and storage of these same images in several formats.
This new application corresponds to a valuable and innovative contribution for the
improvement of the SEM user’s conditions and although the developed application fills the
considered initial requirements it will have to be improved in some aspects, such as:
•
Improve the GUI to make it more accessible, facilitating its use;
•
Improve the functions, algorithms used to improve the application
performance;
•
Development and insertion of new functions, new processing techniques,
such as:
o
counting of elements;
o
measurement of elements;
o Three-dimensional reconstruction;
•
Development of a database.
SEM-Botany
62 Appendix
Appendix 1:
D
DT3155
DATATRANSL
LATION dattasheet:
SEM
M-Botany
y
63
3 Appendix
SEM
M-Botany
y
64
4 Appendix
SEM
M-Botany
y
65
5 Appendix
SEM
M-Botany
y
66
6 Appendix
Appendix 2:
SEM-Botany User Manual
This manual intends to describe, in an easy approach, how to use the SEM-Botany
application.
The SEM-Botany is an application that is capable of acquiring, storing and
processing images from a Scanning Electron Microscopy existent on the Laboratory of
Microscopy of the Botanic Department of the Faculty of Sciences and Technology of the
University of Coimbra.
Available options:
Open images;
Save images;
Processing tools:
¾ Filter;
¾ Contrast and luminosity adjustment;
Auto;
Histogram;
¾ Edges detection;
Canny method;
Log method;
Roberts method;
¾ Magnification;
Bicubic interpolation;
Bilinear interpolation;
Nearest interpolation;
¾ Add notes;
Back to original image.
SEM-Botany
67 Appendix
Acquire images
This option allows the acquisition of images.
To acquire images, select File and then New Acquisition, or use the shortcut ctrl+N.
Figure 1 exemplifies:
Figure 1 – Image acquisition demonstration.
The acquired image will be visualized. The application has two windows, the first
one, which titles is original image, will always contain the initial image; and the second,
which titles is processed image, will contain the image and its changes.
Figure 2: Acquired images visualization.
Notes:
Before image acquisition please make sure that SEM and PC are correctly
connected, and the MatLab application is open (figure 3 shows the windows that must
appears in the monitor).
SEM-Botany
68 Appendix
Figure 3: Application interface.
To get better acquisitions, the microscope scanning must be stopped,
avoiding errors and reading distortions.
SEM-Botany
69 Appendix
Open...
This option permits the visualization of images previously acquired and stored,
making possible new studies in previous images.
For the image, previous acquired and stored, visualization File must be selected and
then Open Image, or using the shortcut ctrl+O.
Figure 4 exemplify:
Figure 4 – Open image file demonstration.
Selected image will be visualized in the available windows, as exemplify in figure 5.
Figure 5 – Image file visualization in the two available windows.
SEM-Botany
70 Appendix
Save / Save As
This option permits the storage of the study image, in any directory path.
File must be selected followed by Save (ctrl+s), as it demonstrates figure 6.
Figure 6 – Demonstration of storage of images
The user can choose the image name and the storage format.
The following table presents all the possible formats:
Format full name
windows Bitmap (BMP)
Format
bmp
Graphics Interchange Format (GIF)
gif
Hierarchical Data Format (HDF)
Hdf
Joint Photographic Experts Group (JPEG)
jpg ou jpeg
Portable Bitmap (PBM)
pbm
Windows Paintbrush (PCX)
pcx
Portable Graymap (PGM)
pgm
Portable Network Graphics (PNG)
pmg
Portable Anymap (PNM)
pnm
Portable Pixmap (PPM)
ppm
Sun Raster (RAS)
ras
Tagged Image File Format (TIFF)
W Windows Dump (XWD)
tif ou tiff
xwd
Table 1: Storage image formats.
SEM-Botany
71 Appendix
Avvailable Process
sing Tecnhiques
s
Filterr
In this opttion is available a bidiimensional median filtter. This typpe of filter acts in a
nonliinear filter form,
f
and iss used in thee noise redu
uction, preseerving the ccontours.
Its use beccomes very useful in thhe reduction
n of pixelizaation effect.
(
(a) (b) Figure 6 – Comparingg images not using
u
(a) and using
u
(b) the fi
filter.
To select this
t option choose
c
Toools, followin
ng filter (ctrrl+f), as shoowed in figu
ure 7.
Figure 7 – Demonsstration of the application of the filter.
SEM
M-Botany
y
72
2 Appendix
Contrast and Brightness Adjust
This option allows the contrast and brightness adjustment, using two different
methods, an automatic adjustment or using image histogram manipulation.
To select these options, select Tools followed by Contrast and Brightness, as
showed in figure 8.
Figure 8 – Method selection.
Edges Detection
This option allows the image edges detection.
In an image the contour is a curve that describes a standard that quickly modifies the
intensity of the image. The edges are associated with the objects borders.
To select this option choose Tools followed by Edges, where later it will have to
choose the method that better satisfies the necessities in cause, as shows figure 9.
Figure 9: Demonstration of the method selection for edges detection.
SEM-Botany
73 Appendix
Add Notes
This option offers to the user the possibility of introduce annotations that will be
added to the description of the image, allowing a posterior comment and reading.
To select these options, Tools must be selected followed by Add Notes, as showed
in figure 10.
Figure 10 – Adding notes demonstration.
Return to the original image
This option makes possible return to the initial image, eliminating any done
alterations.
To select this option the Return the original image must be selected, as it shows
figure 11.
Figure 11 – Return to the original image.
SEM-Botany
74