1
HP GlancePlus User's Manual
(for MPE/iX Systems)
ABCDE
HP Part No. B1787-90001
Printed in U.S.A. 0492
Edition 2
E0492
Notice
Hewlett-Packard makes no warranty of any kind with regard to this material,
including, but not limited to, the implied warranties of merchantability and
tness for a particular purpose. Hewlett-Packard shall not be liable for errors
contained herein or for incidental or consequential damages in connection with
the furnishing, performance, or use of this material.
Hewlett-Packard assumes no responsibility for the use or reliability of its
software on equipment that is not furnished by Hewlett-Packard.
c Copyright 1992, Hewlett-Packard Company.
This document contains proprietary information, which is protected by
copyright. All rights are reserved. No part of this document may be
photocopied, reproduced, or translated to another language without the prior
written consent of Hewlett-Packard Company. The information contained in
this document is subject to change without notice.
R , MS-DOS
R , and WindowsTM are U.S. registered trademarks of
Microsoft
Microsoft Corporation.
Hewlett-Packard Company
SWT/Software Technology Center
8010 Foothills Boulevard
Roseville, CA 95678 U.S.A.
Printing History
Updates are new editions or complete revisions of the manual.
A software code may be printed before the date; this indicates the version level
of the software product at the time the manual was issued. Many product
updates and xes do not require manual changes and, conversely, manual
corrections may be done without accompanying product changes. Therefore, do
not expect a one-to-one correspondence between product updates and manual
updates.
Edition 1
Edition 2
6/90 B1787-90001 E0690
4/92 B1787-90001 E0492
iii
Conventions
Capitalization
Computer Font
Italics
UPPERCASE
Return5 or 4Enter5
4
Notice
Capitalized rst letters signify HP GlancePlus
commands, screen names, screen sections, function keys,
company names, and product names.
Computer font represents screen text, including
prompts and messages that appear on the screen, and
characters or words that you are prompted to enter on
the screen.
Italics are used to emphasize words, phrases, or
characters in the text, or in syntax strings, to indicate
variables.
Words in all uppercase (capitals) represent program
elds and system commands that should be entered
exactly as shown.
Depending on your keyboard, one or the other
represents the terminal key used to execute a command.
MPE/iX, Multiprogramming Executive with Integrated POSIX,
is the latest in a series of forward-compatible operating systems
for the HP 3000 line of Hewlett-Packard computers.
MPE/iX is a superset of its direct predecessor MPE XL, and
all programs written for MPE XL will run under MPE/iX
without change. Also, you can continue to use MPE XL system
documentation, although it may not refer to features added
to the operating system to support POSIX (for example,
hierarchical directories).
You may encounter references to MPE V, the operating system
for HP 3000s that are not based on the PA-RISC architecture.
MPE V software can be run on PA-RISC HP 3000s (series 900)
in compatibility mode .
iv
Contents
1. Introduction
What HP GlancePlus Can Do For You .
How You Can Use HP GlancePlus . . .
Will You Need Other Performance Tools?
How to Use This Manual . . . . . . . .
.
.
.
.
.
.
.
.
.
.
.
.
.
.
.
.
.
.
.
.
.
.
.
.
.
.
.
.
.
.
.
.
.
.
.
.
.
.
.
.
1-1
1-2
1-2
1-3
2. Installation
System Requirements . . . .
Terminal and PC Requirements
Installing HP GlancePlus . .
Group Capabilities . . . .
Group Access . . . . . . .
Installing the Program . . .
.
.
.
.
.
.
.
.
.
.
.
.
.
.
.
.
.
.
.
.
.
.
.
.
.
.
.
.
.
.
.
.
.
.
.
.
.
.
.
.
.
.
.
.
.
.
.
.
.
.
.
.
.
.
.
.
.
.
.
.
2-1
2-1
2-2
2-2
2-2
2-2
3. Getting Started
Overview . . . . . . . . . . . . . . . . . . . . . . .
Running HP GlancePlus for MPE/iX . . . . . . . . . . .
Exiting HP GlancePlus . . . . . . . . . . . . . . . . .
More Than a Look|The HP GlancePlus Global Screen . . .
Reading the Screen Display . . . . . . . . . . . . . . .
Banner Line . . . . . . . . . . . . . . . . . . . . .
Global Bars . . . . . . . . . . . . . . . . . . . . .
CPU Bar . . . . . . . . . . . . . . . . . . . . .
Disc Bar . . . . . . . . . . . . . . . . . . . . . .
Memory Bar . . . . . . . . . . . . . . . . . . . .
Percentage Columns . . . . . . . . . . . . . . . . .
Detail Display . . . . . . . . . . . . . . . . . . . .
HP GlancePlus Function Keys and Commands . . . . . . .
Online Expert Assistance for Understanding Performance Data
Help Facility (H) . . . . . . . . . . . . . . . . . . . .
.
.
.
.
.
.
.
.
.
.
.
.
.
.
.
3-1
3-1
3-2
3-2
3-3
3-3
3-3
3-4
3-5
3-6
3-7
3-8
3-9
3-12
3-13
.
.
.
.
.
.
.
.
.
.
.
.
.
.
.
.
.
.
.
.
.
.
.
.
.
.
.
.
.
.
Contents-1
Printing a Screen . . . . . . . . . . . . . . . . . . . . .
Setting Process Thresholds . . . . . . . . . . . . . . . . .
3-14
3-15
4. Commands: Additional Information
Overview . . . . . . . . . . . . . . . . . . . .
Selecting Jobs, Sessions, and Processes (>, J, S, P, #)
MPE Command (:) . . . . . . . . . . . . . . .
Refresh Screen (R) . . . . . . . . . . . . . . .
All Processes (A) . . . . . . . . . . . . . . . .
Change Queue (Q) . . . . . . . . . . . . . . .
List Users of a File (U) . . . . . . . . . . . . .
Zero Averages (Z) . . . . . . . . . . . . . . . .
Previous Display (<) . . . . . . . . . . . . . .
Next Logical Display (>) . . . . . . . . . . . .
Ninety-second Timeout on Command Prompts . . .
.
.
.
.
.
.
.
.
.
.
.
.
.
.
.
.
.
.
.
.
.
.
.
.
.
.
.
.
.
.
.
.
.
.
.
.
.
.
.
.
.
.
.
.
4-1
4-1
4-2
4-2
4-2
4-3
4-3
4-4
4-4
4-4
4-4
5. Screen Metrics and Statistics
Global Screen . . . . . . . . . . . . .
Interesting Processes . . . . . . . . .
Interesting Process Components . . . .
Job/Session Screen . . . . . . . . . . .
Job/Session Bars and Summary Fields . .
Interesting Processes . . . . . . . . .
Interesting Process Components . . . .
Process Screen . . . . . . . . . . . . .
Process Bars . . . . . . . . . . . . .
Process Summary Fields . . . . . . . .
Process State Bars . . . . . . . . . .
STATE (Components of Response Time)
LAST (Components of Response Time)
Miscellaneous Process Information . . .
Process Screen Function Keys . . . . .
Setting Option Values (V) . . . . . . .
Simple File Display . . . . . . . . .
Detailed File Display . . . . . . . .
Filter Selection Menu Variables . . . . . .
Filter Display Screen . . . . . . . . . .
Filter Bars . . . . . . . . . . . . . .
.
.
.
.
.
.
.
.
.
.
.
.
.
.
.
.
.
.
.
.
.
.
.
.
.
.
.
.
.
.
.
.
.
.
.
.
.
.
.
.
.
.
.
.
.
.
.
.
.
.
.
.
.
.
.
.
.
.
.
.
.
.
.
.
.
.
.
.
.
.
.
.
.
.
.
.
.
.
.
.
.
.
.
.
5-2
5-2
5-4
5-7
5-8
5-10
5-11
5-13
5-14
5-15
5-16
5-16
5-17
5-17
5-19
5-19
5-21
5-21
5-26
5-29
5-30
Contents-2
.
.
.
.
.
.
.
.
.
.
.
.
.
.
.
.
.
.
.
.
.
.
.
.
.
.
.
.
.
.
.
.
.
.
.
.
.
.
.
.
.
.
.
.
.
.
.
.
.
.
.
.
.
.
.
.
.
.
.
.
.
.
.
.
.
.
.
.
.
.
.
.
.
.
.
.
.
.
.
.
.
.
.
.
.
.
.
.
.
.
.
.
.
.
.
.
.
.
.
.
.
.
.
.
.
CPU Bar . . . . . . . . . .
Disc Bar . . . . . . . . . . .
Summary Fields . . . . . . . .
Filter Processes . . . . . . . . .
Workload Screen . . . . . . . . .
Interesting Applications . . . . .
Interesting Application Fields . .
Top CPU and Disc Consumer . .
CPU Detail Screen . . . . . . . .
Type of Utilization . . . . . . .
Queue Distribution . . . . . . .
Miscellaneous Performance Metrics
Top CPU Consumer . . . . . . .
Disc Detail Screen . . . . . . . .
Individual Disc Utilization . . . .
Summary Disc Utilization . . . .
Top Disc Consumer . . . . . . .
Memory Detail Screen . . . . . . .
Fault Types . . . . . . . . . .
Miscellaneous . . . . . . . . . .
.
.
.
.
.
.
.
.
.
.
.
.
.
.
.
.
.
.
.
.
.
.
.
.
.
.
.
.
.
.
.
.
.
.
.
.
.
.
.
.
.
.
.
.
.
.
.
.
.
.
.
.
.
.
.
.
.
.
.
.
.
.
.
.
.
.
.
.
.
.
.
.
.
.
.
.
.
.
.
.
.
.
.
.
.
.
.
.
.
.
.
.
.
.
.
.
.
.
.
.
.
.
.
.
.
.
.
.
.
.
.
.
.
.
.
.
.
.
.
.
.
.
.
.
.
.
.
.
.
.
.
.
.
.
.
.
.
.
.
.
.
.
.
.
.
.
.
.
.
.
.
.
.
.
.
.
.
.
.
.
5-30
5-30
5-31
5-32
5-34
5-34
5-35
5-36
5-37
5-38
5-39
5-39
5-43
5-44
5-45
5-46
5-46
5-47
5-48
5-49
6. The Expert Facility
Invoking The Expert Facility . . . . .
What Does The Expert Facility Do? . .
Recommendations For Using The Expert
Changing The Expert Facility's Rules .
. . . .
. . . .
Facility
. . . .
.
.
.
.
.
.
.
.
.
.
.
.
.
.
.
.
.
.
.
.
.
.
.
.
.
.
.
.
6-3
6-3
6-7
6-8
7. Customizing HP GlancePlus
Customizing Startup . . . .
Refresh Time . . . . . . .
Selecting the Initial Screen .
Customizing GlancePlus Global
Global CPU Bar . . . . .
Global Memory Bar . . . .
Customizing Conguration . .
Interesting Process Thresholds
Display Control Parameters .
The Expert Parameters . . .
.
.
.
.
.
.
.
.
.
.
.
.
.
.
.
.
.
.
.
.
.
.
.
.
.
.
.
.
.
.
.
.
.
.
.
.
.
.
.
.
.
.
.
.
.
.
.
.
.
.
.
.
.
.
.
.
.
.
.
.
.
.
.
.
.
.
.
.
.
.
.
.
.
.
.
.
.
.
.
.
7-1
7-1
7-1
7-2
7-2
7-3
7-4
7-7
7-11
7-13
. . .
. . .
. . .
Bars
. . .
. . .
. . .
. . .
. . .
. . .
.
.
.
.
.
.
.
.
.
.
.
.
.
.
.
.
.
.
.
.
.
.
.
.
.
.
.
.
.
.
.
.
.
.
.
.
.
.
.
.
.
.
.
.
.
.
.
.
.
.
.
.
.
.
.
.
.
.
.
.
.
.
.
.
.
.
.
.
.
.
.
.
.
.
.
.
.
.
.
.
.
.
.
.
.
.
.
.
.
.
.
.
.
.
.
.
.
.
.
.
.
.
.
.
.
.
.
.
.
.
.
.
.
.
.
.
.
.
.
.
Contents-3
Additional Parameters . . . . . . . .
GlancePlus Conguration File: Security
Conguring the Expert Facility . . . .
Highlighting Metrics . . . . . . . .
Performance Recommendations . . .
.
.
.
.
.
.
.
.
.
.
.
.
.
.
.
.
.
.
.
.
.
.
.
.
.
.
.
.
.
.
.
.
.
.
.
.
.
.
.
.
.
.
.
.
.
.
.
.
.
.
.
.
.
.
.
7-14
7-15
7-15
7-16
7-17
.
.
.
.
.
.
.
.
.
.
.
.
.
.
.
.
.
.
.
.
.
.
.
.
.
.
.
.
.
.
.
.
.
.
.
.
.
.
.
.
.
.
.
.
.
.
.
.
.
.
.
.
.
.
.
.
.
.
.
.
.
.
.
.
.
.
.
.
.
.
.
.
.
.
.
.
.
.
.
.
.
.
.
.
.
.
.
.
D-2
D-4
D-5
D-5
D-5
D-6
D-7
D-7
A. Multiprocessor Systems
B. Wait Reasons|Expanded Denitions
C. Detailed WAIT Reasons
D. Application Denition Files
Application Denition Syntax
FILE . . . . . . . . . .
INTERACTIVE . . . .
BATCH . . . . . . . . .
USER . . . . . . . . . .
QUEUE . . . . . . . . .
OR . . . . . . . . . . .
Sample Application Denition
Index
Contents-4
.
.
.
.
.
.
.
.
.
.
.
.
.
.
.
.
.
.
.
.
.
.
.
.
.
.
.
.
.
.
.
.
Figures
3-1.
3-2.
3-3.
3-4.
3-5.
3-6.
3-7.
5-1.
5-2.
5-3.
5-4.
5-5.
5-6.
5-7.
5-8.
5-9.
5-10.
5-11.
5-12.
5-13.
5-14.
5-15.
5-16.
5-17.
5-18.
5-19.
5-20.
5-21.
5-22.
5-23.
The Global Screen . . . . . . . . . . . . . . . .
The Banner Line . . . . . . . . . . . . . . . . .
Global Bars . . . . . . . . . . . . . . . . . . .
An Example of a Detail Display . . . . . . . . . .
HP GlancePlus Function Keys . . . . . . . . . . .
An Example of the Expert Facility . . . . . . . . .
Setting Process Thresholds . . . . . . . . . . . . .
Global Screen . . . . . . . . . . . . . . . . . .
Global Screen|Interesting Processes . . . . . . . .
Job/Session Screen . . . . . . . . . . . . . . . .
Job/Session Screen|Interesting Processes . . . . . .
Process Screen . . . . . . . . . . . . . . . . . .
Process Screen|Process Bars . . . . . . . . . . .
Process Screen|Process Summary Fields . . . . . .
Process Screen|Process State Bars . . . . . . . . .
Process Screen|Miscellaneous Process Information . .
Process Screen|Screen Function Keys . . . . . . . .
File Display Screen|Detailed Display . . . . . . . .
Filter Screen Selection Dialogue . . . . . . . . . . .
Filter Screen . . . . . . . . . . . . . . . . . . .
Workload Screen . . . . . . . . . . . . . . . . .
CPU Detail Screen . . . . . . . . . . . . . . . .
CPU Detail Screen|Type of Utilization . . . . . . .
CPU Detail Screen|Queue Distribution . . . . . . .
CPU Detail Screen|Miscellaneous Metrics . . . . . .
CPU Detail Screen|Top CPU Consumer . . . . . .
Disc Detail Screen . . . . . . . . . . . . . . . .
Disc Detail Screen|Individual Disc Utilization . . . .
Disc Detail Screen|Summary and Top Disc Consumer
Memory Detail Screen . . . . . . . . . . . . . . .
.
.
.
.
.
.
.
.
.
.
.
.
.
.
.
.
.
.
.
.
.
.
.
.
.
.
.
.
.
.
.
.
.
.
.
.
.
.
.
.
.
.
.
.
.
.
.
.
.
.
.
.
.
.
.
.
.
.
.
.
.
.
.
.
.
.
.
.
.
.
.
.
.
.
.
.
.
.
.
.
.
.
.
.
.
.
.
.
.
.
3-2
3-3
3-3
3-8
3-9
3-12
3-16
5-2
5-3
5-7
5-10
5-13
5-14
5-15
5-16
5-17
5-19
5-21
5-27
5-29
5-34
5-37
5-38
5-39
5-39
5-43
5-44
5-45
5-46
5-47
Contents-5
5-24. Memory Detail Screen|Fault Types . . . . . . . . . . .
5-25. Memory Detail Screen|Miscellaneous Metrics . . . . . . .
6-1. Xpert Overview Screen . . . . . . . . . . . . . . . . .
Contents-6
5-48
5-49
6-4
Tables
3-1.
3-2.
5-1.
5-2.
7-1.
7-2.
7-3.
C-1.
Commands to Access Screens . . . . .
Commands to Access Program Activities
Wait Reasons . . . . . . . . . . . .
Guidelines for Switches to CM or NM .
Changeable Default Parameters . . . .
GlancePlus Highlighting Characteristics
GlancePlus Performance Indicators . .
Detailed WAIT Reasons . . . . . . .
.
.
.
.
.
.
.
.
.
.
.
.
.
.
.
.
.
.
.
.
.
.
.
.
.
.
.
.
.
.
.
.
.
.
.
.
.
.
.
.
.
.
.
.
.
.
.
.
.
.
.
.
.
.
.
.
.
.
.
.
.
.
.
.
.
.
.
.
.
.
.
.
.
.
.
.
.
.
.
.
3-10
3-11
5-6
5-41
7-5
7-16
7-19
C-1
Contents-7
1
Introduction
HP GlancePlus for MPE/iX is an online diagnostic tool that you can use to
monitor system activity and troubleshoot system performance problems.
What HP GlancePlus Can Do For You
HP GlancePlus is easy to install, easy to run, and easy to use. You don't have
to spend time on complicated set-up procedures or training. Anyone can use
HP GlancePlus eectively from day one.
HP GlancePlus is powerful. It gives you a complete picture, highlighting
processes that are starved for resources and those using resources.
HP GlancePlus gives you expert assistance. It uses a comprehensive set of
rules developed by performance specialists to alert you whenever a possible
performance problem arises.
HP GlancePlus is exible. You can customize the software to display and
highlight the data that is most important to you and your system. You won't
have to wade through unnecessary data when dealing with a problem. For
example, you can easily set thresholds so the Global activity screen displays
only processes that exceed your dened limits.
HP GlancePlus provides data at the level of detail you need. You can go from
displaying simple, graphical global data, to displaying technical data, to
displaying detailed process data. By letting you \zoom in" on the data you
need, you won't be overwhelmed with too much or too little data at one time.
HP GlancePlus provides an extensive online help facility developed by
performance experts . Any help you might need to use the product is right at
your ngertips.
Introduction
1-1
How You Can Use HP GlancePlus
You can use HP GlancePlus:
As a diagnostic tool to identify immediate performance problems.
You can easily nd out who or what is slowing your system and identify
particular programs or applications that are CPU or I/O \hogs".
As a monitoring tool to learn about your system.
By routinely checking system activity you can document typical performance
levels and characterize typical system loads. This can make it much easier to
identify unusual performance or potential problems. Having this knowledge
of typical system performance can even help you avoid potential problems
with your systems.
Will You Need Other Performance Tools?
HP GlancePlus is only one member of a family of performance products
oered by Hewlett-Packard. If you need to go beyond immediate performance
monitoring, you may wish to consider other members of this family:
HP GlancePlus Pak for MPE/iX combines GlancePlus with the ability to log
data for analysis by programs on the HP 3000 or by spreadsheet packages on
a personal computer.
HP LaserRX/MPE logs data similar to HP GlancePlus Pak for MPE/iX
but also contains a powerful performance data analysis tool. It organizes
R
and categorizes raw performance data into easy-to-use Microsoft TM
Windows -based graphs and charts that can be displayed on a PC. You use
a highly ecient hierarchical approach to analysis, looking at data from the
global to detail level.
HP RXForecast/MPE forecasts future resource utilization based on
actual past history. This tool helps you plan future resource requirements
and can help you avoid periods of insucient resources. (It requires HP
LaserRX/MPE as a companion program.)
HP SPT/XL helps you optimize native mode programs.
1-2
Introduction
How to Use This Manual
This manual will help you get maximum value from HP GlancePlus.
Depending on your needs and previous experience, you can consult the
following chapters for specic information:
Chapter 2 for information on installing HP GlancePlus.
Chapter 3 for information on the general features of the program.
Chapter 4 for additional information on commands.
Chapter 5 to learn about the statistics appearing on each screen.
Chapter 6 to nd out about the Expert facility.
Chapter 7 for information on customizing HP GlancePlus.
The appendixes contain additional information, such as expanded denitions of
wait reasons.
HP GlancePlus also provides online help information as discussed in chapter 3.
This online help information is context sensitive and can be accessed using the
\H" command.
Introduction
1-3
2
Installation
System Requirements
HP GlancePlus for MPE/iX can be used on any HP 3000 Precision
Architecture system using the MPE/XL operating system, version 2.1 (or
later), or the MPE/iX operating system.
Terminal and PC Requirements
HP GlancePlus runs on the following terminals and personal computers:
HP Vectra personal computer (running HP-compatible terminal-emulation
software).
HP 150 personal computer.
HP 700/9x family.
HP 239x family.
HP 262x family.
Installation
2-1
Installing HP GlancePlus
Installing GlancePlus is a simple process. It involves placing the appropriate
les in a group with the necessary capabilities.
Group Capabilities
HP GlancePlus should be placed in a group that allows all system users easy
access to the program. Normally this group is PUB.SYS.
The group must have the following capabilities:
Interactive access (IA).
Process handling (PH).
Extra data segments (DS).
Privileged mode (PM).
Group Access
A user must have read, lock, and execute access to the GlancePlus les
before running it. Since GlancePlus is usually installed in PUB.SYS, all users
typically would have the required access.
Installing the Program
Usually, HP GlancePlus is installed automatically through the MPE/iX
AUTOINST process.
To customize the use of GlancePlus, activate the GlancePlus UDC
(user-dened command) le as follows:
Move the user-dened command GLANCE from the GLANUDCX le to the
desired UDC le and activate it.
or
Activate the HP GlancePlus UDC le and type the following:
:SETCATALOG GLANUDCX
2-2
Installation
3
Getting Started
Overview
This chapter shows you how easy it is to use the HP GlancePlus program. You
will learn how to run the program, display a screen, move to other screens, get
help, print screens, exit the program, and use the single-letter commands to
invoke GlancePlus's various tasks.
Running HP GlancePlus for MPE/iX
To execute the program,
Type:
:GLANCEXL.PUB.SYS
If you have activated the HP GlancePlus UDC le, type:
:GLANCE
When you become familiar with GlancePlus, you may want to customize
the GlancePlus startup procedure. Chapter 7 contains information on
customizing the GlancePlus startup procedure.
Getting Started
3-1
Exiting HP GlancePlus
To exit the program at any time:
Press 4E5 or 4F85 from any screen except an online help screen.
More Than a Look|The HP GlancePlus Global Screen
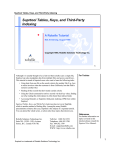
The Global screen (gure 3-1) is the rst screen that appears when you start
GlancePlus. This screen gives you much information in an easy-to-read display.
It provides a global, systemwide summary of how resources are being used by
active processes.
Figure 3-1. The Global Screen
You can access other GlancePlus screens using the softkeys (dedicated function
keys) or single-letter commands described later in this chapter.
3-2
Getting Started
Reading the Screen Display
Although all GlancePlus screens appear similar, they carry dierent
information about system resources. Each screen is divided into four sections|
Banner Line, Global Bars, Detail Display, and Function Keys. The Banner
Line and Global Bars present the same information on every screen, whereas
the Detail Display section diers from screen to screen.
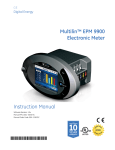
Banner Line
The Banner Line at the top of the screen contains information on the version
of the product, product name, current time (hour:minute:second), and screen
identier (gure 3-2). The screen identier may contain information pertinent
to the particular screen, such as the particular job number in the Job screen.
Figure 3-2. The Banner Line
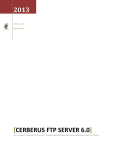
Global Bars
Three Global Bars appear directly below the Banner Line (gure 3-3). These
bars, and the percentages listed to the right of them, show the system's use of
three resources: CPU, Disc, and Memory. The bars are present on every screen
to help you keep track of the overall \global" picture. The letters superimposed
on each bar specify how that portion of the resource is being used.
Figure 3-3. Global Bars
Getting Started
3-3
CPU Bar
The CPU bar shows how much of the central processing unit's time was spent
on various activities during the last interval. The current, average, and highest
percentages are displayed numerically to the right of the bar. The length of
the bar indicates the percentage of CPU time used or time that could be used
if pending disc I/Os were satised during the current interval. Paused for disc
is not included in these numbers since the CPU is inactive during this time
because of pending disc transfers. (Scale: 0 to 100 percent.)
The components of the CPU bar are as follows:
M MPE/iX functions such as memory management,
interrupt handling, and deciding which process
uses the CPU
S System processes such as data communication monitors
and spoolers
I Interactive (session) processes
B Batch (job) processes
P Paused for disc (no CPU is used but Disc I/O is
occurring)
3 Average usage of this resource during this execution of
GlancePlus (not including Paused for Disc).
Note
3-4
The CPU bar may be congured to show activity by queue,
which changes the above components. Chapter 7 contains
information on customizing the GlancePlus global bars.
Getting Started
Disc Bar
The Disc bar shows the rate of disc transfers that occurred on the system
during the last interval. The current, average, and highest number of transfers
per second are shown numerically to the right of the bar. The length of the bar
indicates the total number of transfers per second occurring currently. (Scale:
0 to 100 physical transfers per second.)
The components of the Disc bar are as follows:
M Memory management transfers (swapping)
S System process transfers (data communication monitors
and spoolers)
I Interactive (session) process transfers
B Batch (job) process transfers
3 Average usage of this resource during this execution
of GlancePlus.
Getting Started
3-5
Memory Bar
This bar represents the amount of main Memory in current use as a
percentage. The current, average, and highest percentages of main Memory use
are displayed to the right of the bar. The length of the bar indicates the total
amount of main Memory that is currently being used.
Note
It is normal for main Memory to be full even when there is
little activity on the system.
Components of the Memory bar show how much Memory is being used for
dierent purposes. The Memory bar components are as follows:
M Resident MPE (operating system code and data are
not swapable)
C Code (both native and compatibility-mode programs
and libraries)
S Stacks (both native and compatibility-mode program
data stacks)
D Data objects (certain system data structures and
compatibility-mode data segments)
F Files (data les such as TurboIMAGE data sets, KSAM
key and data les, and normal MPE les)
3 Average usage of this resource during this execution
of GlancePlus.
A particular category will not be displayed if there is insucient Memory usage
to occupy one character space on the screen.
3-6
Getting Started
Note
The Memory bar may be congured to show fault rates, which
changes the above components. Chapter 7 contains information
on customizing the GlancePlus global bars.
Percentage Columns
The percentage columns at the right of the global bars (gure 3-3) show
current, average, and highest use of each system resource. Current value
represents use for the current interval. Average is the mean value of all usage
data collected since the present monitoring session began. High value shows
the single highest usage amount of that resource during the monitoring session.
If you reset the statistics to zero with the Zero Averages command (4Z5), the
current value will still represent current usage for each interval, but subsequent
average and high values will represent data collected since the resetting.
Note
Upon entry to GlancePlus, the rst global screen will show
GLANCEXL using a high percentage of CPU. This is normal
since the program must take two data samples within a few
seconds of each other in order to display the rst Global screen.
At the default 30-second interval, CPU usage is typically low
and should cause no problems on your system. CPU overhead
used by GlancePlus is proportional to the frequency of screen
update and the number of processes on the system. You can
cause excessive CPU overhead by pressing a key every few
seconds.
Getting Started
3-7
Detail Display
The information presented in the detail display portion of the screen below the
global bars depends on the type of screen (gure 3-4).
Figure 3-4. An Example of a Detail Display
Some screens show a summary of processes, such as the Global, Job/Session,
and Filter screens. Interesting applications are scrolled down as new entries are
added to the top of the listing to keep the latest information just below the
Global bars. The process information for the most current interval is displayed
at the top of the detail area immediately below the global bars. You can use
terminal memory to scroll back to process data from previous intervals.
Other screens show statistics for an individual resource or individual process.
These screens refresh the detail display at every interval. Examples of this type
of screen include the CPU, Disc, Memory, and Process screens.
The Filter Select and Set Option Values screens help you set parameters. Their
detail display is a table of value settings followed by a prompt you can use
to change a value. Every time you change a value, a new, adjusted table of
values is displayed below the previous one until you terminate the dialogue by
pressing 4Return5.
3-8
Getting Started
On many systems, it could take several screens full of data to display all
currently-running processes. Evaluating that much information could be
confusing. To avoid this, GlancePlus lets you limit the processes displayed
to those that are interesting to you|processes that surpass predetermined
threshold-usage values. Interesting processes either use a major portion of the
system's resources or must wait exceptionally long to use them, and are the
processes most likely to reect an existing or potential problem. The procedure
for setting process thresholds is described at the end of this chapter.
The Global screen is the starting point for most performance analysis activity.
Other GlancePlus screens are discussed individually in chapter 5.
HP GlancePlus Function Keys and Commands
To make it easy to select screens or functions, GlancePlus displays a row
of function-key labels across the bottom of each screen. These labels, also
called softkeys, correspond to function keys 4F15 through 4F85 on your terminal
keyboard.
Figure 3-5. HP GlancePlus Function Keys
You can also access all of GlancePlus's functionality using the single-letter
commands shown in tables 3-1 and 3-2 (see pages 3-10 and 3-11).
To avoid confusion, function keys perform the same actions on all GlancePlus
screens. To maintain this consistency, some screens or functions can be selected
only by using their single-letter commands. The command abbreviations, such
as C for CPU screen and D for Disc screen, are intuitive and easy to remember.
For a quick reminder, simply enter H or press the Help softkey, then press C at
the next prompt to indicate you want a quick list of the available commands.
Additional information about commands is presented in chapter 4.
Getting Started
3-9
Table 3-1. Commands to Access Screens
Command
Name
Command
Character
CPU Detail
C
4D5
4F5
4G5
4H5
4J5
Disc Detail
Filter
Global
Help
Select Job
Displays Disc Detail screen.
Displays Filter screen.
F1
4F75
4 5
Displays Global screen.
Enters Help facility.
Selects particular job to be displayed in
detail on the Job/Session screen.
M
Displays Memory Detail screen.
4 5
O
Displays Expert Overview of system
bottlenecks. Note: The 4X5 key is the
command character for the Xpert Analysis
command.
4 5
P
Selects particular process to be displayed in
detail on the Process screen.
4 5
S
Selects particular session to be displayed in
detail on the Job/Session screen.
W
4#5
Displays Workload screen.
4 5
Xpert
Overview
Select
Process
Select
Session
Workload
4 5
F2
4 5
Selects job/session/process to monitor.
<
Displays screen that was last active before
entering current display.
>
Displays next logical screen, that is, the top
resource consumer. See chapter 4.
Previous
Display
4 5
Next Logical
Display
4 5
3-10
Action
Displays CPU Detail screen.
4 5
Memory
Detail
Select
Function
Key
Getting Started
Table 3-2. Commands to Access Program Activities
Command
Name
Command
Character
All
Processes
4 5
Exit
Glance
4 5
E
4 5
Print
4 5
L
4 5
Change
Queue
4 5
Refresh
Screen
4 5
R
4 5
T or 4I5
4 5
Time
Adjust
A
4 5
F8
Terminates program.
F3
Toggles continuous printing on or o for the
line printer (LP).
Changes queue or priority of a given job,
session, or process.
F6
Clears and displays an updated screen.
F5
Changes refresh time or interval.
U
4V5
Lists users of a le.
X
Displays Expert Analysis.
Z
Resets averages to zero and recomputes
them beginning with the current interval.
4 5
Set Option
Values
Xpert
Analysis
4 5
Zero
Averages
4 5
MPE
Command
45
:
Ctrl5+4Y5
4Ctrl5+4S5
4Ctrl5+4Q5
4Enter5 or
4Space Bar5
4
Action
Displays detail data for all processes or
applications rather than only interesting
processes or applications.
Q
Users
Update
Display
Function
Key
Displays current option values and allows
you to change them.
F4
4 5
Allows you to enter an MPE command.
Terminates command display.
Stops scrolling of screen display.
Resumes scrolling of screen display.
Updates display immediately.
Getting Started
3-11
Online Expert Assistance for Understanding
Performance Data
Now that you're familiar with the Global screen and have an idea of how
to display performance statistics, you may wonder how you can get help
understanding what the data means? All you need to do is use the Expert
facility in GlancePlus.
It provides expert assistance online by a comprehensive set of rules developed
by performance experts to alert you whenever a possible performance problem
arises.
You can set an option to get expert assistance continuously or only when you
request it using by typing the X command. Refer to chapter 6 for details on the
Expert facility.
Figure 3-6. An Example of the Expert Facility
3-12
Getting Started
Help Facility (H)
You can access the GlancePlus Help facility in three ways. Enter the H
command character, press the Help softkey, or enter a question mark (?). A
prompt will ask if you want to see a list of available commands, access help
specic to the current screen, or access general help.
NNNNNNNNNNNNNN
If you request a list of commands or help specic to the current screen, you will
be returned to GlancePlus when you nish that topic and press 4Return5.
Select general help if you want to get help on more than one topic. A menu
will be displayed, followed by a greater than (>) prompt. Then, you can enter
any of the following:
Any menu item. For example, you can enter XPERT to nd out about the
GlancePlus Expert facility.
A menu item and a key word. For example, you can enter PROCESS,STATE
to produce a listing of the codes that may appear in the process STATE bar.
Menu to display the Help facility menu.
Help to display the Help facility instructions.
Exit or E to terminate the Help Facility.
If you access Help and the softkey feature of GlancePlus is enabled, a base set
of softkeys will be loaded. These base keys will allow you to move directly to
Help menus for the four most popular screens, or to access additional general
Help commands. You can access the following:
4F15 Global screen Help.
4F25 Job screen Help.
4F35 Session screen Help.
4F45 Process screen Help.
4F55 GlancePlus commands.
4F65 Main Help menu.
4F75 Help (on Help).
4F85 Exit Help and return to GlancePlus processing.
Getting Started
3-13
If you press 4Return5 while in the Help Menu, Help displays information up
to the next key word or command. For example, after you enter SESSION,
Help displays the overall format of the Session screen and a list of key words
associated with it (CPU, DISC, TOTALS, PROCESS). If you press 4Return5,
Help displays the CPU topic for Session. If you press 4Return5 again (after the
prompt), Help displays the Disc information for Session and so on. (This is
similar to turning pages in a manual.)
Printing a Screen
The Print facility provides a default formal designator for the print command|
the le is GLANCELP. The default device class is LP. Once enabled, the Print
facility prints each screen as it is updated.
To print, press:
xxxxxxxxxxxxxxxxxxxxxxxxxx
Print *
The softkey changes to:
xxxxxxxxxxxxxxxxxxxxxxxxxx
Print *
Enabled
And the following message appears:
Printing is now enabled
When printing is enabled, a hard copy will be printed each time the screen
updates and will continue to be printed if you select a new screen.
To disable the Print Facility, press:
xxxxxxxxxxxxxxxxxxxxxxxxxx
Print *
Enabled
The following message appears:
Printing is now disabled
The spool le is released to print.
3-14
Getting Started
To change the default device,
Use the MPE (:) command to enter a le equation:
:FILE GLANCELP;DEV=[device]
The default option, CCTL, will print one screen per page.
To save paper by printing contiguously,
Add the NOCCTL option to the le equation:
:FILE GLANCELP;DEV=LP;NOCCTL
Setting Process Thresholds
Once you are familiar with GlancePlus, you may want to customize the Global
screen to focus attention on the data most important to you and your system
environment. For example, if a 4-second response time is acceptable and
a 5-second response time is unacceptable, you would want to see processes
receiving 5-second or longer response times highlighted on the Global screen.
Processes exceeding a given level or threshold, as in the example above, are
called interesting .
A process can be interesting for these reasons:
It uses a large amount of system resources.
It must wait an exceptionally long time to use a system resource.
It is newly created.
It was terminated during the last interval.
These interesting processes are displayed on the Global screen. Some of these
interesting processes might be highlighted. Highlighting is used to indicate a
process that exceeds some higher threshold value. For example, you may want
all processes exceeding 1% of the CPU displayed and processes using more
than 10% of the CPU highlighted. On color monitors, highlighting is in color;
otherwise, highlighted items are underlined.
The power of GlancePlus lies in its ability to focus your attention on the
pertinent data. A good rule of thumb is to set your process thresholds so that
Getting Started
3-15
the number of interesting processes does not exceed the capacity of a single
screen for an interval. You also want to set them appropriate to your system
environment.
Use the Set Option Values (V) command to set process thresholds. Figure 3-6
shows the display resulting from the Set Option Values (V) command. The
values in the left-hand and center columns are thresholds that determine which
processes are interesting.
Figure 3-7. Setting Process Thresholds
In this example, GlancePlus displays any process that uses more than 1.0%
of the CPU during the current interval, and will display and highlight any
process that uses more than 10% CPU, more than 10 physical disc transfers
per second, receives an average response time larger than 5 seconds, performs
more than 10 terminal transactions (that is pressing 4Return5 or 4Enter5) per
minute, is newly created, or dies (terminates) during the current interval. The
center column of thresholds causes GlancePlus to display and highlight any
process that waited longer than 50% of the interval time for impedes, CPU,
disc, or memory.
To change a threshold, type in its keyword followed by a space or an equal
sign and the new value. To save keystrokes, you need only type in enough
characters to make the keyword unique. Typing either C 8 or CPU 8 would set
the CPU threshold to 8%. For keywords with two value choices, such as NEW =
YES/no, simply typing the keyword (such as NEW or N) will toggle the value to
the other choice. The capitalized value is the current selection.
3-16
Getting Started
Dierent situations will require dierent thresholds, and every system is
unique. It is worthwhile taking time to become familiar with the Process
Thresholds Denition screen and to determine which thresholds provide you
with the best information on your system. Once you have determined the
optimal settings for your thresholds, you can have GlancePlus default to your
custom values every time you run it (see chapter 7).
Getting Started
3-17
4
Commands: Additional Information
Overview
This chapter provides additional information to help you understand how
certain HP GlancePlus commands function.
Selecting Jobs, Sessions, and Processes (>, J, S, P, #)
There are three methods to select the job, session, or process you want to
monitor.
The rst method uses the Next Logical Display command character (>) to
zoom in, with a single keystroke, on the process that consumed the most
resource during the last interval. You cannot use it to select a job or session.
For example, if you are displaying the Global or CPU Detail screen, this
command will take you to the Process screen of the highest CPU consumer. If
you are displaying the Filter screen, you will go to the Process screen of the
highest CPU consumer in the group of processes you are monitoring. If you
are displaying the Disc Detail screen, you will go to the Process Screen of the
highest Disc Consumer. It provides you with a guided-analysis capability that
lets you quickly pinpoint and analyze the top resource consumer.
A second method uses the J, S, or P command character to select the job,
session, or process to monitor. For example, if you enter an S, GlancePlus will
prompt you for a session number. When you enter a valid session number, the
Session screen will be displayed with information about the requested session.
These three commands|J, S, and P|are mnemonic and require a single
keystroke.
A third method uses the Select softkey or the # command character. Once
the appropriate identier and its number are entered, the screen changes to
show the details of a single job, session, or process. Batch jobs and sessions
are identied by the letter J or S followed by their job or session number
Commands: Additional Information
4-1
(Jnnnn or Snnnn ). Processes are identied by the letter P followed by a process
identication number or PIN (Pnnn ). This method has the advantage of being
available through a softkey. It also gives you the capability to select operating
system processes (those not attached to a job or session) by entering SYS when
prompted for a job, session, or process number.
If no process matching the selection criteria can be found, the user is returned
to the Global screen. For example, if you are monitoring a batch job that
terminates, GlancePlus returns to the Global screen automatically.
MPE Command (:)
Use this command to enter a single command to be executed by MPE. This
includes MPE, UDC, RUN, and implied RUN commands. The HP GlancePlus
screen is suspended until the command completes and you press 4Return5 or
4Enter5.
Hint
You can issue subsequent commands after a single command
is completed by simply entering a colon (:) in response to
the prompt: Press RETURN to continue (or Enter a GLANCE
command):.
Refresh Screen (R)
Use this command to clear the current display and redraw it with updated
information for the current interval. It is useful for solving the problem of a
corrupted display by refreshing the display completely.
All Processes (A)
Use this command to produce a one-time screen display that lists all processes
or applications, not just those that are interesting . It can be used with the
Global, Job/Session, Workload, and Filter screens. Following the All Processes
display, the screen returns to its previous method of displaying only interesting
processes.
4-2
Commands: Additional Information
Change Queue (Q)
Use this command, if you have sucient capability, to change the queue of a
specic process or of all the processes associated with a specic job or session.
A user with system manager (SM) capability can also change a process, or all
the processes belonging to a job or session, to or from the B subqueue (BS).
At the Enter new queue . . . prompt, an SM user can enter a specic number
to set the priority at any number between 100 and 255, or enter B to set the
priority at 100.
The system manager can limit the use of this command to certain user
capabilities by modifying the GlancePlus conguration le. See chapter 7 for
information about customizing GlancePlus.
The priority of a process (or process-related job/session) in a circular queue
is placed initially at the base of the chosen queue and will vary within the
queue limits. The priority of a process in a linear queue remains constant.
Furthermore, a linear queue process will not relinquish the CPU for processes
with lower priorities unless it must wait for another resource.
Caution
Misuse of this command can degrade system operating
eciency signicantly.
List Users of a File (U)
Use this command to check the current le users on the system. Press U to
initiate an on-screen request for the FILE.GROUP.ACCOUNT information for
a particular MPE le. Based on that information, all users of the specied le
are listed by process identication number (PIN), user logon, job or session
number, and logical device number (Ldev). For example, this can be used to
identify all users of a program le you want to replace.
Note
MPE message les are not supported because of the special
type of control blocks that govern access to them.
Commands: Additional Information
4-3
Zero Averages (Z)
Use this command to reset the averages for CPU, Disc, and Memory to zero
and recompute them beginning with the current interval values. These averages
are shown on the screen in the column labeled avg and as an asterisk (3) in the
horizontal bars.
Previous Display (<)
Use this command to return immediately to the display that was last active
before you entered the current display. For example, if you examine a job
on the Job screen then move to the Process screen for an in-depth look at a
specic process, you can use the Previous Display (<) command to return to
the Job screen.
Next Logical Display (>)
Use this command to move to the next logical display based on your current
display. As discussed earlier in this chapter, the Next Display command
provides a guided analysis capability you can use to zoom from the Global,
CPU Detail, Disc Detail, or Filter screen to the Process Detail screen of the
top consumer of resources. You can also use it to zoom from the Workload
screen to the Filter screen to examine the group of application programs that
consumed the most CPU during the last interval. The Next Display command
is only valid when issued while one of the screens mentioned above is the
current screen.
Ninety-second Timeout on Command Prompts
Some commands issue a prompt and wait for your response. Examples are
the Set Option Values command and the MPE command. A ninety-second
timeout is in eect for all GlancePlus prompts to insure that you do not get
an excessive number of interesting processes due to a large time interval when
the next screen is displayed. If you do not respond to a prompt in 90 seconds,
GlancePlus will move you to the next screen or prompt.
There are two exceptions. When you are in the Help subsystem or in the
midst of executing an MPE command, GlancePlus does not have control of the
terminal. Therefore, it cannot initiate a time out. It is recommended that you
limit your time in these areas to a few minutes.
4-4
Commands: Additional Information
5
Screen Metrics and Statistics
HP GlancePlus for MPE/iX provides dierent levels of performance analysis.
You can use the statistics on the Global screen to monitor systemwide activity,
or you can refer to the detailed data screens to focus on specic areas of system
usage.
This chapter describes the metrics and statistics presented on the detailed
data screens. The discussion for each screen focuses on the Screen Elements
display|the detailed data area of the screen. The Screen Elements display
diers for every GlancePlus screen.
The Banner line, and Global bars are the same for every detailed data screen
and are discussed in chapter 3.
The following detailed data screens are described in this chapter.
Global screen.
Job/Session screen.
Process screen.
Filter screen.
Workload screen.
CPU Detail screen.
Disc Detail screen.
Memory Detail screen.
Screen Metrics and Statistics
5-1
Global Screen
This screen summarizes activity systemwide and lists all processes that exceed
the usage thresholds for the system (gure 5-1). The Global screen is the rst
screen to appear when you start GlancePlus, unless you have specied an INFO
string in the RUN command to call up another screen (see chapter 7).
This Global screen is the usual starting point for a review of system activity
and performance. The information on this screen will tell you if a resource is
used excessively or a process is monopolizing available resources.
Figure 5-1. Global Screen
Interesting Processes
Only processes that you dene as interesting are displayed on the Global
screen. This allows you to concentrate on processes most likely to aect
performance. A process can be interesting if it exceeds a user-dened threshold
value, it was just created, or it was terminated during the last interval.
5-2
Screen Metrics and Statistics
Interesting processes are scrolled down as new entries are added. This keeps
the latest information at the top of the list below the Global bars. You can
scroll the terminal display to examine previous processes and intervals again. A
blank line separates each group of process information from the group that was
displayed during the previous time interval.
Figure 5-2. Global Screen|Interesting Processes
Some interesting processes will have highlighted elds to indicate an event
that might require closer attention. These appear in a dierent color or are
underlined on your screen, depending on the type of monitor (see gure 5-2 for
examples of highlighted processes).
You can use the Set Option Values (V) command to change the threshold
values of events to cause a process to become interesting or have one of its
elds highlighted. You can also change the threshold values before entering
GlancePlus by setting the appropriate job control words (JCWs). See chapter 7
for more information on customizing GlancePlus.
Screen Metrics and Statistics
5-3
Interesting Process Components
Each interesting process occupies a single line on the Global screen. The
components of interesting processes and any applicable reasons for highlighting
are as follows:
JSNO
DEV
LOGON
PIN
PROGRAM
JSNO is the job number (#Jnnnn ), session number (#Snnnn )
or process identication number (#Pnnn ) for the process.
DEV is the logical device number for a job or session. If the job
or session is a system process, DEV is displayed as SYS.
LOGON is the rst 22 characters of the logon string
(jobsessionname,user.account).
PIN is the process identication number for the process.
PROGRAM refers to the name of the program being run. If the
program is the MPE/iX Command Interpreter (CI), then this
eld displays a colon (:) followed by the rst characters of the
last CI command issued. However, depending on your assigned
capabilities, the following might apply:
SM (System Manager) capability will show the last CI
command for all users systemwide.
AM (Account Manager) capability will show the last CI
command for all users within that account.
A user with neither SM nor AM capabilities will be shown
only his or her last CI command. All other Command
Interpreters will show CI as the program name.
The program name of a new process is highlighted, and an
asterisk (3) is located between the PIN and PROGRAM
columns.
PRI
5-4
A terminating process is represented by the word DIED,
highlighted in the priority (PRI) eld.
PRI is the execution queue (where: A=AS, B=BS, C=CS,
D=DS, E=ES) followed by the current execution priority
number of the process (1-255). If a process has just terminated,
this eld will contain the word DIED.
Screen Metrics and Statistics
CPU%
DISC
TRN
RESP
WAIT
CPU% is the percentage of the central processing unit used by
this process during the last interval.
The CPU eld is highlighted if the process exceeds the CPU
threshold. The default is 10 percent of the CPU.
DISC is the disc transfer rate (transfers per second) for this
process during the last interval.
The DISC eld is highlighted if the process exceeds the disc
transfer threshold. The default is 10 disc transfers per second.
TRN is the rate per minute at which the 4Return5 or 4Enter5 key
was pressed during the last interval. Transactions with think
times less than 0. 2 second are not counted since they probably
represent hardware status replies. The number of transactions is
0 for most batch jobs because generally they do not read from
terminals.
The TRN eld is highlighted if the process exceeds the terminal
transaction threshold. The default is 10 transactions per minute.
RESP is the average time from when the 4Return5 or 4Enter5 key is
pressed until the computer is ready to accept more input. This
includes the time for the process to do all the work requested by
the user, write out all the characters in response to the request,
and issue the next read to the terminal. This number is 0.0 if
there were no transactions during the last interval.
The RESP eld is highlighted if the response time exceeds the
response time threshold. The default is 5.0 seconds.
WAIT is the reason a process was waiting at the end of the last
interval.
For a list of WAIT reasons, see table 5-1 and appendix B, \Wait
Reasons|Expanded Denitions."
Screen Metrics and Statistics
5-5
Table 5-1. Wait Reasons
Wait
5-6
Denition
BREK
Waiting to be resumed from a program BREAK.
CONS
Waiting for reply to a console request.
CPU
Waiting for CPU resources.
DBMS
Waiting for SQL monitor.
DISC
Waiting for disc I/O.
FATH
Waiting for father.
IMP
Waiting impeded.
I/O
Waiting for nondisc, nonterminal read I/O.
MEM
Waiting for memory swap.
MISC
Waiting for miscellaneous reason.
MSG
Waiting for user or system message.
OTHR
Waiting for other unknown reasons.
PAUS
Waiting for requested time period to expire.
RIN
Waiting for shared resource, such as a le lock.
SEM
Waiting for software semaphore.
SIR
Waiting for critical system resource.
SON
Waiting for son.
TERM
Waiting for terminal read to complete.
Screen Metrics and Statistics
Job/Session Screen
If you select a specic job or session (using the #, J, or S commands), the
Job/Session screen appears containing information about how the job or session
is utilizing system resources. The job or session number is displayed in the
Banner Line as part of the screen identier. You may also select all system
processes that do not belong to any job or session by using the # command
and specifying SYS at the prompt. In this case, System Processes will display
as the screen identier. The Job/Session screen can be used to track the
resource usage of several programs that execute in a job without having to
change screens. It is shown below.
The detailed data area of the display is divided into two parts:
Job/Session Bars and Summary Fields.
Interesting Processes.
Figure 5-3. Job/Session Screen
Screen Metrics and Statistics
5-7
Job/Session Bars and Summary Fields
The Job/Session Bars appear below the Global bars (CPU, Disc, and Memory)
and show additional information about how the selected job or session is using
CPU and Disc resources.
The Job/Session Bars and Summary Fields contain the following information:
CPU
DISC
This CPU bar shows the percentage of central processing unit
time used by the job or session during the last interval. The
codes in this bar correspond to the codes used in the Global
CPU bar (see CPU Bars under \Reading the Screen Display" in
chapter 3). The number at the right of the bar is the percentage
of time the CPU is busy (not counting idle and paused-for-disc
time).
An asterisk (3) represents the average usage of this resource
during this execution of HP GlancePlus. You can use the Z
command to reset the averages to zero and recompute them
beginning with the current interval values.
This bar shows the job or session's disc transfer rate (transfers
per second) during the interval. The codes in this bar
correspond to the codes used in the Global Disc bar (see \Disc"
under \Global Screen" earlier in this chapter). The overall
transfer rate appears at the right of the bar.
An asterisk (3) represents the average usage of this resource
during this execution of HP GlancePlus. You can use the Z
command to reset the averages to zero and recompute them
beginning with the current interval values.
5-8
Screen Metrics and Statistics
COUNT
LOGON
ELAPSED
CPU-TOT
DISC-TOT
Note
The count (in parentheses) is the number of processes associated
with the current job or session. There are four processes shown
in the previous example.
LOGON is the logon string (jobsessionname,user.account). The
logon string in the previous example is \DIANNE.EVAL".
ELAPSED is the total clock time during which a job or session
has been logged on.
CPU{TOT is the total amount of processor time used during
the life of the job or session (see note).
DISC{TOT is the total number of physical Disc transfers
completed during the life of the job or session (see note). A
number followed by the letter K represents thousands of
transfers; a number followed by the letter M represents millions
of transfers.
Disc totals are not collected until either HP GlancePlus or
another performance tool enables the MPE measurement
facility to collect process data. This means that the DISC-TOT
value will not include physical transfers that were completed by
a process before the MPE measurement facility was enabled.
Upon entry to the Job/Session screen, CPU-TOT and
DISC-TOT values represent CPU and disc totals for the
processes, associated with the job or session, that are still
alive. To prevent these values from decrementing as processes
terminate, HP GlancePlus maintains counters for the job or
session as long as it is monitored in the Job/Session screen.
These counters are lost as soon as you enter another screen or
select a dierent job or session.
Screen Metrics and Statistics
5-9
Interesting Processes
Interesting processes related to the job or session you select appear below the
Job/Session Bars and Summary Fields. In addition, you can use the SYS
option of the Select command to display all system processes not related to a
job or session.
Figure 5-4. Job/Session Screen|Interesting Processes
Interesting Job or Processes belonging to this Job (#Jnnnn) or Session
Session Processes (#Snnnn) are considered interesting here for the same reasons
as in the Global screen (see \Interesting Processes" under
\Global Screen" earlier in this chapter). Any job or session
process that is not waiting for another process (father-, son-,
or message-waited) will also be displayed.
For example, the screen will display the command interpreter
(CI) process for a job or session at the top of the Interesting
Processes section of the screen. If a son process starts
running, both processes will be displayed while both are
running. If the CI process must wait for the son process to
complete, the CI will disappear from the screen during the
wait interval, but it will return when the wait period ends.
5-10
Screen Metrics and Statistics
This allows you to see the most interesting part of a job or
session without having to manually track the process numbers
as they are created and terminated.
You can see all processes belonging to the job or session by
entering the A command.
Interesting System Use the Select command's SYS option to display only system
Processes
processes that do not belong to a specic job or session. Since
there are usually many of these processes left in dierent
waiting states, system processes will only be displayed if they
are \interesting" (see \Interesting Processes" under \Global
Screen" earlier in this chapter).
You can see all system processes by entering the A command.
Interesting Process Components
Each process related to the job or session is displayed in a single line.
The following components make up a line of interesting process data:
PIN
PROGRAM
PRI
CPU%
DISC
PIN is the process identication number for the process.
PROGRAM refers to the name of the program being run. If the
program is the MPE Command Interpreter (CI), then this eld
displays a colon (:) followed by the rst characters of the last
CI command issued.
PRI is the execution queue (where: A=AS, B=BS, C=CS,
D=DS, E=ES) followed by the absolute execution priority
number of the process (1-255). If a process has just terminated,
then this eld will contain the word DIED.
CPU% is the percentage of the central processing unit used by
this process during the last interval.
DISC is the disc transfer rate (transfers per second) for this
process during the last interval.
Screen Metrics and Statistics
5-11
TRN
RESP
WAIT
ELAPSED
CPU-TOT
DISC-TOT
P-PIN
Note
5-12
TRN is the rate at which the 4Return5 or 4Enter5 key was pressed
during the last interval. A rate is displayed to maintain
independence from the time interval; thus, one transaction in a
30-second interval equates to a rate of 2 transactions per
minute. The number of transactions is 0 for most batch jobs
because generally they do not read from terminals.
RESP is the average time (in seconds) between when the 4Return5
or 4Enter5 key was pressed and the computer was ready to accept
more input. This number is 0.0 if there were no transactions
during the last interval.
WAIT is the reason a process was waiting at the end of the last
interval. See table 5-1 for denitions of wait reasons and
appendix B, \Wait Reasons|Expanded Denitions." More
detailed Wait reasons are dened for the Process screen (see
appendix C).
ELAPSED is the length of time a process was alive.
CPU{TOT is the amount of CPU time used during the life of
the process.
DISC{TOT is the total number of physical disc transfers
completed during the life of the process. A number followed by
the letter K represents thousands of transfers; a number followed
by the letter M represents millions of transfers.
PIN is the process identication number for the parent (or
father) of this process.
Disc totals are not collected until either HP GlancePlus or
another performance tool enables the MPE measurement
facility to collect process data. This means that the DISC-TOT
value will not include physical transfers that were completed by
a process before the MPE measurement facility was enabled.
Screen Metrics and Statistics
Process Screen
If you select a specic process (using the #, P, or > commands), the Process
screen appears containing information about that process. The Banner Line
includes the PIN number and job or session number for the process as part of
the screen identier. The detailed data area of the display is divided into ve
parts:
Process Bars.
Process Summary Fields.
Process States.
Miscellaneous Process Information.
Process Screen Function Keys.
Figure 5-5. Process Screen
Screen Metrics and Statistics
5-13
Process Bars
The Process Bars show how the selected process is using CPU and disc
resources.
Figure 5-6. Process Screen|Process Bars
The Process bar has the following components:
The CPU bar shows the percentage of central processing unit
time used by the process during the last interval. The codes on
this bar correspond to the codes used in the Global CPU bar
(see CPU Bars under \Reading the Screen Display" in chapter
3). The number at the right of the bar is the percentage of time
the CPU is busy (not counting idle time or paused-for-disc
time). [Scale: 0% to 100% of total time busy.]
CPU
DISC
An asterisk (3) represents the average usage of this resource over
time|since the program started or since the last Z (\zero")
command.
The Disc bar shows the disc transfer rate (transfers per second)
by the process during the current interval. The codes on this
bar correspond to the codes used in the Global Disc bar (see
Disc Bars under \Reading the Screen Display" in chapter 3).
[Scale: 0 to 100 disc transfers per second.]
An asterisk (3) represents the average usage of this resource over
time|since the program started or since the last Z (\zero")
command.
5-14
Screen Metrics and Statistics
Process Summary Fields
The Process Summary Fields at the right of the screen provide additional
information about the process.
Figure 5-7. Process Screen|Process Summary Fields
The Process Summary Fields are as follows:
PROGRAM TYPE The type of program is displayed as NMPRG (native mode), CMPRG
(compatibility mode or PROG code in LISTF), or OCTed (one or
PROGRAM
ELAPSED
CPU-TOT
DISC-TOT
Note
more SOMs have been run through the Object Code Translator).
The fully qualied program name is displayed as
FILE.GROUP.ACCOUNT.
ELAPSED shows the total clock time that the process has been
running.
CPU{TOT shows the total amount of processor time used
during the life of the process.
DISC{TOT shows the total number of physical disc transfers
completed during the life of the process. A number followed by
the letter K represents thousands of transfers; a number followed
by the letter M represents millions of transfers.
Disc totals are not collected until either HP GlancePlus or
another performance tool enables the MPE measurement
facility to collect process data. This means that the DISC-TOT
value will not include physical transfers that were completed by
a process before the MPE measurement facility was enabled.
Screen Metrics and Statistics
5-15
Process State Bars
The bars show the process's states during its lifetime and the last interval.
Figure 5-8. Process Screen|Process State Bars
STATE (Components of Response Time)
The STATE or Elapsed Time Process State bar shows the components of
response time for the process over its lifetime (running time). The number at
the right represents what percentage of the total time the process requested
service (it was not waiting on terminal reads). Usually, this number will be
100% for a batch job since batch jobs typically do not interact with a terminal.
For interactive processes, however, this number is typically well below 100%,
and is a good indicator of how much of the time the process is requesting
service from the computer.
The components of the State bar are shown below. For each component listed,
the process state was as follows:
C
M
D
I
Q
P
F
O
5-16
Using the CPU.
Waiting for memory resources.
Blocked, waiting for a disc I/O transfer.
Blocked, waiting for a non-disc I/O transfer (this includes waiting for
terminal writes but not terminals reads. Remember, the State bar
represents the portion of time the process is asking for service).
Impeded by a synchronizing mechanism including the following wait
reasons: DBMS, RIN, SEM, SIR, and IMPEDE wait times.
Preempted, waiting for the CPU.
Waiting on a process in the family tree including the following wait
reasons: father, son, and message wait times.
Waiting for some other reason. Wait reasons in this category include:
TIMER, PORT, JUNK, MAIL, CONSOLE, PAUSE, TERMINAL,
MISCELLANEOUS, and BREAK wait times.
Screen Metrics and Statistics
LAST (Components of Response Time)
The LAST or Last Interval Process State bar represents components of
response time for the process over the last interval. The number at the right
represents the percentage of time the process was asking for service (not
waiting for input from a terminal) during the most recent time interval. The
codes for the Last bar are similar to those for the State bar except they only
represent the time for the last interval. A comparison of the LAST bar to
the STATE bar shows if the last interval was typical relative to the life of the
process.
Miscellaneous Process Information
Below the State and Last Interval bars the screen shows additional information
for the process being monitored.
Figure 5-9. Process Screen|Miscellaneous Process Information
Additional information includes the following:
Wait
Queue Priority
Upon rst entering the Process screen, this eld indicates
why a process is currently waiting (if the process is active, it
will be blank). For every succeeding interval, it shows both
the percentage and wait reason for the highest percentage
wait reason during that interval. While the STATE and
LAST bars group wait reasons for better representation, the
Wait eld uses the detailed reasons in appendix C to
increase its ability to pinpoint a process slowdown.
This eld shows the execution queue (where: A=AS; B=BS;
C=CS; D=DS; E=ES) and the absolute priority number
(1-255) for the process at the time it was displayed. The
priority will display a zero if the process has just terminated.
Screen Metrics and Statistics
5-17
Scheduling State This eld shows the state this process is in according to the
MPE/iX Dispatcher. Valid states are: Executing, Ready,
Short Wait, Long Wait, and Null.
Executing
The process is using the CPU.
Ready
The process is waiting its turn for the CPU.
Short Wait The process is waiting for disc I/O, such as a
code page fault or le page fault.
Long Wait
The process is waiting for other I/O activities
such as a terminal read or terminal write. SIR,
RIN, Parent Wait, and other semaphore-type
waits fall under this category.
Null
Appears only if a process is being created or is
dying.
Transactions/min This eld shows the rate of terminal transactions
(transactions per minute) completed during the last interval.
Compatibility
Mode
Native Mode
Switches
Comp. Mode
Switches
Response Time
5-18
This eld shows the percentage of CPU time the process
spent in Compatibility Mode during the last interval.
This eld shows the rate of Native Mode switches completed
(switches per second from Native Mode to Compatibility
Mode) during the last interval. [Bar Scale: 0 to 200 switches
per second. The number to the right of the bar shows the
actual switch rate per second up to a maximum of 9,999.]
This eld shows the rate of Compatibility Mode switches
completed (switches per second from Compatibility Mode to
Native Mode) during the last interval. [Bar Scale: 0 to 200
switches per second. The number to the right of the bar
shows the actual switch rate per second up to a maximum of
9,999.]
This eld shows the average response time for the process
during the last interval. If no terminal transactions were
completed, the response time value is zero. [Scale: 0.00 to
60.00 seconds.]
Screen Metrics and Statistics
Process Screen Function Keys
When you display the Process screen, the softkeys at the bottom of the screen
change to functions related to the process being viewed. By pressing these
softkeys you can display the information described below.
If you choose not to use softkeys, you can access GlancePlus functions using
the subcommands described with the specic functions.
Figure 5-10. Process Screen|Screen Function Keys
Setting Option Values (V)
The process-specic functions can be customized using the V command to set
the following conguration parameters:
File (Simple or Detailed)
This option controls the information displayed for open les. See the Display
Files option below for more information.
Prockeys (Demand or Continuous)
This option controls how information on the three process-specic functions
(Display Files, Display Family, and Display Trace) are displayed.
Demand
When Demand is selected, the functions are treated as requests to display
the appropriate information once. For example, if Prockeys=Demand and
the Display Files function is selected from the Process screen, the open le
information is displayed once, but will not be redisplayed when the screen
is refreshed.
Screen Metrics and Statistics
5-19
Continuous
When Continuous is selected, the functions are treated as switches
enabling or disabling the continuous display of information. For example,
if Prockeys=Continuous and the Display Files function key is selected from
the Process screen, the open le information is displayed, and redisplayed
automatically each time the screen is refreshed.
When a continuous-mode display is enabled, the Process State bars and
Miscellaneous Process Information sections of the detail display are
suppressed to leave more room for the display just enabled. When that
display is disabled, the Process State bars and Miscellaneous Process
Information are again included in the detail display.
Hint
If you wish to see successive displays on the monitor for
comparison, set Prockeys = Demand, and press the Display
Files function key at the prompt Press RETURN to continue
(or enter a GLANCE command):. This is useful particularly
for tracking the progress of the le pointer in the le display.
It has the additional benet of not updating the rest of the
process information; this can be very handy over a slow data
communications link.
xxxxxxxxxxxxxxxxxxxxxxxxxx
Display
Files
Press the Display Files function key to see a list of open les for the process
being viewed. To display this data without using the function keys, press \1".
(The \1" subcommand is only valid during the Process screen display.)
The Display Files function appears in two formats depending on how the File
parameter is congured: File=simple or File=detailed. This parameter is
set using the Set Option Values (V) command. The following formats occur:
5-20
Screen Metrics and Statistics
Simple File Display
If the File parameter is congured File=simple, the Simple File Display
format occurs,
where:
Filename
xxx %
The le name comprised of the rst eight characters of the
formal designator for the le.
This eld, following the le name, indicates the progress of the
record pointer as compared with the end-of-le pointer. A
sample display might be:
DB01 /32%
DB02
/45%
Detailed File Display
If the File parameter is congured File=detailed , the Detailed File Display
format occurs, as shown in gure 5-11.
Figure 5-11. File Display Screen|Detailed Display
Screen Metrics and Statistics
5-21
where:
File.Group.Account is the formal designator for the le.
and
File
Group
Account
Type
The le name or, if unnamed, a question mark (?).
The group name or, if unnamed, a series of dots (. . . . . . . . ).
The account name or, if unnamed, a series of dots (. . . . . . . . ).
File code mnemonic (as in LISTF,1 command)
or File code number (user-dened le code)
or One of the following specially dened mnemonics:
RXRAW
LaserRX raw log le (le code 1135).
RXEXT
LaserRX extracted log le (le code 1136).
ROOT
TurboIMAGE data base root le (le code -400).
DSET
TurboIMAGE data base data set (le code -401).
DBREM
TurboIMAGE remote data base (le code -402).
DBILR
TurboIMAGE ILR le (le code -404).
PRIV
Any other negative le code.
Rec-Pointer
End-of-File
Domain
5-22
or if the le code is zero:
KSAM
Foptions le type = 1
RIO
Foptions le type = 2
KSAMX
Foptions le type = 3
CIR
Foptions le type = 4
SPOOL
Foptions le type = 5
MSG
Foptions le type = 6
The current record pointer for the le. (This usually points to
the last record accessed by the process.)
The current end-of-le value (disc les only).
The designation of the le's condition. It may be:
NEW
File is newly created, Foptions Domain = 0.
PERM
File is permanent, Foptions Domain = 1.
TERM
File is temporary, Foptions Domain = 2.
OLD
File is old permanent or temporary, Foptions
Domain = 3.
Screen Metrics and Statistics
If the le is a system-dened le, the Domain lists one of the
following designations:
System-dened le, Foptions designator = 1.
System-dened le, Foptions designator = 2.
System-dened le, Foptions designator = 3.
System-dened le, Foptions designator = 4.
System-dened le, Foptions designator = 5.
System-dened le, Foptions designator = 6.
System-dened le, Foptions designator = 7.
The way a le is opened by the process|the type of access, as
follows:
$stdlist
$newpass
$oldpass
$stdin
$stdinx
$null
????????
Access
File is opened for READ access, Aoptions
Access = 0.
OUT
File is opened for WRITE access, Aoptions
Access = 1.
KEEP
File is opened for WRITE-SAVE access, Aoptions
Access = 2.
APEN
File is opened for APPEND access, Aoptions
Access = 3.
I/O
File is opened for READ/WRITE access, Aoptions
Access = 4.
UPDT
File is opened for UPDATE access, Aoptions
Access = 5.
XEQ
File is opened for EXECUTE access, Aoptions
Access = 6.
LOAD
File is opened for EXECUTE-READ, Aoptions
Access = 7.
M
File is opened for MAPPED-FILE access
The way the le is shared by this process:
IN
Share
EXC
SEM
SHR
,L
File is open for EXCLUSIVE access, Aoptions
Excl = 1.
File is open for READ-SHARE (SEMI EXCLUSIVE)
access, Aoptions Excl = 2.
File is open for SHARE access, Aoptions Excl = 3.
File is open with Dynamic Locking, Aoptions
Lock = 1.
Screen Metrics and Statistics
5-23
Opens
The number of times the le has been opened.
TurboIMAGE data sets will have their record pointers and end
of les expressed as TurboIMAGE record numbers instead of
MPE le blocks of media records.
See the MPE Intrinsics Manual under the FOPEN intrinsic for a
detailed description of Foptions and Aoptions parameters.
xxxxxxxxxxxxxxxxxxxxxxxxxx
Display
Family
Press the Display Family function key to see the family tree for the process
currently being viewed. To display the tree without using the function keys,
press 425. (The \2" subcommand is valid only during the Process screen
display.)
If available, the parent process identication number (PIN) is shown, followed
by any and all children of the process. For each PIN displayed, the program
being executed by the respective process is also presented.
xxxxxxxxxxxxxxxxxxxxxxxxxx
Display
Trace
Pressing the Display Trace function key provides an HP Debug Procedure trace
of the process being monitored. To display the trace without using the function
keys, press 435. (The \3" subcommand is valid only during the Process screen
display.)
The rst time you use the Display Trace key, a 5- to 30-second delay occurs.
This is normal. Note, however, that a user will not be able to execute this
command without System Manager (SM) capability.
Consult the MPE XL System Debug Reference Manual for detailed information
on how to read a trace.
5-24
Screen Metrics and Statistics
xxxxxxxxxxxxxxxxxxxxxxxxxx
SPT
Collect
This function key allows you to use the HP SPT (Software Performance Tuner)
product to create and run a program under HP GlancePlus for collecting
metrics on the process currently running. To display this process without using
function keys, press 445. (The \4" subcommand is valid only during the Process
screen display.)
This command is optional and will operate only if the HP SPT product was
installed.
The data SPT collects about a process is placed in the default log le
SPTLOG. The default time for collecting process metrics via SPT is 5 minutes,
but can be changed by using the job control word GLANCESPTTIME.
Collection times between 1 and 60 minutes can be selected when using SPT
from within GlancePlus. The le SPTOUT is used for STDLIST messages
created from the SPT process running under HP GlancePlus.
If desired, you can terminate a SPT process created by GlancePlus, by using
the MPE command (:) and issuing the command SETVAR SPT_STOP TRUE. The
existence of the SPT_STOP variable will cause the SPT process to terminate in
15 to 30 seconds.
After creating and activating the SPT program, GlancePlus resumes normal
operation and its screens can be accessed.
Note
HP GlancePlus limits SPT data collection to one active process
at a time.
Screen Metrics and Statistics
5-25
Filter Selection Menu Variables
HP GlancePlus lets you dene any collection of programs, applications, or users
as a group and view them on the Filter Display screen. It combines the ability
to subset the Global screen's interesting processes to a group you wish to see
with the Job/Session screen's feature of summarizing their activity. You can
press the Filter command key (4F5) to see the current lter values. You will be
prompted to change them, or you can accept the current values by pressing
4RETURN5.
Also, you can select whether to display information by program, user, or
predened application, and whether it must match one or all of those selections
to become a part of the lter group. You can select whether it should display
all processes matching your specications or only those that exceed threshold
values. MPE wildcard attributes are accepted for the Program name and User
logon.
To change a current lter's value, type the key word for the lter (shown in
uppercase on the screen), then type the new value for that lter.
Hints
5-26
HP GlancePlus can recognize a key word by the minimum
number of characters needed to identify it uniquely. In this
case, since each key word is unique in the Filter Selection
menu, the program can recognize a key word by the rst
letter of its name.
Multiple lter commands can be entered by separating the
individual commands with semicolons (;).
Commands that have only two states|such as YES/no|can
be entered without a value to change to the opposite state.
For example, if \use THRESHOLD values = YES/no" is
YES, it can be changed to NO by entering the THRESHOLD
command.
To remove a program name or user logon selection, enter the
key word without a value.
Screen Metrics and Statistics
An example of a lter selection menu is shown below.
Figure 5-12. Filter Screen Selection Dialogue
You can choose from the following variables:
use THRESHOLD
values
MATCH criteria
PROGRAM name
USER logon
YES/no Select Yes and GlancePlus will use the threshold
values to display only interesting processes. Select No to
display all processes (interesting or not) that match the lter
criteria.
all/ANY Select all if a process must match all of the
criteria or ANY if it must only match any one selection
criterion.
Select any valid MPE program name, which may include
wildcards. For example, GLANCEXL will list all current users
of the HP GlancePlus program.
Select any valid MPE logon value, which may include
wildcards. For example, @.XYZ will list all users currently
logged on to the XYZ account.
Screen Metrics and Statistics
5-27
APPL Defn File
If an application denition le appears on the display with
application index numbers and names below it (see
gure 5-12), you may immediately select applications to be
displayed. Select one or more applications by entering their
index numbers separated by spaces or commas. You may
also use the \+" or \-" to add or subtract applications from
the selected list. When you select an application, both its
number and name are highlighted. For example, entering 2 5
in response to the CHANGE prompt in gure 5-12 would result
in selecting (and highlighting) the Networking and MM/3000
applications. Entering +6 12 in response to the next prompt
would add DBS and Prodsys to the selected applications.
If no applications appear on the display or you wish to
specify a dierent application denition le, enter APPL
filename in response to the CHANGE prompt. If the le
contains valid application denitions, then the display will
show the application index numbers and names from that
le. Creating a le with application denitions provides a
rapid and simple means to select groups of programs or users
to view in the Filter Display and Workload Screens.
GlancePlus looks for application denitions in the
conguration le GLANCNFG when it is initiated. If found,
GLANCNFG is used as the default application denition le.
If no application denitions are found there, GlancePlus next
looks for them in the PARM.SCOPE.SYS le. This is the le
used by HP Performance Collection Software, which is part
of both the HP LaserRX/MPE and HP GlancePlus Pak
products. If no application denitions are found in either
place, then GlancePlus initiates with no default application
denition le, and the APPL Defn File eld is blank.
To nd out how to construct an application le, see
appendix D.
5-28
Screen Metrics and Statistics
Filter Display Screen
The Filter Display screen provides both systemwide information, and
information that matches the programs, users, and applications you selected.
The Filter Display screen has ve components:
Program Banner Line.
Global Bars.
Filter Bars.
Summary Fields.
Filter Processes.
The Program Banner Line and Global Bars are the same on all HP GlancePlus
screens and contain the same information.
Figure 5-13. Filter Screen
Screen Metrics and Statistics
5-29
Filter Bars
CPU Bar
The CPU bar represents the usage of CPU resources for all processes ltered
during the last interval. The \F" code on this bar corresponds to the Filter
Display screen and may indicate jobs, sessions, or system processes that match
the lter criteria you selected.
The asterisk (3) indicates the average usage of CPU resources by the ltered
processes for the total time monitored, but only since the last Z command, if
one was entered. See chapter 4 for information about screen commands.
Disc Bar
The disc bar shows the combined rate of disc transfers for all processes ltered
during the last interval. The \F" code indicates the job, session, and system
processes that match the lter criteria you selected.
The asterisk (3) on this bar indicates the average rate of disc transfer for
the ltered processes over the total time monitored, but only since the last
Z command, if one was entered. See chapter 4 for information about screen
commands.
5-30
Screen Metrics and Statistics
Summary Fields
The summary elds for the user-dened lter appear at the right of the CPU
and disc bars. These elds contain the following information:
This number (in parentheses) is the total number of processes
displayed. There are four processes in the example above.
Filter Value This value identies the lter. It may be a program name, user
logon, application name, or application number list. The
example above identies an application called \Fred".
Elapsed
This eld shows the total time that the lter processes are
known to have been running.
CPU-TOT
This eld shows the total CPU time used by ltered processes
during the time they were running.
DISC-TOT
This eld shows the total number of disc transfers completed by
all ltered processes during the time they were running.
Count
Screen Metrics and Statistics
5-31
Filter Processes
The lower section of the Filter Display screen provides details about processes
that match the lter criteria. These elds contain the following information.
JSNO
DEV
LOGON
PIN
PROGRAM
PRI
CPU%
5-32
This eld contains the job number (#Jnnn ) or session number
(#Snnn ), or if the process is a system process, the PIN or
process identication number (#Pnnnn ), as appropriate.
This eld contains the logon device number (SYS indicates a
system process).
This eld contains the user logon string.
This eld contains the process identication number. System
processes will have the same PIN listed here and under JSNO.
This eld contains the program's name, or if the program is the
MPE Command Interpreter (CI), then the eld will display a
colon (:) followed by the rst characters of the last CI command
issued.
This eld will contain the execution queue and priority number
(or if terminated, the word DIED).
This eld indicates the percentage of time the CPU was used
during the last interval.
Screen Metrics and Statistics
DISC
TRN
RESP
WAIT
This eld indicates the rate of physical disc transfers (number
per second) during the last interval.
This eld indicates the rate of terminal transactions (number
per minute) during the last interval.
This eld indicates the terminal response time (in seconds)
during the last interval.
This eld indicates the current resource for which the process is
waiting.
Screen Metrics and Statistics
5-33
Workload Screen
The Workload screen summarizes activity for user-dened collections of
processes called applications. You can use it to view information on resource
usage and transactions for groups of specic processes. Application denitions
are specied in a conguration le (for more information, see appendix D).
The detail area of the display is divided into two parts:
Interesting Applications.
Top CPU Consumer and Top Disc Consumer.
Figure 5-14. Workload Screen
Interesting Applications
The Workload screen displays only applications that use CPU during the
interval to allow you to concentrate on applications currently aecting
performance. Interesting applications scroll down as new entries are added to
the top of the listing thus keeping the latest information just below the Global
bars. You can scroll the terminal display to examine previous applications and
intervals again. You can also press the 4A5 key to see a one-time display of all
applications.
5-34
Screen Metrics and Statistics
Some interesting applications will have elds highlighted to indicate an event
that might require closer attention. On colored monitors, these highlights are
in color, on monochrome monitors they are underlined.
Since applications represent groups of processes, the thresholds for CPU usage,
disc transfers, and transaction rate are set higher than they are for single
processes. These values are set by highlight specications in the GlancePlus
conguration le GLANCNFG. Since response time is an average for all
processes in the application, the response time threshold value used for single
processes is also used for applications. See chapter 7 for more information on
customizing GlancePlus.
Interesting Application Fields
The application bars and elds appear below the Global bars and present
information about how the applications are using CPU and Disc resources and
information on their transaction rates and response times.
The Application bars and elds contain the following information:
Application
Name
CPU
This is the name of the application as specied in the
application denitions (see appendix D).
This CPU bar shows the percentage of central processing unit
time used by the application during the last interval.
The bar contains the following codes:
L
C
D
E
- Linear queue (AS or BS).
- CS queue.
- DS queue.
- ES queue.
The number at the right of the bar is the percentage of time the
application used the CPU during the last interval. A bar will
not be displayed if the percentage of CPU used was not high
enough to occupy one character space on the bar.
Screen Metrics and Statistics
5-35
DISC
This bar shows the application's disc transfer rate
(transfers/second) during the interval.
The bar contains the following codes:
R - Disc reads.
W - Disc writes.
TRN
RESP
The number at the right of the bar is the application's disc
transfer rate during the interval.
This eld indicates the rate of terminal transactions
(number/minute) during the last interval.
This eld indicates the average terminal response time (seconds)
during the last interval.
Top CPU and Disc Consumer
GlancePlus names the processes that are consuming the most CPU resources
and the most Disc resources on the two lines following the application bars and
summary elds.
The top CPU consumer is identied by its PIN (process identication number),
the percentage of CPU it used during the last interval, and the program name
or MPE/iX Command Interpreter (CI) command last issued. If an MPE/iX
system process is the top consumer, it is identied by the program name or by
the text: running program on behalf of MPE/iX.
The top Disc consumer is identied in the same way as the top CPU consumer
except that the rate of disc transfers (transfers/second) for the process during
the last interval is displayed instead of CPU percentage. If no disc activity
occurred during the interval, the Top Disc Consumer line will not appear on
the screen.
Note
5-36
If you do not have System Manager (SM) capability, you will
see the letters CI instead of the command string text when the
program is a Command Interpreter.
Screen Metrics and Statistics
CPU Detail Screen
If you choose the C command for the CPU Detail screen, you can view metrics
that are specic to CPU usage. In addition to the Program Banner Line and
Global Bars, this screen will show CPU usage by the dispatcher, memory
manager, system, and batch processes, as well as the time spent in various
states such as paused, idle, or in a queue. The detailed data section of the
display has four components:
Type of Utilization.
Queue Distribution.
Miscellaneous Performance Metrics.
Top CPU Consumer.
Figure 5-15. CPU Detail Screen
Screen Metrics and Statistics
5-37
Type of Utilization
This uppermost section of the detail area lists the percentage of total time used
for dierent system resources and system purposes.
Figure 5-16. CPU Detail Screen|Type of Utilization
These system resources and system purposes include the following:
MemMgr
System
Session
ICS
Dispatch
Batch
5-38
This line shows the time during the current interval that the
CPU was processing certain Memory Manager activities, such as
fetches and swap ins.
If memory manager CPU utilization is consistently higher than
8%, the system might be experiencing a main memory
bottleneck.
This line shows the time during the current interval that the
CPU spent on system processes such as NS services, spoolers,
and the Loader.
The Session line shows the time the CPU spent on interactive
processes during the current interval.
If more than 70% of the CPU time was spent, consistently, on
interactive processes, the system might be experiencing a CPU
bottleneck condition.
The Interrupt Control Stack (ICS) line shows the time spent on
interrupt activity during the current interval. The ICS value is
derived by subtracting the sum of all other CPU states during
the interval from 100%.
This line shows the time the CPU spent on MPE/iX Dispatcher
activity.
This line shows the time the CPU spent processing batch jobs
during the current interval.
Screen Metrics and Statistics
Pause
Idle
This line shows the time the CPU was paused for the disc
during the current interval.
If more than 25% of the time is spent, consistently, in a paused
condition, the system might be experiencing a disc bottleneck
condition.
This line shows the time the CPU was idle during the current
interval.
Queue Distribution
The Queue % line shows the active CPU cycles consumed during the current
interval distributed by queue. The percentage for each queue is shown at the
right.
Figure 5-17. CPU Detail Screen|Queue Distribution
Miscellaneous Performance Metrics
The bottom section of the CPU Detail screen shows various Global CPU
performance metrics measured during the current interval.
Figure 5-18. CPU Detail Screen|Miscellaneous Metrics
Screen Metrics and Statistics
5-39
Switches to CM This shows the rate of switching from Native Mode to
Compatibility Mode. [Bar Scale: 0 to 500 switches per second.
The number to the right of the bar shows the actual switch rate
per second up to a maximum of 9,999.]
Switches to NM This shows the rate of switching from Compatibility Mode to
Native Mode. [Bar Scale: 0 to 500 switches per second. The
number to the right of the bar shows the actual switch rate per
second up to a maximum of 9,999.]
5-40
Screen Metrics and Statistics
Note
Excessive switching may indicate CPU saturation. While
switching rates depend on machine size, you combine the
rates for the two modes and use table 5-2 as a guideline for
determining whether excessive switching is occurring. If it is,
you should consider a Native Mode migration.
Table 5-2. Guidelines for Switches to CM or NM
Machine
Model
S/920
S/925
S/922
S/932
S/935
S/950
S/955,917,927,937,947
S/948,949
S/960
S/958
S/957
S/980-100,967
S/977
S/980-200
S/980-300
Threshold Rate
(switches/second)
approx 75
approx 120
approx 150
approx 225
approx 270
approx 300
approx 440
approx 500
approx 630
approx 650
approx 720
approx 1000
approx 1170
approx 1500
approx 1830
Screen Metrics and Statistics
5-41
This shows the percentage of time the CPU was in Compatibility
Mode between switches.
Interval Process This shows the rate of process completions for the current interval
(number of processes completed per second).
Completions
Interval CM %
Current
Ready Queue
Maximum
Ready Queue
Launch Rate
CQ SAQ
Interval
File Open Rate
5-42
This provides information about the workload characteristics of
the machine. A high rate of process completions, for instance,
may indicate a CPU bottleneck due to excessive or improper
process handling. A sustained rate greater than 0.50 may be
considered excessive.
This shows the number of processes waiting for the CPU. [Scale:
0 to 25 processes.]
This shows the maximum number of processes waiting for the
CPU since GlancePlus was started or since the MPE/iX
Measurement Interface was enabled. [Scale: 0 to 25 processes.]
This shows the rate of launches during the current time interval
(number of launches per second). A launch occurs every time the
MPE/iX Dispatcher gives a process control of the CPU.
This is the System Average Quantum (SAQ) for the C queue
(CQ). This value represents the current time limit (in
milliseconds) during which a process in C queue can retain use of
the CPU. The SAQ value, which is recalculated continuously by
the dispatcher, must be a value between the minimum (MIN) and
maximum (MAX) parameters of the current CQ setting.
This is the rate that les are being opened during the current
interval (number of les opened per second). The File Open Rate
can be used to judge the workload characteristics of the system.
A sustained rate greater than 35 les opened per second might
indicate a CPU bottleneck condition or, possibly, poor application
design.
Screen Metrics and Statistics
Top CPU Consumer
In a single line near the bottom of the CPU Detail screen, GlancePlus names
the process that is consuming the most CPU resources.
Figure 5-19. CPU Detail Screen|Top CPU Consumer
The percentage represents the amount of CPU resource that the process used
during the last interval. The screen lists either the program name or the
MPE/iX Command Interpreter (CI) command last issued. If an MPE/iX
system process is the top consumer, it is identied by the program name or by
the text \running program on behalf of MPE/iX." If you wish to analyze that
process in more detail, you can use the > command to take you to the Process
screen for that process identication number (PIN).
Note
If you do not have System Manager (SM) capability, you will
see the letters \CI" instead of the command string text.
Screen Metrics and Statistics
5-43
Disc Detail Screen
Press the D command to see activity for the system disc drives as shown on the
Disc Detail screen. This screen lists performance information for each drive
currently active.
Figure 5-20. Disc Detail Screen
The detailed data area of the display is divided into three parts:
Individual Disc Utilization.
Summary Disc Utilization.
Top Disc Consumer.
5-44
Screen Metrics and Statistics
Individual Disc Utilization
The individual disc utilization section of the screen displays one line for
each disc drive. Information is shown on the logical device number (Ldev),
percentage of utilization for the current interval, the average service time
(Service), physical read and write rates, current queue depth, and maximum
queue depth.
Figure 5-21. Disc Detail Screen|Individual Disc Utilization
Utilization
Service
Reads
Writes
Queue
Max Queue
The utilization for each disc drive refers to the percentage of
time during the current interval that the drive was in use
servicing reads and writes. It is computed by dividing the disc's
service time for the interval by the interval's elapsed time.
[Scale: 0% to 100% utilization.]
The average service time for each physical I/O appears in the
Service eld. Represented in seconds, this metric is derived by
dividing the disc service time by the total number of physical
reads and writes for the current interval. For example, \0. 0520"
indicates an average service time of 52 milliseconds for that
drive for the current interval.
The number of physical reads per second for the disc during the
current interval appears to the right of the Service eld.
The column showing the number of physical writes per second
for the disc during the current interval appears to the right of
the Reads column.
The Queue column lists the number of processes in queue for
this disc during the current time interval.
The Maximum Queue column shows the largest number of
processes in queue for this disc since GlancePlus or the
measurement interface was started.
Screen Metrics and Statistics
5-45
Summary Disc Utilization
The Summary Disc Utilization section shows the rate of logical reads and
writes per second, and the global memory manager reads and writes per
second. These rates are for the current interval. [Logical Attempt Bar scale:
500 I/Os per second. Memory Manager scale: 100 I/Os per second.]
Top Disc Consumer
The bottom section of the Disc Detail screen lists the highest disc consumer
for the current interval, identied by its process identication number (PIN),
the program name, and the physical I/O rate for that PIN. If no disc activity
occurred during the interval, the Top Disc Consumer line will not appear on
the screen. If you wish to analyze that process in more detail, you can use the
> command to take you to the Process screen for that PIN.
Figure 5-22. Disc Detail Screen|Summary and Top Disc Consumer
5-46
Screen Metrics and Statistics
Memory Detail Screen
The Memory Detail screen displays metrics that show physical memory activity
by the system during the current interval. The detailed data area of the display
is divided into two parts:
Fault Types.
Miscellaneous.
Figure 5-23. Memory Detail Screen
Screen Metrics and Statistics
5-47
Fault Types
The Fault Types section presents several metrics for memory faults (faults per
second). [Scale: 0 to 50 faults per second.]
Figure 5-24. Memory Detail Screen|Fault Types
The Fault Types are as follows:
Transient
Permanent
NM Stack
CM Stack
NM Code
CM Code
CM Data
File Object
NM System
Library
CM System
Library
5-48
Unspecied transient data objects.
Unspecied permanent data objects.
Native Mode process stacks.
Compatibility Mode process stacks.
Native Mode code.
Compatibility Mode code (program les).
Compatibility Mode data segment.
File Objects.
Native Mode system library.
Compatibility Mode system library.
Screen Metrics and Statistics
Miscellaneous
The Miscellaneous section presents several system memory performance metrics
that could be used to indicate potential memory bottlenecks. A bottleneck
occurs when a memory resource has reached its capacity limit and might slow
system throughput or response time.
Figure 5-25. Memory Detail Screen|Miscellaneous Metrics
MemMgr
Page Overlay
Candidate Rate
Memory Manager utilization during the current time
interval is shown on the bar and by percentage to the right
of this eld. Sustained utilization of 8% or greater may
indicate a potential memory bottleneck.
This metric, depicted as the number of potential free pages
per second, shows the Memory Manager activity on the
making of physical memory pages as Overlay candidates
(potential free pages). A sustained rate greater than 35 free
pages per second may indicate a memory bottleneck.
Screen Metrics and Statistics
5-49
Memory Mgr
Clock Cycle Rate
The bottom line of the Memory Detail screen shows the
memory manager clock cycle rate.
The clock cycle rate is computed by dividing the number of
times the memory manager has cycled through memory by
the elapsed time GlancePlus has been running. Unlike the
other metrics on the screen, this one is relative to the run
time of GlancePlus rather than the current interval. This
avoids the misrepresentation of reporting one clock cycle
over four thirty-second intervals as a rate of 120 per second
during one interval and 0 per second during the other three.
It also means that you should be careful to let GlancePlus
run a few minutes before drawing any conclusions from this
metric.
Page Fault Rate
System Library
Page Faults
Physical Memory
Size
5-50
A memory manager clock cycle rate of more than 25 per
hour over ten minutes or more may indicate possible
memory pressure.
This eld shows the sum of the Global System Page Fault
types. The sum is expressed in page faults per second. A
fault rate greater than 30 faults per second sustained over
several intervals may indicate a potential bottleneck.
This metric shows the total Native Mode and Compatibility
Mode system library faults. A sustained rate of greater than
2 faults per second may indicate a memory bottleneck
condition.
This metric indicates the size of the machine's physical
memory (in megabytes).
Screen Metrics and Statistics
6
The Expert Facility
To use a performance management tool eectively, you must be able to obtain
proper measures of your system's performance, then separate the important
from the unimportant information. HP GlancePlus for MPE/iX helps you do
this in several ways.
Indicators. HP GlancePlus uses indicators that are carefully chosen and
arranged to make the product easier to use. Where several indicators might
be used to represent a system resource, only those that are clear, reliable,
and easy to interpret are used. Indicators that require an in-depth knowledge
of the operating system or are unique to a particular operating system's
technique are not used, if better alternatives are available. Reducing the
number of redundant indicators makes it easier to notice when one exceeds
its normal ranges.
Filtering. Intelligent ltering of data helps you focus on what is important.
For example, by showing only interesting processes, it is easier to identify
problems than it would be if you had to scan through every process on the
system. GlancePlus's ability to identify interesting processes|those that are
starved for a resource or those that are using resources excessively|make it
possible to see the forest without examining every tree.
Highlighting. Highlighting draws your attention to important indicators.
Highlights might indicate why a process is interesting. For example, If a
process was starved for a resource, the WAIT eld is highlighted and the
name of the resource needed is displayed.
Highlighting can also identify an indicator that exceeds a level that experts
consider normal. For example, if you are displaying the CPU display and
the number of compatibility-mode switches is abnormally high for this size
of system, this eld is highlighted in the display. GlancePlus's highlighting
provides an \expert in your pocket" that can tell you when your system is
out of line.
The Expert Facility
6-1
Note
Highlighting works on all supported terminals and terminal
emulators, but it works best on color terminals. Color
highlights can provide additional information|red indicates
more severe situations than blue or green. Terminals without
color capability use underlining or inverse video to highlight an
item. Highlighting is not available on the printer output.
Guidelines. GlancePlus provides guidelines to help you understand and
use the data presented. Usually, all you have to do is type H or press 4f75
to access online Help. Help can give you a list of commands and explain
your current display, in general terms. Help can also give you more detailed
information.
After entering the general Help section, you can ask for details about each
metric on your screen. The advice of many HP 3000 performance specialists
has been gathered and used to provide guidelines for understanding
performance data. By asking for GUIDELINES you can access this knowledge
base for information on what is considered \normal" for your system
and how to tell when your system might be experiencing problems. This
information is always at your ngertips when you need it.
Expert Facility. GlancePlus's Expert Facility helps you examine all the
pertinent system performance indicators quickly and obtain a diagnosis.
It can even recommend specic actions that might improve your system's
performance. This facility is a true expert system utilizing advanced
techniques that enable this program to make the same decisions as might be
made by a human expert in HP 3000 computer system performance.
6-2
The Expert Facility
Invoking The Expert Facility
You can use the Expert facility in several ways:
It is always active and can guide you when elds are highlighted on a specic
GlancePlus display.
You can type X from any screen to request the Expert facility to diagnose
your system. This diagnosis considers all available information, not just the
information displayed on the screen.
You can enable the Expert facility to operate continuously. In continuous
mode, the Expert facility examines your system each time the display is
updated. If it notices any performance problems it will add a single-line
summary to the screen indicating the area of the problem and its severity.
The Expert facility will also notify you of any problems, regardless of the
screen you are viewing|the only exceptions are the Help, Option Values,
and MPE Command screens.
What Does The Expert Facility Do?
The data displayed on each GlancePlus screen is examined by the Expert
facility, and any indicators that exceed the normal range for the size of system
are highlighted. Since the highlighting feature adds negligible overhead, it is
permanently enabled.
A global system analysis is performed based on data obtained from a single
sample. This can be a response to an on-demand request (you pressed the X
key), or might occur automatically following each screen update, if the Expert
facility is in continuous mode. During global analysis, all pertinent systemwide
performance indicators are passed through a set of rules. These rules were
developed by top performance specialists working on the HP 3000. The
rules were further rened through use on a variety of systems of all sizes and
congurations. The response to these rules establishes the degree of probability
that any particular performance situation (called a symptom) could be true.
If the analysis is performed on demand, any symptom that has a high enough
probability of being true is listed along with the reasons (rules) why it is
probably the case, as in the following example:
The Expert Facility
6-3
XPERT Status: 75% CHANCE OF GLOBAL CPU BOTTLENECK
Reason:
INTERACTIVE > 90.00 (96.4)
This says that \most experts would agree that the system is experiencing
a problem when interactive users consume more than 90% of the CPU."
Currently, interactive use is 96.4%. Since the probability is only 75% (not
100%), some additional situations are not true. (In this case, the number of
processes currently starved for the CPU might not be high enough to declare a
real emergency.)
Summarization of expert analysis is available when the Expert facility is used
in continuous mode. When this is enabled, global analysis is performed after
each screen update, but messages are not given unless there is a problem.
When one or more problems are detected, a single-line summary is added to
the current display screen. In generating this one-line summary, each symptom
is counted as one or more types of problems (CPU, DISC, MEMORY, LOCKS,
Compatibility Mode, Switch Rate, or Response Time).
The probabilities for all symptoms of a given type are added to arrive at the
state of the resource. If the state of the resource is low enough, the resource is
considered normal, if higher, it is evaluated as MODERATE, HIGH, or VERY
HIGH. The continuous-mode Expert facility display is a single line showing any
problem areas and their states. For example,
XPERT: |CPU IS VERY HIGH| |SWITCHES ARE HIGH|
In addition to generating one-line displays, the Expert facility also retains a
summary of how often each type of problem occurred in each state. By typing
O (for Overall Summary), you can generate a summary report showing the
totals since the Expert facility was put into continuous mode.
Figure 6-1. Xpert Overview Screen
6-4
The Expert Facility
High level analysis can be performed only if the Expert facility is enabled for
high level|use the V command: XLEVEL=HIGH. After a global analysis in which
a problem type was not normal, the processes that executed during the last
interval are examined. If an action can be suggested that might improve the
situation, the action is listed as follows:
XPERT: Status 75% CHANCE OF GLOBAL CPU BOTTLENECK.
Reason: INTERACTIVE > 90.00 (96.4)
Action: QZAP pin 122 (PASXL) for MEL.EELKEMA from "C" to "D" queue.
Actions will not be instituted automatically since you may or may not agree
with the suggestions.
If the Expert facility is enabled for high level analysis, you can request
additional information when you request an expert diagnosis using the X
command. Following the initial display, you can type X again to display the
process data analysis. This analysis often includes the process or processes that
are probably causing the problems as well as those that are suering from the
problems. For example,
Enter the X command:
XPERT: Status 75% CHANCE OF GLOBAL CPU BOTTLENECK.
Reason: INTERACTIVE > 90.00 (96.4)
Action: QZAP pin 122 (PASXL) for MEL.EELKEMA from "C" to "D" queue.
The Expert Facility
6-5
Press 4RETURN5 to continue, then press X for more details, or O for an overview
summary. Press X again:
Even if no action is recommended, it can be helpful to display the high level
analysis. The analysis might indicate why no action should be taken at this
time. You might discover that even though your system CPU is 100% busy
due to interactive users and a CPU bottleneck is indicated, no action is
recommended since no process is starving for the CPU. Continued use of the
expert high level analysis can teach you some of the subtleties of managing
performance. You may not always agree with the suggested actions, but the
information can help you understand your system better.
There is one level of analysis available beyond the high level discussed above. If
after viewing the high level analysis, you still want more information, you can
respond by pressing X again. This will give you the \Dump Everything" level
analysis.
Usually, high level analysis is only done on areas of system performance that
the Expert facility determined to be a problem. Processes will not be examined
for disc problems unless there was an overall disc problem indicated. In the
\Dump Everything" level analysis, every possible type of problem is examined
to determine even a remote possibility that a process is causing a problem.
This can be useful if you are interested in potential database-locking problems
on your system, but the problems are not aecting enough of the system to be
considered serious.
6-6
The Expert Facility
Recommendations For Using The Expert Facility
Using the Expert facility will add a small amount of overhead to the
GlancePlus program. On most systems this additional overhead is about 0.2%
CPU; it should not cause any problems. On systems with many processes, the
GlancePlus overhead might be higher. In this case, you can eliminate almost
all the Expert facility's additional overhead by using the V command to set
XLEVEL=LOW instead of HIGH. The high level analysis and suggested actions
will not be available to you with this setting. You can use XLEVEL=LOW as a
default and change it to HIGH only when you need more detailed information.
See chapter 7 for details on how to select the default settings for GlancePlus.
With XLEVEL=LOW and XPERT=DEMAND, the Expert facility adds no additional
overhead. Press 4X5 to request an on-demand global analysis at any time.
Since the overhead of the Expert facility on most systems is negligible, you
can safely let it run in continuous mode. You may use XLEVEL=LOW and
XPERT=CONTINUOUS to report any global problems and to accumulate the
overview summary information (for the O command). Using XLEVEL=HIGH
should not add signicant overhead on most systems. (You can see the
overhead by using GlancePlus to monitor itself under various settings on your
system).
Hint
The frequency of screen updates is one factor that aects
GlancePlus's overhead most directly. If you set the update
interval to its lowest setting (5 seconds), or press 4Return5 or
4Enter5 repeatedly to generate rapid updates, the CPU overhead
can become very high. If you want to collect long-term
summary information, set a longer update interval (60-90
seconds) to lower the GlancePlus overhead substantially.
However in some cases, setting the update interval to longer
than 90 seconds might not reduce the GlancePlus overhead.
To keep process information from \backing up" in the
measurement interface, information should be extracted every
60-90 seconds. Failure to do so can result in missing and
inaccurate data. To avoid this problem if you select an update
interval longer than 90-seconds, GlancePlus extracts the process
data automatically once a minute to prevent backups.
The Expert Facility
6-7
Changing The Expert Facility's Rules
A situation might occur on your system that the Expert facility considers
unusual but is normal for your system. Or, conversely, you might have a
situation that the Expert facility does not detect, but one that you would like
to add to its list of symptoms. In such cases, see chapter 7 for information on
changing the GlancePlus default conguration. Make changes to the Expert
facility carefully, since by doing so, you are assuming the role of an expert.
6-8
The Expert Facility
7
Customizing HP GlancePlus
As discussed in chapter 3, GlancePlus allows you to customize the startup
procedure.
Customizing Startup
HP GlancePlus for MPE/iX provides the following two startup parameters
when you run the program.
Refresh Time
Once you execute HP GlancePlus, the screens are refreshed (updated) every 30
seconds, by default.
You can specify a dierent refresh time when you execute the program by using
the ;PARM= option of the MPE RUN command. With this parameter you can
specify the number of seconds (5{3600) between screen updates.
Selecting the Initial Screen
GlancePlus displays the Global screen at startup, by default. You can direct
it to start with the Job/Session, Process, CPU Detail, Disc Detail, Memory
Detail, or Workload screen by specifying the appropriate GlancePlus command
in the ;INFO= option of the MPE RUN command. To select a job, session, or
process to monitor, you must follow the command abbreviation for that screen
with a valid number.
Customizing HP GlancePlus
7-1
The following examples specify a refresh time of 60 seconds and the monitoring
of job number 312:
Type: :RUN GLANCEXL.PUB.SYS;INFO="J312";PARM=60
If you activated the HP GlancePlus UDC le, type: :GLANCE J312,60
The following examples specify that startup should proceed directly to the
Workload screen:
Type: :RUN GLANCEXL.PUB.SYS;INFO="W"
If you activated the HP GlancePlus UDC le, type: :GLANCE W
Customizing GlancePlus Global Bars
As discussed in chapter 3, the Global CPU bar and the Global Memory bar
can be congured dierently. This will change the abbreviations and their
corresponding components in those bars.
For example, you can recongure the components of the Global CPU bar to
show activity by queue and the components of the Global Memory bar to show
fault rates, as discussed below.
Global CPU Bar
Reconguring Global CPU Bar to show activity by queue is useful when you
use a batch job to initiate processes that interact with terminal users. The
normal \interactive/batch" representation would show these terminal users as
\batch" since they were initiated as a batch job|this would not be as useful
as a queue representation. A queue representation might also be useful on a
system where interactive sessions and batch jobs routinely execute in queues
other than the normal CS queue for sessions and DS and ES queues for batch.
7-2
Customizing HP GlancePlus
The CPU bar has the following components:
DISPCPU = QUEUE
Code Meaning
MPE processing (memory management, interrupts, ICS, etc.).
A
Processes running in the A subqueue (system priority).
B
Processes running in the B subqueue (high priority).
C
Processes running in the C subqueue (normally interactive).
D
Processes running in the D subqueue (normally batch priority).
E
Processes running in the E subqueue (normally background).
P
Paused for disc (no CPU used but disc I/O is occurring).
Blank CPU was idle (and no disc I/O was occurring).
M
Global Memory Bar
Conguring the Global Memory bar to show page-fault rates rather than
contents might be useful on a system where memory is a bottleneck and page
faults are used as key indicators to alert you of a problem.
The Memory bar has the following components:
DISPMEMORY=FAULTS (Page fault rate for dierent object types )
Code Meaning
T
P
S
C
D
F
L
Transient objects (program heaps, etc.).
Permanent objects (not normally faulted).
Data Stacks (NM + CM).
Code (NM + CM).
Data objects.
Files.
Library code (NM + CM).
Customizing HP GlancePlus
7-3
Customizing Configuration
HP GlancePlus for MPE/iX comes ready to use. Although it is congured with
a selection of carefully tested defaults, you might want to change those settings
in certain situations. For example, if the interesting process thresholds cause
too many or too few processes to display on the Global screen, you might want
to adjust the thresholds to match the activity on your system.
You can change GlancePlus parameters in several ways. Some ways are local
to a particular execution of GlancePlus, such as using the V (Option Values)
command to change interesting process thresholds. Other ways carry forward
from one execution to another within the same job or session.
You can set job control words (JCWs) to have GlancePlus remember settings
within the same job or session. You can also set a JCW using the V command
to allow you to run GlancePlus again from the same job or session using those
values. You can also set JCWs external to GlancePlus|for example, GLANCE
user-dened commands (UDCs) can start GlancePlus with specic values each
time the UDC is used.
You can set the default GlancePlus parameter values for the entire system by
changing the GLANCNFG conguration le. If a le named GLANCNFG
already exists in the same group and account as the GLANCEXL program,
it will be examined for default parameters. You will be allowed to set some
parameters only via the GLANCNFG le (parameters such as controlling which
users may execute the QZAP command).
The GLANCNFG le contains additional information, such as the global
rules for the Expert facility and, sometimes, the denitions for user-dened
applications used by the Filter and Workload screens. (If you also own
the HP LaserRX/MPE or HP GlancePlus Pak programs, application
denitions will probably be found in the PARM.SCOPE.SYS le.) See the HP
Performance Collection Software manual for more details.
7-4
Customizing HP GlancePlus
Since you can set parameters in several ways, it is important to understand
what happens if you use more than one way. The hierarchy for setting
parameter values is usually:
Program Defaults
which can be overridden by . . .
GLANCNFG File
which can be overridden (in most cases) by . . .
Job Control Words
which can be overridden by . . .
Value Command Changes
The following table lists the changeable parameters, their default values, and
the key words used to set them. Detailed descriptions of these parameters
follow the table:
Table 7-1. Changeable Default Parameters
Interesting Process Thresholds:
Values
Job Control
GLANCNFG File
Default
Command
Word
Keyword
Value
MinCPU
GLANCEMINCPU
THRESHOLD MINCPU
1 Percent
CPU
GLANCECPU
THRESHOLD CPU
10 Percent
DISC
GLANCEDISC
THRESHOLD DISC
10 IOs/Second
RESP
GLANCERESPONSE
THRESHOLD RESP
5 Seconds
TRANS
GLANCETRANS
THRESHOLD TRANS
10 Trans/Min
NEW
GLANCENEW
THRESHOLD NONEW
YES (show)
DIED
GLANCEDIED
THRESHOLD DIED
YES (show)
WAITIMPEDE
GLANCEWAITIMP
WAIT IMPEDE
50 Percent
WAITCPU
GLANCEWAITCPU
WAIT CPU
50 Percent
WAITDISC
GLANCEWAITDISC
WAIT DISC
50 Percent
WAITMEM
GLANCEWAITMEM
WAIT MEMORY
50 Percent
Customizing HP GlancePlus
7-5
Display Control Parameters:
Values
Job Control
GLANCNFG File
Command
Word
Keyword
FILEDISP
Default
Value
GLANCEFILEDISP
FILEDETAIL
DETAIL
PROCKEYS
GLANCEPROCKEYS
PROCKEYS
DEMAND
DISPCPU
GLANCEDISPCPU
DISPLAY CPU=
INTER-BATCH
GLANCEDISPMEM
DISPLAY MEMORY=
CONTENTS
DISPMEMORY
n/a
GLANCECLEARSCREEN CLEARSCREEN ON/OFF OFF
Expert Facility:
Values
Job Control
GLANCNFG File
Default
Command
Word
Keyword
Value
XPERT
GLANCEXPERT
XPERT
DEMAND
XLEVEL
GLANCEXLEVEL
XLEVEL
LOW
Additional Parameters:
Values
Job Control
GLANCNFG File
Default
Command
Word
Keyword
Value
n/a
n/a
XPERT
ANY
n/a
n/a
QZAP
SM
n/a
n/a
QZAPSYS
NONE
REFRESH
30 Seconds
I, T, 4f55
7-6
GLANCETIME
Customizing HP GlancePlus
Interesting Process Thresholds
Interesting process thresholds, set on the Global and Filter screens, allow you
to select processes to be displayed and elds to be highlighted.
The MINIMUM CPU parameter determines the minimum amount of CPU time a
process must consume in order to be displayed.
DEFAULT:
1 percent
GLANCNFG: THRESHOLD MINCPU=percent
JCW:
SETJCW GLANCEMINCPU=percent
VALUES:
MinCPU=percent
The CPU parameter determines how much CPU time a process must consume to
be displayed with its CPU eld highlighted.
DEFAULT:
10 percent
GLANCNFG: THRESHOLD CPU=percent
JCW:
SETJCW GLANCECPU=percent
VALUES:
CPU=percent
The DISC parameter determines what disc IO rate a process must perform in
order to be displayed with it's DISC eld highlighted.
DEFAULT:
10 IOs/second
GLANCNFG: THRESHOLD DISC=percent
JCW:
SETJCW GLANCEDISC=iopersec
VALUES:
DISC=iopersec
Customizing HP GlancePlus
7-7
The RESPONSE TIME parameter determines what terminal-response time a
process must exceed in order to be displayed with its response-time eld
highlighted.
DEFAULT:
5 seconds
GLANCNFG: THRESHOLD RESP=seconds
JCW:
SETJCW GLANCERESP=seconds
VALUES:
RESP=seconds
The TRANSACTIONS parameter determines the terminal-transaction rate that a
process must exceed in order to be displayed with its transaction-rate eld
highlighted.
DEFAULT:
10 transactions/minute
GLANCNFG: THRESHOLD TRANS=transpermin
JCW:
SETJCW GLANCETRANS=transpermin
VALUES:
TRANS=transpermin
The NEW (or NONEW ) parameter determines whether or not processes that are
newly created are displayed with their names highlighted.
DEFAULT:
(New processes are displayed and highlighted.)
GLANCNFG: THRESHOLD NONEW (Species to not highlight new processes.)
JCW:
SETJCW GLANCENEW=1 (Species to not highlight new processes.)
SETJCW GLANCENEW=0 (Species to highlight new processes.)
VALUES:
NEW=YES or NEW=NO (YES means to highlight new processes.)
7-8
Customizing HP GlancePlus
The DIED (or NODIED) parameter determines whether or not processes that
terminate are displayed with the process priority eld highlighted as DIED.
DEFAULT:
(Terminated processes are displayed and highlighted.)
GLANCNFG: THRESHOLD NODIED (Species to not highlight processes that
died.)
JCW:
SETJCW GLANCEDIED=1 (Species to not highlight processes that
died.)
SETJCW GLANCEDIED=0 (Species to highlight processes that
died.)
VALUES:
DIED=YES or DIED=NO (YES means to highlight processes that
died.)
The WAIT ON IMPEDE parameter determines when a process should be
displayed and its WAIT eld highlighted due to excessive waiting on software
locks, latches, and other synchronization events.
DEFAULT:
50 percent
GLANCNFG: WAIT IMPEDE=percent
JCW:
SETJCW GLANCEWAITIMP=percent
VALUES:
WAITIMPEDE=percent
The WAIT ON CPU parameter determines when a process should be displayed
and its WAIT eld highlighted due to excessive waiting on access to the CPU.
DEFAULT:
50 percent
GLANCNFG: WAIT CPU=percent
JCW:
SETJCW GLANCEWAITCPU=percent
VALUES:
WAITCPU=percent
Customizing HP GlancePlus
7-9
The WAIT ON DISC parameter determines when a process should be displayed
and its WAIT eld highlighted due to excessive waiting on data transfers to or
from disc drives.
DEFAULT:
50 percent
GLANCNFG: WAIT DISC=percent
JCW:
SETJCW GLANCEWAITDISC=percent
VALUES:
WAITDISC=percent
The WAIT ON MEMORY parameter determines when a process should be
displayed and its WAIT eld highlighted due to excessive waiting on main
memory resources.
DEFAULT:
50 percent
GLANCNFG: WAIT MEMORY=percent
JCW:
SETJCW GLANCEMEM=percent
VALUES:
WAITMEM=percent
7-10
Customizing HP GlancePlus
Display Control Parameters
Display control parameters control the actions of various GlancePlus display
screens.
The FILE DETAIL DISPLAY parameter determines whether the display of les
opened by a process on the PROCESS screen is in detailed (one open le per line)
or simple (four les per line) format.
DEFAULT:
DETAIL
GLANCNFG: FILEDISP SIMPLE or FILEDISP DETAIL
JCW:
SETJCW GLANCEFILEDISP=0 (for detailed ) or
SETJCW GLANCEFILEDISP=1 (for simple )
VALUES:
FILEDISP=SIMPLE or FILEDISP=DETAIL
The PROCESS KEYS parameter determines whether or not the OPEN FILES and
PROCESS FAMILY commands show only one display on the Process screen each
time they are requested (on demand) or toggle between no display and continuous
display (continuous).
DEFAULT:
DEMAND
GLANCNFG: PROCKEYS DEMAND or PROCKEYS CONTINUE
JCW:
SETJCW GLANCEPROCKEYS=0 (for demand ) or
SETJCW GLANCEPROCKEYS=1 (for continue )
VALUES:
PROCKEYS=CONTINUE or PROCKEYS=DEMAND
Customizing HP GlancePlus
7-11
The CLEAR SCREEN parameter determines whether old display data is always
erased before a new display begins (CLEARSCREEN ON) or whether some screens
scroll previous process data down allowing the current data to be compared
against previous data.
DEFAULT:
OFF
GLANCNFG: CLEARSCREEN ON or CLEARSCREEN OFF
JCW:
SETJCW GLANCECLEARSCREEN=0 (for o ) or
SETJCW GLANCECLEARSCREEN=1 (for on )
VALUES:
(This parameter cannot be changed using the VALUES command.
The DISPLAY CPU parameter determines what type of display is used for the
GLOBAL CPU bar at the top of each screen. INTER-BATCH divides the CPU bar
by the type of processes using it (SYSTEM, INTERACTIVE, and BATCH), while
QUEUE divides the CPU bar based on the priority of the processes (A, B, C, D, E).
DEFAULT:
INTER-BATCH
GLANCNFG: DISPLAY CPU=INTERBATCH or DISPLAY CPU=QUEUE
JCW:
SETJCW GLANCEDISPCPU=0 (for inter-batch ) or
SETJCW GLANCEDOSPCPU=1 (for queue )
VALUES:
DISPCPU=INTER-BATCH or
DISPCPU=QUEUE
The DISPLAY MEMORY parameter determines what type of display is used for
the GLOBAL MEMORY bar at the top of each screen. CONTENTS displays how
much of main memory is occupied by dierent types of objects. FAULTS shows the
rate at which dierent objects are being requested to be brought into main
memory (faulted into memory).
DEFAULT:
CONTENTS
GLANCNFG: DISPLAY MEMORY=CONTENTS or
DISPLAY MEMORY=FAULTS
7-12
JCW:
SETJCW GLANCEDISPMEM=0 (for contents ) or
SETJCW GLANCEDISPMEM=1 (for faults )
VALUES:
DISPMEMORY=CONTENTS or
DISPMEMORY=FAULTS
Customizing HP GlancePlus
The Expert Parameters
The Expert parameters control the operation of the Expert Facility.
The EXPERT MODE parameter controls whether the Expert facility examines
the system automatically every time the display is updated (continuous mode) or
is available only after typing the X command (on demand).
DEFAULT:
DEMAND
GLANCNFG: XPERT DEMAND or XPERT CONTINUOUS
JCW:
SETJCW GLANCEXPERT=0 (for demand ) or
SETJCW GLANCEXPERT=1 (for continuous )
VALUES:
XPERT CONTINUE or XPERT DEMAND
The EXPERT LEVEL parameter controls whether the Expert facility is working
at a low level of detail (no process) or at high detail (including processes) and
slightly higher overhead. See chapter 6 on the Expert facility for information on
how to set this parameter.
DEFAULT:
LOW
GLANCNFG: XLEVEL LOW or XLEVEL HIGH
JCW:
SETJCW GLANCELEVEL=1 (for low ) or
SETJCW GLANCELEVEL=2 (for high )
VALUES:
XLEVEL=LOW or HIGH
Customizing HP GlancePlus
7-13
Additional Parameters
The EXPERT USERS parameter can control which users are allowed to use the
Expert facility (who can execute X commands or utilize continuous mode).
DEFAULT:
ANY (Any user may use the Expert facility.)
GLANCNFG: XPERT SM, OP, AM, ANY (or any combination to allow users
with SM, OP, AM capabilities or ANY user to use the Expert
facility.)
XPERT NONE (Prevents all users from accessing the Expert
facility.)
JCW:
(This capability is not accessible through Job Control Words.)
VALUES:
(This capability is not accessible through any GlancePlus
commands.)
The QZAP parameter is only allowed in the GLANCNFG le. It can control
which users are allowed to execute the QZAP command to change the priority of a
process, job, or session.
DEFAULT:
SM (Only system managers may execute the QZAP command.)
GLANCNFG: QZAP SM (Only system managers may execute the QZAP
command.)
QZAP OP (System operators|or users with OP capability|may
execute the QZAP command but not into or out of the B or linear
queues.)
QZAP NONE (No user may execute the QZAP command.)
The QZAPSYS parameter is only allowed in the GLANCNFG le. It controls
which users are allowed to execute the QZAP command against system processes.
Combinations of OP and SM are allowed in this parameter. Care must be taken
when adjusting system process priorities since this might degrade performance,
cause errors, or even hang or crash the system.
DEFAULT:
NONE (No user may QZAP a system process.)
GLANCNFG: QZAPSYS SM and/or OP (To allow users with SM and/or OP caps.)
7-14
Customizing HP GlancePlus
The REFRESH TIME parameter determines how many seconds between
automatic updates of the GlancePlus display.
DEFAULT:
30 seconds
GLANCNFG: REFRESH seconds
JCW:
SETJCW GLANCETIME=seconds
VALUES:
Not used. Use the I (Interval ) or T (Time ) command, or press
4f55.
GlancePlus Configuration File: Security
The GlancePlus conguration le enables certain capabilities and contains vital
global conguration options. Because of this, a user is not allowed to use le
equations to utilize an alternate conguration le.
If GlancePlus is installed in the PUB.SYS group and the default access is still
in eect, any user who can log on in the PUB.SYS group has the capability
to change the conguration le. You may want to restrict write and append
access to MANAGER.SYS via the ALTSEC command to further protect the
le from unauthorized modication.
Configuring the Expert Facility
Many parts of the GlancePlus Expert facility can be customized by editing the
GLANCNFG le. Be careful when making changes because they will aect
the Expert facility's recommendations when you use it. Two main areas of
the Expert facility can be congured: The highlighting of key metrics on
GlancePlus screens, and the performance recommendations made by the X
command.
Customizing HP GlancePlus
7-15
Highlighting Metrics
You can change the points where the Expert facility highlights metrics on
GlancePlus screens by adding one or more lines to the GLANCNFG le. These
added lines should have the following syntax:
HIGHLIGHT hitem=newvalue
where hitem is one of the items shown in the following table, and newvalue is
the desired value for that item. The hitem eld must be entered exactly as
shown|uppercase and underscore characters are required.
Table 7-2. GlancePlus Highlighting Characteristics
Hitem
CPU_PROC
CPU_FOPEN
CPU_DISPQ
Default
Description
20 CPU usage in compatibility mode (percentage of total).
500 Switches from compatibility mode to native mode
(switches/second).
500 Switches from native mode to compatibility mode
(switches/second).
1
5 Rate of le opens (opens/second).
10 Number of processes in the dispatcher queue.
DISC_UTIL
DISC_SERV
80 Individual disc drive usage (percentage of total).
0.0500 Service time for an individual disc (seconds).
CPU_CM
CPU_SW_CM
CPU_SW_NM
MEM_CPU
MEM_PFAULTS
MEM_CLOCK
MEM_LIBFAULT
PROC_CPUSEC
PROC_CM
PROC_SWCM
PROC_SWNM
7-16
8
30
25
2
CPU usage managing main memory (percentage of total).
Memory page faults (faults/second).
Memory clock cycles.
Memory page faults on library code (faults/second).
3600 Time of total CPU usage by a process (seconds).
80 CPU usage in compatibility mode by a process (percentage
of total).
100 Switches from compatibility mode to native mode by a
process (switches/second).
100 Switches from native mode to compatibility mode by a
process (switches/second).
Customizing HP GlancePlus
Table 7-2. GlancePlus Highlighting Characteristics (continued)
Hitem
APPL_CPU
APPL_DISC
APPL_TRANS
Default
Description
20 CPU usage by an application (percentage of total).
50 Disk I/O rate by an application (IOs/second).
120 Transaction rate by an application (transactions per minute).
Performance Recommendations
The second area in which the Expert facility can be customized consists of the
rules by which Expert facility accesses a system's overall performance|also
known as low level analysis.
The Expert facility denes a set of symptoms wherein each symptom represents
a particular performance situation. A set of rules dene the conditions that
increase the probability that a particular symptom is true. (Computer
scientists might recognize the use of fuzzy logic , a technique in which a
condition doesn't have to be clearly true or false, but might be \a little bit
true" or \very much true.") Basically, the rules consist of comparisons between
two items with an accompanying probability value. If the rule is true, the
probability that the symptom is also true increases by the rule's probability
value.
Items are formed either by using constants or by selecting them from a list
of available performance indicators supplied by GlancePlus at each interval.
Items may also be combined into user-dened variables. The syntax for this
section of the GLANCNFG le is described below. For an example of the CPU
bottleneck rules, see below or examine the GLANCNFG le.
VAR A = TOTAL CPU - BATCH CPU "INTERACTIVE"
SYMPTOM "GLOBAL CPU
RULE VAR A
> 70
RULE VAR A
> 80
RULE VAR A
> 90
RULE CPU QUEUE > 3
BOTTLENECK" TYPE=CPU
PROBABILITY 25
PROBABILITY 25
PROBABILITY 25
PROBABILITY 75
Customizing HP GlancePlus
7-17
To dene a user variable, express the following:
2
3
2
3
VAR A . . . Z = itemid +,-,3,/ itemid mnemonic
Twenty-six variables can be dened (VAR A through VAR Z). The denition
of one variable may include another item but only if that variable has a lesser
name alphabetically. For example, VAR B can include VAR A, but not VAR
C. The mnemonic is the name used to represent this variable when the Expert
facility prints out reasons to the user.
To dene a symptom, express the following:
SYMPTOM symptom name TYPE=symptomtype
where symptomtype can be one of the following: CPU, DISC, MEMORY,
IMPEDE, SWITCH, CM, RESPONSE, or OTHER.
One or more rules dening when the symptom occurs should follow each
symptom. The syntax for dening a rule is:
RULE itemid comparison itemid PROBABILITY percent
where itemid can be a constant, a user variable, or one of the GlancePlus
performance indicator mnemonics.
>
<
>=
<=
(greater than )
(lesser than )
(greater than or equal to )
(lesser than or equal to )
Percent is a value from -100 to 100.
Comparison is
You may dene as many as 50 symptoms and 100 rules at one time.
GlancePlus performance indicators are dened below.
7-18
Customizing HP GlancePlus
Table 7-3. GlancePlus Performance Indicators
Indicator
TOTAL CPU
SYSTEM CPU
SESSION CPU
BATCH CPU
MEM MGR CPU
DISPATCH CPU
OTHER CPU
CPU PAUSED
IDLE CPU
PHYS DISC
SYSTEM DISC
SESSION DISC
BATCH DISC
MEM MGR DISC
LOGICAL DISC
DISC UTIL
Description
Total CPU usage in the interval (percentage of available).
CPU usage by system processes (percentage of total).
CPU usage by interactive session processes (percentage of total).
CPU usage by batch job processes (percentage of total).
CPU usage to manage main memory (percentage of total).
CPU usage used in dispatching processes (percentage of total).
CPU usage for other reasons (percentage of total).
Time CPU was idle but disc IO occurred (percentage of total).
Time CPU was idle and disc IO did not occur (percentage of
total).
Total physical disc IO rate (IOs/second).
Physical disc IO rate by system processes (IOs/second).
Physical disc IO rate by interactive sessions processes
(IOs/second).
Physical disc IO rate by batch job processes (IOs/second).
Physical disc IO rate to manage main memory (IOs/second).
Logical disc IO rate (IOs/second).
Average usage of all disc drives (percentage).
TRANSACT/MIN Rate of terminal transactions completed (transactions/minute).
FIRST RESP
RESPONSE
Average time to rst terminal response (seconds).
Average time to terminal prompt (seconds).
Customizing HP GlancePlus
7-19
Table 7-3. GlancePlus Performance Indicators (continued)
Indicator
Description
PEAK LOGL IO Logical disc IO rate for busiest disc drive (IOs/second).
PEAK PHYS IO Physical disc IO rate for busiest disc drive (IOs/second).
PEAK MEM IO
PEAK UTIL
Physical disc IO rate for memory manager on busiest disc drive
(IOs/second).
Usage of busiest disc drive on system (percentage of total).
Average number of processes using or waiting for CPU.
DISC QUEUE
Average number of processes waiting on disc I/O.
MEMORY QUEUE Average number of processes waiting on main memory.
IMPEDE QUEUE Average number of processes waiting on locks, impedes, etc.
CM CPU
Average time spent in compatibility mode (percentage).
NM CPU
Average time spent in native mode (percentage).
CM SWITCHES Rate of switches from native mode to compatibility mode
(switches/second).
NM SWITCHES Rate of switches from compatibility mode to native mode
(switches/second).
CPU QUEUE
TOTAL MIPS
7-20
Relative processor speed (millions of internal clock cycles per
second).
Customizing HP GlancePlus
A
Multiprocessor Systems
In addition to single-processor systems, MPE now supports multiprocessor
systems|systems that have more than one processor (CPU) board. To
determine if you have a multiprocessor system, examine the banner line of the
GlancePlus Global screen. If more than one processor is congured, the total
number of congured processors will be displayed in the area to the right of
the word \Global." If this area is blank, your system has only one processor
congured.
The following is an overview of how GlancePlus presents CPU metrics on a
multiprocessor system.
Global CPU bars and their associated percentages are presented relative to all
processors on the system. Any process CPU metric is presented relative to a
single processor. For example, if a two- processor system has only one active
process that constantly consumes CPU, then the Interesting Process section of
the Global screen will show 100% CPU for that process. The Global CPU bar
will display 50% (100% divided by the number of processors). If that same
system had two processes constantly consuming the CPU, then each process
would show 100% CPU and the Global CPU bar would display 100% (100%
plus 100%, divided by the number of processors).
Screens that represent groups of processes (the Job, Session, Filter, and
Workload screens) present their data as follows: CPU bars and their associated
percentages are displayed relative to all processors. CPU-seconds are displayed
relative to a single processor. For example, a Job screen showing a job with
one process constantly using the CPU would display the JOB CPU bar at 50%
(just like the Global bar). The CPU total-seconds would increment at the same
rate as clock time. The process in this display would still show CPU usage at
100% since it is displayed relative to a single processor.
These choices of design for presenting CPU usage represent tradeos. It
is useful to present process CPU usage relative to a single processor since
Multiprocessor Systems
A-1
other MPE sources such as the system log les, the REPORT command, the
SHOWME command, and log-o statistics also present CPU usage relative
to a single processor. It is advantageous to represent CPU-seconds on the
Job, Session, and Filter screens relative to a single processor so they can be
compared properly to other MPE sources. In addition, it is useful to scale
the CPU bars between 0 and 100% of the total processing power of the
system, or relative to all processors. By doing this, 100% means that the total
CPU power of the system is utilized completely, regardless of the number of
processors utilized.
The tradeo for these advantages is the need to be able to understand that it is
reasonable for a two-processor system to have a Global CPU bar showing 100%
usage and two processes in the interesting process section each using 100% (of
a single processor). The user must understand the dierence between Global
CPU bar and individual process presentations. Once this is understood, the
user need not consider the number of CPUs in use to easily understand how
CPU-intensive each process is and how much total processing power is in use.
A-2
Multiprocessor Systems
B
Wait Reasons|Expanded Definitions
A process will be suspended if it cannot access a resource or it must wait for
another event to be completed. Although a process's wait reason can pass
through many dierent states between refresh intervals, HP GlancePlus reports
the state at the instant the process is displayed.
The following WAIT reasons occur for MPE/iX:
BREK
CONS
CPU
DBMS
DISC
FATH
IMP
I/O
MEM
MISC
MSG
OTHR
PAUS
RIN
SEM
SIR
SON
TERM
The specic WAIT REASONS can be dened as follows:
BREK The process is waiting to be resumed from a BREAK. For instance,
if a user who is running a program presses the 4Break5 key and receives
the colon (:) prompt, that process will show up in a BREK wait.
CONS The process is waiting for a reply from the console operator. A
typical example would be a STORE with an outstanding tape
request at the console.
Wait Reasons|Expanded Definitions
B-1
CPU
DBMS
DISC
FATH
IMP
I/O
B-2
The process is waiting to use the central processing unit. On busy
systems, higher priority processes can consume all of the available
CPU resources while lower priority processes must wait. The PRI
column displays the queue and priority number of a process. On
extremely busy systems, a low priority batch job (high PRI number)
can remain in a CPU wait state while all available CPU resources are
consumed by higher priority processes (lower PRI number).
When SQL applications are running with multiple users, the
database monitor process (DBMON) will stay in the DBMS wait
state during periods of inactivity. This wait state is unique to
MPE/iX SQL applications.
When TurboIMAGE applications request a lock, the process will be
semaphore waited (SEM).
The process is waiting for the completion of a read to a le or write
to a le. This does not include memory manager I/O, which is
accounted for in the MEM wait category. On MPE/iX systems,
main memory is used to buer I/O requests; this greatly reduces the
amount of time a process waits on DISC.
The son process is waiting for its father to reawaken it. When one
process creates a second process, the rst process is referred to as the
father and the second process as the son . The father process has the
capability of starting and stopping the son process.
The process is impeded. This wait state is used for a variety of
reasons.
On MPE/iX systems, processes using databases make use of the
DBMS wait state.
The process is waiting for the completion of nondisc I/O, such as
from magnetic tape. Disc I/O (DISC) and terminal I/O (TERM)
have separate wait states and are not included in this category.
Wait Reasons|Expanded Definitions
MEM
MISC
MSG
OTHR
PAUS
RIN
The process is waiting for library code, program code, data, or any
combination of the three to be brought into memory. Since it would
be wasteful for a large process to fully occupy main memory, the
process is broken up into smaller pieces, referred to as pages. As
these segments or pages of memory are needed, they are brought into
main memory from disc and the process must memory (MEM) wait.
It is normal to nd a process in this state occasionally. Finding
a single process in memory wait state repeatedly, however, can
be caused by poor locality|the process's logic is forcing it to
continually branch to other segments or pages. Finding multiple
processes in this state can indicate a lack of main memory. As the
demand for memory outstrips the supply, the operating system must
use a process's main memory for other, higher priority processes.
The process is waiting for an unspecied wait state and is
accumulated under this general category. HP GlancePlus reports
seldom-used wait states in this category.
The process is waiting to receive a message. To synchronize internal
operations, some operating system processes communicate by
sending internal messages to one another. MPE message le waits,
RECEIVEMAIL intrinsic waits, and interprocess communication
(IPC) waits are examples of user-generated message wait state.
The process is waiting for an unspecied wait state called OTHR,
which excludes all of the other wait states. OTHR appears as an (O)
in the wait reasons and the wait-state bar in the Process display.
The application program calls the PAUSE intrinsic, which delays the
program for a user-specied length of time. The program is currently
waiting for this time to elapse before continuing.
Specic resources can be shared by a set of processes. MPE provides
users with a RIN (resource identication number) facility to prevent
two processes from using a shared resource at the same time. When
one process locks a specic RIN, a second process wanting to lock the
same RIN will wait. A RIN wait applies to both global and local
RINs. RINs are also used to lock MPE/iX les.
Wait Reasons|Expanded Definitions
B-3
SEM
SIR
SON
TERM
B-4
The process is waiting for a software semaphore or ag other than
those specied by SIR and RIN wait categories.
To maintain consistency, certain operating system functions are
performed serially by a single process. To enforce this access pattern,
a software resource called a SIR is obtained before the critical
function is performed. SIRs are internally-used MPE resources and
are not available to users directly.
The father process is waiting to be reawakened by its son process.
When one process creates a second process, the rst process is
referred to as the father and the second as the son . The father
process has the capability of starting the son and continuing to
process, or starting the son and waiting until it is reawakened by the
son.
The process is waiting for the completion of a terminal read.
Wait Reasons|Expanded Definitions
C
Detailed WAIT Reasons
Table C-1. Detailed WAIT Reasons
Reason
NM Code
NM Stack
NM Trans
FPgFault
CM Code
CM Stack
CM Trans
TermRead
TermWrit
Disc IO
Other IO
Preemptd
SIR Wait
RIN Wait
MemMgrPF
QuantExp
Paused
Father
CtrlBlck
Son
DataComm
Console
Dspatchr
Description
NM Code Fault.
NM Stack Fault.
NM Trans Fault.
File Page Fault.
CM Code Fault.
CM Stack Fault.
CM Trans Fault.
Terminal Read Wait.
Terminal Write Wait.
Disc I/O Wait.
Other I/O Wait.
Preempted (CPU).
SIR.
RIN Wait.
Memory Manager Prefetch.
Quantum Expired.
Timer Wait.
Wait for Parent.
Control Block Wait.
Wait for Child.
Data Comm Wait.
RIT (Console Reply) Wait.
Wait for Dispatcher (Disp Work).
Reason
PortWait
MailWait
JunkWait
Message
Impeded
Break
Queue
Mem Mgmt
PortMake
Blocked
Unblocked
Stor Mgr
DebugMsg
IO Confg
PFPReply
DB Mon
DiscFill
HL IO
FSTermIO
MemMgrPW
SignlTmr
Other
Description
Port Wait.
Mail Wait.
Junk Wait.
Message Wait.
Impeded.
Wait for Break.
Wait for Queue.
Wait for Memory Management.
Port Blocked Make Present.
Wait for Blocked File.
Wait for Unblocked File.
Wait for Storage Manager.
Wait for Debug Message to User.
Wait for I/O Conguration.
Wait for port facility process (PFP)
Reply.
Wait for data base (DB) Monitor.
Wait for Disc Fill Operation.
Wait for High Level I/O.
Wait for File System Terminal I/O.
Memory Manager Post Wait.
Signal Timer Wait.
Other Wait Reason.
Detailed WAIT Reasons
C-1
D
Application Definition Files
The GlancePlus Workload screen and appropriate Filter commands allow you
to utilize user-dened applications. These are the same denitions as those
used by the HP LaserRX/MPE and GlancePlus Pak for MPE/iX products.
You can use any one of the following as an application denition le:
GlancePlus conguration le (GLANCNFG.PUB.SYS).
LaserRX or GlancePlus Pak Parm le (PARM.SCOPE.SYS).
Any other le that contains valid application denitions.
GlancePlus scans the GLANCNFG le, automatically, every time it is
executed. If application denitions are not found, it attempts to open
PARM.SCOPE.SYS. If you want to use a le other than the ones GlancePlus
opens, select it by using the APPL keyword in the Filter or Value command.
If no applications are dened in the GLANCNFG le, you may le equate
PARM.SCOPE.SYS to an application denition le of your choice before
starting GlancePlus. Then it will begin with the desired application denitions.
Read access is usually required before a user is allowed to read a le
containing application denitions. Since the default access for ANY user to
PARM.SCOPE.SYS is \execute only," GlancePlus will be able to read it as
long as it has execute access. Note that read access is required for GlancePlus
to read GLANCNFG.
Application Definition Files
D-1
Application Definition Syntax
The following information describes the syntax used to dene an application
and gives several examples of application denitions.
APPLICATION
8
2
FILE= lename
application name
3
2
INTERACTIVE= lename
2
BATCH= lename
3
3
2
USER= job/session name,
2
9
QUEUE execution priority
38
username.acctname
92
,groupname
3
3
OR
where:
The application name parameter identies an application that groups multiple
program les together and reports on their combined activities. The application
name is a string of up to 20 characters identifying that application.
One or more application denitions should follow the APPLICATION
command. An application denition consists of combinations of FILE,
INTERACTIVE, BATCH, USER, or QUEUE parameters.
The OR parameter is used to separate multiple denitions for the same
application.
All application denitions apply to the last APPLICATION command entered.
D-2
Application Definition Files
The parameters for application denitions fall into three categories:
File name:
FILE
INTERACTIVE
BATCH
User logon:
Execution priority:
USER
QUEUE
If a parameter from a category is used in an application denition, a process
will not belong to that application unless a match for that category is made.
If no parameters in a category are used in an application denition, then a
process does not have to match that category.
For example, there can be any number of FILE and USER parameters
following an APPLICATION directive, but if there is no QUEUE parameter,
a process could belong to any queue and still belong to the application. It
would have to match at least one of the FILE parameters and one of the USER
parameters.
Or, as another example, if an application consisted of USER and QUEUE
parameters but had no FILE, INTERACTIVE, or BATCH parameters, then
any program le name could belong to the application as long as the user logon
and execution queue matched one of the USER and QUEUE specications.
Use the OR parameter when you want more than one application denition to
apply to the same application.
You can dene up to 15 applications on MPE V and 31 applications on
MPE/iX. GlancePlus predenes an application called OTHER that collects all
processes not dened by APPLICATION directives in the application denition
le.
If a process le is included in more than one application, it is logged in the rst
application in which it is dened.
APPLICATION=Order Processing
FILE=@[email protected],@[email protected],@[email protected]
APPLICATION=Office Products
[email protected],@.ELECTRON.OFICPROD
Application Definition Files
D-3
Since @[email protected] is included in Order Processing, any programs in
@.FURNITUR.OFICPROD or @.ELECTRON.OFICPROD will be logged in
the Order Processing application, not in Oce Products. However, if the order
of the applications is reversed, any programs in the groups FURNITUR and
ELECTRON in the OFICPROD account will be logged in the Oce Products
application, not in Order Processing.
By default, no user applications are dened.
Note
Since any process on the system can belong to only one
application, no process will be counted in more than one
application. The application denition le is processed in
the order entered, and the rst match of a program name,
user logon, and queue will dene the application to which a
particular process belongs.
FILE
The FILE=lename parameter species which program les belong to an
application. It includes all interactive or batch executions of these programs
and applies to the last APPLICATION directive issued. An error is generated
if no APPLICATION directive is found.
The lename can be any of the following:
A simple, fully qualied MPE le name. For example,
EDITOR.PUB.SYS
A generic le name. For example,
VOODOO#.@.@
A partially-qualied le name. For example,
SPOOK5
In this case, all groups and all accounts are assumed (SPOOK5.@.@).
Multiple le names can be entered on the same line, separated by commas, or
in separate FILE parameters.
D-4
Application Definition Files
INTERACTIVE
The INTERACTIVE=lename parameter acts the same as the FILE
parameter except it signies that only interactive executions of the program
(sessions) are included in the application class.
BATCH
The BATCH=lename parameter acts the same as the FILE parameter except
it signies that only batch executions of a program (jobs) are included in the
application class.
USER
The USER=[job/sessionname,]fusername.acctname g[,group ] parameter
identies the job or session, user, account, and group to be included in the
application class.
job/session name,
The job/session name is an optional part of a user logon that can be used
for identication. If this parameter is included, it must be terminated by a
comma. If this parameter is not supplied, all job/session names are matched.
username
The username species the name of the user as dened by the MPE
accounting structure.
acctname
The accountname species the name of the logon account as dened by the
MPE accounting structure.
group
The groupname species the logon group of a particular job or session. It is
optional, but if it is included, it must be preceded immediately by a comma.
If this parameter is not supplied, all logon group names are matched.
Application Definition Files
D-5
Note
Since commas are allowed within the parameter string in the
USER parameter, they cannot be used to separate one logon
string from another. You must use another character (such as a
space) to separate parameters or use a separate USER line for
each logon.
QUEUE
Usually, the execution priority of a process is CS, DS, or ES. Special accounts
can log on or run programs with ;PRI=BS, whereas privileged mode and
system processes can place themselves in the AS or linear queues. (Linear
queue can be any priority you want, but it is not subject to the normal priority
adjustments of the MPE dispatcher.)
You can restrict processes in an application to those belonging to selected
execution priority queues using the QUEUE [L,A,B,C,D,E] . . . parameter.
More than one queue can be indicated. The following example species any
process running in either the DS or ES queue:
QUEUE=D,E
Note
The AS and BS queues are special cases of the linear execution
queue. If you specify QUEUE=L then processes executing as
AS or BS priority are included. Specifying QUEUE=A,B is not
the same as specifying QUEUE=L since the linear queue can
be outside the range of the A and B queues.
A process with process-handling capabilities can change its execution queue as
it runs. A process's execution priority can be altered also by an external tool,
such as HP GlancePlus.
The process execution queue is sampled at the end of each 1-minute sample
interval. If the process has changed queue, it can change applications. All
activity for a process during the 1-minute sample interval is assumed to have
occurred in the new queue and as such is attributed to the application that
matches the process at the end of each 1-minute sample interval.
D-6
Application Definition Files
OR
Use the OR parameter to allow more than one application denition to apply
to the same application. Within a single application denition, a process must
match at least one of each category of parameters. Parameters separated by
the OR parameter are treated as independent denitions. If a process matches
the conditions for any denition, it will belong to the application, as in the
following example:
APPLICATION=CONSOLE
USER=OPERATOR.SYS
OR
USER=MANAGER.SYS
FILE=STORE.PUB.SYS,SYSDUMP.PUB.SYS
This denes an application (CONSOLE) that consists of any programs
run by the user OPERATOR.SYS plus two programs (STORE.PUB.SYS and
SYSDUMP.PUB.SYS), if they are executed by the user MANAGER.SYS .
Sample Application Definition
The following is an example of how an application can be dened:
APPLICATION=Program Development
INTERACTIVE=EDITOR.PUB.SYS, QEDIT.@.@, VOODOO#, TDP
[email protected] @.@,TESTGROUP LABTEST,@.@
APPLICATION=Other Editors
FILE=EDITOR.PUB.SYS, QEDIT.@.@, VOODOO#, TDP
APPLICATION=Compilers
[email protected],FORTRAN.PUB.SYS,[email protected]
FILE=PASCAL.PUB.SYS, SPL.PUB.SYS, RPG.PUB.SYS
APPLICATION=HP Products
[email protected]
Application Definition Files
D-7
The following is an example of how programs would be logged using the
preceding application denition le:
Program
User Logon
Application
EDITOR.PUB.SYS
GERRY.TEST Program Development
EDITOR.PUB.SYS
SAM.SNEED Other Editors
HPSLATE.PUB.SYS
SAM.SNEED HP Products
PASCAL.PUB.SYS
GERRY.TEST Compilers
EDITOR.UTIL.SYS
GERRY.TEST OTHER
If the HP Products application in the previous example was dened rst, the
rst four examples would belong to it.
D-8
Application Definition Files
Index
A
aaa4#5 key, 3-10, 4-1
aaa4:5 key, 3-10, 3-15, 4-2, 5-4, 5-11,
5-25
aaa4<5 key, 3-10, 4-4
aaa4>5 key, 3-10, 4-1, 4-4
aaa4?5 key, 3-13
aa4A5 key, 3-10, 4-2
aa4C5 key, 3-9, 3-10, 5-37
aa4D5 key, 3-9, 3-10
aa4E5 key, 3-2, 3-10
aa4F5 key, 3-10, 5-26
aa4G5 key, 3-10
aa4H5 key, 3-9, 3-10, 3-13, 6-2
aa4I5 key, 3-10
aa4J5 key, 3-10, 4-1
aa4L5 key, 3-10
aa4M5 key, 3-10
aa4O5 key, 3-10, 6-4
aa4P5 key, 3-10, 3-14, 4-1
aa4Q5 key, 3-10, 4-3
aa4R5 key, 3-10, 4-2
aa4S5 key, 3-10, 4-1
aa4T5 key, 3-10
aa4U5 key, 3-10, 4-3
aa4V5 key, 3-10, 3-16, 5-3, 5-19, 5-20,
6-5, 6-7, 7-4
aa4W5 key, 3-10
aa4X5 key, 3-10, 3-12, 6-3, 6-5
aa4Z5 key, 3-7, 3-10, 4-4
a4Ctrl5+4Q5 key, 3-10
a4Ctrl5+4S5 key, 3-10
a4Ctrl5+4Y5 key, 3-10
additional parameters, 7-6, 7-14
All Processes command, 3-10, 4-2
Aoptions, 5-21
application denition les, 5-27
applications, interesting, 5-34
bars, 5-35
elds, 5-35
a4Return5 key, 3-10
a4Space Bar5 key, 3-10
AUTOINST process, 2-2
available commands, list, 3-9
B
banner line, 3-3
BATCH parameter, D-5
C
capabilities, group, 2-2
CCTL, 3-15
changeable parameters, 7-5
Change Queue command, 3-10, 4-3
changing priorities, 4-3
clear screen parameter, 7-12
clock cycles, 7-16
rate, 5-50
color-emphasized metrics, 5-3, 6-2, 7-16
Command Interpreter, 5-4, 5-10, 5-11,
5-32, 5-36, 5-43
Command List key, 3-9
commands, 4-1{4
aaa4#5 key, 3-10, 4-1
Index-1
aaa4:5 key, 3-10, 3-15, 4-2, 5-4, 5-11,
5-25
aaa4<5 key, 3-10, 4-4
aaa4>5 key, 3-10, 4-1, 4-4
aaa4?5 key, 3-13
aa4A5 key, 3-10, 4-2
aa4C5 key, 3-9, 3-10, 5-37
aa4D5 key, 3-9, 3-10
aa4E5 key, 3-2, 3-10
aa4F5 key, 3-10, 5-26
aa4G5 key, 3-10
aa4H5 key, 1-3, 3-9, 3-10, 3-13, 6-2
aa4I5 key, 3-10
aa4J5 key, 3-10, 4-1
aa4L5 key, 3-10
aa4M5 key, 3-10
aa4O5 key, 3-10, 6-4
aa4P5 key, 3-10, 3-14, 4-1
aa4Q5 key, 3-10, 4-3
aa4R5 key, 3-10, 4-2
aa4S5 key, 3-10, 4-1
aa4T5 key, 3-10
aa4U5 key, 3-10, 4-3
aa4V5 key, 3-10, 3-16, 5-3, 5-19, 5-20,
6-5, 6-7, 7-4
aa4W5 key, 3-10
aa4X5 key, 3-10, 3-12, 6-3, 6-5
aa4Z5 key, 3-7, 3-10, 4-4
a4Ctrl5+4Q5 key, 3-10
a4Ctrl5+4S5 key, 3-10
a4Ctrl5+4Y5 key, 3-10
a4Enter5 key, 3-10
a4Expert Analysis5 key, 3-12
All Processes, 3-10, 4-2
a4Space Bar5 key, 3-10
available, list, 3-9
Change Queue, 3-10, 4-3
CPU Detail, 3-9, 3-10, 5-37
Disc Detail, 3-9, 3-10
Exit Glance, 3-2, 3-10
Expert, 6-3
Index-2
Expert Analysis, 3-10, 3-12, 6-5
Expert Overview, 3-10, 6-4
Filter, 3-10, 5-26
Global, 3-9, 3-10
Help, 3-9, 3-10, 3-13, 6-2
I/O by Phys Disc, 3-10
list of available, 3-9
List Users, 3-10, 4-3
Memory Detail, 3-10
MPE Command, 3-10, 3-15, 4-2, 5-4,
5-11, 5-25
Next Logical Display, 3-10, 4-1, 4-4
parameters, 3-1
Previous Display, 3-10, 4-4
Print, 3-10, 3-14
Refresh Screen, 3-10, 4-2
RUN, 3-1
Select, 3-10, 4-1
Select Job, 3-10, 4-1
Select Process, 3-9, 3-10, 4-1
Select Session, 3-10
Set Option Values, 3-10, 3-16, 5-3,
5-19, 5-20, 6-5, 6-7, 7-4
single-letter, 3-2, 3-10
Time Adjust, 3-10
Update Display, 3-10
Users, 3-10, 4-3
Workload, 3-10
Xpert Analysis, 3-10, 3-12, 6-5
Xpert Overview, 3-10, 6-4
Zero Averages, 3-7, 3-10, 4-4
Commands Menu command, 3-10
compatibility mode, 7-16
components
CPU bar, 3-4
disc bar, 3-5
memory bar, 3-6
conguration parameters, 5-19
conguring Expert facility, 7-15
continuous display, 5-20
conventions, iv
capitalization, iv
computer font, iv
4Enter5, iv
italics, iv
4Return5, iv
uppercase, iv
CPU
overhead, 3-7
parameters, 7-7
usage, 3-3
CPU bar, 3-4, 7-2
components, 3-4
CPU Detail command, 3-9, 3-10, 5-37
CPU Detail screen, 5-37{43
miscellaneous performance metrics,
5-39
queue distribution, 5-39
top CPU consumer, 5-43
type of utilization, 5-38
customizing GlancePlus
lter command, 5-26
D
data ltering, 6-1
default parameters, 7-5
detail display, 3-3
detailed WAIT reasons, C-1
dialogue, lter, 5-26
died parameter, 7-9
disc
parameter, 7-7
usage, 3-3
utilization, 5-45
disc bar components, 3-5
Disc Detail command, 3-9, 3-10
Disc Detail screen, 5-44{46
individual disc utilization, 5-45
summary disc utilization, 5-46
top disc consumer, 5-46
dispatcher queue, 7-16
display
continuous, 5-20
on demand, 5-19
display control parameters, 7-11
display control parametersl, 7-6
display CPU parameter, 7-12
display family, 5-19, 5-24
display les, 5-19, 5-20, 5-21
display memory parameter, 7-12
display trace, 5-19, 5-24
E
equipment
hardware, 2-1
software, 2-1
Exit Glance command, 3-2, 3-10
exit program, 3-2, 3-10
Expert Analysis command, 3-10, 6-5
Expert command, 6-3
Expert facility, 6-2
conguring, 7-15
invoking, 6-3
parameters, 7-6, 7-13
expert mode parameter, 7-13
Expert Overview command, 3-10, 6-4
expert users parameter, 7-14
F
family display, 5-19, 5-24
fault types, 5-48
le detail display parameter, 7-11
le display, 5-19, 5-20, 5-21
le opens, 5-21, 7-16
rate, 5-42
FILE parameter, D-4
le parameters, 5-19
lter
dialogue, 5-26
processes, 5-32
value, 5-31
Filter command, 3-10, 5-26
Filter Display screen, 5-29{33
Index-3
lter bars, 5-30
lter processes, 5-32
Summary elds, 5-31
ltering, 6-1
Filter screen
lter dialogue, 5-26
variables, 5-26
Filter Select screen, 3-8
Foptions, 5-21
function keys, 3-3, 3-9
command list, 3-9
global, 3-9
Process screen, 5-19
select process, 3-9
functions, process-specic, 5-19
fuzzy logic, 7-17
G
GlancePlus installation, 2-1
GlancePlus Pak for MPE/iX, 1-2
GLANCNFG le, 5-27, 7-4, 7-16
global bars, 3-3, 7-2
Global command, 3-10
Global key, 3-9
Global screen, 3-9, 5-2{6
color-emphasized metrics, 5-3
highlighted metrics, 5-3
interesting processes, 5-2, 5-3, 5-4
underlined metrics, 5-3
group
access, 2-2
capabilities, 2-2
guidelines, 6-2
H
hardware requirements, 2-1
Help command, 3-9, 3-10, 3-13, 6-2
Help facility, 3-13
help, online, 1-3
highlighted metrics, 5-3, 6-1, 6-2, 7-16
hitem, 7-16
Index-4
I
individual disc utilization, 5-45
installation
GlancePlus, 2-1
group access, 2-2
group capabilities, 2-2
program les, 2-2
INTERACTIVE parameter, D-5
interesting applications, 5-34
bars, 5-35
elds, 5-35
interesting processes, 3-8, 3-15, 5-2
color-emphasized metrics, 5-3
components, 5-4, 5-11
Global screen, 5-4
highlighted metrics, 5-3
Job/Session screen, 5-10, 5-11
thresholds, 7-5, 7-7
underlined metrics, 5-3
Interesting Process Thresholds Options
screen, 3-15
Interrupt Control Stack, 5-38
I/O by Physical Disc command, 3-10
itemid, 7-18
J
job selection, 4-1
Job/Session screen, 5-7{12
interesting processes, 5-10
job/session bars, 5-8
summary elds, 5-8
K
key words, 3-13
L
labels, 3-9
LaserRX/MPE, 1-2, 5-27
list commands key, 3-9
List Users command, 4-3
low level analysis, 7-17
M
memory bar, 7-2, 7-3
components, 3-6
Memory Detail command, 3-10
Memory Detail screen, 5-47{50
fault types, 5-48
miscellaneous, 5-49
memory usage, 3-3
metrics
color-emphasized, 5-3, 6-2, 7-16
highlighted, 6-1, 6-2, 7-16
underlined, 6-2, 7-16
minimum CPU parameters, 7-7
mode
compatibility, 5-18, 7-3, 7-16
native, 5-18, 7-3, 7-16
MPE Command, 3-10, 3-15, 4-2, 5-4,
5-11, 5-25
multiprocessor systems, A-1
N
native mode, 7-16
new parameter, 7-8
Next Logical Display command, 3-10,
4-1, 4-4
NOCCTL, 3-15
O
on demand display, 5-19
online help, 1-3
operating system software, 2-1
OR parameter, D-7
overhead, 3-7
P
page faults, 7-16
rate, 5-50
parameters
additional, 7-6, 7-14
clear screen, 7-12
CPU, 7-7
default, changeable, 7-5
died, 7-9
disc, 7-7
display control, 7-6, 7-11
display CPU, 7-12
display memory, 7-12
Expert facility, 7-6, 7-13
expert mode, 7-13
expert users, 7-14
le detail display, 7-11
hierarchy, 7-5
minimum CPU, 7-7
new, 7-8
process keys, 7-11
QZAP, 7-14
QZAPSYS, 7-14
refresh time, 7-15
response time, 7-8
RUN command, 7-1
setting, 7-5
transaction, 7-8
wait on CPU, 7-9
wait on disc, 7-10
wait on impede, 7-9
wait on memory, 7-10
PC requirements, 2-1
performance
indicators, 6-1, 7-17
other tools, 1-2
recommendations, 7-17
Previous Display command, 3-10, 4-4
Print command, 3-10, 3-14
Print facility, 3-14
process bars, 5-14
components, 5-14
processes
count, 5-8, 5-31, 5-35
details, 3-8
display, 3-3
Index-5
interesting, 3-8, 3-15, 5-2, 5-10, 7-5,
7-7
selection, 4-1
setting thresholds, 3-15
statistics, 3-8
thresholds, 7-5, 7-7
process keys parameter, 7-11
Process screen, 5-13{25
function keys, 5-19
miscellaneous process information,
5-17
process bars, 5-14
process state bars, 5-16
process summary elds, 5-15
process-specic functions, 5-19
Process Thresholds Options screen, 3-15
prockeys parameter, 5-19
product
name, 3-3
version, 3-3
program access, 2-2
Q
queue, 7-3
changing, 4-3
circular, 5-35
circular, priority, 4-3
linear, 5-35
linear, priority, 4-3
priority, 5-17, 5-35, 7-3
QUEUE parameter, D-6
QZAP parameter, 7-14
QZAPSYS parameter, 7-14
R
rate, le open, 5-42
Refresh Screen command, 3-10, 4-2
refresh time, 7-1
parameters, 7-15
requirements
hardware, 2-1
Index-6
software, 2-1
resetting statistics, 3-7
resource statistics, 3-8
response time
components, 5-16
parameter, 7-8
RESTORE, group capabilities, 2-2
rules, dening, 7-19
RUN command, 3-1
parameters, 7-1
RXForecast/MPE, 1-2
S
scheduling state, 5-17
screens
CPU detail, 5-37
disc detail, 5-44
lter display, 5-29
lter select, 3-8
global, 3-9, 5-2{6
Global, 3-2
identier, 3-3
job/session, 5-7
memory detail, 5-47
printing, 3-14
process, 5-13
process thresholds options, 3-15
sections, 3-3
selection, 7-1
set option values, 3-8
workload, 5-34
screen sections
banner line, 3-3
detail display, 3-3, 3-8
fault types, 5-48
lter bars, 5-30
lter processes, 5-32
function keys, 3-3
global bars, 3-3
individual disc utilization, 5-45
interesting applications, 5-35
interesting processes, 5-2, 5-3, 5-10
job/session bars, 5-8
miscellaneous, 5-49
miscellaneous performance metrics,
5-39
miscellaneous process information,
5-17
process bars, 5-14
Process screen function keys, 5-19
process state bars, 5-16
process summary elds, 5-15
queue distribution, 5-39
summary disc utilization, 5-46
summary elds, 5-8, 5-31
top CPU consumer, 5-36, 5-43
top disc consumer, 5-36, 5-46
type of utilization, 5-38
Select command, 3-10, 4-1
Select Job command, 3-10, 4-1
Select Process command, 3-9, 3-10, 4-1
Select Session command, 3-10, 4-1
service time, 7-16
session selection, 4-1
Set Option Values command, 3-10, 3-16,
5-3, 5-19, 5-20, 6-5, 6-7, 7-4
Set Option Values screen, 3-8
setting parameters, 7-5
single-letter commands, 3-2, 3-10
softkeys, 3-9
software, operating system, 2-1
Software Performance Tuner (SPT), 1-2
data collection, 5-25
starting GlancePlus, 3-1
state bars, process, 5-16
components, 5-16
statistics
process, 3-8
resetting, 3-7
resource, 3-8
summary disc utilization, 5-46
summary elds, 5-31
process screen, 5-15
switches, 5-20, 7-16
between modes, 5-18
guidelines, 5-39, 5-41, 5-42
symptoms, 7-18
dening, 7-19
SYS option, 5-10
system processes
display (SYS), 5-10
T
terminal requirements, 2-1
thresholds, 3-15{17
setting, 3-15
values, 5-27
time
CPU, 5-32
current, 3-3
elapsed, 5-16, 5-31
response, 5-16, 5-18
service, 5-45, 7-16
total CPU, 5-31
total disc, 5-31
utilization, 5-45
Time Adjust command, 3-10
Timeout on prompts , 4-4
top consumer
CPU, 5-34, 5-36, 5-43
disc, 5-34, 5-36, 5-46
trace display, 5-19, 5-24
transaction parameter, 7-8
transactions, terminal, 5-17
U
UDC
les, 2-2
processes, 5-34
RUN command, 3-1
underlined metrics, 5-3, 6-2, 7-16
Update Display command, 3-10
usage
Index-7
CPU, 3-3
disc, 3-3
memory, 3-3
USER parameter, D-5
Users command, 3-10, 4-3
V
variables
lter screen, 5-26
user-dened, 7-17
W
wait on CPU parameter, 7-9
wait on disc parameter, 7-10
wait on impede parameter, 7-9
wait on memory parameter, 7-10
WAIT reasons, 5-17
components, 5-6, 5-11
detailed, C-1
Index-8
expanded denitions, B-1
WAIT states
components, 5-16
Workload command, 3-10
Workload screen, 5-34{36
interesting applications, 5-35
top CPU consumer, 5-36
top disc consumer, 5-36
X
Xpert Analysis command, 3-10, 3-12,
6-5
Xpert facility, 6-2
invoking, 6-3
Xpert Overview command, 3-10, 6-4
Z
Zero Averages command, 3-7, 3-10, 4-4