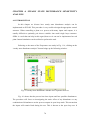
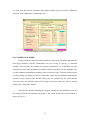
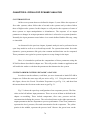
1
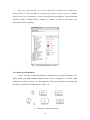
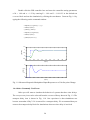
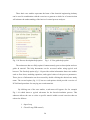
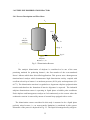
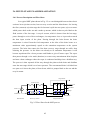
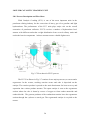
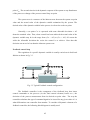
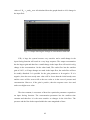
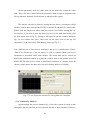
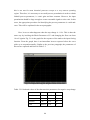
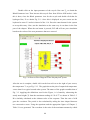
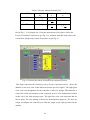
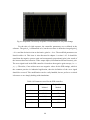
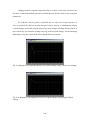
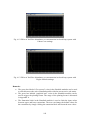
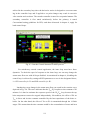
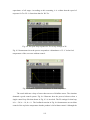
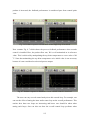
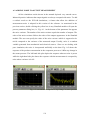
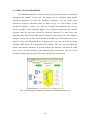
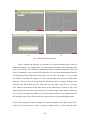
To find out, the set point is maintained at its original value of 25.316 % and a
disturbance introduced. Using Fig. 6.1, any of the input parameters (blue) can act as a
disturbance. In this case the feed flow F1 was chosen as the disturbance parameter. The
flow was increased by a step change of 0.1 kg/min. This is done by double clicking on
the F1 icon to obtain a block parameter, from where the change is effected. Fig. 6.11
shows the open-loop response of the concentration to this disturbance. The open-loop
response shows the concentration rising from the value of 25.316 % to a new steady
state value of 26.36 % without limitation.
Fig. 6.12 and 6.13 show the controlled-responses to a 0.1 kg/min step change in
F1, the feed flow rate. Note how in both responses, the concentration rapidly rose to
approach the value of the open loop response but was quickly brought back to the set
point value of 25.316 %. Just like the set point response, the two graphs of the closedloop system showed responses different from that of the open-loop response. Note the
similarity between the responses of Fig. 6.12 and 6.13. The response controlled by the
ZN settings settled faster with a response time of about 250 seconds as against 500
seconds for the CC settings. In both cases, the disturbance swiftly increased the
concentration (as shown in the beginning of the two graphs) but the controllers acted
immediately to bring back the concentration to the set point value of 25.316 %.
As concluded earlier, the controller setting parameters of both Cohen-Coon and
Ziegler-Nichols are equally effective.
Fig. 6.11 Effect of Feed Flow disturbance on concentration in open-loop system
101