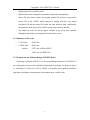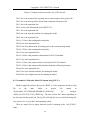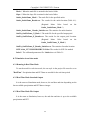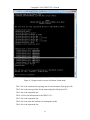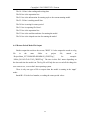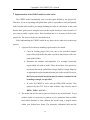
1
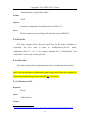
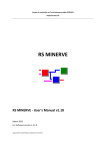
Copyright © 2015 CREST V2.1 Fortran
NASA
University of Oklahoma (OU) HyDROS Lab (http://hydro.ou.edu)
CREST
Coupled Routing and Excess STorage
User Manual
© CREST Version 2.1-Fortran
Real-Time
Mode
WMM
W
Forcasting
Mode
Canopy
Incterception
Discharge
PET
Infiltration
Actual ET
DEM, FDR,
FAC, Slope
Runoff
Generation
Soil Moisture
Observed
Discharge
Actual ET
Surface
Runoff
a-priori
parameter
Runoff Cell-toCell Routing
Subsurface
Runoff,
PE
Precipitation
A
W0
0
f/F
1.0
Atmospheric Forcing
RS0
RainFact
Stream
Flood
Assessment
SCE-UA
Input
ΔW
R
Hydro-Processes Module Output
Variable
Infiltration
Curve
Function Module
A
R
Ksat
Surface
RS
Flow
AET
C
RI0
B
D
Soil Layer
Interflow
RI
Cell-To-Cell
Surface
Runoff
Routing
E
F
A
B
C
D
E
F
Cell-To-Cell
Interflow
Runoff
Routing
By Dr. Xianwu Xue, Dr. Yang Hong and Dr. Ke Zhang
Copyright © Hydrometeorology and Remote Sensing Lab, National Weather Center,
Norman, OK USA
April 16, 2015
Copyright © 2015 CREST V2.1 Fortran
Cover: CREST—Coupled Routing and Excess Storage User Manual Version 2.1
Brief Version History:
02/02/2011 Model was updated from CREST v1.6c to Modular Designed v2.0 with
embedded SCE-UA (Developed by Dr. Xianwu Xue and Dr. Yang Hong)
01/11/2014 Model was updated to v2.0.3
10/31/2014 Model was updated to v2.1
Copyright © 2015 CREST V2.1 Fortran
Table of Contents
CREST ......................................................................................................................... 1
TABLE OF CONTENTS ..............................................................................................I
1 INTRODUCTION .................................................................................................... 1
2 NEW FEATURES OF CREST IN DIFFERENT VERSIONS FOR ADDITIONAL
READING ................................................................................................................... 1
2.1 What’s New in CREST v2.1 .................................................................................. 1
2.2 New features in CREST v2.0 (also inherited by the CREST v2.1) ....................... 1
3 COMPILATIONS ................................................................................................... 13
3.1 Compiling on Linux Systems............................................................................... 13
3.2 Compiling on Window Systems........................................................................... 13
4 PROJECT FILE ..................................................................................................... 15
4.1 Model Area........................................................................................................... 15
4.2 Model Run Time Information .............................................................................. 16
4.3 Model Run Style .................................................................................................. 17
4.4 Routing Type ........................................................................................................ 17
4.5 Model Directory ................................................................................................... 19
4.6 OutPix Information .............................................................................................. 20
4.7 Outlet Information ............................................................................................... 21
4.8 Grid Outputs......................................................................................................... 21
4.9 Date Outputs ........................................................................................................ 23
4.10 Number of Lakes................................................................................................ 23
5 INPUTS & OUTPUTS ............................................................................................ 25
5.1 Basics Folder ........................................................................................................ 25
5.2 Params Folder ...................................................................................................... 32
I
Copyright © 2015 CREST V2.1 Fortran
5.3 State Folder .......................................................................................................... 35
5.4 ICS Folder ............................................................................................................ 35
5.5 OBS Folder .......................................................................................................... 37
5.6 Calibs Folder ........................................................................................................ 37
5.7 Rains Folder ......................................................................................................... 41
5.8 PETs Folder .......................................................................................................... 41
5.9 Results Folder ...................................................................................................... 41
6 RUN STYLES ......................................................................................................... 43
6.1 Simulation ............................................................................................................ 43
6.2 Automatic Calibration using SCE-UA ................................................................. 46
6.3 Simulation in real time mode ............................................................................... 49
6.4 Return Period mode ............................................................................................. 50
7 IMPLEMENTATION OF THE CREST MODEL FOR OTHER BASINS............ 53
8 CONTACT .............................................................................................................. 55
9 SELECTED CREST MODEL RELATED REFERENCES................................... 55
10 APPENDIX A LOOK-UP TABLES ...................................................................... 57
II
Copyright © 2015 CREST V2.1 Fortran
1 Introduction
The Coupled Routing and Excess STorage (CREST) distributed hydrological model
is a hybrid modeling strategy that was jointly developed by the University of Oklahoma
(http://hydro.ou.edu) and NASA SERVIR Project Team (www.servir.net). The CREST
model was initially designed to provide real-time regional and global hydrological
prediction by simultaneously modeling over multi-basins with significantly cost-effective
computational efficiency (http://eos.ou.edu), however it is also very applicable for small
to medium size basins at very high-resolutions. CREST simulates the spatiotemporal
variation of water and energy fluxes and storages on a regular grid with the grid cell
resolution being user-defined, thereby enabling multi-scale applications. The scalability
of CREST simulations is accomplished through sub-grid scale representation of soil
moisture storage capacity (using a variable infiltration curve) and multi-scale runoff
generation processes (using multi-linear reservoirs). The representation of the primary
water fluxes such as infiltration and routing are physically related to the spatially variable
land surface characteristics (i.e., vegetation, soil type, and topography etc.). The runoff
generation process and routing scheme are coupled, thus providing more realistic
interactions between lower atmospheric boundary layers, terrestrial surface, and
subsurface water. The above flexible modeling features and embedded automated
calibration algorithms make the CREST a powerful yet cost-effective tool for distributed
hydrological modeling and implementation at global, regional, basin, and small
catchment scales.
This user manual and the accompanying software package enable first-time users to
test the model with a single basin example. Section 2 provides more information on new
features of different model versions but users can jump to Section 3 for source code
compilations or directly go to Section 4-6 to learn how to implement the model with the
provided basin example. Then Section 7 will guide the user how to set up and calibrate
the model in new study areas. For more guidance of CREST model implementation,
please contact us or download the week-long training materials in Kenya from this link:
http://hydro.ou.edu/research/crest/crest-model-training-materials/#crest_workshop.
1
Copyright © 2015 CREST V2.1 Fortran
2 New Features of CREST in different Versions for additional reading
2.1 What’s New in CREST v2.1
1) Updated the continuous multi-linear reservoir routing option (See Figure 5-5),
with the Keyword RouteType for this routing option in order to compatible with
the CREST Model v2.0
2) Make the “CalibMask” file optional.
3) Improved the modeling compatibility at multiple temporal scales, ranging from
minute, hour, day, month and year.
4) Fixed the display of digital numbers using Star during the simulation/ calibration
on the terminal interface and also in the log file
2.2 New features in CREST v2.0 (also inherited by the CREST v2.1)
2.2.1 Main Features of CREST v2.0
•
A modular design framework to accommodate research, development and system
enhancements (see Fig. 2(a) in Xue et al. (2013))
•
Inclusion of the optimization scheme SCEUA to enable automatic calibration of
the CREST model parameters (see Fig. 2(a) in Xue et al. (2013))
•
QPF Forecast Function Mode was incorporated and applied in the NASA
SERVIR Africa Project (https://www.servirglobal.net/EastAfrica/MapsData.aspx)
•
All the parameters in CREST v1.6c were classified into three types: Initial
Conditions, Physical Parameters (to be derived by a-priori parameter method),
and conceptual parameters (to be calibrated), some of the non-sensitive
parameters were omitted (more details in user manual)
•
Model implementation with options of either spatially uniform, semi-distributed,
or fully distributed parameterization schemes
•
A multi-site cascading calibration framework was used to calibrate the model
using multi-site streamflow gauge data from upstream to downstream (Users
1
Copyright © 2015 CREST V2.1 Fortran
should prepare the streamflow data)
•
Enhancement of the computation capability using matrix manipulation
•
Project file was used to replace the original control file, and users can pass the
project file to the CREST model instead of putting both the crest model
executable file and the control file under the same directory path. Additionally,
the statements in the project file could be in any order and more flexible
•
The Model can write out all the output variables in any given time (spatially
distributed data) and in any designated location (Time series)
2.2.2 Summary of the codes:
•
V1.6c Total:
2106 Lines
•
V2.0.00 Total:
8841 Lines
Include:
5437 Lines of Main CREST
3403 Lines of CREST-UA
2.2.3 Framework and Modular Design of CREST Model
Comparing to previous CREST v1.6c, the programming framework of CREST v2.0
was redesigned to better suit for distributed hydrological modeling. As shown in Figure
2-1 and Figure 2-2 (Xue et al. (2013)), CREST v2.0 includes more spatially distributed
input data (including a prior parameters) and outputs more variables data.
2
Copyright © 2015 CREST V2.1 Fortran
Figure 2-1 Programming Framework of CREST v2.0
3
Copyright © 2015 CREST V2.1 Fortran
Figure 2-2 (a) The framework of the CREST model version 2.0 and (b) vertical profile of hydrological processes in a grid cell.
4
Copyright © 2015 CREST V2.1 Fortran
2.2.4 Organization of the Files and Folders
The previous version CREST v1.6c puts all data information into “Control.txt”
(Figure 2-3); this will make the control file too big when modelers want to add other
parameters or data into the CREST. Additionally, when implementation of the model
becomes complex, it will contain too many files under one file folder, causing
unnecessary confusion and inconvenience to users or modelers.
DDM.txt
DEM.txt
FAM.txt
Basics
Rain
PET
Control.txt
Discharge
Name.hyp.txt
Exports
Figure 2-3 Files’ and Folders’ Organization of CREST v1.6c
In
CREST
v2.0,
control
file
was
5
divided
into
“ProjectName.Project”,
Copyright © 2015 CREST V2.1 Fortran
“Parameters.txt”, “InitialConditions.txt” and “Calibrations.txt”. Each of four files is put
in
standalone
folders,
including
other
related
data
and
files.
Thus
the
“ProjectName.Project” file only contains the model’s input information and its
configuration. This will enables user to build and modify these files easily. Figure 2-4
shows all the folders defined in CREST v2.0 based on their functionality. More detailed
information of these folders will be discussed in following sections.
Basics
ICS
Params
OBS
States
ProjectName.
Project
Rain
PET
Results
Calibs
Figure 2-4 Files’ and Folders’ Organization of CREST v2.0
6
Copyright © 2015 CREST V2.1 Fortran
2.2.5 Comparison with CREST v1.6c
Compare the simulation
v1.6c
v2.0.00
1
8.019
5.039
2
4.415
2.917
3
4.461
2.886
4
4.368
2.885
5
4.462
3.042
6
4.43
3.369
Ave
5.632
3.614
Compare the calibration
Iteration Elapsed Time
v1.6c
15795
8h 25min
v2.0.00
3000
1h 46min
Cascading(2Region)
3000
3h 35min
NSCE
Bias(%)
CC
0.999988574
-0.00926862
0.99999502
One Region
NSCE
0.990432
0.999989
0.999548
NSCE
0.999998757 NSCE
Bias(%) -0.004382075 Bias(%)
CC
0.999999408 CC
0.999548
0.371125
0.999816
Two Regions
( Upstream point (left), Outlet ( right))
Figure 2-5 Comparison of CREST v1.6c and v2.0 in the running efficiency
2.2.6 Pre-Process of CREST v2.0
Basics Data Inputs:
Support More File Formats:
ASC, TXT, DBIF, BIFFIT, TRMMRT, TRMMV6, TRMMV7, NMQBIN, ASBIMO,
BIBIMO
Flow Direction Map
Support Both CNT flow direction codes and ArcGIS flow direction codes
7
Copyright © 2015 CREST V2.1 Fortran
Figure 2-6 Flow Direction Coding
Stream Map
Omit TH parameter
Slope Map
Omit GM Parameter
Make the mask, GridArea and AreaFactor maps to optional
2.2.7 Parameters Classification
Table 2-1 Parameters in CREST v1.6 and v2.0
W0
SS0
SI0
Symbol
(v1.6c)
iWU
iSO
iSI
Initial Value of Soil Moisture
Initial value of Overland Reservoir
Initial value of Interflow reservoir
Ksat
pFc
the Soil saturate hydraulic conductivity
RainFact
WM
B
IM
KE
coeM
Rain
pWm
B
pIM/100
pKE
coeM
the multiplier on the precipitation field
The Mean Water Capacity
the exponent of the variable infiltration curve
Impervious area ratio
The factor to convert the PET to local actual
overland runoff velocity coefficient
expM
expM
overland flow speed exponent
coeR
River
multiplier used to convert overland flow
Module
Symbol (v2.0)
Initial
Condition
Physical
Parameters
Conceptual
Parameters
Description
8
Copyright © 2015 CREST V2.1 Fortran
coeS
Under
KS
KI
LeakO
LeakI
(Omitted)/TH
TH
Adjustment
Parameters (Omitted)/GM
GM
AreaFact
speed to channel flow speed
multiplier used to convert overland flow
speed to interflow flow speed
Overland reservoir Discharge Parameter
Interflow Reservoir Discharge Parameter
Threshold to determine which cells are river
cells
downstream cell is higher than the upstream
downstream cell is a nodata/outside region cell
multiplier that modifies the area of grid cells
AreaC
2.2.8 Input Data
Use ProjectName.Project as the main control file for CREST v2.0, Use “#” in the
beginning of the line as the comments, all of the inputs in the project file can be in any
order.
In the CREST v2.0, there are two files to control the initial conditions and
parameters respectively, they can input both uniform value and/or distributed values.
For the observed streamflow data, .csv format same as Excel are used to convenient
to be prepared by Excel.
Figure 2-7 Example of the observed streamflow file
For the Precipitation and Potential Evapotranspiration data, the users can use any
formats and CREST v2.0 can clip the area automatically when the data area is different
with the defined research area in project file. So ClipRe parameter in CRESt v1.6c is
9
Copyright © 2015 CREST V2.1 Fortran
omitted.
2.2.9 Mode Structure
Divide the processes into subroutines to make the codes easy to understand and
modification
a) Canopy Interception
b) Potential Evapotranspiration
c) Runoff Generation
d) Actual Evapotranspiration
e) Runoff Route
Encapsulate the variables into different modules and its types, and add “g_” as the prefix
to strength the code readable
2.2.10 Output Data
•
Output the Outlet’s data
•
Output the all the inner points’ data including its upstream area’s average Rain
and PET
•
Output the specified state variables’ data
•
Output the specified time's data
•
Automatically compute the NSCE, Bias and CC when outlet and inner pints
having observation data
•
The output data files use their data type as prefix to make the user know them
easily
2.2.11 Output & Post-Process
CSV format is used for the outlet and any location output results.
10
Copyright © 2015 CREST V2.1 Fortran
2.2.12 Calibration
Optimize the distributed parameters using SCE-UA and Matrix Manipulation
Figure 2-8 Matrix Manipulation
Using cascading strategy calibrate the model automatically using different regions
with different parameters’ dataset based on the calibration stations’ region number
2.2.13 Fix some bugs
•
Take TH and FAC for example
•
FAC has two means:
1. Number of the upstream grids
2. Upstream basin’s area
From codes, TH is the area, not the number, so should sum the upstream grids area
11
Copyright © 2015 CREST V2.1 Fortran
3 Compilations
This CREST model version is written in FORTRAN, and will run under most
operating systems. It has been successfully implemented on Pentium & PC based
systems (Microsoft Windows and Linux).
It is not necessary to modify the source code of CREST in order to change settings
or switch to other basins. In CREST v1.6, the control file with a default name of
“control.txt” and basic grids dictate the necessary settings for running the model.
However, CREST V2.1 control file uses “ProjectName.Project” instead of the
“control.txt”. Users are recommended to name the control file “ProjectName.project” as
specific projects if you have multiple projects using the model in same file system.
3.1 Compiling on Linux Systems
The Linux/Unix operating systems are case sensitive. So when you compile CREST
model, you must pay attention to the name and extension of the default file.
3.1.1 Using “ifort” compiler
Compiling CREST is easy with FORTRAN compiler. The source code of CREST
model is contained in a single file for ease of use. As such, in order to compile CREST
using ifort all you need to do is to type a simple command line "ifort crest.for –o
crest.lx". This will compile the CREST FORTRAN source code file into an executable
named "crest.lx". The Intel FORTRAN compiler has many other command line
arguments to enable additional optimizations and other features. If you want a full list
and description of how to use ifort, please consult the Intel FORTRAN compiler user
manual.
3.2 Compiling on Window Systems
3.2.1 Using “Compaq Visual FORTRAN” (CVF) compiler
Compiling CREST is also very easy using CVF on Windows platforms, you can just
open the “crest.for” by CVF, and then compile it, and finally, “crest.exe” will be created.
13
Copyright © 2015 CREST V2.1 Fortran
If you want a full list and description of how to use CVF, please consult the Compaq
Visual FORTRAN compiler user manual.
14
Copyright © 2015 CREST V2.1 Fortran
4 Project File
The file “ProjectName.Project” contains the information about Model Area, Run
Time Information, Configuration Directory, Run Style, Outputs Information for Specified
Pixels and Outlet, Outputs States and Outputs Date, and it also contains file assignments
and their formats (One line for each assignment or information).
The “ProjectName” is the name of the project, when run CREST v2.1 on Linux/Unix
operating system, the extension of project file should write as “Project”, not “project” or
others.
Note:
The statement in the project file can be listed in any order, but the keywords
should not be changed. The format of the statement is:
Keyword
=
Value
The statement appearing on the same line should be space- or tab-separated.
Comment lines must have a pound sign, #, in the first column.
Comment for the statement in the line must be placed after Value and be sure to
leave at least one space or tab between the Value and the comments.
Keyword is not case sensitive.
4.1 Model Area
Figure 4-1 Sample Model Area in “ProjectName.Project”
15
Copyright © 2015 CREST V2.1 Fortran
NCols:
Number of cell columns;
NRows:
Number of cell rows.
XLLCorner :
X coordinate of the origin (by lower left corner of the cell).
YLLCorner :
Y coordinate of the origin (by lower left corner of the cell).
CellSize:
Cell Size.
NoData_Value: The input values to be No Data in the input/output map file.
4.2 Model Run Time Information
Figure 4-2 Sample Model Run Time Information in “ProjectName.Project”
TimeMark:
The unit of time step. The possible units are “y” (year), “m”
(month), “d” (day), “h” (hour), “u” (minute), “s” (second).
TimeStep:
Time Step.
StartDate:
Start date of the simulation, its format is defined as
“yyyymmddhhuuss”, the length is up to the time step unit, for
example, “yyyy” when time step unit is “y”; “yyyymmddhhuuss”
when time step unit is “s”
LoadState:
The mark for reading the state file. “yes” means user want to run
the model by state files as initial value, “no” means the initial
values are read determined by initial condition file.
WarmupDate:
Warm up date for the simulation, its format is defined the same as
16
Copyright © 2015 CREST V2.1 Fortran
“StartDate”.
EndDate:
End date for the simulation, , its format is defined the same as
“StartDate”.
The mark for saving the state file. “yes” means user want to save
SaveState:
the state files when finished running the model, “no” means user
does not want to save the state files..
4.3 Model Run Style
Figure 4-3 Sample Model Run Style in “ProjectName.Project”
The run style “simu” means simulation; other possible run styles are “cali_SCEUA”
(automatic calibration using SCE-UA method), “RealTime” (on line mode), and “repe”
(return period) modes.
4.4 Routing Type
Figure 4-4 Sample Routing Type in “ProjectName.Project”
The routing component in CREST is based on a two-layer scheme describing
overland runoff and interflow from one cell to the next one downstream, with
consideration of open channel flow (Wang et al., 2011). In other words, the runoff in Cell
A from interflow, overland flow and channel flow contribute to cells downstream D and F.
We called this method as Jumped Linear Routing (Hereafter: JLR).
JLR method
provides a very efficient way for cell-by-cell routing. However, in some application, if
the Grid Cell is very large and the time scale is very small, JLR will cause
17
Copyright © 2015 CREST V2.1 Fortran
underestimates of the streamflow. So we developed another method to solve this problem:
Continuous Linear Routing (Hereafter: CLR), this method will loop all the cells the
water flowed during the time step. Please note that, CLR will spend more time than JLR
in most of the application.
Figure 4-5 Description of the JLR and CLR in CREST v2.1
18
Copyright © 2015 CREST V2.1 Fortran
4.5 Model Directory
Figure 4-6 Sample Model Directory in “ProjectName.Project”
As shown in Figure 3-3, CREST v2.1 divides the input and output data into 9 groups,
each groups has a standalone folders, such as “Basics”, “Params”, “States”, “ICS”,
“Rains”, “PET”, “Results”, “Calibs” and “OBS” (the name of the folder can be
user-specified, but the its keyword is fixed). Each folder contains some files (detailed
content will be introduced in the next chapter), the format of the folder means all or most
of the files in this folder will use this format. The file possible formats of CREST v2.1
are "ASC", "TXT", "DBIF", "BIFFIT", "TRMMRT", "TRMMV6", "NMQBIN",
"ASBIMO" and "BIBIMO".
19
Copyright © 2015 CREST V2.1 Fortran
4.6 OutPix Information
Figure 4-7 Sample OutPix Information in “ProjectName.Project”
NOutPixs:
The number of output pixels
OutPixColRow: OutPixColRow is specified if the pixel is relative to the basic grids
or in latitude and longitude. A value of “yes” means the location of
the pixels is a column and row, a value of “no” means the location
is longitude and latitude.
OutPixNameX: The name of the Xth Pixels. The value of “X” is up to NOutPixs
(X = [1~ NOutPixs]).
OutPixLongX:
The longitude of the Xth Pixels when OutPixColRow is assigned
“no”.
OutPixLatiX:
The latitude of the Xth Pixels when OutPixColRow is assigned
“no”.
OutPixColX:
The Column of the Xth Pixels when OutPixColX is assigned “yes”.
OutPixRowX:
The Row of the Xth Pixels when OutPixColX is assigned “yes”.
20
Copyright © 2015 CREST V2.1 Fortran
4.7 Outlet Information
Figure 4-8 Sample Outlet Information in “ProjectName.Project”
HasOutlet:
Whether have outlet or not, a value of “yes” means research area
has an outlet, a value of “no” means have not.
OutletColRow: OutletColRow is specified if the outlet is relative to the basic grids
or in latitude and longitude. A value of “yes” means the outlet of
the pixels is a column and row, a value of “no” means the outlet is
longitude and latitude.
OutletName:
The name of the outlet Pixels.
OutletLong:
The longitude of the Outlet Pixels when OutletColRow is assigned
“no”.
OutletLati:
The latitude of the Outlet Pixels when OutletColRow is assigned
“no”.
OutletCol:
The Column of the Outlet Pixels when OutletColRow is assigned
“yes”.
OutletRow:
The Row of the Outlet Pixels when OutletColRow is assigned
“yes”.
4.8 Grid Outputs
Grid Outputs is the control of 2-D grid-based output, “yes” means output and “no”
means do not output. The run time of the model depends on the number of outputs. A
faster CREST model runtime can be achieved by reducing the number of output variables.
Output format is controlled by the ResultFormat in section 4.4. All outputs are spatially
21
Copyright © 2015 CREST V2.1 Fortran
interpolated to the proper resolution and clipped to either the basic grids or the drainage
area automatically.
Figure 4-9 Sample Grid Outputs in “ProjectName.Project”
GOVar_Rain:
The input precipitation; unit is mm/hour.
GOVar_PET:
The input PET; unit is mm/hour.
GOVar_EPOT: GoVar_PET*KE
GOVar_EAct:
The depth of simulated actual evapotranspiration; unit is mm/hour.
GOVar_W:
The depth of water filling the pore space bucket "WM"
GOVar_SM:
Soil
Moisture,
a
percentage
of
the
WM
GOVar_W/WM
GOVar_R:
The simulated discharge of each grid cell; unit is m³/s.
GOVar_ExcS:
The depth of surface excess rain; unit is mm/hour.
GOVar_ExcI:
The depth of interflow excess rain; unit is mm/hour.
GOVar_RS:
The depth of overland flow; unit is mm/hour.
GOVar_RI:
The depth of interflow flow; unit is mm/hour.
22
and
equals
Copyright © 2015 CREST V2.1 Fortran
4.9 Date Outputs
Figure 4-10 Sample Output Dates in “ProjectName.Project”
Date Outputs is to be specified some dates what user is interested in.
NumOfOutputDates: The Number of Output Date
OutputDate_X:
The Xth Date to output, The value of “X” is up to
NumOfOutputDates (X = [1~ NumOfOutputDates]).
4.10 Number of Lakes
Figure 4-11 Sample Number Lake in “ProjectName.Project”
NumOfLakes is to be specified the number of Lakes in this research region.
NumOfLakes:
The Number of Lakes
23
Copyright © 2015 CREST V2.1 Fortran
5 Inputs & Outputs
CREST v2.1 can read all the Grid file formats (such as "ASBIMO", "BIBIMO",
"ASC", "TXT", "DBIF","BIFFIT", "TRMMRT", "TRMMV6" and "NMQBIN") and can
clip the file automatically when this file is not equal to the extent defined in
“ProjectName.Project”, so user does not need to extract the research area by themselves
as long as your prepared input files have broader space domain.
Note: Users can learn how to prepare the data using ArcGIS from the workshop Dr.
Xianwu Xue hosted in Kenya, please click this link1 to access it.
5.1 Basics Folder
This folder contains the basic file for the model, such as DEM file, FDR file (Flow
Direction), FAC file (Flow Accumulation) and so on.
5.1.1 DEM File
Required:
Always
Name:
DEM.*
Format:
All Formats
Purpose:
Contains a digital elevation model of the basin area, with heights in meters
Notes:
1
http://hydro.ou.edu/files/Crest_Workshops/Kenya_Xianwu_2012/DayTwo/Hands-on%20Session-Preparing%20Data%20For%20CREST%20Model.pdf
25
Copyright © 2015 CREST V2.1 Fortran
The coordinate system of CREST v2.1 can use both Geographic Coordinate
System and Projected Coordinate System (PCS)
5.1.2 FDR File
Required:
Always
Name:
FDR.*
Format:
All Formats
Purpose:
Contain a flow direction from each cell to its steepest downslope neighbor of
the basin area.
Notes:
The coordinate system of FDR File should be same as DEM File.
In the former version of CREST, direction coding only use the rule like Figure
5-1 (a) generated by “CNT”, however, most popular software (like ArcGIS) use
the rule like Figure 5-1 (b), so CREST v2.1 uses both of the two rules.
8
1
7
6
5
2
32
3
16
4
8
(a)
64
1
4
(b)
Figure 5-1 Flow Direction Coding
26
128
2
Copyright © 2015 CREST V2.1 Fortran
5.1.3 FAC File
Required:
Always
Name:
FAC.*
Format:
All Formats
Purpose:
Contains accumulation flow to each cell of the basin area.
Notes:
The coordinate system of FAC File should be same as DEM File.
5.1.4 Mask File
Required:
Optional
If omitted
If HasOutlet == “yes”, then CREST v2.1 will generate the mask filebased
on Outlet location.
If HasOutlet == “no”, then CREST v2.1 will generate the mask file based
on NoData_Value in DEM file.
Name:
Mask.*
Format:
All Formats
Purpose:
27
Copyright © 2015 CREST V2.1 Fortran
Contains a mask of the basin, indicating which cells in the other terrain are
inside the basin
Notes:
The coordinate system of Mask File should be same as DEM File.
5.1.5 GridArea File
Required:
Optional
If omitted, CREST v2.1 will generate the GridArea file based on the coordinate
system.
Name:
GridArea.*
Format:
All Formats
Purpose:
Contain the area of each cell in the basin
Notes:
The coordinate system of GridArea File should be same as DEM File.
5.1.6 AreaFact File
Required:
Optional
If omitted, CREST v2.1 will assign AreaFact.file a uniform value (1.00).
Name:
AreaFact.*
Format:
All Formats
28
Copyright © 2015 CREST V2.1 Fortran
Purpose:
Contains the area of each cell in the basin
Notes:
The coordinate system of AreaFact File should be same as DEM File.
5.1.7 Stream File
Required:
Optional, however if Stream file is omitted, Stream.def must be required.
If omitted, CREST v2.1 will read the threshold to determinate the stream from
Stream.def.
Name:
Stream.*
Format:
All Formats
Purpose:
Contain the information to show whether each cell is the stream.
Notes:
The coordinate system of Stream File should be same as DEM File.
5.1.8 Stream.def File
Required:
Optional, however if Stream.def is omitted, Stream file must be required.
Only use when Stream file omitted.
Name:
Stream.def
Format:
ASCII, only contain one value
29
Copyright © 2015 CREST V2.1 Fortran
Purpose:
Contain the threshold for determining the stream.
Notes:
Stream.def is used to compatible with the former version of CREST, instead
of Th parameter in the former version of CREST.
5.1.9 Slope File
Required:
Optional
If Slope omitted
If Slope.def exists, CREST v2.1 will calculate the Slope like the former
version.
If Slope.def does not exist, CREST v2.1 will calculate the Slope
automatically.
Name:
Slope.*
Format:
All Formats
Purpose:
Identify the rate of maximum change in DEM file from each cell.
Notes:
The coordinate system of Slope File should be same as DEM File.
5.1.10 Slope.def File
Required:
Optional
30
Copyright © 2015 CREST V2.1 Fortran
Only use when Slope file omitted, CREST v2.1 will read this file. If Slope.def
is omitted yet, CREST v2.1 will calculate the Slope automatically.
Name:
Slope.def
Format:
ASCII, only contain one value
Purpose:
Contain the threshold for determining the stream.
Notes:
Slope.def is used to compatible with the former version of CREST, instead of
GM parameter in the former version of CREST.
5.1.11 Lake Mask File
Required:
Optional
If NumOfLakes==0 then
omitted
Name:
LakeMask.*
Format:
All Formats
Purpose:
Contains a mask of lakes in this region, indicating which cells is the lake
Notes:
The coordinate system of LakeMask File should be same as DEM File.
31
Copyright © 2015 CREST V2.1 Fortran
5.2 Params Folder
This folder contains all the configuration and values of parameters for the model.
There are total 18 parameters, classified into four types in this new version (see Table
5-1).
CREST v2.1 puts the initial condition into ICS folder (will introduce later), TH and
GM are optional control parameters, and AreaFact can be calculated by ArcGIS or other
software, or by CREST v2.1 automatically. So, there are 12 essential parameters in
CREST v2.1. The look up tables, the range and the default value of part/all of these
parameters are listed in Appendices Table 10-1, Table 10-2 and Table 10-3.
32
Copyright © 2015 CREST V2.1 Fortran
Table 5-1 Classification in CREST v2.1 vs v1.6c
Module
Initial
condition
Physical
Parameters
Conceptual
Parameters
Adjustment
Parameters
Symbol (v2.1)
W0
SS0
SI0
Ksat
RainFact
WM
B
IM
KE
coeM
expM
Symbol (v1.6c)
iWU
iSO
iSI
pFc
Rain
pWm
B
pIM/100
pKE
coeM
expM
coeR
River
coeS
Under
KS
KI
LeakO
LeakI
(Omitted)/TH
TH
(Omitted)/GM
GM
AreaFact
AreaC
Description
Initial Value of Soil Moisture
Initial value of Overland Reservoir
Initial value of Interflow reservoir
the Soil saturate hydraulic conductivity
the multiplier on the precipitation field
The Mean Water Capacity
the exponent of the variable infiltration curve
Impervious area ratio
The factor to convert the PET to local actual
overland runoff velocity coefficient
overland flow speed exponent
multiplier used to convert overland flow
speed to channel flow speed
multiplier used to convert overland flow
speed to interflow flow speed
Overland reservoir Discharge Parameter
Interflow Reservoir Discharge Parameter
Threshold to determine which cells are river
cells
downstream cell is higher than the upstream
downstream cell is a nodata/outside region cell
multiplier that modifies the area of grid cells
5.2.1 Parameters.txt File
Required:
Always
Name:
Parameters.txt
Format:
33
Copyright © 2015 CREST V2.1 Fortran
ASCII
Purpose:
Contain the configuration for all parameters in CREST v2.1
Notes:
The statement in the “Parameters.txt” file can be listed in any order, but the
keywords should not be changed. The format of the statement is:
Keyword
=
Value
Such as:
SymbolType
=
Uniform/Distributed
If SymbolType
=
Uniform then
Symbol
=
Value
Else
Symbol.* file must be provided in the same folder.
End if
The statement appearing on the same line should be space- or tab-separated.
Comment lines must have a pound sign, #, in the first column.
Comment for the statement in the line must be placed after Value and be sure
to leave at least one space or tab between the Value and the Comments.
Keyword is not case sensitive.
5.2.2 “Sysmbol.*” File
Required:
Optional
Only needed when this parameter’s style is Distributed.
34
Copyright © 2015 CREST V2.1 Fortran
Name:
ParameterName.*
“ParameterName” possibly likes “Rain”
Format:
ASCII
Purpose:
Contain the configuration for all parameters in CREST v2.1
Notes:
The file coordinate system of Slope File should be same as DEM File.
5.3 State Folder
This
folder
contains
the
state
files,
such
as
“State_StartDate_SS0.*”,
“State_StartDate_SI0.*”and “State_StartDate_W0.*” when LoadState = “yes”. When
SaveState
=
“yes”,
then
“State_EndDate_SS0.*”,
“State_EndDate_SI0.*”and
“State_EndDate_W0.*” will be created after running the model.
5.4 ICS Folder
This folder contains all the configuration and values of initial conditions for the
mode.
5.4.1 InitialConditions.txt File
Required:
Always
Name:
InitialConditions.txt
Format:
ASCII
35
Copyright © 2015 CREST V2.1 Fortran
Purpose:
Contain the configuration for initial conditions in CREST v2.1
Notes:
The statement in the “InitialConditions.txt” file can be listed in any order, but
the keywords should not be changed. The format of the statement is:
Keyword
=
Value
Such as:
SymbolType
=
Uniform/Distributed
If SymbolType
=
Uniform then
Symbol
=
Value
Else
Symbol.* file must be provided in the same folder.
End if
The Symbol includes “SS0”, “SI0” and “W0” (see Table 5-1).
The statement appearing on the same line should be space- or tab-separated.
Comment lines must have a pound sign, #, in the first column.
Comment for the statement in the line must be placed after Value and be sure
to leave at least one space or tab between the Value and the Comments.
Keyword is not case sensitive.
5.4.2 “Sysmbol.*” File
Required:
Optional
Only needed when this parameter’s style is Distributed.
Name:
ParameterName.*
36
Copyright © 2015 CREST V2.1 Fortran
“ParameterName” possibly likes “Rain”
Format:
ASCII
Purpose:
Contain the configuration for all parameters in CREST v2.1
Notes:
The file coordinate system of Slope File should be same as DEM File.
5.5 OBS Folder
This folder contains all the observed runoff data for the model calibration or
verification.
The
file’s
name
is
name
as
“OutPixNameX_Obs.csv”
and/or
“OutletName_Obs.csv” (“.csv” is the comma delimited file). “OutPixNameX” and
“OutletName” are the same as the project file.
5.6 Calibs Folder
This folder contains all the configuration and values of calibration for the model.
Note: Users can learn how to calibration the model using ArcGIS from the workshop Dr.
Xianwu Xue hosted in Kenya, please click this link2 to access it.
5.6.1 Calibrations.txt File
Required:
Always
Name:
Calibrations.txt
Format:
2
http://hydro.ou.edu/files/Crest_Workshops/Kenya_Xianwu_2012/DayTwo/Hands-on%20Session-Calibrate%20the%20CREST%20Model.pdf
37
Copyright © 2015 CREST V2.1 Fortran
ASCII
Purpose:
Contain the configuration for calibrations in CREST v2.1
Notes:
The statement in the “Calibrations.txt” file can be listed in any order, but the
keywords should not be changed. The format of the statement is:
Keyword
=
Value
The statement appearing on the same line should be space- or tab-separated.
Comment lines must have a pound sign, #, in the first column.
Comment for the statement in the line must be placed after Value and be sure
to leave at least one space or tab between the Value and the Comments.
Keyword is not case sensitive.
38
Copyright © 2015 CREST V2.1 Fortran
Figure 5-2 Sample of “Calibrations.txt” file
1. SCE-UA Parameters
iseed:
Initial random seed;
maxn:
Max no. of trials allowed before optimization is terminated
kstop:
Number of shuffling loops in which the criterion value must chang
by the given percentage before optimization is terminated
pcento:
Percentage by which the criterion value must change in given
number of shuffling loops
ngs:
Number of complexes in the initial population
2. Configuration for calibration
NCalibStations: Number of Calibrated Stations
IsColRow:
Specified if the location of calibrated station is relative to the basic
grids or in latitude and longitude. A value of “yes” means the outlet
of the pixels is a column and row, a value of “no” means the outlet
39
Copyright © 2015 CREST V2.1 Fortran
is longitude and latitude.
3. Configuration for Each Station
Name_X:
The name of the Xth station
Value_X:
The region value of the Xth station
Long_X:
The longitude of the Xth station when IsColRow is assigned “no”.
Lati_X:
The latitude of the Xth station when IsColRow is assigned “no”.
Col_X:
The Column of the Outlet Pixels when IsColRow is assigned
“yes”.
Row_X:
The Row of the Outlet Pixels when IsColRow is assigned “yes”.
Label_X:
The minimum, initial value and maximum of the Xth Label
parameter for calibration. The label name can see Table 5-1Error!
Reference source not found.. The format of this statement is:
Label_X
=
Min
Value
Max
X is the number of station to calibration.
Only required when user want to calibrate this parameter.
5.6.2 CalibMask.* File
Required:
Optional
Name:
CalibMask.*
Format:
All Formats
Purpose:
Contain the order number for calibration, when have more than ONE calibrated
station. The number depends on the regional number of each station.
Notes:
The coordinate system of CalibMask File should be same as DEM File.
40
Copyright © 2015 CREST V2.1 Fortran
5.7 Rains Folder
This folder contains the precipitation data, the format of file in the folder depending
on the RainFormat specified in the “ProjectName.Project” file. The CREST model can
clip the region defined in the “ProjectName.Project” file automatically.
5.8 PETs Folder
This folder contains the potential evaporation data, the format of file in the folder
depending on the PETFormat specified in the “ProjectName.Project” file; and the
CREST v2.1 can clip the region defined in the “ProjectName.Project” file automatically.
5.9 Results Folder
This folder contains the output files, the format of file in the folder depending on the
ResultFormat specified in the “ProjectName.Project” file.
41
Copyright © 2015 CREST V2.1 Fortran
6 Run Styles
Different run styles have different combinations of outputs; the following section
will introduce the outputs for each style.
6.1 Simulation
6.1.1 Running in Simulation Mode
To run the model in simulation mode the run style in the project file must be set to
"simu". Precipitation data and PET data are also needed for the simulation period. By
default CREST reads the “ProjectName.Project” located in the current working directory.
However, as of CREST v2.1 it is possible to specify the project file name as a command
line option to the CREST executable.
43
Copyright © 2015 CREST V2.1 Fortran
6.1.2 Simulation Mode Standard Outputs
Figure 6-1 Output results in screen for Simulation mode
The 1 line is the comment for requiring user to enter the name of the project file.
The 2 line is the user-typed line for the name and path of the project file.
The 3 line is the separation line.
The 4~6 line is the information of the CREST v2.1.
The 7 line is the separation line.
The 8 line is the start date and time for running the model.
The 9 line is the separation line.
The 10~21 line is the reading and writing data.
The 22 line is the separation line.
The 23 line is the information for running style to the current running model.
The 24~32 line is the reading and writing data.
The 33 line is the separation line.
44
Copyright © 2015 CREST V2.1 Fortran
The 34~37 line is the output results.
The 38 line is the separation line.
The 39 line is the end date and time for running the model.
The 40 line is the elapsed run time for running the model.
6.1.3 Simulation Mode File Outputs
Besides output the results to the screen, CREST v2.1 also outputs the results to a log
file
in
the
same
folder
as
project
file,
“ProjectName_YYYY.MM.DD-HH.UU.SS_CREST.log”,
named
for
as
example:
“NZoia_2011.02.07-00.33.05_CREST.log”. The time in this file’s name depending on
the date and time the model is running. The log file will help the user record all the
things the user wants to see, even on the Linux operating system.
There are many files to output when the model is running in the simulation mode:
Mask.*: When the mask file is omitted in the basics folder.
Slope.*: When the slope file is omitted in the basics folder.
Outlet_OutletName_Mask.*: The mask file for the specified outlet.
Outlet_OutletName_Results.csv: The results for the outlet location (Table 6-1).
(Regional
Mean
Value
based
on
the
Outlet_OutletName_Mask.*)
Table 6-1 Sample of Outlet_OutletName_Results.csv
DateTime
Rain
PET
EPot
EAct
W
SM
RS
RI
ExcS
ExcI
R
RObs
2003/1/1 0:00
0
0.215
0.043
0.023
38.451
0.534
1.114
1.452
0
0
0.605
0.605
2003/1/1 3:00
0
0.215
0.043
0.023
38.382
0.533
1.112
1.452
0
0
2.359
2.359
2003/1/1 6:00
0.009
0.215
0.043
0.024
38.331
0.533
1.107
1.452
0
0.002
3.375
3.375
2003/1/1 9:00
0
0.215
0.043
0.023
38.263
0.532
1.1
1.452
0
0
4.655
4.655
2003/1/1 12:00
0
0.215
0.043
0.023
38.194
0.531
1.089
1.452
0
0
6.218
6.218
2003/1/1 15:00
0.889
0.215
0.043
0.03
39.705
0.552
1.15
1.508
0.131
0.225
7.681
7.681
2003/1/1 18:00
0.018
0.215
0.043
0.025
39.668
0.551
1.137
1.509
0.001
0.004
8.794
8.794
2003/1/1 21:00
0
0.215
0.043
0.024
39.597
0.55
1.122
1.508
0
0
9.526
9.526
2003/1/2 0:00
0
0.215
0.043
0.024
39.526
0.549
1.108
1.508
0
0
10.018
10.018
Outlet_OutletName_ Results_Statistics.csv: The statistics for outlet location.
Table 6-2 Sample of Outlet_OutletName_Results_Statistics.csv
45
Copyright © 2015 CREST V2.1 Fortran
NSCE
1
Bias(%) 2.72E-03
CC
1
OutPix_OutPixName_X_Mask.*: The mask file for the specified output pixel.
OutPix_OutPixName_X_Results.csv: The results for the output pixel location.
(Regional
Mean
Value
based
on
the
Outlet_OutPixName_X_Mask.*)
OutPix_OutPixName_X_Results_Statistics.csv: The statistics for outlet location
(Table 6-2).
6.2 Automatic Calibration using SCE-UA
6.2.1 Running in Automatic Calibration Mode using SCE-UA
To run the model in automatic calibration mode using SCE-UA, the run style in the
project file must be set to "cali_SCEUA". Precipitation data, PET data and observed
discharge are all needed for the calibration period. A special feature such as Reinitializing
or Resuming Calibration has been included in CREST v2.1.
6.2.2 Automatic Calibration Mode Standard Output using SCE-UA
46
Copyright © 2015 CREST V2.1 Fortran
47
Copyright © 2015 CREST V2.1 Fortran
Figure 6-2 Output results in screen for cali_SCEUA mode
The 1 line is the comment for requiring user to enter the name of the project file.
The 2 line is the user-typed line for the name and path of the project file.
The 3 line is the separation line.
The 4~6 line is the information of the CREST v2.1.
The 7 line is the separation line.
The 8 line is the start date and time for running the model.
The 9 line is the separation line.
The 10~21 line is the reading and writing data.
The 22 line is the separation line.
The 23 line is the information for running style to the current running model.
The 24~32 line is the reading and writing data.
The 33 line is the separation line.
The 34~36 line is the parameters information for SCE-UA method.
The 37 line is the separation line.
The 38~51 line is the output results for each loop of SCE-UA method.
The 52~65 line is the output results simulated using the calibrated parameters.
The 66 line is the separation line.
The 67 line is the end date and time for running the model.
The 68 line is the elapsed run time for running the model.
6.2.3 Automatic Calibration Mode File Output using SCE-UA
Besides output the results to the screen, CREST v2.1 also outputs the results to a log
file
in
the
same
folder
as
project
“ProjectName_YYYY.MM.DD-HH.MM.SS_CREST.log”,
file,
for
named
as
example:
“NZoia_2011.02.07-00.33.05_CREST.log”. The time in this file’s name depending on
the date and time the model ran. The log file will help the user record all the things the
user wants to see, even on the Linux operating system.
There are many files to output when the model is running in the “cali_SCEUA”
mode:
48
Copyright © 2015 CREST V2.1 Fortran
Mask.*: When the mask file is omitted in the basics folder.
Slope.*: When the slope file is omitted in the basics folder.
Outlet_OutletName_Mask.*: The mask file for the specified outlet.
Outlet_OutletName_Results.csv: The results for the outlet location (Table 6-1).
(Regional
Mean
Value
based
on
the
Outlet_OutletName_Mask.*)
Outlet_OutletName_ Results_Statistics.csv: The statistics for outlet location.
OutPix_OutPixName_X_Mask.*: The mask file for the specified output pixel.
OutPix_OutPixName_X_Results.csv: The results for the output pixel location.
(Regional
Mean
Value
based
on
the
Outlet_OutPixName_X_Mask.*)
OutPix_OutPixName_X_Results_Statistics.csv: The statistics for outlet location.
SCEUAOut_YYYY.MM.DD-HH.UU.SS.dat: The results for SCE-UA method
Label.*: The calibrated parameters file. Labels shows in Table 5-1.
6.3 Simulation in real time mode
6.3.1 Running in Real Time Mode
To run the model in real time mode, the run style in the project file must be set to
"RealTime". Precipitation data and PET data are needed for the real time period.
6.3.2 Real Time Mode Standard Output
It is the same as Simulation mode, however, the end date and time depending on the
latest available precipitation and PET data or images.
6.3.3 Real Time Mode File Output
It is the same as Simulation, however, the end date and time is up to the available
precipitation and PET.
49
Copyright © 2015 CREST V2.1 Fortran
6.4 Return Period mode
6.4.1 Running in “repe” Mode
To run the model in “repe” (Return Period) mode, the run style in the project file
must be set to "repe". It needs run the model in “simu” mode with GOVar_R=”yes” in
advance, and then run the model in “repe” mode.
6.4.2 Real Time Mode Standard Output
50
Copyright © 2015 CREST V2.1 Fortran
Figure 6-3 Output results in screen for Return Period mode
The 1 line is the comment for requiring user to enter the name of the project file.
The 2 line is the user-typed line for the name and path of the project file.
The 3 line is the separation line.
The 4~6 line is the information of the CREST v2.1.
The 7 line is the separation line.
The 8 line is the start date and time for running the model.
The 9 line is the separation line.
51
Copyright © 2015 CREST V2.1 Fortran
The 10~19 line is the reading and writing data.
The 20 line is the separation line.
The 21 line is the information for running style to the current running model.
The 22~29 line is reading runoff data.
The 30 line is sorting for return period.
The 31 line is exporting file Num 1.
The 32 line is the separation line.
The 33 line is the end date and time for running the model.
The 34 line is the elapsed run time for running the model.
6.4.3 Return Period Mode File Output
Besides output the results to the screen, CREST v2.1 also outputs the results to a log
file
in
the
same
folder
as
project
“ProjectName_YYYY.MM.DD-HH.MM.SS_CREST.log”,
file,
for
named
as
example:
“NZoia_2011.02.07-00.33.05_CREST.log”. The time in this file’s name depending on
the date and time the model ran. The log file will help the user record all the things the
user wants to see, even on the Linux operating system.
There is only one types of file to output when the model is running in the “repe”
mode:
Level.X.*: X is the level number, recording the return period values.
52
Copyright © 2015 CREST V2.1 Fortran
7 Implementation of the CREST model for other basins
The CREST model automatically runs over the region defined by the project file.
Therefore, if you are operating with global basic grids it is possible to easily and quickly
model a basin in the world by just simply defining the outlet of a new basin. In the event
that the basic grids you are using do not cover the region which you want to model or if
you want to model a region with a finer resolution then it is necessary to derive new
project file. The steps to do this are described below.
Fully implementing the CREST model on any basin can be achieved in a three-step
process:
1. A project file for the new modeling region needs to be created.
a. Copy an existing project file (even one of the provided example
project files) and modify the paths to point to the location of the new
paths of the folders.
b. Determine the latitudes and longitudes of a rectangle around the
region which you wish to model. These do not have to be precise by
any means and can be pulled from Google Earth or Google Maps for
an approximate region around the basin you wish to model. However,
the basin you wish the model on must be entirely contained in the
bounding rectangle you specified.
c. In order for CREST to work with the DEM, FDR and FAC files
produced by the CNT Tool or other software, they must be named
DEM.*, FDR.* and FAC.*.
2. The model can now be run for your new basin in any desired modes. To get
realistic results it is necessary to generate a prior parameters from available
land surface datasets or later calibrate the model using a gauged station
within your defined new basin. The automatic calibration built into the
53
Copyright © 2015 CREST V2.1 Fortran
CREST model is the easiest way to calibrate the model.
54
Copyright © 2015 CREST V2.1 Fortran
8 Contact
Development and maintenance of the current official version of the OU-NASA
CREST model is conducted at the University of Oklahoma, Hydrometeorology and
Remote Sensing Laboratory (http://hydro.ou.edu) and Advanced Radar Research Center
(ARRC) located in the National Weather Center (http://nwc.ou.edu). For information
about the current release and future development plan of the CREST model family,
please visit the page (http://hydro.ou.edu/research/crest/), or send e-mail to Dr. Yang
Hong ([email protected]) and Dr. Xianwu Xue ([email protected]).
9 Selected CREST model Related References
Wang. J., Y. Hong, L. Li, J.J. Gourley, K. Yilmaz, S. I. Khan, F.S. Policelli, R.F. Adler, S.
Habib, D. Irwn, S.A. Limaye, T. Korme, and L. Okello, 2011: The Coupled
Routing and Excess STorage (CREST) distributed hydrological model. Hydrol.
Sciences Journal, 56, 84-98.
Xue X, Hong Y, Limaye AS, Gourley JJ, Huffman GJ, Khan SI, et al., 2013: Statistical
and hydrological evaluation of TRMM-based Multi-satellite Precipitation
Analysis over the Wangchu Basin of Bhutan: Are the latest satellite precipitation
products 3B42V7 ready for use in ungauged basins? Journal of Hydrology,
499(0): 91-99.
Khan, S. I., Y. Hong, J. Wang, K.K. Yilmaz, J.J. Gourley, R.F. Adler, G.R. Brakenridge,
F. Policelli, S. Habib, and D. Irwin, 2011: Satellite Remote Sensing and
Hydrologic Modeling for Flood Inundation Mapping in Lake Victoria Basin:
Implications for Hydrologic Prediction in Ungauged Basins, IEEE Transactions
on
Geosciences
and
Remote
Sensing,
55
49(1),
85-95,
Jan.
2011, doi:
Copyright © 2015 CREST V2.1 Fortran
10.1109/TGRS.2010.2057513
Wu H, Adler RF, Hong Y, Tian Y, Policelli F., 2012: Evaluation of Global Flood
Detection Using Satellite-Based Rainfall and a Hydrologic Model. Journal of
Hydrometeorolog, 13(4): 1268-1284.
56
Copyright © 2015 CREST V2.1 Fortran
10 Appendix A Look-up Tables
Table 10-1 Look-up Table for UMD Vegetation Types
Value
0
1
2
3
4
5
6
7
8
9
10
11
12
13
UMD Vegetation Category
Water
Evergreen Needleleaf Forest
Evergreen Broadleaf Forest
Deciduous Needleleaf Forest
Deciduous Broadleaf Forest
Mixed Forest
Woodland
Wooded Grassland
Closed Shrubland
Open Shrubland
Grassland
Cropland
Bare Ground
Urban and Built
57
Rooting Depth
(m)
0.001
1
1.25
1
1.25
1.125
0.997
0.872
0.651
0.578
0.75
0.75
0.55
0.797
Copyright © 2015 CREST V2.1 Fortran
Table 10-2 Look-up Table for HWSD Soil Texture
Code
Texture
Abbr.
Fild
Capacity
θfc(m3/m3)
0
1
2
3
4
5
6
7
8
9
10
11
12
13
No_Soil
Clay(heavy)
Silty Clay
Clay
Silty Clay Loam
Clay Loam
Silt
Silt Loam
Sandy Clay
Loam
Sandy Clay Loam
Sandy Loam
Loamy Sand
Sand
NS
CH
SIC
C
SICL
CL
SI
SIL
SC
L
SCL
SL
LS
S
0
0.36
0.36
0.36
0.34
0.34
0.32
0.3
0.31
0.26
0.33
0.23
0.14
0.12
Permanent
Wilting
Point θpw
(m3/m3)
0
0.21
0.21
0.21
0.19
0.21
0.165
0.15
0.23
0.12
0.175
0.1
0.06
0.04
Table 10-3 Range and Default value of Each Parameter
Params
RainFact
(l)
Ksat
(mm/d)
WM(mm)
B (l)
IM (l)
KE (l)
coeM
expM (l)
coeR (l)
coeS (l)
KS (l)
KI (l)
Min
Default
Max
0.5
1.0
1.2
0
500
1000
80
0.05
0
0.1
1
0.1
1
0.001
0
0
120
0.25
0.05
0.95
90
0.5
2
0.3
0.6
0.25
200
1.5
0.2
1.5
150
2
3
1
1
1
58
Hydraulic
conductivity
Ksat (cm/h)
0.00001
0.03
0.05
0.075
0.1
0.1
0.495
0.65
0.15
0.34
0.15
1.09
2.99
11.78