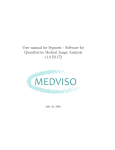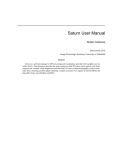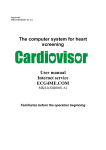
1
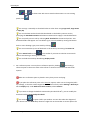
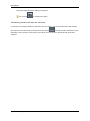
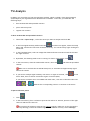
® QMass MR 7.6 Quick Start Manual November 20, 2013 9.10.250.76.2 v1c0 Medis medical imaging systems bv Schuttersveld 9 2316 XG Leiden P.O. Box 384 2300 AJ Leiden the Netherlands Medis medical imaging systems, Inc. 9360 Falls of Neuse Road, Suite 103 Raleigh, NC 27615-2484 USA Telephone: +31 71 522 32 44 Fax: +31 71 521 56 17 E-mail: [email protected] Web: www.medis.nl Telephone: +1 919 278 7888 Fax: +1 919 847 8817 E-mail: [email protected] Web: www.medis.nl QMass® MR 7.6 Quick Start Manual II Legal Notices Copyright Notice © 2010-2013 Medis medical imaging systems bv. All rights reserved. This manual is copyrighted and is protected by worldwide copyright laws and treaty provisions. No part of this manual may be copied, reproduced, modified, published or distributed in any form or by any means, for any purpose, without prior written permission of Medis medical imaging systems bv. Permission is granted to freely print unmodified copies of this document as a whole, provided that copies are not made or distributed for profit or commercial advantage. Trademark Acknowledgments QMass and QFlow are registered trademarks of Medis Associated BV in the United States and in other countries. All other brand, product, and company names mentioned in this document are trademarks or registered trademarks of their respective owners. Regulatory Information Intended Use QMass has been developed for the objective and reproducible analysis of LV and RV function based on cardiac MR and CT reformatted data sets. The software enables the display of images for use by trained medical personnel. The intended purposes are: Supporting clinical diagnoses on the status of the global and regional function and anatomy of the cardiac chambers. Supporting the subsequent clinical decision making processes. WARNINGS QMass must be used by cardiologists, radiologists, or trained technicians who are qualified to perform cardiac analyses. If the analysis results are used to reach a diagnosis, the results must be interpreted by a qualified medical professional. In clinical practice QMass should not be used for purposes other than those indicated in the section Intended Use. Users must make sure to read this manual to become familiar with the software and be able to obtain reliable analysis results. QMass® MR 7.6 Quick Start Manual III European Regulations 0120 QMass is qualified as a class IIa medical device. It complies with the requirements of the Dutch Medical Devices Decree (Besluit Medische Hulpmiddelen, Stb. 243/1995) and the European Medical Device Directive 93/42/EEC. North American Regulations QMass has been cleared for market in the United States by the FDA (Food and Drug Administration) under the provisions of Section 510(k) of the Food, Drug, and Cosmetic Act, with the exception of the first-pass perfusion analysis, late-enhancement analysis and T1 mapping modules, as the use of contrast agents for cardiac MR procedures is not FDA-approved. The first-pass perfusion analysis, late-enhancement and T1 mapping analysis modules are available in the United States for scientific research purposes only. QMass complies with the requirements of the Canadian Medical Devices Regulations and has been licensed as a Class II medical device. QMass® MR 7.6 Quick Start Manual IV Conventions Used The following conventions are used throughout this manual to indicate mouse and keyboard actions and to refer to elements in the user interface. Mouse Click Press and release the primary mouse button. If you are lefthanded, you may have set the right mouse button as your primary mouse button. Right-click Press and release the secondary mouse button. If you are lefthanded, you may have set the left mouse button as your secondary mouse button. Middle-click Press and release the wheel button or the middle mouse button. If you have a two-button mouse, press and release the left and the right mouse button simultaneously. Double-click Press and release the primary mouse button twice. Keyboard SHIFT+click Press and hold down the SHIFT key on your keyboard while you click a button or object. CTRL+O Press and hold down the CTRL key on your keyboard while you press O, then release both keys. This example opens the dialog window for opening a study. Typographical Conventions On the Display tab, select the Hide all drawings option. Names of buttons, fields, menus, menu options, and tab names are capitalized and in bold. View > Movie A sequence of menu options that you select to perform a specific task, is indicated by angular brackets. Contours can be saved in a .CON file. Text that you type or that appears on the screen, such as file names and file locations, is displayed in Courier New. QMass® MR 7.6 Quick Start Manual V Symbols Used Reference. Points to related documentation or to related sections in the document that may be relevant in your situation. Tip. Provides helpful information or an alternative working method. Note. Brings additional information to your attention. Caution. Tells you to be careful when performing a task. Warning. Warns you for a potentially dangerous situation in the image representation or analysis, which may lead to incorrect results. You are advised to follow the instructions to avoid this. QMass® MR 7.6 Quick Start Manual VI Table of Contents Table of Contents ...................................................................................................VII INTRODUCTION ....................................................................................................... 1 About QMass ........................................................................................................... 1 The QMass Workspace ............................................................................................... 1 QUICK TOUR .......................................................................................................... 2 Starting QMass and Reviewing Studies ............................................................................ 2 Performing LV Function Analysis ................................................................................... 4 Performing extended LV Function Analysis ...................................................................... 6 Creating Reports ...................................................................................................... 7 DSI ANALYSIS ....................................................................................................... 10 AAR ANALYSIS ...................................................................................................... 13 TSI ANALYSIS........................................................................................................ 14 T1 ANALYSIS ........................................................................................................ 17 Closing QMass ........................................................................................................ 23 MORE INFORMATION .............................................................................................. 24 QMass® MR 7.6 Quick Start Manual VII Introduction About QMass QMass is Medis' software solution for the analysis of cardiac MRI studies. Its automatic contour detection enables you to perform quantitative analyses quickly and accurately. QMass features ventricular function analysis, scar tissue analysis (referred to as Delayed Signal Intensity or DSI analysis), Edema analysis, Area at Risk (referred to as AAR), first-pass perfusion analysis (referred to as time-signal intensity or TSI analysis), stress level function analysis (referred to as comparison analysis), T1 analysis, T2 analysis, and T2* analysis. QMass can also read CT reformatted data and perform functional analysis on that data. QMass must be used by qualified medical personnel or trained technicians. If the analysis results are used to reach a diagnosis, the results must be interpreted by a qualified medical professional. QMass should not be used for purposes other than those indicated in the section Intended Use. QMass cannot perform scar tissue analysis, perfusion analysis, T1 analysis, T2 analysis, and T2* analysis on CT reformatted data. The QMass Workspace The QMass main workspace consists of a menu bar, a set of toolbars, a study matrix and three views. Which icons are active in the toolbars, depends on the type of study that is being analyzed and on its orientation. The scanline views present the slice position of the selected series. In the first two views, you can switch to another series by right-clicking and selecting the new series. You can also pan, and you can zoom in or zoom out by using the sliders. MENU BAR TOOLBARS STUDY MATRIX ACTIVE VIEW SCAN LINE VIEWS THUMBNAIL VIEW QMass® MR 7.6 Quick Start Manual 1 Quick Tour In this quick tour, you will get to know QMass's key features and basic workflow. You will open a study, review it, perform an LV function analysis, view analysis results, create a report, and export the report. You can find instructions on performing late-enhancement and first-pass perfusion analysis in the last two sections of this Quick Start Manual. Starting QMass and Reviewing Studies QMass is usually installed by Medis support personnel or by your system administrator. If you need installation instructions, refer to the QMass Installation Manual on the installation CD-ROM. To start QMass Double-click the QMass icon on the desktop. Select Start > (All) Programs > Medis QMass > QMass 7.6. Or, To open a study 1. Click or select File > Open Study…. In the dialog window, browse the directory structure and select the directory in which the series are located. 2. In the upper pane of the dialog window, double-click the series, or select the series and click OK. Make sure to leave the Comparison mode check box unselected when you are opening a study that is not a comparison study. To select a series If you have opened more than one series, you can switch between the series by clicking their tabs under the Study Matrix. Move the mouse over a tab to view a tooltip that shows the series name. QMass® MR 7.6 Quick Start Manual 2 Quick Tour To browse a series Use the arrow keys on your keyboard to scroll the images in the Thumbnail View and in the Active View. To select an image Click an image in the Thumbnail View to select it. This displays the image in the Active View. In the Thumbnail View, the selected image is marked with a red frame. To view a series in the Movie window Click in the toolbar or press F5. To scroll the series in the Movie window Use the arrow keys on your keyboard. To switch between series in the Movie window Press the PgUp or PgDn key on your keyboard. To zoom in or out Use the slider under the View, or click or in the toolbar. To pan Press the middle mouse button or mouse wheel, hold it down and drag. This pans the image. To return to editing mode, release the middle mouse button or mouse wheel. To adjust window width and level Press 2 on the keyboard to optimize window width and level. In the Active View, right-click and drag. Move the mouse to the left or right to adjust window width, move it up or down to adjust window level. Or, QMass® MR 7.6 Quick Start Manual 3 Performing LV Function Analysis Now that we have reviewed the series, we are going to perform an LV function analysis using the Ventricular Analysis wizard. There are a number of wizards in QMass, which provide a guided workflow to help you perform an analysis quickly and easily. The Ventricular Analysis wizard consists of four steps: selecting the long-axis series and the short-axis series, and placing valve and apex markers in the ED phase of the long-axis series placing markers in the ES phase of the long-axis series, and selecting the type of contours to be detected reviewing the detected contours reviewing the results The Ventricular Analysis wizard is only available when the study contains both long-axis and short-axis cine images. If you have no long-axis images, you can still perform an analysis using the standard automatic detection feature. Refer to the QMass User Manual for instructions. To perform an LV function analysis using the Ventricular Analysis wizard 1. In the Study Matrix, select the tabs of the various series and check for each series if the correct icons are displayed in the toolbar. If needed, you can correct the labeling of a series by right-clicking its tab and selecting the correct label from the menu. 2. Select Analysis > Ventricular Analysis Wizard. 3. Under Series Selection, from the LAX series drop-down list, select the long-axis series you want to use as a reference to specify the locations of the mitral valve and the apex. If you have loaded a long-axis radial scan, you can select the long-axis slice you want to use in the LAX Slice field. From the SAX series drop-down list, select the short-axis cine series you want to analyze. Under ED Phase, check if the phase presented as the LV ED phase is correct. In the Active View, pick up the long-axis markers and drag them to the correct positions. Place the A marker over the apex, and place the B markers over the mitral valves. QMass® MR 7.6 Quick Start Manual 4 LV Functional Analysis Click Next. 4. Under ES Phase, check the phase. In the Active View, place the A and B markers as described in the previous step. Under Contour Selection, select the type of contours that you want to be detected in the short-axis images. Click Next. 5. When the automatic contour detection has finished, review the detected contours. Review both the ED phase and the ES phase by selecting the corresponding View icon. To ensure that analysis results are accurate, all automatically detected contours must be reviewed and edited where necessary. For an overview of all detected contours, you can switch to the Study Matrix tab. To edit a contour, click , or and then start editing. For detailed instructions on editing, refer to the QMass User Manual. To exclude or include individual images, click the green or red square in the bottom right corner in the Thumbnail View. This automatically removes or detects contours. Click Next. 6. To switch between viewing the ED and the ES phase in the Thumbnail View, click the corresponding View button in the wizard. To change the ED or ES phase and automatically redetect contours, select the new phase number under Redetect Contours in the wizard, and click Apply. To obtain regional analysis results, make sure that is selected, and then click in the Active View to mark the posterior or anterior septum in the current slice. Repeat this for the other slices you are analyzing. If you place the reference point at the anterior septum, make sure to first change the bull's-eye settings, so that the cardiac segments are labeled correctly. Select Settings > Bull's-Eye… On the Display tab, under Reference Point Location, select Anterior and click OK. QMass® MR 7.6 Quick Start Manual 5 LV Functional Analysis To obtain regional analysis results, you need an additional license. 7. Click results. or to view analysis results. Click to view regional analysis To save the contours you created, select File > Save from the menu bar. 8. Click Done to close the wizard. Performing extended LV Function Analysis The Blood muscle segmentation checkbox in the Functional Analysis offers an alternative method to determine, blood and muscle volumes for functional analysis, in addition to papillary muscle volume. Using a threshold slider one can determine a threshold that distinguishes blood from muscle in both the Right Ventricular aswell as the Left Ventricular chambers. The threshold can be copied to other slices or phases. To perform a functional analysis using blood and muscle segmentation 1. Select the tab Functional Analysis and select the checkbox Blood muscle segmentation. 2. Draw the Epicardial contours in all slices and phases. 3. Draw the Endocardial contours if one needs to distinguish between Papillary volume and Myocardial volume. 4. Drag the LV or RV thresholds slider to modify the blood muscle classification. 5. Click the toolbar button, “Edit LV Papillary” tissue to manually add or remove muscle tissue. 6. Click to view analysis results, or view the results in the Volume graph in the Functional Analysis Tab QMass® MR 7.6 Quick Start Manual 6 LV Functional Analysis Creating Reports Reports contain a summary of patient and study information and a number of analysis results. You can create graphic reports (save as HTML, PDF or as DICOM SC), text reports (save as TXT or as DICOM SC), or XML reports. Graphic reports may contain images, movie frames, movies and result diagrams. To create a report 1. Click or press F9. 2. From the Report Layout drop-down list, select a new report type if needed. This immediately creates the new report. 3. To create a text or XML report, select the TXT or XML tab. If you are creating a text report, you can select the results you are interested in by selecting the corresponding check boxes under Contents. You can select the level of detail from the Detail drop-down list. Click Generate. 4. Click Save at the bottom of the Report window. QMass® MR 7.6 Quick Start Manual 7 Edema Analysis An Edema analysis helps you determine the amount of Edematose tissue in the myocardium. This chapter explains how to perform an analysis using the Edema wizard. Performing an Edema Analysis QMass features an Edema analysis. It is a simple one page analysis tool. One should: Create LV endocardial and epicardial contours Detect and verify the areas of healthy and edema myocardium Verify the Edema threshold and segmentation To perform an Edema analysis 1. Load an Edema dataset into QMass. See also, “Transferring contours from short axis cine series.” 2. Select the Edema series you want to analyze. 3. Start the Edema Analysis Wizard by pressing next to Wizard. 4. In the wizard, click and select Edema Analysis and draw LV endocardial contours in each slice of the series in the Active View. Similarly, click the series. to draw LV epicardial contours in each slice of See also, “Transferring contours from short axis cine series”. 5. Click Detect and check if the ROI1 contour is detected in healthy myocardium and if ROI2 is detected in Edema myocardium. If necessary, you can edit the contours or redetect them using the Detect button. 6. Check the Edema core threshold by reviewing the edematose tissue segmentation in all slices. You can override the calculated threshold by dragging the slider under Intensity Threshold. You can copy a manually set threshold value to other slices using Copy to All, Copy Down or Copy Up. You can calculate another threshold value based on the healthy contour area by specifying the Standard Deviation calculation method and to supply a standard deviation. QMass® MR 7.6 Quick Start Manual 8 Edema Analysis Click to draw areas with Edema tissue. To start erasing pixels, click . You can hide the masks by deselecting Display masks. You can click to create an Edema report. Transferring contours from short axis cine series If contours are already available in the short axis cine series, you can load the series and transfer the contours from this series to the Edema series by clicking . Contour transfer works best if you manually create contours in the phase of the short axis cine series in which the Edema series was scanned. QMass® MR 7.6 Quick Start Manual 9 DSI Analysis In QMass, you can perform a scar tissue analysis using the Delayed Signal Intensity (DSI) wizard if your organization has obtained the DSI module. The wizard consists of four steps: creating LV endocardial and epicardial contours verifying the areas of healthy and hyper-intense myocardium verifying the DSI threshold and segmentation placing a reference point, setting the transmurality threshold, viewing the results and creating a report To perform a DSI analysis 1. Load a DSI dataset into QMass. See also, “Transferring contours from short axis cine series.” 2. Select the DSI series you want to analyze. 3. Start the DSI Analysis Wizard by pressing next to 4. In the wizard, click and select DSI Analysis Wizard. and draw LV endocardial contours in each slice of the series in the Active View. Similarly, click to draw LV epicardial contours in each slice of the series. See also, “Transferring contours from short axis cine series”. 5. Click Apply and check if the ROI1 contour is detected in healthy myocardium and if ROI2 is detected in hyper-intense myocardium. If necessary, you can edit the contours or re-detect them using the Apply button. The DSI core threshold is also calculated when the Apply button is pressed. The calculated threshold value is copied automatically to all other slices if the option Auto copy is selected. If you use the Apply button without Auto copy selected, then the ROI contours and threshold value are determined for the current slice only. You can repeat this for each slice separately. 6. Check the DSI core threshold by reviewing the scar tissue segmentation in all slices. You can override the calculated threshold by dragging the slider under Intensity Threshold. QMass® MR 7.6 Quick Start Manual 10 DSI Analysis Click pixels, click and to draw areas with micro-vascular obstructions. To start erasing . You can copy a manually set threshold value to other slices using Copy to All, Copy Down or Copy Up. You can calculate another threshold value based on the healthy contour area by specifying the Standard Deviation calculation method and to supply a standard deviation. You can specify areas at risk by selecting Dual Threshold in the DSI analysis box. Two threshold sliders will appear. You can define a gray-zone threshold by moving the bottom slider or start drawing a gray-zone mask by clicking . You can increase the tip size of the brush or the eraser by increasing the Draw size. Select Smart brush or click in the toolbar if you want to edit the current mask without overwriting or erasing other masks. You can hide the masks by deselecting Display masks. 7. Set a reference point. You can place a reference point by clicking and setting a reference point in the Active view at the inferior or anterior end of the interventricular septum. Make sure a reference point is placed in every slice you are analyzing. If you place the reference point at the anterior septum, make sure to change the bull'seye settings, so that the cardiac segments are labeled correctly. Select Settings > Bull's-Eye… On the Display tab, under Reference Point Location, select Anterior. If you want to change the default transmurality threshold of 50 %, you can modify the threshold under Transmurality Threshold. You can click to open a bull’s-eye window. You can also select the diagram of your choice from the Show drop-down list. Right-click in the window to access options for QMass® MR 7.6 Quick Start Manual 11 DSI Analysis saving the diagram and for adding it to reports. You can click to create a DSI report. Transferring contours from short axis cine series If contours are already available in the short axis cine series, you can load the series and transfer the contours from this series to the DSI series by clicking . Contour transfer works best if you manually create contours in the phase of the short axis cine series in which the DSI series was scanned. QMass® MR 7.6 Quick Start Manual 12 AAR Analysis Area At Risk (AAR) analysis helps one determine the amount of edematose tissue in the myocardium that is defined as salvageable tissue. This chapter explains how to perform an AAR analysis. Performing an AAR Analysis QMass features an AAR analysis. It is a simple analysis tool. One should: Load and create LV endocardial and epicardial contours in both Edema and DSI series. Do an Edema and DSI analysis on the respective datasets. To perform a AAR analysis 1. Load a DSI and Edema dataset into QMass. 2. 3. 4. 5. Start the AAR Analysis Wizard by pressing next to and select AAR. Complete a DSI analysis on the DSI dataset. Complete an Edema analysis on the Edema dataset. Review the AAR Results in the AAR tab of the AAR analysis. In the AAR analysis, the edema volume is always assumed to be larger or equal to the volume of the scar (DSI core) tissue. If the scar tissue is greater in volume than the edema volume then the volume and calculations will be rounded to zero as opposed to showing the negative values. QMass® MR 7.6 Quick Start Manual 13 TSI Analysis In QMass, you can perform a first-pass perfusion analysis, which is called a Time Signal Intensity (TSI) analysis if your organization has obtained the TSI module. To do this, you must take the following steps: draw endocardial and epicardial contours place reference points register the contours To draw endocardial and epicardial contours 1. Select File > Open Study…, select the series you want to analyze and click OK. 2. If the Time Signal Intensity toolbar with the icon does not appear, select the Study Matrix tab, and check if the series is labeled correctly. You can do this by right-clicking the series tab. 3. In the Thumbnail View, select an image that shows sufficient contrast in both the left and the right ventricle. 4. By default, the drawing mode is set to tracing. To draw in point mode, click 5. In the Active View, draw the endocardial contour, then click contour. . and draw the epicardial Make sure to exclude the LV and RV blood pool, to avoid that its high intensity signal affects the results. 6. If you want to analyze signal intensity over time in a region of interest, click Active View, draw a contour around the region of interest (ROI). . In the If you want to compare one or more ROIs with each other, click one of the other ROI icons , , or and draw the corresponding contour or contours in the Active View. To place reference points 1. Click . 2. In the Active View, place a reference point at the inferior or anterior junction of the right ventricle and the left ventricle. If you place the reference point at the anterior septum, make sure to first change the bull's-eye settings, so that the cardiac segments are labeled correctly. Select Settings > QMass® MR 7.6 Quick Start Manual 14 TSI Analysis Bull's-Eye… On the Display tab, under Reference Point Location, select Anterior and click OK. To register contours 1. If you have drawn one or more ROIs, select the corresponding menu item or items from the Registration submenu. Click the arrow next to Contours and the other menu items that apply. 2. Click and then select Register ROI1 . This copies the selected contours to the other images in the slice and performs breathing motion correction. Contour registration is performed based on the contour registration settings. To access and modify these settings, select Settings > Registration… 3. Check the contours in the Thumbnail View or in the Movie Tool to see if the automatic positioning of the contours needs correcting. To move a set of contours to another position, press SHIFT+CTRL and drag them to their new position. Do not edit the contours using the drawing tools. If you want to add new ROIs after performing registration, make sure to create the ROI contours in the same image in which you created the initial contours. To view TSI analysis results 1. Click to display the analysis results in a graph. 2. From the Show drop-down list, select the Myo Intensity – Time or ROI Intensity – Time graph. Or, 1. Click to display the analysis results in a bull's-eye diagram. 2. From the Show drop-down list, select SI Analysis. This adds a drop-down list to the dialog window. 3. Select the type of diagram that you want to view. For a detailed description of the bull's-eye diagrams, refer to the User Manual. QMass® MR 7.6 Quick Start Manual 15 TSI Analysis To create a report and save the analysis 1. Click or press F9 to open the report window. This creates a report in the layout last selected. From the Report Layout drop-down list, select Time SI. Click Save at the bottom of the Report window. 2. To save the analysis, select File > Save > All Series QMass® MR 7.6 Quick Start Manual 16 T1 Analysis If you have the T1 analysis module, you can use QMass to analyze the T1 magnetization recovery of a region of interest. This chapter explains how to: Perform a T1 analysis Create a T1 analysis report A T1 analysis determines the rate of magnetization recovery of a region of interest. To perform a T1 analysis Select File > Open Study… and select the series you want to analyze. In the Study Matrix, right-click the series tab and check if the series is labeled correctly as a T1 series. If needed, you can change the series label in the submenu. Select the T1 Analysis tab. In the Thumbnail View, select an image that shows sufficient contrast. Select your preferred drawing tool and draw the endocardial contour. Make sure to exclude the LV blood pool, to avoid its high intensity signal affecting the results. Click and draw the epicardial contour. Make sure to exclude the RV blood pool, to avoid its high intensity signal affecting the results. Mark one or more regions of interest in the septum. Select the region of interest icon, for example, , and draw a region of interest in the myocardium. You can deselect Auto copy under Contours to prevent copying the contours of the regions of interest to the other images. The T1 Analysis tab now shows two curves per region of interest: the curve of the measured values in the color of the region of interest, and the fitted curve as a dotted line. The “Time [ms]” box now shows the T1 recovery time. You can click on the icons in the “Time [ms]” box to show or hide the various regions of interest. QMass® MR 7.6 Quick Start Manual 17 T1 Analysis Module You can select and display the T1, T1*, or the Residual overlay by selecting an Overlay from the drop-down selection box. You can select the Acquisition type, Look-Locker (LL) which displays the T1*, T1 or the t0 results or Progressive Saturation (PS), which displays the T1 and the t0 results. Result Description T1 (Progressive saturation) T1 for progressive saturation studies corresponds to the following equation: I = A EXP (-t/T1) + B T1* (LookLocker) T1* for Look-Locker studies corresponds to the following equation: I = A EXP (-t/T1*) + B T1 (LookLocker) T1 value for Look-Locker studies corresponds to the following equation: T1 = T1* (-A/B – 1) t0 t0 is the “Nulling time”, i.e. the time at which the signal intensity crosses the zero on the horizontal axis. One can also roughly estimate the t0 value from the graph. You can also view the recovery rate per pixel using mouse cursor tracking. Click , and then hover the mouse over the pixel in the image. This displays the currently tracked pixel’s recovery rate. Please refer to the following article for information about T1 mapping in Look-Locker studies: Daniel R. Messroghli et al, Modified Look-Locker Inversion Recovery (MOLLI) for High-Resolution T1 mapping of the Heart, Magnetic Resonance in Medicine 52: 141-146 (2004). To create a T1 report 1. Click . QMass® MR 7.6 Quick Start Manual 18 T1 Analysis Module 2. On the Graphic tab, from the Report Layout drop-down list, select T1. This creates a T1 report. To set a color range and color map setting 1. Select Settings > T1 Settings. This opens the T1 Settings dialog window. Under Color range, choose your preferred color range of colors. Under Color Map, choose your preferred overlay color map. You can specify a default color map in the Configuration File Editor. For instructions on modifying settings, refer to the Configuration File Editor documentation. To export the relaxation times per slice to DICOM 1. Click the “Export…” button. The exported maps can be saved to disk, to pacs or to an OEM database. For instructions on modifying export settings, refer to the Configuration File Editor documentation. QMass® MR 7.6 Quick Start Manual 19 T2/T2* Analysis Module If you have the T2/T2* analysis module, you can use QMass to analyze the T2 or T2* decay time of a region of interest in the myocardium. This chapter explains how to: perform a T2 or T2* decay time analysis create a T2 or T2* decay time report A T2 or T2* decay time analysis consists of two steps: first you must draw a contour around the region of interest in the myocardium, and then you must exclude the measurements from the curve that are biased by MR noise. To perform a T2 or T2* analysis 1. Select File > Open Study… and select the series you want to analyze. 2. In the Study Matrix, right-click the series tab and check if the series is labeled correctly as a T2/T2* series. If needed, you can change the series label in the submenu. 3. Select the T2/T2* Analysis tab. 4. In the Thumbnail View, select an image that shows sufficient contrast. 5. Select your preferred drawing tool and draw the endocardial contour. Make sure to exclude the LV blood pool, to avoid its high intensity signal affecting the results. 6. Click and draw the epicardial contour. Make sure to exclude the RV blood pool, to avoid its high intensity signal affecting the results. 7. Mark one or more regions of interest in the septum. Select the region of interest icon, for example, , and select . Click the epicardial contour to mark the beginning of the septal segment, and then double-click the endocardial contour to mark the end. This creates the region of interest. The following illustrations show an example. QMass® MR 7.6 Quick Start Manual 20 T2/T2* Analysis Module You can deselect Auto copy under Contours to prevent copying the contours of the regions of interest to the other images. 8. The T2/T2* Analysis tab now shows two curves: the curve of the measured values in the color of the region of interest, and the fitted curve in black. To remove the measurement points that are biased by MR noise and calculate the correct T2/T2* value of the region of interest, you must drag the cut-off slider to the point where the curve starts to level off. If the curve slopes upward instead of downward at the end, make sure to first exclude the corresponding images. You do this by clicking the green squares in the bottom right corner of the images in the Thumbnail View. Pick up the white triangle at the bottom of the diagram and drag it up. This marks the points under the slider as excluded and makes the black curve fit the nonexcluded part of the measured curve. Make sure that the black curve runs through the first measured points. The following illustration provides an example. 9. The Decay Time box now shows the T2 or T2* decay time. Use the icons in the Decay Time box to show or hide the various regions of interest. You can display a color overlay of the decay time by selecting Show overlay under Display. QMass® MR 7.6 Quick Start Manual 21 T2/T2* Analysis Module Result Description T2 or T2* The result corresponds to the following equation: I = A EXP (-TE / T2) where TE is the Echo Time in ms and whereT2 indicates T2 for T2 analysis or T2* for T2* analysis You can also view the decay rate per pixel using mouse cursor tracking. Click , and then hover the mouse over the region of interest. This displays the currently tracked pixel’s decay rate in the status bar at the bottom of the QMass window. To create a T2 or T2* report 1. Click . 2. On the Graphic tab, from the Report Layout drop-down list, select T2-T2Star. This creates a T2 or T2* report. To set a default for the cut-off value and for the overlay colors 1. Select Settings > T2/T2* Settings. This opens the T2/T2* Settings dialog window. Under Overlay Colors, choose your preferred color scheme. After Cut-off value, specify the default to be used during the current session. You can specify a persistent default cut-off value in the Configuration File Editor. For instructions on modifying settings, refer to the Configuration File Editor documentation. To export the decay times per slice to DICOM 1. Click the “Export…” button. The exported maps can be saved to disk, to pacs or to an OEM database. For instructions on modifying export settings, refer to the Configuration File Editor documentation. QMass® MR 7.6 Quick Start Manual 22 Closing QMass When you have finished analyzing, you close QMass Enterprise Solution as follows. To close QMass Enterprise Solution 1. In QMass, select File > Quit. 2. Close the currently selected study in QMass Enterprise Solution by clicking . Select Defer or Complete in the Close Study dialog window. 3. Click the close icon in the top right corner. In the log-in window, click Quit. QMass® MR 7.6 Quick Start Manual 23 More Information This Quick Start Manual outlines the basics of working with QMass. You can find more details and more instructions, for example on stress-level function analysis, in the QMass User Manual. On the QMass installation CD-ROM you can also find the QMass Installation Manual, Release Notes, Reference Manual, DICOM Conformance Statement and Declaration of Conformity. To access the QMass User Manual In QMass, press F1. To access all QMass documentation 1. Look up the QMass installation directory in your file system. 2. You can find the QMass documentation set in the Documents directory. Or, 1. Insert the QMass CD-ROM. 2. In Windows Explorer, browse the directory structure of the CD-ROM. The documentation is located in the Documents directory. QMass® MR 7.6 Quick Start Manual 24