1
EMPRES-i Public User Guidelines
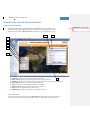
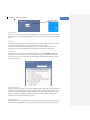
of disease events in each region (or section of the chart). The legend to the left of the chart
defines the colour coding. Scrolling over the chart will provide a small summary box which
identifies specific case details.
3.7 Layers
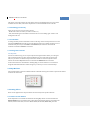
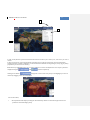
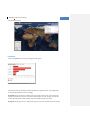
Click on the Layers menu to add extra data to the map. The layers provide additional
information regarding poultry density, river systems, administrative territories etc., and allow
the user to see disease events in a broader context.
By default, the only layers on the map are the Disease Events and the Base Layer which provides
definition of countries and territories.
3.8 Adding Layers to the Map
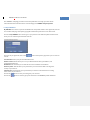
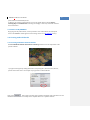
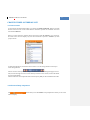
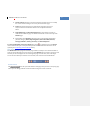
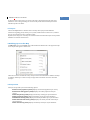
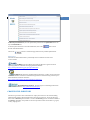
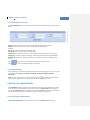
To add a layer, click on the Layers menu underneath the Outbreaks List to the right of the map.
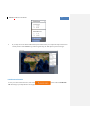
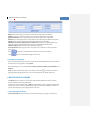
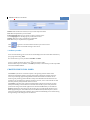
A list of layers will appear as shown here:
Check the box next to the desired overlay and you will see that information is added to the map
accordingly. Similarly, to remove overlays, simply uncheck the boxes next to the unwanted
overlays.
3.9 Layers List
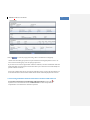
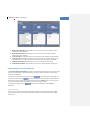
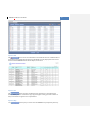
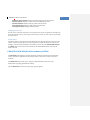
The layers list provides you with the following options:
World livestock population (2005): Displays the livestock population per country.
World human demographics (2008): Displays the human population total per
country.
Global sheep density (2005): Displays the density of sheep per square kilometre.
Global goat density (2005): Displays the density of goats per square kilometre.
Global buffalo density (2005): Displays the density of buffalos per square kilometre.
Global small ruminant density (2005): Displays the density of small ruminants per
square kilometre.
Global cattle density (2005): Displays the density of cattle per square kilometre.
22