1
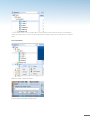
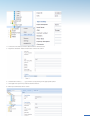
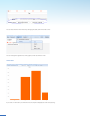
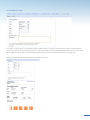
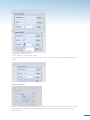
9. If you wish to add more meters after you have saved, right click on the virtual node and select “Edit” and then follow the instructions
from point 4.
4.6 Graphs
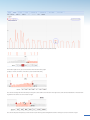
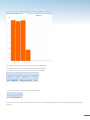
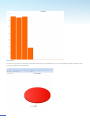
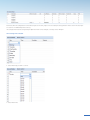
If you double-click on a meter in the left column, a graph will appear on the screen.
You can also display average consumption, min. and max. and total consumption during the selected time period.
10