1
75+80+85+90+83+79+64+77+82+83+92+85+74+62+55+40+35+60+63+79+34+27+32+43+52+65+74+82
M T W T F S S M T W T F S S M T W T F S S M T W T F S S
�����������
�����������
�����������
�����������
������
������
25%
75%
14%
86%
40%
400+600=
60%
50%
500+500=
50%
30%
300+700=
70%
25%
250+750=
75%
50%
500+500=
50%
40%
400+600=
60%
70%
700+300=
30%
60%
600+400=
40%
HAPPY
415=
495=
420=
405=
SAD
425=
395=
440=
375=
HUNGRY
515=
395=
450=
425=
FULL
425=
395=
440=
375=
��� ��������
A
B
C
���
��� ��� ��� ���
��� ���
APRIL
MAY
NIGHT
DAY
JUNE
JULY
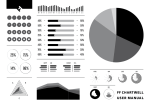
FF CHARTWELL
USER MANUAL
Introducing ff Chartwell
Basics
Designed by Travis Kochel,
ff Chartwell is a typeface for
creating simple graphs. Driven by
the frustration of creating graphs
within design applications and
inspired by typefaces such as
ff Beowolf and ff PicLig, Travis saw
an opportunity to take advantage of
OpenType technology to simplify
the process.
Here are a few basic tips to get
you started using ff Chartwell.
ff Chartwell was originally released
in 2011 under the tk Type foundry.
In 2012, it was added to the
FontFont library with the addition
of four new chart styles, the
ff Chartwell Polar Series.
The Polar Series (Rose, Rings, and
Radar) is a set of new designs, which
take on the form of more experimental charts. In an effort to make
the charts smarter and more
dynamic, each design reacts not
only to the data entered, but the
number of values.
ACTIVATE STYLISTIC ALTERNATES
(OR STYLISTIC SET 1 / DISCRETIONARY LIGATURES)
→
It’s really easy to use; you just
type a simple series of numbers like:
‘10+13+37+40’, turn on Stylistic
Alternates, Stylistic Set 1 or Discretionary Ligatures, and a graph is
automatically created. To see
the original data all you need to do
is turn off the feature again.
→
Using OpenType ligatures, strings
of numbers are automatically
transformed into charts. The data
remains in a text box, allowing for
easy updates and styling.
25+35+40
one
Always make sure letter spacing is
set to “0”.
20+15+25+40
two
Using the values 0–100*, type the
values, using “+” to combine them
into one chart. If the total is above
100 a new chart will begin.
*For Bars you can use values up to 1000.
20+15+25+40
three
You can adjust colors if you like.
four
ff Chartwell User Manual · 1/3
���
���
Turn on Stylistic Alternates and enjoy!
Supporting Alphabet
Pies
To help prepare the information a
supporting alphabet has been
included. It contains: Extended
Latin character set, basic numerals,
alphabet and punctuation.
Each Pie has a total value of 100. If
the total is greater than 100, a new
chart will begin.
ABCDEFGHIJKLM
NOPQRSTUVWXYZ
abcdefghijklm
nopqrstuvwxyz
ĂÆÇĤËłÐÑÕÜÝÞß
âđèïðħīñöøûþśÿ
0123456789¼½
!?&$¥£@©#%*
«».,:;'"‘’“”`~^-=_+
()[]{}/|\•.
You can transform the chart into a
ring by using the letters a–Z.
���
��
�
��
�
�������
��� ���
��������
������������
25+35+40+
Lines
Each Line uses values from 0 to 100
and you need to use the + to
connects values.
25+5+100+45+23
Bars Vertical
You can use Bars Vertical to create
sparklines and other bar graphs.
Each bar supports values from
0 to 100.
75+80+43+87+31+79+44+62+95
75+80+43+87+31+79+44+62+95
+
25+35+40+45+20+35+75+11+14
ff Chartwell User Manual · 2/3
75+85+10=
75+85+10=
10%
+
15+20+25+30+35+40+45+50+55+60+65+70+65+60+55+50
60+55+50+45+40+35+40+45+50+55+60+55+50+45+40+35
45+60+43+37+31+29+14+42+35+20+33+37+21+19+14+52
415=
495=
420=
405=
425=
395=
440=
375=
375+625=
350+650=
400+600=
440+560=
280+720=
440+560=
375+625=
400+600=
Using the “=” you can create a
diamond (=).
+
+
*charts can be layered to create more complex diagrams
Bars
Each bar supports values from 0 to
1000 and you use the “+” to connect
each value.
90%
Hints and tips
Rose
Use InDesign’s Story Editor to edit
the values of charts without having
to switch the OpenType features on
and off.
Using the letters a–f you can define
the grid.
Please note, there are the following
known bugs in certain programs:
All fonts are compatible with Word
2010/2011, though the charts may
appear correctly only after closing
and opening the document.
To ensure the color versions work,
the “+” sign needs to be the same
color as the preceding number.
Color versions do not work when
using Quark XPress.
ff Chartwell Bars and ff Chartwell
Bars Vertical are the only fonts
that are currently compatible
with iWorks.
© 2012 FontFont
Design ff Chartwell
Travis Kochel
Design User Manual
Christopher Hamamoto
Text typeface
ff Tisa Sans
All rights reserved.
FontFont and FontFont typeface
names are trademarks of
FontShop International GmbH
ff Chartwell User Manual · 3/3
The number of values determines
the width of the wedge and the
value of each number determines
the height of the wedge.
Rings
To define the grid use the letters a–e.
The radius increases after each value
and the value of each number
determines the length of each ring.
� �
�
���
���
a+70+50+33+97+63+27
a+70+50+73+97+63+77
Radar
Letter combinations are typed first
to define the grid.
Axis number increases in relation to
the number of values provided.
The value of each number determines the height of point along axis.
cx+70+50+73+97+63+77
six options for the grid a–f
� � � � � �
�� ��� ��� ��� ��� ���
one–thirty different wedges supported
five options for the grid a–e
� � � � �
one–ten rings supported
� ��� �� ��� ���
three–ten axis supported axis adjusts to number of values
� � ��� ��� ��� ��� ��� ��� ���
�
��� ��� ��� ��� ��� ���
��� ��� ��� ��� ��� ���
twelve options for the grid
a
ax
b
bx
c
cx
d
dx
e
ex
f
x