1
separately. The results were illustrated with the graphs. It needs to be emphasized for the reader
that each graph represents a different set of configurations of variables to illustrate the effects of
each attribute. For example, Configuration 1 in Figure 3.1 may not be the same as the
Configuration 1 in Figure 3.2. Detailed information for each graph indicating configurations and
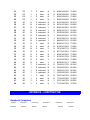
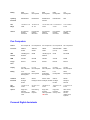
actual values can be found in the Appendix.
3.2.3.1 Data Zones Average results
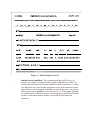
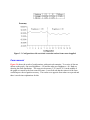
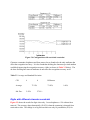
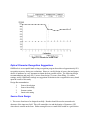
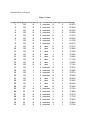
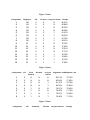
Figure 3.1 shows the average results for each configuration. The table shows the corresponding
statistical values. Descriptions for each configuration are in the Appendix. There are several
rises and falls on the graph. They are caused by different variable attributes. The effects of each
attribute will be discussed individually.
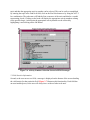
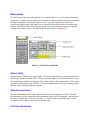
Figure 3.1 Average results for each configuration
Character constraints
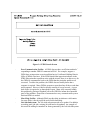
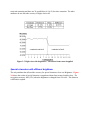
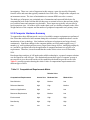
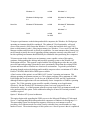
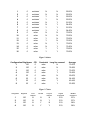
Figure 3.2 shows how the attribute Character Constraint affects the recognition accuracy. The
first eight configurations have a restricted constraint while the last eight configurations have a
relax constraint. There is a drop in accuracy (7.06%) when the constraint is changed from
restricted to relax. This is quite reasonable because there are a number of letters which are easily
recognized as digits and vice versa (e.g., 5 & S, 1 & l, 9 and q, etc.). It is also found that the
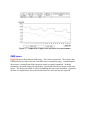
trend appears to be the same for the brightness variable and the form removal attribute.