1
Computer Science Master’s Project
Component-based Simulation Visualization Toolkit
By
Kewei Huang
Rensselaer Polytechnic Institute
Troy, NY 12180
1. Overview
Simulations become a necessary tool in the hands of researchers. Although most of scientific
computing is based on numerical solutions to partial differential equations, the discrete event
simulation and hybrid system [5,13] found wide applications in science and engineering. Even
within the research group at RPI within which this project has been done, the applications
encompassed spatially explicit simulations [16] including epidemic simulation [3,22], vector born
disease modeling [2], Lyme disease simulation [17,18], evolution of virulence [24] and epidemics
[23] as well as more general ecological models [21]. Other scientific applications of discrete event
simulations include speculative execution of scientific codes [4] and plasma simulation [25]. In
computer science, these methods are used to simulate embedded computer systems [1], distributed
and grid computing [19,20] and networking [26,30], including on-line network simulations [27],
network management applications [29] and large scale network dynamics studies [28].
Based on this broad experience in applications, the RPI group developed new rollback
procedure [15] and new synchronization protocol based on lookback [9.10], as well as new
approach to developing discrete event simulation based on components [6,7,8]. The new system,
called COST [11] includes a tool for configuring a simulation from its components [12] and found
its first application in emergency management [14]. It is difficult to configure simulations using
linear language and this observation was the motivation for this project: development of a
graphically oriented configuration tool.
The Component-based Simulation Visualization Toolkit (CSVT) is to provide a visualization
interface for simulation programs (called simulation clients) to help simulation developers verify
and debug the simulation more easily and more comfortably. It is developed in Java, so users can
use it on any platform. The topology of the network simulation is provided in a text file, CSVT can
read in the topology file, and give an automatic layout solution. Then the user can adjust the graph
to meet his needs, and save the view into a serialized view file or a JPEG file.
2. User Manual
You can either create a text file describing the topology of the network, and use CSVT to read
in the text file, the topology will then be displayed in a graphic manner; or, customize the source
code of CSVT to meet your specific needs. For customizing CSVT, please refer to the third part of
this report, the implementation manual.
2.1 Function sets
A simulation is composed of a number of components. A component contains one or more
ports which are connected to corresponding ports of other components. Each simulation,
component, or port has a unique name.
The CSVT visualizes the topology of the simulation. In the simplest form, each component is
symbolized as a rectangle. However, the visualization of components should be extendable. New
symbols can be easily added by implementing customized JAVA drawing classes. The simulation
developer can then select a symbol for a component by specifying the desired drawing class. On the
contrary, a port is invariably represented by a triangle.
The CSVT allows the user to adjust the graphical structure of topology, such as moving and
changing the path of the link between ports. The topology itself, which is determined by the
simulation client, is not modifiable. Therefore, functionalities such as disconnecting a port, creating
a new component or a port, are not necessary.
After the user adjust the positions of components, ports, and links, the CSVT can save the
geographical information along with their names to a view file which is identified by the name of
the simulation. When the same simulation is restarted, the CSVT is able to retrieve such
information from the view file so that the user doesn’t need to fix the positions again.
2.2 Launching CSVT
CSVT can be started by “java -classpath edu.rpi.cs.CSVT.CSVT”, under the CSVT directory.
The interface will be as the following:
2.3 How to use CSVT
2.3.1
Create a graph
There are three ways to create a CSVT graph.
1) File -> New Graph
In this way, you create a blank graph, and can use the tool box provided to add in
components from the component library. The component library can be customized to
meet your needs, that is, you can change the CSVT code to provide your own components.
CSVT supports Drag and Drop function, so creating a new graph is easy.
2) File -> Load Topology
You can also put the graph topology into a text file like this:
“ component source
component fifo
component server
component sink
outport source.out
inport fifo.in
outport fifo.out
inport fifo.next
inport server.in
outport server.out
outport server.next
inport sink.in
outport sink.out
connect source.out fifo.in
connect fifo.out server.in
connect server.next fifo.next
connect server.out sink.in”
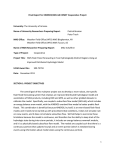
and the loaded CSVT graph will be as the following:
then you can adjust the attributes of the components, and finally you can get the following:
3) File -> Open
This is just to open an existed CSVT graph file.
2.3.2
Output a graph
The adjusted view file can be saved into a serialized file by File -> Save As, or to a JPEG file
by File-> Save as JPEG.
2.3.3
Standard editing functions
CSVT supports copy, paste, cut and delete, and Undo/Redo functions for editing a graph.
2.3.4
Zoom in and out
You can zoom in to see in more detail, and zoom out to see the global scope.
2.3.5
View choices
You can customize the look and feel style by View->Look and Feel :
and some other view choices like Grid -> Visible:
2.3.6
Graph layout
CSVT supports several automatic layout methods:
2.4 System requirements
CSVT has been developed under windows 2000, J2SE v1.4. It runs properly on Solaris
and Linux platform, but on Solaris, mouse right button doesn’t work, so to fully support
mouse function, currently better use under windows or Linux.
3. Implementation Manual
3.1 How to manage graphs
With CSVT’s JGraph class, you can display objects and their relations. A JGraph object
doesn't actually contain your data; it simply provides a view of the data. Like any non-trivial Swing
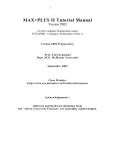
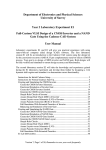
component, the graph gets data by querying its data model. Here's a picture of a graph:
Fig. 1: A directed graph
As the preceding figure shows, JGraph displays its data by drawing individual elements. Each
element displayed by the graph contains exactly one item of data, which is called a cell. A cell may
either be a vertex, an edge or a port. Vertices have zero or more neighbours, and edges have one or
no source and target vertex. Each cell has zero or more children, and one or no parent. (Instances of
ports are always children of vertices.)
3.1.1 Creating a Graph
The following code creates a JGraph object:
JGraph graph = new JGraph();
...
JScrollPane scrollPane = new JScrollPane(graph)
The code creates an instance of JGraph and puts it in a scroll pane. Jgraph’s constructor is
called with no arguments in this example. Therefore, JGraph will use an instance of
DefaultGraphModel, create an instance of GraphView for it, and add a sample graph to the
model.
Graph can be created by invoking the JGraph constructor. You should probably put the graph
inside a scroll pane, so that the graph won't take up too much space. You don't have to do anything
to support cell editing, selection, marquee selection, vertex and edge resizing and moving.
3.1.2 Customizing a Graph
After the network topology is loaded into the CSVT environment, you can customize the
attributes of the graph. CSVT offers the following forms of interactions:
•
•
•
•
•
•
•
In-place editing
Moving
Cloning
Sizing
Bending (Adding/Removing/Moving edge points)
Establishing Connections
Removing Connections
All interactions can be disabled using setEnabled(false). In-place editing is available
for both, vertices and edges, and may be disabled using setEditable(false). The number of
clicks that triggers editing may be changed using setEditClickCount.
Moving, cloning, sizing, and bending, establishing connections and disconnecting edges may
be disabled using the respective methods, namely setMoveable, setCloneable,
setSizeable, setBendable, setConnectable and setDisconnectable on the
graph instance.
The model offers finer control of connection establishment and disconnection based on the
acceptsSource and acceptsTarget methods. By overriding these methods, you can decide
for each (edge, port) pair if it is valid with respect to the edge’s source or target. (Before an edge is
disconnected from a port, the respective method is called with the port set to null to check if
disconnection is allowed.)
CellViews offer yet another level of control in that they allow/disallow being edited, moved,
cloned, resized, and shaped, or connected/disconnected to or from other cells. (Note: In the context
of multiple views, a cell may be connectable in one view, and not connectable in another.)
There are a number of additional methods to customize CSVT, for example,
setMinimumMove to set the minimum amount of pixels before a move operation is initiated, and
setSnapSize to define the maximum distance from a cell to be selected.
With setDisconnectOnMove you can indicate if the selection should be disconnected
from the unselected graph when a move operation is initiated, setDragEnabled
enables/disables the use of Drag-and-Drop, and setDropEnabled sets if the graph accepts
Drops from external sources. (The latter also affects the clipboard, in that it allows/disallows paste
data from external sources.)
3.1.3 Responding to Interaction
You can either respond to mouse events, or to events generated by CSVT. CSVT offers the
following notifications:
•
•
•
•
Changes to the model
Changes to the view
Changes to the selection
Undoable edit happened
3.1.3.1.
Undoable edit
CSVT is compatible to Swing’s Undo-Support. Each time the user performs an action, the
model dispatches an edit that describes the change. The edit provides an undo method to undo the
change.
If undo is called on an edit, the model fires a GraphModelEvent, but it does not fire an
UndoableEditEvent. The latter only fires if CSVT wants to indicate that an edit was added to
the command history, which is not the case for an undo. (In the context of multiple views, you
must use an instance of GraphUndoManager to ensure correctness.)
3.1.3.2.
Responding to Mouse Events
For detection of double-clicks or when a user clicks on a cell, regardless of whether or not it
was selected,
a
MouseListener should
be
used
in conjunction
with
getFirstCellForLocation. The following code prints the label of the topmost cell under
the mouse pointer on a doubleclick. (The getFirstCellForLocation method scales its
arguments.)
// MouseListener that Prints the Cell on Doubleclick
graph.addMouseListener(new MouseAdapter() {
public void mousePressed(MouseEvent e) {
if (e.getClickCount() == 2) {
// Get Cell under Mousepointer
int x = e.getX(), y = e.getY();
Object cell = graph.getFirstCellForLocation(x, y);
// Print Cell Label
if (cell != null) {
String lab = graph.convertValueToString(cell);
System.out.println(lab);
}
}
}
});
3.1.3.3.
Responding to Model Events
If you want to handle model notifications, implement the GraphModelListener interface
and add the instance using the method addGraphModelListener. The listeners are notified
when cells are inserted, removed, or when the label, source, target, parent or children of an object
have changed. (Make sure to also add an Observer to GraphView in order to be notified of all
possible changes to a graph.)
The following code defines a listener that prints out information about the changes to the
model, and adds the listener to the graph’s model:
// Define a Model Listener
public class ModelListener implements GraphModelListener {
public void graphCellsChanged(GraphModelEvent e) {
System.out.println("Change: "+e.getChange())
}
}
// Add an Instance to the Model
graph.getModel().addGraphModelListener(new ModelListener());
3.1.3.4.
Responding to View Events
Visual modifications are typically handled by the GraphView, which extends the
Observable class. To respond to view-changes, implement the Observer interface and add it
to the view using the method addObserver. Observers are notified when the size, position, color
etc. of a cell view has changed. (Note: If the model’s isAttributeStore returns true, then
the view is bypassed, and all attributes are stored in the model.)
// Define an Observer
public class ViewObserver implements Observer {
public void update(Observable o, Object arg) {
System.out.println("View changed: "+o);
}
}
// Add an Instance to the View
graph.getView().addObserver(new ViewObserver());
3.1.3.5.
Responding to Selection Changes
The following code prints out selection events:
// Define a Selection Listener
public class MyListener implements GraphSelectionListener {
public void valueChanged(GraphSelectionEvent e) {
System.out.println("Selection changed: "+e);
}
}
// Add an Instance to the Graph
graph.addGraphSelectionListener(new MyListener());
The preceding code creates an instance of MyListener, which implements the
GraphSelectionListener interface, and registers it on the graph.
3.1.3.6.
Responding to Undoable Edits
To enable Undo-Support, a GraphUndoManager must be added using
addUndoableEditListener. The GraphUndoManager is an extension of Swing's
UndoManager that maintains a command history in the context of multiple views. You can safely
use an instance of UndoManager if your graph has only one view. Otherwise, a
GraphUndoManager must be used for correct behaviour.
3.1.4 Customizing a Graph’s Display
CSVT performs some look-and-feel specific painting. You can customize this painting in a
limited way. For example, you can modify the grid using setGridColor and setGridSize,
and you can change the handle colors using setHandleColor and setLockedHandleColor. The background color may be changed using setBackground.
3.1.4.1.
Subclassing Renderers
If you want finer control over the rendering, you can subclass one of the default renderers, and
override its paint-method. A renderer is a Component-extension that paints a cell based on its
attributes. Thus, neither JGraph nor its look-and-feel-specific implementation actually contain the
code that paints a cell. Instead, CSVT uses the cell renderer’s painting code. A new renderer may be
associated with a cell by overriding the getRendererComponent method of the corresponding
CellView, or the getRenderer method for extensions of the AbstractCellView class.
3.1.4.2.
Adding new Cell Types to a Graph
The following code is to illustrate how to add new cell types and renderers. The code adds an
oval vertex to the graph. The easiest way to do this is by extending JGraph. Since JGraph
implements the CellViewFactory interface, it is in charge of creating views.
When creating a view, JGraph assumes a cell is a vertex if it is not an instance of Edge or
Port, and calls the createVertexView method. Thus, we only need to override this method to
identify an oval vertex (based on a type test) and return the corresponding view.
// Overrides JGraph.createVertexView
protected VertexView createVertexView(Object v,
GraphModel model,
CellMapper cm) {
// Return an EllipseView for EllipseCells
if (v instanceof EllipseCell)
return new EllipseView(v, model, cm);
// Else Call Superclass
return super.createVertexView(v, model, cm);
}
The oval vertex is represented by the EllipseCell class, which is an extension of the
DefaultGraphCell class, and offers no additional methods. It is only used to distinguish oval
vertices from normal vertices.
// Define EllipseCell
public class EllipseCell extends DefaultGraphCell {
// Empty Constructor
public EllipseCell() {
this(null);
}
// Construct Cell for Userobject
public EllipseCell(Object userObject) {
super(userObject);
}
}
The EllipseView is needed to define the special visual aspects of an ellipse. It contains an
inner class which serves as a renderer that provides the painting code. The view and renderer are
extensions of the VertexView and VertexRenderer classes, respectively. The methods that
need to be overridden are getPerimeterPoint to return the perimeter point for ellipses,
getRenderer to return the correct renderer, and the renderer’s paint method.
// Define the View for an EllipseCell
public class EllipseView extends VertexView {
static EllipseRenderer renderer = new EllipseRenderer();
// Constructor for Superclass
public EllipseView(Object cell, GraphModel model,
CellMapper cm) { super(cell, model, cm); }
// Returns Perimeter Point for Ellipses
public Point getPerimeterPoint(Point source, Point p) { … }
// Returns the Renderer for this View
protected CellViewRenderer getRenderer() {
return renderer;
}
// Define the Renderer for an EllipseView
static class EllipseRenderer extends VertexRenderer {
public void paint(Graphics g) { … }
}
}
The reason for overriding getRenderer instead of getRendererComponent is that the
AbstractCellView class, from which we inherit, already provides a default implementation of
this method that returns a configured CellViewRenderer, which in turn is retrieved through
the method that was overridden.
3.1.4.3.
Adding Tooltips to a Graph
Tooltips can be implemented by overriding JGraph’s getToolTipText method, which is
inherited from the JComponent class. The following displays the label of the cell under the
mouse pointer as a tooltip.
// Return Cell Label as a Tooltip
public String getToolTipText(MouseEvent e) {
if(e != null) {
// Fetch Cell under Mousepointer
Object c = getFirstCellForLocation(e.getX(), e.getY());
if (c != null)
// Convert Cell to String and Return
return convertValueToString(c);
}
return null;
}
The graph must be registered with Swing’s TooltipManager to correctly display tooltips. This
is done with the following code on startup:
ToolTipManager.sharedInstance().registerComponent(graph)
3.1.4.4.
Customizing In-Place Editing
In graphs that display complex structures, it is quite common to offer a property dialog instead
of the simple in-place editing. To do this, the BasicGraphUI’s startEditing and
completeEditing methods must be overridden. Then, in order to use this UI in a graph, the
graph’s updateUI method must be overridden, too:
// Define a Graph with a Custom UI
public class DialogGraph extends JGraph {
// Sets the Custom UI for this graph object
public void updateUI(){
// Install a new UI
setUI(new DialogUI());
invalidate();
}
}
The DialogUI class takes the view’s editor, and puts it in a dialog, which blocks the frame
until the dialog is closed.
3.1.5 Dynamically changing a Graph
In CSVT, either the model or the view is modified, or they are modified in parallel with a
single transaction. When working on the model, objects that implement the GraphCell interface
are used, whereas objects that implement the CellView interface are used in the context of a
GraphView. GraphViews allow edit CellViews, whereas GraphModels allow to insert,
remove, and edit GraphCells.
In this chapter, a DefaultGraphModel is used along with a graph that provides a view to
the model. This way, we can clarify which methods belong to the model, and which belong to the
view.
DefaultGraphModel model = new DefaultGraphModel()
JGraph graph = new JGraph(model);
3.1.5.1. Attributes
CSVT separates the model and the view. The model is defined by the GraphModel interface,
and contains objects that implement the GraphCell interface, whereas the view is represented by
the GraphView class, and contains objects that implement the CellView interface. The
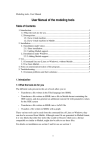
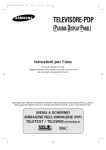
mapping between cells and views is defined by the CellMapper interface:
Fig. 4: Mapping between GraphCells and CellViews
A model has zero or more views, and for each cell in the model, there exists exactly one
CellView in each GraphView. The state of these objects is repesented by a map of (key, value)
pairs. Each CellView combines the attirbutes from the corresponding GraphCell with its own
attributes.
When combining the attributes from a GraphCell with the attributes from the CellView,
the graph cell’s attributes have precedence over the view’s attributes. The special value attribute
is in sync with the cell’s user object.
3.1.5.2.
Dynamically Changing Attributes
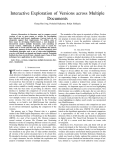
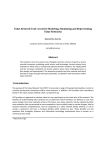
The state of a cell, and likewise of a view is represented by its attributes. In either case, the
GraphConstants class is used to change the state in two steps:
1. Construct the object that constitutes the change
2. Execute the change on the model, or the graph view
Fig. 5: Using maps to change the state
To construct the object that constitutes the change, a new map is created using the
createMap method of the GraphConstants class. When a map is applied to a view’s or cell’s
state, it does not replace the existing map. The entries of the new map are added or changed
in-place. As a consequence, the GraphConstants class offers the setRemoveAttributes
and setRemoveAll methods, which are used to remove individual or all keys from the existing
state. (Note: The notion of states using maps closely resembles the structure of XML-documents.)
3.1.5.3.
Automatically Changing Attributes
The update method of the CellView interface is used to message the CellView when
one of its attributes was changed programmatically, or one of its neighbours has changed attributes.
Thus, the update method is a good place to automatically set attributes, like for example the
points of an edge. To reflect changes to the view’s corresponding cell, for example to point to the
current source and target port, the refresh method is used.
3.2 Working with the GraphModel
The model can be thought as an access point to two independent structures: the graph structure
and the group structure. The graph structure is based on the mathematical definition of a graph, ie.
vertices and edges. The group structure is used to enable composition of cells, ie. parents and
childs.
The graph structure is defined by the getSource and getTarget methods, which return
the source and target port of an object. The port in turn is a child of a vertex, which is used as an
indirection to allow multiple connection points.
The group structure is defined by the getChild, getChildCount, getIndexOfChild,
and getParent methods. The objects that have no parents are called roots, and may be retrieved
using the getRootAt and getRootCount methods.
3.2.1
Inserting a Vertex into the Model
Here is a method that creates a new DefaultGraphCell and adds it to the model. The
method adds two ports to the cell, and creates a map which maps the cells to their attributes. The
attributes are in turn maps of (key, value) pairs, which may be accessed in a type-safe way by use of
the GraphConstants class:
void insertVertex(Object obj, Rectangle bounds) {
// Map that Contains Attribute Maps
Map attributeMap = new Hashtable();
// Create Vertex
DefaultGraphCell cell = new DefaultGraphCell(userObject);
// Create Attribute Map for Cell
Map map = GraphConstants.createMap();
GraphConstants.setBounds(map, bounds);
// Associate Attribute Map with Cell
attributeMap.put(cell, map);
// Create Default Floating Port
DefaultPort port = new DefaultPort("Floating");
cell.add(port);
// Additional Port Bottom Right
int u = GraphConstants.PERCENT;
port = new DefaultPort("Bottomright");
// Create Attribute Map for Port
map = GraphConstants.createMap();
GraphConstants.setOffset(map, new Point(u, u));
// Associate Attribute Map with Port
attributeMap.put(port, map);
cell.add(port);
// Add Cell (and Children) to the Model
Object[] insert = new Object[]{cell};
model.insert(insert, null, null, attributeMap);
}
The first argument to the insertVertex method is the user object – an object that contains
or points to the data associated with the cell. The user object can be a string, or it can be a custom
object. If you implement a custom object, you should implement its toString method, so that it
returns the string to be displayed for that cell. The second argument represents the bounds of the
vertex, which are stored as an attribute.
Note: The vertex is passed to the insert method without its children. The fact that
parent-child relations are stored in the cells is used here to insert the children implicitly, without
providing a ParentMap.
The attributeMap argument is not used by the model. It is passed to the views to provide
the attributes for the cell views to be created. The third parameter of the insert call can be used
to provide properties, that is, attributes that are stored in the model.
3.2.2
Finding the Port of a Vertex
Since ports are treated as normal children in the model (using the model’s group structure), the
GraphModel interface may be used to find the “default port” of a vertex:
Port getDefaultPort(Object vertex, GraphModel model) {
// Iterate over all Children
for (int i = 0; i < model.getChildCount(vertex); i++) {
// Fetch the Child of Vertex at Index i
Object child = model.getChild(vertex, i);
// Check if Child is a Port
if (child instanceof Port)
// Return the Child as a Port
return (Port) child;
}
// No Ports Found
return null;
}
3.2.3
Inserting an Edge into the Model
The following method creates a new DefaultEdge, and adds it to the model, along with the
connections to the specified source and target port.
void insertEdge(Object obj, Port source, Port target) {
// Create Edge
DefaultEdge edge = new DefaultEdge(userObject);
// Create ConnectionSet for Insertion
ConnectionSet cs = new ConnectionSet(edge, source, target);
// Add Edge and Connections to the Model
Object[] insert = new Object[]{edge};
model.insert(insert, cs, null, null);
}
The first argument represents the user object of the cell, and the second and third argument
specify the source and target port of the new edge. To insert connections into a graph model, an
instance of ConnectionSet is required. The instance is used to collect the new ports and targets
of edges, and execute the change as a single transaction.
3.2.4
Changing the Model
The ConnectionSet and ParentMap classes are used to change the model. The
attributes may be changed using a map that contains cell, attributes pairs. The attributes are in turn
represented by maps of key, value pairs, which may be accessed in a type-safe way by using the
GraphConstants class.
Let edge, port and vertex be instances of the DefaultEdge, DefaultPort and
DefaultGraphCell classes, respectively; all contained in the model. This code changes the
source of edge to port, the parent of port to vertex, and the user object of vertex to the
String Hello World.
// Create Connection Set
ConnectionSet connectionSet = new ConnectionSet();
connectionSet.connect(edge, port, true);
// Create Parent Map
ParentMap parentMap = new ParentMap();
parentMap.addEntry(port, vertex);
// Create Properties for Vertex
Map properties = GraphConstants.createMap();
GraphConstants.setValue(properties, "Hello World");
// Create Property Map
Map propertyMap = new Hashtable();
propertyMap.put(vertex, properties);
// Change the Model
model.edit(connectionSet, propertyMap, parentMap, null);
The last argument of the edit call may be used to specify the initial edits that triggered the
call. The edits specified are considered to be part of the transaction. (This is used to implement
composite transactions, ie. transactions that change the model and the view in parallel.)
3.2.5
Changing the View
Each GraphCell has one or more associated CellViews, which in turn contain the
attributes. The attributes of a CellView may be changed using editCells on the parent
GraphView. In contrast to the propertyMap argument used before, and the attributeMap
argument used to insert cells into the model, the attributeMap argument used here contains
instances of the CellView class as keys. The attributes, again, are maps of key, value pairs.
The following changes the border color of vertex to black:
// Work on the Graph’s View
GraphView v = graph.getView();
// Create Attributes for Vertex
Map attributes = GraphConstants.createMap();
GraphConstants.setBorderColor(attributes, Color.black);
// Get the CellView to use as Key
CellView cellView = v.getMapping(vertex, false);
// Create Attribute Map
Map attributeMap = new Hashtable();
attributeMap.put(cellView, properties);
// Change the View
v.editCells(attributeMap);
Bibliography
[1] S. Azzaro and B.K. Szymanski, ``Simulating Dedicated UNIX PC-Based Application Systems,''
Proc. 1990 Winter Simulation Conference, O. Balci, R.P. Sadowski, R.E. Nance (edts), New
Orleans, LA, December 1990, pp. 831-838.
[2] T. Caraco, S. Glavankov, G. Chen, B.K. Szymanski, T. Ohsumi, and J. Flaherty, ``Vector-borne
infection with stage-structured transmission: a spatial model for Lyme disease,'' The American
Naturalist, 160, No. 3, 2002, in print.
[3] T. Caraco, W. Maniatty, and B.K. Szymanski, ``Epidemics Modeling and Simulation on a
Parallel Machine,'' Proc. Int. Conference on Applied Modelling and Simulation, Vancouver, Canada,
July 21-23, 1993, pp. 69-70.
[4] G. Chen, H. Lamehamedi, A. Vargun, and B.K. Szymanski, ``Web-Enabled and Speculative
High Performance Computing,'' Proc. Int. SGI User's Conference, SGI2000, Cracow, Poland,
October, 2000, AGH Press, Cracow, 2000, pp. 75-90.
[5] G. Chen and B.K. Szymanski, ``Linking spatially explicit parallel continuous and discrete
models,'' Proc. Winter Simulation Conference, Orlando, Florida, December 2000, IEEE Computer
Press, Los Alamitos, CA, pp. 1705-1712.
[6] G. Chen and B.K. Szymanski, ``A Component Model for Discrete Event Simulation,'' Parallel
Processing and Applied Mathematics, 4th International Conference PPAM 2001, Naleczow, Poland,
September 9-12, 2001 (Revised Papers), September 2001, LNCS vol. 2328, Springer Verlag, Berlin,
June 2002, pp. 580-594.
[7] G. Chen and B.K. Szymanski, ``Component-Based Simulation,'' Proc. European Simulation
Multiconference, ESM2001, SCS Press, Delft, Netherlands, 2001, pp. 68-75.
[8] G. Chen and B.K. Szymanski, ``Component-Oriented Simulation Architecture: Towards
Interoperability and Interchangeability,'' Proc. 2001 Winter Simulation Conference, B.A. Peters, J.S.
Smith, D.J. Medeiros, and M.W. Rohrer, eds., SCS Press, 2001, pp. 495-501.
[9] G. Chen and B.K. Szymanski, ``Lookback: A New Way of Exploiting Parallelism in Discrete
Event
Simulation,'' Proc. 16th Workshop on Parallel and Distributed Simulation, Washington, DC, May
12-15, 2002, IEEE CS Press, pp. 153-162.
[10] G. Chen and B.K. Szymanski, ``Lookahead, Rollback and Lookback, Searching for
Parallelism in Discrete Event Simulation,'' Proc. SCSC 2002 Summer Computer Simulation
Conference, July 2002.
[11] G. Chen and B.K. Szymanski, ``COST: A Component-Oriented Discrete Event Simulator,''
Proc.Winter Simulation Conference, WSC02, December 2002, in print.
[12] G. Chen and B.K. Szymanski, ``Configuring Parallel Simulations Using Component Based
Approach,'' Proc. Virtual World Simulation Conference, WMC03, Orlando, FL, January, 2003, to
appear.
[13] G. Chen, B.K. Szymanski, and T. Caraco, ``Multiparadigm Simulations in Modeling Spread of
Lyme Disease,'' Proc. ESM2000: 14th European Simulation Multiconference, Ghent, Belgium,
May 23-26, 2000, Rik Van Landeghem (edt), SCS Press, Delft, Netherlands, 2000, pp. 631-638.
[14] G. Chen, B.K. Szymanski, and L. Wilson, ``Component-Based Simulation and Agent-Based
Brokering: Towards Ad Hoc Simulations in Crisis and Emergency Management,'' Proc. Computer
Networks and Distributed Systems Modeling and Simulation, CNDS'03, Orlando, FL, January 2003,
in print.
[15] E. Deelman and B.K. Szymanski, ``Breadth-First Rollback in Spatially Explicit Simulations,''
Proc. PADS97, 11th Workshop on Parallel and Distributed Simulation, Burg Lockenhaus, Austria,
June 10-13, 1997, pp. 124-131, IEEE Computer Society, Los Alamitos, CA.
[16] E. Deelman and B.K. Szymanski, ``Simulating Spatially Explicit Problems on High
Performance Architecture,'' Journal of Parallel and Distributed Computing, 62, 2002, pp. 446-467.
[17] E. Deelman, B.K. Szymanski, and T. Caraco,``Parallel Discrete Event Simulation of Lyme
Disease,'' Biocomputing: Proc. 1996 Pacific Symposium, Hawaii, HI, January 1996, L. Hunter and
T. Klein (edts), World Scientific Publishing Corp., Singapore, 1996, pp. 191-202.
[18] E. Deelman, B.K. Szymanski, and T. Caraco, ``Simulating Lyme Disease Using Parallel
Discrete Event Simulation,'' Proc. 1996 Winter Simulation Conference, J.M. Charnes, D.M.
Morrice, D.T. Brunner and J.J. Swain, San Diego, December 1996, pp. 1191-1198.
[19] H. Lamehamedi, Z. Shentu, B.K. Szymanski, and E. Deelman, ``Simulation of Dynamic Data
Replication Strategies in Data Grids,'' Proc. 12th Heterogeneous Computing Workshop (HCW2003),
Nice, France, April 2003, submitted.
[20] H. Lamehamedi, B.K. Szymanski, and E. Deelman, ``Data Replication Strategies in Grid
Environments,'' Proc. 5th Int. Conference on Algorithms and Architectures for Parallel Processing,
ICA3PP2002, Beijing, China, October 2002, IEEE Computer Science Press, Los Alamitos, CA,
2002, pp. 378-383.
[21] W. Maniatty, B.K. Szymanski, and T. Caraco, ``Implementation and Performance of the
Parallel Ecological Simulations,'' Proc. Applications in Parallel and Distributed Computing,
Caracas, Venezuela, April 1994, IFIP Transactions A-44, C. Girault (ed), North Holland,
Amsterdam, 1994, pp. 93-102.
[22] B. Maniatty, B.K. Szymanski, and T. Caraco, ``TEMPEST: A Fast Spatially Explicit Model of
Epidemics on Parallel Machines,'' Proc. High Performance Computing Symposium, A. Tentner (ed),
San Diego, CA, April 10-14, 1994, SCS Press, San Diego, CA, pp. 114-119.
[23] W. Maniatty, B.K. Szymanski, and T. Caraco, ``High-Performance Simulation of Evolutionary
Aspects of Epidemics,'' Applied Parallel Computing, B. Kagstrom et al (eds), Papers presented at
4th Int. Workshop, PARA'98, June 16, 1998, Umea, Sweden, Lecture Notes in Computer Science,
Vol. 1541, Springer-Verlag, Berlin, 1998, pp. 322-331.
[24] W. Maniatty, B.K. Szymanski, and T. Caraco, ``High-Performance Computing Tools for
Modeling Evolution in Epidemics,'' Proc. 32nd Annual Hawaii Int. Conference on System Science,
Maui, January 1999, IEEE Computer Society, Los Alamitos, CA, 1998, CD disk, 10 pages,
(Abstracts, pp. 318-319).
[25] M. Nibhanapudi, C. Norton, and B.K. Szymanski, ``Plasma Simulation on Networks of
Workstations using the Bulk-Synchronous Parallel Model,'' Proc. Int. Conference on Parallel and
Distributed Processing Techniques and Applications (PDPTA'95), Athens, GA, November 1995,
CSREA, 1995, pp. 13--22.
[26] B.K. Szymanski, Q. Gu, and Y. Liu, ``Time-Network Partitioning for Large-Scale Parallel
Network Simulation under SSFNet,'' Proc. Applied Telecommunication Symposium,} San Diego,
CA, April 14-17, 2002, SCS Press, pp. 90-95.
[27] B.K. Szymanski, Y.Liu, A. Sastry, and K. Madnani, ``Real-Time On-Line Network
Simulation,'' Proc. 5th IEEE Int. Workshop on Distributed Simulation and Real-Time Applications
DS-RT 2001, IEEE Computer Society Press, Los Alamitos, CA, 2001, Cincinnati, OH, August
13-15, 2001, pp. 22-29.
[28] B.K. Szymanski, A. Saifee, A. Sastry, Y. Liu and K. Madnani, ``Genesis: A System for
Large-scale Parallel Network Simulation,'' Proc. 16th Workshop on Parallel and Distributed
Simulation, Washington, DC, May 12-15, 2002, IEEE CS Press, pp. 89-96.
[29] T. Ye, S. Kalyanaraman, B. Mo, B.K. Szymanski, D. Harrison, B. Sikdar, H. Kaur, and K.
Vastola, ``Network Management and Control Using Collaborative On-line Simulation,'' Proc. IEEE
Int. Conference on Communications ICC2001, IEEE Computer Science Press, Los Alamitos, CA,
2001, Helsinki, Finland, June 2001.
[30] J.-F. Zhang, J. Jiang, and B.K. Szymanski, ``A Distributed Simulator for Large-Scale
Networks with On-Line Collaborative Simulators,'' Proc. European Multisimulation Conference,
vol. II, pp. 146-150, Warsaw, Poland, June 1999.