1
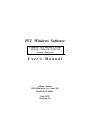
PCI Windows Software
Graphical User Interface for the
PCI550 / PMC550 / CPCI550
System Analyzers
U s e r ’s M a n u a l
Silicon Control
1020 Milwaukee Ave. Suite 305
Deerfield, IL 60015
May 1999
Revision 1.0
PCI500 Windows 95 Manual
Copyrights
Silicon Control and ChiTech Software do not warrant the operation of the program will
be uninterrupted or error free. In no event, will Silicon Control or ChiTech Software be
liable for any damages including loss of data, lost profits, or cost of other incidental,
consequential, or indirect damages arising from the use of this program or the accompanying
documentation.
This Manual
C 1997 CHITECH SOFTWARE CORP. and SILICON CONTROL INC.
ALL RIGHTS RESERVED.
No portion of this document may be copied without the written consent of ChiTech
Software Corp. and Silicon Control, Inc. This program and documentation are subject to the
copyright protection laws. The information in this document is subject to change without
notice.
2
PCI500 Windows 95 Manual
License Agreement
ChiTech Software Corp.
Software License Agreement
PCI Windows 95 Graphical User Interface Program
for Silicon Control PCI550 System Analyzer
Please read and be aware of the items listed in the following agreement. If you do not
approve of the agreement, please return the complete package to the point of purchase for a
complete refund.
1.
a.
b.
c.
d.
e.
Corp.
USAGE RIGHTS
Your rights with respect to the Program are non-exclusive.
The Program can only be used by one user, on one computer at a time.
The Program can be transferred to another computer as long as the requirements
of item (b.) are satisfied.
The Program and its documentation must not be distributed to others.
Do not alter or modify the Program without prior consent of ChiTech Software
2.
a.
b.
BACKUP COPIES
You may make as many backup copies of the Program as you like.
The ChiTech Software copyright notice must be included on each backup copy.
3.
a.
b.
c.
COPYRIGHTS
The Program is copyrighted.
The Program documentation is copyrighted.
You may only copy the Program and program documentation for backup or to
load the Program into your computer as part of program execution.
4.
a.
b.
TERM OF LICENSE
The Software License Agreement is effective until terminated.
Terminate the Software License Agreement by destroying the Program, the
documentation, and all backup copies.
3
PCI500 Windows 95 Manual
5.
a.
b.
c.
d.
e.
f.
g.
License Agreement
LIMITED WARRANTY
This Program is provided without any warranty of any kind.
You bear the risk as to performance and suitability of the Program.
ChiTech Software does not warrant or guarantee the correctness, accuracy,
completeness, or reliability of the Program.
ChiTech Software warrants the diskettes on which the Program is provided and
any lock device provided to be free from manufacturers defects under normal use
for a period of 90 days from the date of purchase.
If the diskettes or lock device fail due to neglect, accident, or abuse, ChiTech
Software shall not be liable to replace the diskettes or lock device under this
limited warranty.
This limited warranty gives you specific legal rights. You may have additional
rights depending on the state and/or country in which you live.
Neither ChiTech Software nor anyone involved in the development,
manufacturing, or distribution of the Program or lock device shall be liable for
any damages from the use, results of use, or inability to use the Program or lock
device, even if ChiTech Software has been notified of the probability of such
damages or claims. Some states (countries) do not allow liability limitations for
consequential or incidental damages or claims. This item may not be applicable.
6.
a.
LAWS
This Software License Agreement shall be governed by the laws of the State of
Illinois, United States of America.
7.
a.
ACCEPTANCE OF AGREEMENT
You acknowledge that you have read, understand, and agree to abide by this
Software License Agreement.
You agree that this Software License Agreement is the complete agreement
between ChiTech Software and you.
You agree that this Software License Agreement supersedes any and all prior
agreements, written or verbal, between ChiTech Software and you.
b.
c.
4
PCI500 Windows 95 Manual
Table of Contents
TABLE OF CONTENTS
CHAPTER 1. INTRODUCTION
1.1 PCI WINDOWS 95 FEATURES
1.2 QUICK START
CHAPTER 2. INSTALLATION
2.1. HARDWARE
2.2. SOFTWARE
CHAPTER 3. PCI WINDOWS 95 OVERVIEW
3.1. FILE
3.2. VIEW
3.3. SEARCH
3.4. MISC
3.5. TERMINAL
3.6. HELP
CHAPTER 4. TRACING BUS ACTIVITY
4.1 SETUP AND START A NEW TRACE
4.2 STATE AND TIMING DISPLAYS
4.3 TIME MEASUREMENTS
4.4 SEARCHING
4.5 PRINTING
4.6 SAVING TRACES
4.7 VIEWING SAVED TRACES
CHAPTER 5. HISTOGRAMS
5.1 SETUP AND START A HISTOGRAM
5.2 ADDRESS HISTOGRAMS
5.3 SIGNAL HISTOGRAMS
CHAPTER 6. STIMULUS
6.1 SETUP
6.2 ACTIVATION
CHAPTER 7. MASTER
7.1 SETUP
7.2 ACTIVATION
CHAPTER 8. MISC
-
5
PCI500 Windows 95 Manual
Table of Contents
8.1 SESSIONS
8.2 TERMINAL MODE
8.3 ONLINE HELP
6
PCI500 Windows 95 Manual
Introduction
CHAPTER 1
INTRODUCTION
WELCOME TO PCI WINDOWS 95 -- an easy to use, Graphical User Interface for the
PCI550, PMC550 and CPCI550 System Analyzers that runs under Windows 95 and NT
(Windows 3.1 available on request) on PC's and compatibles. PCI Windows 95 is designed
to extend the capabilities of the PCI550 by adding features such as a "point and click" user
interface, high resolution VGA graphic displays, and disk storage for trace buffer data and
Analyzer setups. PCI Windows 95 offers you an attractive alternative to the character
oriented interface provided by the PCI550 Analyzer's firmware.
Using PCI Windows 95 with the PCI550 System Analyzer is as simple as installing the
software, connecting the Analyzer to the PC's serial port, and clicking the PCI550 icon to
execute the program. To begin collecting bus data, just click on View on the main menu,
then New Trace and the Go icon on the Analyzer control panel. The Analyzer will capture
bus cycles until the trace buffer is full, and then upload this information to the PC for display.
You can then use the mouse to scroll through timing waveforms, or scan the state table
information for key events.
PCI Windows 95 supports all of the PCI550 System Analyzer functions, including:
PCIbus stimulus, master, data capture and display, and performance analysis. Detailed
instructions for PCI Windows 95 operation are provided in this manual. A handy quick start
guide outlines the basics to start capturing bus information. For details on the operation and
configuration of the PCI550 Analyzer, consult the “PCI550 System Analyzer Board User
Guide”.
1.1.
•
•
•
•
•
•
•
•
PCI WINDOWS 95 FEATURES
Supports All PCI550 System Analyzer Functions
Provides a Graphical User Interface with Point and Click Operation
Provides High Resolution Displays Including Waveforms and Histograms
Provides Multiple Sizable Displays
Provides Disk Storage for Data and Setups
Supports Printer Output of Displays and Data
Supports Direct Communication with Analyzer
Runs under WINDOWS 95 AND NT (Windows 3.1 version available on request)
7
PCI500 Windows 95 Manual
Introduction
1.2 QUICK START
This chapter provides a quick guide to installing and operating the analyzer with the
windows software.
1.2.1. Installation
The PCI550 Bus Analyzer installation software is contained on 3 diskettes. Insert the
diskette labeled 1 of 3 into the floppy drive and click START then RUN and type A:SETUP.
The installation process automatically copies all files and adds the icon PCI550 to the
program group. After installation restart the computer and click on the PCI550 icon to start
the program.
1.2.2. The First Time
The PCI550 communicates with a PC via one of the COMM ports. The port number
must be specified in the configuration menu and is saved for future sessions.
8
PCI500 Windows 95 Manual
Introduction
1.2.3. Capturing Bus Activity
To start capturing and viewing bus activity select View in the main menu then New
Trace or click the state display icon
activity click the GO icon
the STOP icon
. A blank state display appears. To start capturing
. Captured data fills the screen when the trace buffer fills or
is clicked.
A Trace in Progress window is displayed indicating buffer and trigger status. The bottom
of the trace window displays the number of samples before and after the trigger.
9
PCI500 Windows 95 Manual
Introduction
1.2.4. Capture Controls
A number of controls restrict when information is captured and the type of information
stored. Before clicking GO the following controls can be set.
Sample clock selections include every bus clock (Clk), when
address or data is valid (Sync) or fixed intervals (20ns to 1280ns).
Pretrigger sets the amount of information before and after the
trigger event (0%,25%,50%,75%,100%).
Store sets the type of information captured.
Trigger defines when information is captured.
Occurs defines the number of trigger occurrences before
declaring a trigger.
Format selects state, waveform or both displays.
10
PCI500 Windows 95 Manual
Installation
CHAPTER 2
INSTALLATION
This chapter describes the hardware and software requirements, setup and installation
procedures.
2.1. HARDWARE
2.1.1 PC Requirements
PCI Windows 95 will run on most PC's and compatibles. Specific hardware
requirements include the following:
•
•
•
•
•
•
•
•
•
VGA Graphics (or SVGA) Adapter and Monitor
8K Bytes of RAM
Hard Disk Drive with at least 5M Bytes of free space
WINDOWS 95 or NT (Version 3.1 also available)
Mouse and Associated Software Driver
3.5” Floppy Disk Drive to Load Software
Serial Port for Connection to Analyzer
Mouse
Parallel Port for Printer
2.1.2. PCI550 Analyzer Firmware
PCI Windows 95 will work with any hardware version of the PCI550 System Analyzer.
An on board Flash Memory contains a user terminal interface and all the control software for
the PCI550. This software can be updated by downloading a file via a PC thru either the
serial port or the PCI bus. The latest versions of the firmware are available on the internet.
Contact your distributor or Silicon Control for more information on upgrading the Analyzer.
Note: The Analyzer hardware and firmware revision is shown in the HELP menu of the
PCI550 Windows software.
When contacting Silicon Control or your distributor about upgrading firmware, be sure to
identify the version of the Analyzer.
11
PCI500 Windows 95 Manual
Installation
2.1.3 PCI550 Jumper Settings
Before installing the PCI550 Analyzer in the PCIbus chassis, please be sure that the
Analyzer is configured for 9600 Baud (or higher), with only XON/XOFF protocol (simple 3
wire communications protocol) selected. The jumper locations are shown in figures 1.1 for
the PCI550 and Figure 1.2 for the PMC550 and are as follows:
JMPR6
JMPR8
JMPR9
JMPR1
Serial Port Handshaking - RTS
Serial Port Handshaking - CTS
Baud Rate Selection
Reset Options
Figure 1.1 PCI550 System Analyzer Board
Figure 1.2 CPCI550 System Analyzer Board
12
PCI500 Windows 95 Manual
Installation
2.1.3.1 Baud Rate
The baud rate jumpers are on block JMPR9. The default setting is 9600 baud with all
three jumpers JMPR9-1, 2, and 3 removed.
Baud Rate
2400
9600 *
14400
19200
38400
56000
128000
256000
J9-1
OUT
OUT
OUT
OUT
IN
IN
IN
IN
J9-2
IN
OUT
IN
OUT
OUT
OUT
IN
IN
J9-3
IN
OUT
OUT
IN
OUT
IN
OUT
IN
* ( Default = J9-1,2,3 OUT )
2.1.3.2 Handshaking Protocol
The handshaking jumper block for the primary serial port is JMPR6 and JMPR8. There
should be NO jumpers installed on this jumper block for proper serial communications with
most PC's. When the following jumpers are IN they connect the handshaking signals to the
terminal or PC.
Signal
RTS
CTS
Jumper *
JMPR6
JMPR8
* ( Default = All Jumpers OUT )
2.1.3.3 Reset Jumper Block
The Reset jumper block allows a combination of reset options for the analyzer and
backplane. The front panel reset pushbutton can reset the analyzer (J1-2). The analyzer has
dedicated power up reset hardware to initialize the analyzer (J1-1). The backplane reset
signal can also be used to reset the analyzer (J1-3). In order to analyze a system during reset
it is recommended that J1-3 is OUT.
13
PCI500 Windows 95 Manual
Function
Enable On Board Reset
Enable Reset Pushbutton to Reset Analyzer
Enable Backplane to Reset Analyzer
Installation
J1 Position
1
2
3
*
* ( Default = J1-1,2 IN )
2.1.4 Installing the PCI550 Analyzer
Before inserting the PCI550 into a slot in a PCI system, make sure that all power to the
system is off. Once the Analyzer is properly installed in the PCI system, connect the DB9
end of the serial cable to the serial port on the Analyzer (RS232 Port on Figure 1.1 or 1.2).
Next, connect the DB25 adapter on the other end of the cable to a serial port on the PC.
Finally, turn on power to the PCI system to power up the PCI550. The green LED on the
PCI550 will be on when the Analyzer has power and the processor is running.
2.2. SOFTWARE
The PCI Windows 95 package is shipped complete with the following items:
(3X)
PCI Windows 95 Diskettes (3 1/2")
(1)
PCI Windows 95 User's Manual
If any of these items is missing contact Silicon Control immediately.
2.2.1 Installing PCI Windows 95
The PCI550 Bus Analyzer installation software is contained on 3 diskettes. Insert the
diskette labeled 1 of 3 into the floppy drive and click START then RUN and type A:SETUP.
The installation process automatically copies all files and adds the Silicon Control icon to the
program group. After installation restart the computer and click on the Silicon Control icon
to start the program.
14
PCI500 Windows 95 Manual
Installation
2.3.4. Configuring PCI Windows 95 for the First Time
The PCI550 communicates with a PC via one of the COMM ports. The port number
must be specified in the configuration menu and is saved for future sessions.
To do this, first click on the Misc button on the main menu bar and select Configuration
from the pull down menu. On the Configuration panel, point to the Com Port field and
click until the name of the port to which the Analyzer is connected is shown in the field
(COM1, 2, 3 or 4). Next, click on the Baud Rate field and select a value from the pop up
menu. (The default value is 9600 baud and can be set as high as 19200 baud. Also set the
Baud Rate jumper block on the board to match the selection.) Next, click on the OK button
to store the configuration on disk for the subsequent sessions. If the software cannot
communicate with the PCI550 board check the following:
*
*
*
Chassis in which Analyzer is installed is powered up.
Cable is connected between the Analyzer’s serial port and the correct PC port.
Baud Rate selected matches jumper baud rate setting on board.
15
PCI500 Windows 95 Manual
Overview
CHAPTER 3
PCI WINDOWS 95 OVERVIEW
The PCI Windows 95 main menu is divided into six functional areas: File, View, Search,
Misc, PCI Direct and Help. A toolbar located directly below the main menu provides quick
access to some commonly used functions. This section provides a brief overview of the
capabilities and features of each function. For greater detail, refer to the chapter dedicated to
that function later in the manual.
3.1 FILE
The File submenu consists of commands to save/open sessions, save trace data, print
trace information in a state or timing display and exit the program.
• Sessions consists of all open windows and corresponding setup information. A new
blank session is automatically created when the program is invoked.
• After trace data is captured the Save Trace or Save Trace As command stores a range
of captured samples to disk.
16
PCI500 Windows 95 Manual
Overview
• The Print command prints state, timing, histogram or stimulus information in the
currently active window.
• Exiting the program will not save any setups or data. The save commands must be
explicitly used to save any information before exiting.
3.2 VIEW
The View submenu creates windows to capture trace data, view saved traces, set and start
stimulus and master functions, communicate with the analyzer directly and perform a
backplane test.
• New Trace: The New Trace command creates a state or timing capture window with
capture controls. Clicking on the GO icon starts trace capture until the buffer fills or the
STOP icon halts the capture.
• Saved Trace: The Saved Trace command loads a previously saved trace and its
controls for viewing in a state or timing window.
• Histogram: The Histogram command creates a signal or address histogram window for
statistical analysis of a system.
• Stimulus: The Stimulus command opens a window to specify and initiate patterns of
stimulus driven onto the bus.
• Master: The Master command creates a window to initiate bus transfers such as
memory or configuration reads and writes.
• Terminal: The Terminal command creates a window to directly communicate with the
analyzer through its on board terminal interface.
• Backplane Test: The Backplane Test creates a window to initiate and display the
results of a backplane test. Before performing this test it is recommended that all other boards
be removed from the backplane.
17
PCI500 Windows 95 Manual
Overview
3.3 SEARCH
The Search submenu commands locate information after trace data is captured. The Find
command searches for the next sample that matches the information in the find specification.
State or timing information is displayed starting at the matching sample.
3.4 MISC
The Misc submenu controls analyzer and PC configuration, software preferences, the
Macro functions and starts the analyzer self test. After installing the windows software select
the COM port in the configuration command.
3.5 TERMINAL
The Terminal command creates a terminal window for direct communication with the
analyzer. A terminal user interface is embedded in firmware on the analyzer for direct control
of setup and trace information.
18
PCI500 Windows 95 Manual
Overview
3.6 HELP
Help is available for commands, setups, technical support and version identification.
19
PCI500 Windows 95 Manual
Tracing Bus Activity
CHAPTER 4
TRACING BUS ACTIVITY
4.1 SETUP AND START A NEW TRACE
4.1.1 Creating a New Trace
To create a new trace window click View - New Trace in the main menu or click on the
state display icon
. A window labeled Trace New -1 will appear with preset capture
controls along the top, a blank sample display in the middle and buffer / cursor information
on the bottom.
20
PCI500 Windows 95 Manual
Tracing Bus Activity
4.1.2 Capture Controls
The control fields along the top of the trace window specify sample clock, trigger
position, store filter, trigger condition, trigger occurrence count and type of display format.
Simply click in the box below each label to change the value.
The analyzer samples the bus using either the bus
clock or an analyzer clock.
• Clk samples on every positive edge of the system
clock.
• Sync also samples on the system clock, but only
when address and data are valid.
• The remaining selections are periodic intervals
based on an analyzer clock.
The trigger position defines the amount of
information stored in the trace buffer before and after a
defined event called the trigger. Once a trigger is
encountered a trigger position of 0% stores all events
starting the beginning of the trace buffer.
The store field selects the type of information to be
stored in the trace buffer. This may be all events or
only those that match a specified value or range.
The trigger defines when information is stored in
the trace buffer. This may be on the first event, a
simple user defined value or range, a combination of
events or a sequential series of events.
The occurs field sets the number of occurrences a
trigger condition must be met.
The format selection defines the type of trace
display. A state, waveform or combination of displays
are available. Icons in the tool bar also select these
displays.
21
PCI500 Windows 95 Manual
Tracing Bus Activity
4.1.3 Match Specifications
The Store and Trigger fields contain a Match selection. In the case of the Store field only
events that match the Match specification are stored in the trace buffer. This optimizes the
space in the trace buffer by storing only relevant information. The trigger field uses the
Match specification to position the trigger within the trace buffer. Events leading up to and
after a point of interest (trigger) can be observed.
Setting Match Fields
There are 4 Match specifications (labeled A, B, C, D) that are used for both store and
trigger conditions. Each specification contains a field for every bus signal and a number of
external inputs. The initial state of the signal fields are X’s (don’t cares). Any field may be
set to active low (0), active high (1) or don’t care (X) by clicking directly on the field. The
Address / Data and Command fields can be set in binary or hex. The Command field can also
be input by command name. The equal (=) field can be set for less then (<), greater then (>)
or equal to (=). This is used to specify an address / data match or range.
Combining Match Specifications
A single match condition or logical combination of match conditions can be specified in
the Match field at the bottom of the window. After clicking on the box simply type the letter
of the Match specification. To enter a logical combination of specifications enter an Boolean
equation using the operators “+” (OR), “.” (AND), “X” (XOR). For example in the equation
“A.B” both Match A and Match B conditions must be satisfied. This example can be used to
create an address window with lower and upper bounds by specifying “>” in A and “<” in B.
22
PCI500 Windows 95 Manual
Tracing Bus Activity
4.1.4 Complex Levels
Complex levels provide the functionality of 8 separate analyzers with there own capture
and stimulus controls linked together to precisely gather and drive bus events.
There are many applications including triggering on a sequence of events, starting and
stopping capture based on bus events, pulse width detection, event driven stimulus and much
more. Selecting Complex in the trigger field opens the following window:
Complex Level Specification
The complex trigger specification is divided into 8 levels (L1 through L8). During
operation only 1 level is active at a time. Jumps to other levels are possible based on the
event specified in the If Event field. A jump to the level specified in the first Go To field is
performed if the event is found on the bus, otherwise a jump to the level in the Else Go To
field is taken.
Each level contains its own capture and stimulus controls. The Clock, Store and Occurs
fields are identical to the standard trace controls and override the fields on the top of the trace
display. The condition specified in the Stimulus field is output for the duration of an active
level. Two Trigger fields specify if the event is to be used as the trigger condition.
The parameters of each field in the complex level display is described below.
23
PCI500 Windows 95 Manual
Tracing Bus Activity
Sample clock - Clk, Sync, 20ns, 40ns, 80ns, 160ns, etc.
Filter - All, None, A,B,C,D or logical combination.
Stimulus - 1 through 16, 0=No stimulus.
Event - All, None, A,B,C,D or logical combination.
Occurrence Count - 1 to 64K
Trigger if Event True - NO, YES
Go To Level if True - L1 through L8
Trigger if Event False - NO, YES
Go To Level if False - L1 through L8
4.1.5 Starting and Stopping a New Trace
. All setup
To start capturing bus activity simply click on the green GO icon
information is loaded into the analyzer and capture / stimulus begins. A capture in progress
window appears showing trigger and buffer full status.
The bottom of the New Trace window displays the number of samples captured before
and after the trigger event and the trigger position within the buffer.
Samples
Before Trigger
Trigger
Position
Samples
After Trigger
Captured data fills the screen when the trace buffer fills or the STOP icon
is clicked.
24
PCI500 Windows 95 Manual
Tracing Bus Activity
4.2 STATE AND TIMING DISPLAYS
Captured trace data can be observed in either state or timing display windows. Each time
New Trace is selected an additional window is displayed that can be resized to fit with other
windows. Only one trace window is active and communicating with the analyzer at a time.
and timing icon
on the toolbar provide a direct way to create new
The state icon
trace displays. Once trace data is captured you can switch between state and timing displays
without reacquiring the data using the Format field.
A cursor and display position indicator is located on the bottom of the window. This
represents the location of the displayed data within the trace buffer as well as trigger and
cursor positions.
4.2.1 State Display
The state display presents trace information in a vertical form with signal names across a
top header. This display can be customized by selecting signal names or signal groups in the
header. Trace data corresponding to the signal names is scrolled below the header. A scroll
bar on the right side of the window positions trace information on the display. Clicking the
up and down arrow moves the display by several samples, clicking on the open space
between the arrows moves the trace by pages and dragging the scroll bar positions you
anywhere in the trace buffer.
4.2.2 Timing Display
25
PCI500 Windows 95 Manual
Tracing Bus Activity
The timing display represents trace data in a waveform display. Signal or group names
are selected by clicking directly on the name. A horizontal scroll bar moves data across the
window. Under each name is a binary or hexadecimal value of the signal at the cursor
position.
4.3 TIME MEASUREMENTS
Several cursors are available for timing measurements in both state and timing displays.
Cursor X-T measures the time from the trigger to the X position, while cursor X-Y measures
time between the X and Y positions.
To place a cursor at a position in the trace display click the button next to the cursor name
located at the bottom of the window. Then click directly on the display. A line labeled with
the cursor name is placed on the display at that location. Timing information is calculated
and displayed in the box at the bottom of the window next to the cursor name.
26
PCI500 Windows 95 Manual
Tracing Bus Activity
4.4 SEARCHING
Locating captured information within the trace buffer is accomplished using the search
commands. To specify and start a search click Search then Find or click the Find icon
.
A Find window is opened with 8 search specifications. Each specification contains fields
for each bus signal, external signals and a Next Field. To set a field simply click directly on
the field.
A single match or match pattern can be specified. The Next field in each specification
allows a sequence of matches to occur before declaring a final match. This field can be set to
another search ID number or “0” to stop.
The Start At field must be set to the ID number of the search specification. Be sure to set
this field for a number between 1 and 8.
The search starts at the first captured sample displayed in the trace window by
clicking on the Find Next button. The search stops if a match is found and the matching
sample is displayed at the beginning of the trace display.
27
PCI500 Windows 95 Manual
Tracing Bus Activity
4.5 PRINTING
To obtain a hard copy of state, timing, histogram, stimulus or master information simply
click on Print or the print icon
. A Print window appears to select the printer, sample
range, page layout and print quality. The information in the currently active window is
printed.
28
PCI500 Windows 95 Manual
Tracing Bus Activity
4.6 SAVING TRACES
The Save and Save As commands store trace data and setup information on disk for later
retrieval and analysis. To save trace data click on File then Save or Save As. The Save
command stores information under the current trace name. The Save As command provides
the option for a different trace name. After clicking Save As the following window appears:
The sample range controls the amount of data to be stored. This is important to consider
due to the large amount of time required to read data from the analyzer and store it to disk.
The file name and location can also be entered in this window.
29
PCI500 Windows 95 Manual
Tracing Bus Activity
4.7 VIEWING SAVED TRACES
A saved trace with its setup information can be viewed later for analysis. To load a saved
trace click View then Saved Trace. An Open trace file window allows you to specify the
name and location of a previously saved trace file.
After clicking OK a trace window is opened with the saved sample data and setup
information.
30
PCI500 Windows 95 Manual
Histograms
CHAPTER 5
HISTOGRAMS
Histograms provide an overview of system performance. The Address Usage histogram
displays areas in memory space that are being accessed. Bottlenecks can be spotted and
explored in more detail using the capture functions. The Signal histograms can be customized
to provide an unlimited variety of useful displays. Some examples are interrupt usage,
command type usage, bus bandwidth, bus idle/busy times, etc.
The PCI550 Analyzer collects a fixed number of samples, computes statistical
percentages and averages them with prior samples. PCI Windows 95 displays this
information in a bar graph format along with counts and percentage information.
5.1 SETUP AND START A NEW HISTOGRAM
To create a new histogram window click on the Histogram icon
click on View then Histogram.
in the toolbar or
Several controls appear on the histogram window to customize the display and sampling
methods. The PCI550 Analyzer provides two types of histogram displays; signal and address
usage. To select the type of histogram click on the Format field and choose either address or
signal. The Clock field selects the sample clock used to capture activity. The Store field
specifies a filter for incoming data. Only data matching the Store criteria will be calculated in
the histogram display.
and the Analyzer will begin capturing
To initiate the histogram analysis, click on Go
data and computing statistics. Data collection stops when Total Samples exceeds the value in
the Max Samples field or when the Stop button
is selected.
31
PCI500 Windows 95 Manual
Histograms
5.2. ADDRESS RANGE HISTOGRAMS
For address range histograms, click on the Format field and select Address. Select each
of the Address Range fields at the left and enter the address ranges of interest by using the
keyboard. To monitor address range usage, Synchronous (SYNC) sampling is typically used
so that only one sample per bus cycle is captured. Select the Clock field and then SYNC.
To start capturing data, click on Go. Note that the Analyzer captures 1024 cycles at a time,
so it may take many "samples" to cover a large address range. Be sure to let the Analyzer
run until a sufficient number of samples has been collected.
32
PCI500 Windows 95 Manual
Histograms
5.3. SIGNAL HISTOGRAMS
For signal histograms, click on the Format field and select Signal. Then determine if the
trace data needs to be qualified. For Asynchronous sampling, it is often helpful to qualify the
trace so that only data relating to bus activity is stored. For example, to determine the
number of times a certain interrupt occurred, it is useful to consider only samples where the
interrupt information is present. To do this, select Store then select Match. Set up the Event
Specifiers to equal the interrupts of interest. Next, after Clearing the Match field, click on A
to select it as the storage qualifier. Then, select CLK for the Clock. Next, specify what
signals you want to analyze, which in this example would be the interrupts. Click on one of
the signal fields to the left of the histogram, and a complete menu of signals will open. Click
on the signal of interest.
Note: The four Event Specifiers (A, B, C, and D) also appear on the signal menu. These
can be used to compute the statistics for a combination of signals rather than for individual
signals. If you select an Event Specifier as one of your signals, an Event Specifier panel will
open so you can define it.
Be sure to let the Analyzer capture a large number of samples so that the statistical
information presented is valid.
33
PCI500 Windows 95 Manual
Stimulus
CHAPTER 6
STIMULUS
You can use the Stimulus function to assert signal patterns or sequences of signal patterns
on the PCIbus. (Caution: The signals will be asserted regardless of what else is
happening in the system.) This function can be extremely useful for a number of different
diagnostic tasks. You can generate bus signals without having a system controller in the
backplane. For example, you may want to exercise circuits on a prototype board to diagnose
a problem. Using the Stimulus function, you can define a sequence of signals to be asserted
on the backplane without developing any software and without any special hardware. The
Stimulus function can also be used to assert ILLEGAL bus conditions to test the response of
a system to a variety of ILLEGAL conditions. This can be very useful for verifying that a
system will not crash or malfunction due to extraneous interrupts or illegal bus activity.
34
PCI500 Windows 95 Manual
Stimulus
6.1 SETUP
To open a Stimulus window, click on the Stimulus icon
in the toolbar or click on
View then Stimulus in the Main menu. A list of 16 signal patterns will be displayed. Select
the signals you want to be asserted in each pattern. Set the Hold field to the number of
system clocks that you want the signal pattern to be asserted. Set the Wait field to the
number of system clocks to wait before asserting the next signal pattern on the bus. Set the
Next field to the ID of the next signal pattern in the sequence. To end a sequence, choose 0.
6.2 ACTIVATION
To generate stimulus on the bus set the stimulus ID number in the Start At field at the
bottom of the window and click on the Go icon
sequence, click on the Stop
. To terminate a long or looping
icon.
Stimulus conditions may also be activated using the complex levels in both state and
timing trace displays. When the trigger field in a trace window is set to Complex, the
analyzer can capture and stimulate the bus simultaneously. Each level contains the ID
number of a stimulus condition. If the stimulus field in a level is set to “0” then no stimulus is
sent out. See the section on Complex Levels for more information on the use and setup of
complex levels.
35
PCI500 Windows 95 Manual
Master
CHAPTER 7
MASTER
The Master functions perform data transfers across the bus. All bus commands, address
and data is selected by the user. A display of data read by the analyzer is presented in a easy
to read format in hexadecimal and ASCII.
36
PCI500 Windows 95 Manual
Master
7.1 SETUP
To create a Master window click on the Master icon
or click View then Master in
the main menu. The Master window contains a display showing data read in hex and ASCII
at specific locations and a number of fields to define a bus transfer. A vertical scroll bar
presents additional data not appearing on the display.
The bottom of the window contains master controls. The command field sets the type of
transfer. Clicking on the command field brings up the following selections:
The Start and End Address fields specify where to read or write data. During a write
command the value entered in the Data field is written between the start and end address.
The Buffered field, when set to “ON”, reads and writes data from a disk file instead of
the screen display. This is useful when a specific group of data values is written out to the
bus or when you want to write out the same data you read in.
The Bus Protect field disables the master functions when set to “ON”. This prevents the
accidental transfer of data when it is critical not to influence the operation of a system.
7.2 ACTIVATION
To start a transfer on the bus click on the Go icon
the Stop
. To terminate a transfer click on
icon.
37
PCI500 Windows 95 Manual
Misc
CHAPTER 8
MISC
8.1 SESSIONS
The current state of the windows software including all open windows, trace data and
setup information can be saved to disk as a session. Saved sessions can be opened and
examined later for analysis.
8.1.1 Saving a Session
To save a session click on the Save Session icon
or click File then Save Session in
the main menu. A Save Session window opens to specify a file name and directory to save
the session. If there are trace windows opened and the trace data has not been saved you will
be prompted to save it.
38
PCI500 Windows 95 Manual
Misc
8.1.2 Opening a Session
To open a saved session click on the Open Session icon
or click File then Open
Session in the main menu. An Open Session window opens to specify a file name and
directory to open the session.
39
PCI500 Windows 95 Manual
Misc
8.2 TERMINAL MODE
Terminal mode allows you to communicate directly with the Analyzer. To enter terminal
mode, click on the Terminal icon
Main menu bar.
on the toolbar or click Terminal then On Line in the
A blank screen with the Analyzer command prompt (PCI>) will appear. At this point,
you can use any of the Analyzer commands. See Appendix A for a complete listing of the
PCI550 commands.
8.3 ON LINE HELP
Help is available online to assist in operating the bus analyzer. To obtain help click on
Help in the main menu bar. Information can be found based on content or by searching.
Version number identification is displayed after selecting About PCI550.
40
PCI500 Windows 95 Manual
Appendix A
APPENDIX A
PCI550 COMMAND SUMMARY
Trace Capture
GO
Start event capture
GO F Start capture forever
GO [trig]
Capture using trigger
GO [level]
Capture using level
GO HR[c]
Range histogram [count]
GO HS [c], Signal histogram [count]
H
Select histogram signals
R[I-8] Select histogram ranges
W
Select waveform signals
SS[I-81
Store setups
RS[ 1-81
Recall setups
SP[I-81
Store screen pages
RP[I-8]
Recall screen pages
Trace Buffer
P
Display next page
PDisplay previous page
P[fl] P[fl,f2] Display at frame number
PS[1-8]
Search trace
PM[1-81
Set search condition
PD
Select trace display
PE[fl,f2]
Display elapsed time
DS
CF
Trigger Setup
ABCD
LI L2 L3 L4
TP
0
TO
Display setup
Configure options
Set match conditions
Set level conditions
Trigger position
Occurrence count
Trace qualifier
Miscellaneous
CL [ 1-81
CA[ 1-8]
T
I
SO
SF
WR
RR
VER
HELP[cmd]
CS
CR
Command line setup
Command line activation
Self test
Clear current setup
Turn on go status
Turn off go status
Write raw setup data
Read raw setup data
Read version number
Help detail
Clock set
Clock read
41
PCI500 Windows 95 Manual
Appendix A
Configuration
LED ON/OFF Red LED control
M
Capture / command toggle
S
Select sample clock
42