1
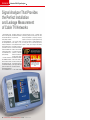
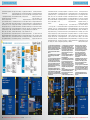
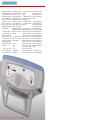
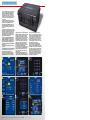
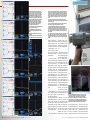
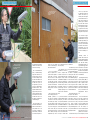
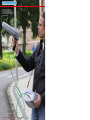
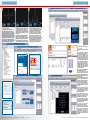
TEST REPORT
Professional DVB-C Signal Analyzer
Rohde &
Schwarz
22 TELE-audiovision International — The World‘s Largest Digital TV Trade Magazine — 03-04/2014 — www.TELE-audiovision.com
•Top of the Line Cable TV Analyzer
•Specially Designed to Detect
Leakage Signals
•Displays the Entire Spectrum from
FM to WiFi
•Special Directional Antenna for
the Aircraft and LTE Bands
•Enables Compliance with the
Strictest EMS Regulations
R&S EFL
www.TELE-audiovision.com — 03-04/2014 — TELE-audiovision International — 全球发行量最大的数字电视杂志
23
TEST REPORT
Professional DVB-C Signal Analyzer
Signal Analyzer That Provides
the Perfect Installation
and Leakage Measurement
of Cable TV Networks
Rohde & Schwartz is wellknown for their high-quality
test instruments that can be
found primarily in laboratories and R&D departments.
For mobile applications the
company has developed the
new EFL product line for use
by technicians to check and
measure an installation. One
of the products from this series, the R&S EFL210, is especially interesting.
It has been conceived for
the installation and maintenance of cable TV networks
with emphasis on the maximum attenuation of leakage
signals. The analyzer comes
with a matching antenna and
it‘s this combination of the
R&S EFL-210 analyzer and
R&S EFL-Z100 antenna that
we put to the test.
Both of these products
come shipped in a very
sturdy hard plastic case that
was designed to be used in
extreme outdoor conditions.
Inside the case the analyzer and antenna are further
protected by a solid foam
material that perfectly fits
the R&S EFL-210 analyzer
and R&S EFL-Z100 antenna.
There are also cutouts in
the foam to securely store
the accessories such as the
power supply, coaxial cable
and various connectors.
In one of these storage
cutouts you‘ll also find two
special carrying straps that
allow you to carry the EFL210
analyzer on your body. Due
to the size of the antenna,
the carrying case for the
analyzer is actually quite
large: it measures about
52cm (20.5in) wide x 42cm
(16.5in) long x 22cm (8.6in)
high and weighs about 10 kg
(22 LBS) with all of its accessories. One thing is for sure
though: this case definitely
03-04/2014
Rohde & Schwarz EFL210 + EFL-Z100
The best and most complete professional
instrument for CATV operators and their
installers.
www.TELE-audiovision.com/14/03/rohde-schwarz
24 TELE-audiovision International — The World‘s Largest Digital TV Trade Magazine — 03-04/2014 — www.TELE-audiovision.com
provides the best protection
for its contents.
At first glance the analyzer
itself looks rather unusual in
that it isn‘t a typical rectangular construction. Instead
it has a rounded, almost
oval shape to it. It won‘t
take long though for you to
realize the reason for this
ergonomic shape: the R&S
EFL210 sits very comfortably in your hands and can
easily be operated with both
thumbs as can be seen by
the ring buttons located on
the right side. The analyzer
can be securely held in your
hands while at the same time
all of its functions can easily
be accessed.
Particularly clever are the
three eyelets on which the
carrying strap is attached.
This allows the technician to
carry the R&S EFL210 and
have both hands free at the
same time. This can be especially crucial if you need one
hand to adjust the antenna
and the other hand to hold
on to something. This carry-
ing strap system is different
from other systems that use
only one strap that hangs
around your neck.
Through a three-point system the analyzer also has
a strap that wraps around
your waist. In this way the
R&S EFL210 doesn‘t dangle
around the upper part of
your body, something that
many technicians have to
live with every day and turns
out to be a safety hazard if,
for example, you‘re walking
around on scaffolding.
1
The front panel features a
set of buttons on the left side
and the right side. The set of
buttons on the left side includes four buttons in the
shape of a cross to navigate
through the different menus
(up, down, back, and OK) as
well as a button to access or
exit the menu and an additional button to take you to
the Main menu.
The Power button that
turns the analyzer on/off
is located on the lower left
alongside four LEDs. Three
of the LEDs show the status
of the rechargeable battery
(external power source, internal power source and
battery is charging) while
the fourth LED illuminates
when the R&S EFL210 is
turned on.
On the right side is a
„touch-knob“
that
simulates a mechanical rotating
knob; instead of turning a
knob, you merely pass your
finger (the thumb would be
best) over the touch knob.
The touch sensor works perfectly making it easy to use,
for example, for extreme
fine frequency adjustments.
The sensitivity of the sensor
can be adjusted to your personal tastes in the analyzer
settings but the default settings worked just fine for our
tests.
the button for 2-3 seconds.
To further increase the technician‘s productivity, two additional buttons are reserved
as function buttons that can
be programmed by the user
to any desired function.
Surrounding this touchknob are another 15 buttons
that provide direct access to
all of the R&S EFL210‘s functions. After a short break-in
period you‘ll hardly need to
access the menu since lessused menu pages can be accessed through an additional
function of these buttons,
namely pressing and holding
In the middle there‘s a
high-resolution color monitor
that is exceptionally bright. It
has a resolution of 640x480
pixels and parameters such
as brightness, contrast and
color can, of course, be adjusted as needed. There‘s
also a special mode that provides for exceptional monitor
readability.
1. The menu structure of the R&S EFL210 at
one glance. One can see that great care has
been taken to provide a user friendly and
logical menu structure that allows to quickly
access all functions of this instrument.
2. Start screen of the Rohde & Schwarz
EFL210.
3. The equipment info screen. Throughout
the test I was using the latest firmware
version.
4. Let’s start configuring the R&S EFL210.
The built-in pre-amp can be turned on
or off and you can select the preferred
units for the measurements. This device
can be set to an automatic mode, which
will then output the common units for
different measurements. This is a highly
appreciated new feature.
5. Support for many different languages.
6. Using external amplifiers or other active
elements like switches or a LNB the output
voltage can be set. The included R&S EFLZ100 antenna needs to be powered with 13V
for the LTE band.
7. In the Antenna menu select between two
pre-configured R&S antennas, the EFLZ100 (included) and the R&S HE-300. Two
further antenna settings can be configured
by the user, who can then also set the
correct antenna factor (K). The K value
expresses the antenna gain for a given
frequency in MHz.
8. A unique feature with the R&S EFL210:
it can be pre-configured for up to four
different applications.
9. The R&S EFL210 can be configured for
low power consumption, which will allow
for a longer autonomy when running on
batteries. The drawback will be a less
bright screen, but it might get you around
for a particularly work intensive day. The
auto mode will try to give the best relation
of brightness and speed against battery
autonomy.
10. Being a handheld measuring instrument
for field use the R&S EFL210 features a
memory logger that allows to store the
measurements made.
11. There are different options within the
Memory/Logger menu. It is possible to
store the measurements and graphs and
to access SD type memory cards. This
is particularly important as technicians
are often on the field for days, generating
a lot of information. Using SD cards,
the data can be copied to them and
read on a PC without connecting the
R&S EFL210, allowing to write reports,
while the instrument is still available for
measurements.
The MACROS option allows to define a set
of measurements exactly tailored to the
individual need. Once setup, you just run
the macro and the instrument will do all
measurements automatically.
12. Doing a regular scan. The R&S EFL210
will tune all frequencies of the selected plan
and provide a quick PASS/FAIL information
view, recording all relevant measurements.
These are stored and can be recalled at any
time.
13. The R&S EFL210 supports SD cards
with sizes up to 2GB; SDHC cards are not
supported.
2
4
6
8
10
12
3
5
7
9
11
13
26 TELE-audiovision International — The World‘s Largest Digital TV Trade Magazine — 03-04/2014 — www.TELE-audiovision.com
On the top side of the analyzer you‘ll find the HF input.
As you might expect with a
professional
instrument,
the input jack is designed
to be used with a variety of
swappable connectors („F“
connector, BNC connector,
etc.) that are naturally included with the analyzer.
There‘s also a slot for an SD
memory card available (unfortunately, only SD cards
up to 2GB are recognized;
SDHC cards are not compatible), a USB interface
that allows you to connect
the R&S EFL210 to a PC, an
HDMI output and the power
www.TELE-audiovision.com — 03-04/2014 — TELE-audiovision International — 全球发行量最大的数字电视杂志
27
supply jack. A speaker and
a recessed Reset button are
also provided. On the rear
panel you‘ll find a stand that
can be opened into two positions so the analyzer can
be comfortably used on a
table. Two cooling vents on
either side of the analyzer
provide sufficient ventilation
for the R&S EFL210.
Overall, the analyzer felt
very solid and robust even
though it didn‘t feel all too
heavy. Particularly striking
is its unusual design that
after only a few minutes impressed us with its outstanding ergonomics and convenient operation.
To help us get used to
using the R&S EFL210, we
first started playing with
the otherwise normal functions you‘d find in cable TV
measurements. Here you
can setup, measure and display analog and digital transponders as long as they are
not encrypted. For a channel
scan the standard cable TV
frequency lists are preprogrammed into the analyzer
although you can easily and
comfortably edit and expand
this list from your PC. More
on that later.
The following measurements can be performed
with analog signals:
●
●
●
●
●
●
Level
V/A
C/N
C/N L
Field Strength
Bandwidth
● Display of reception parameters
● BER
● MPEG: Channel list and
video display with MPEG2
and MPEG4 support
● Constellation diagrams
● Evaluation of uncorrectable packets
Measurements such as
BAR Scan (simultaneous signal level display of multiple
channels in bar graph form)
and TILT (skew) that can be
found in many other CATV
signal analyzers are not
available in the R&S EFL210.
It would be nice to have
these functions to, for example, properly set up an amplifier so that all of the frequency ranges would have
a uniform signal level. But
there‘s a reason that these
28 TELE-audiovision International — The World‘s Largest Digital TV Trade Magazine — 03-04/2014 — www.TELE-audiovision.com
extra functions are missing;
the R&S EFL210 includes a
spectrum analyzer that in
the end is a much better alternative!
Thanks to the logical menu
structure and sufficient number of buttons, using the R&S
EFL210 is a piece of cake. We
were able to work with all of
the measurements in CATV
mode without having to refer
to the user manual. Especially useful is the simultaneous
display of the image and the
spectrum. Although the displayed image is distorted, it
is still easy to determine the
quality of analog signals by
simultaneous analysis of the
spectrum.
The R&S EFL210‘s spectrum analyzer highlights the
14. Measuring analogue CATV channels
is very simple and quick. Just select the
required frequency and off you go. All
relevant information is displayed in one
single screen and PASS/WARNING/FAIL
icons show immediately if the channel to
noise ratio, video to audio ratio and signal
level are adequate.
15. If only one measuring parameter is
important it can be displayed exclusively in
a larg font.
16. One of the special features of the R&S
EFL210 is its capability of mixing different
information into one single screen. For
analogue channels visualizing the image
is often not enough. Being able to evaluate
the line signal allows to check for example
if the sync signals are within conformity.
17. This oscilloscope functionality can be
displayed individually. It is possible to
select the line to be analyzed and to zoom
in.
18. Zooming in reveals some noise within
the line blanking interval. Despite having
an acceptable picture quality, this shows a
potential problem.
19. A different visualization mode shows
the demodulated image next to the
spectrum view of the current transponder.
The relevant measurements are displayed
as well.
20. The tuner and demodulator are of the
finest quality and despite the considerably
weak signal a good image is rendered. This
only shows how important it is to rely on
the measurements and explains why you
can never use a normal receiver or TV to
evaluate a CATV signal.
21. One interesting measurement is the
channel/noise ratio of a selected video line.
Instead of measuring against an average
of all lines you can select a specific line,
against which you measure the ratio to
the noise level. This is very handy if you
are working with test pictures, where the
desired pattern occupies only part of the
image.
22. You can specify the level thresholds.
Once the set level is reached the
instrument stops the search. The search
function can be done in both directions
and the spectrum updates in real-time,
following the frequency.
23. Once a channel is found with at least
the specified signal level the search stops
and immediately the measurements are
presented.
24. To make the channel tuning easier it is
possible to select from a list of predefined
channel plans. I have created my own
channel plan, covering all analogue
channels of my cable operator using the
R&S EFL Suite on the PC.
25. Configuring the audio.
14
18
22
15
19
23
16
20
24
17
21
25
30 TELE-audiovision International — The World‘s Largest Digital TV Trade Magazine — 03-04/2014 — www.TELE-audiovision.com
26. All measurements clearly visible at one
glance: Frequency, CBER, Signal Power,
C/N Ratio and MER. Notice that CBER is
shown twice: once along with the other
measurements and then a second time in
a bigger format. On the bottom you get the
list of services contained in the current
transponder.
27. Pressing the MENU button will show
further options. You can edit the reception
parameters, visualize BER with more
detail, and display the MPEG picture, the
constellation diagram or a statistic with
how many uncorrected packets are being
received.
28. This screen allows to edit the reception
parameters. Notice that the deviation of the
Symbol Rate is automatically calculated
and shown. All of these values can be set
to automatic and in most situations the
R&S EFL210 will be able to automatically
tune to the QAM transponder.
29. Here we see the demodulated MPEG
picture. The R&S EFL210 supports both
MPEG-2 and MPEG-4, so you are always
prepared for whatever standard is being
used. The OSD shows the CBER along
with the relevant channel PID’s and MPEG
information.
30. The constellation diagram is fast and
functional.
31. With QAM64 you get four quadrants and
you can zoom into each one of the four.
32. This will allow analyzing the
constellation in more detail. If you give
the meter a few seconds it will display
MER and CBER as well, thus allowing a
complete analysis of the signal. Note that
CBER is the Bit Error Rate before the error
correction algorithm is applied. While
the BER after the correction is useful to
effectively see what amount of errors the
demodulator will have to deal with it is
the CBER that you want to evaluate to get
an idea on how stable the reception will
be. Many problems in the constellation
diagram can only be understood and
resolved by simultaneously considering
the constellation diagram, MER
(modulation error ratio) and CBER. Hence
it is a great feature of the R&S EFL210 to
provide all three measurements in one
screen. This is by no means common in
CATV analyzers.
33. Better than a Bit Error Rate after the
error correction: the R&S EFL210 gives a
complete statistic on uncorrected packets!
These are shown in number and time
interval, i.e. how much time passed since
the last uncorrected packet appeared. Each
uncorrected packet will produce a glitch
in the TV image, so it is nice to have this
measurement running over a small period
of time to understand if the reception is
indeed acceptable or not. It can be used to
spot intermittent problems, too.
34. I especially like this measurement
screen: one can see the demodulated
picture, the PID’s and MPEG info’s together
with CBER. This is a quick and simple way
to confirm if everything is OK. Notice that
the rather borderline measurements of my
CATV service is due to the fact that I am
using a very poor signal on purpose to see
how the tuner of the R&S EFL210 handles
weak signals. You can see the results: no
problem for the R&S EFL210
26
29
32
27
30
33
28
31
34
32 TELE-audiovision International — The World‘s Largest Digital TV Trade Magazine — 03-04/2014 — www.TELE-audiovision.com
strength of this device: the
spectrum is displayed not
only in real-time but also
provides a frequency span of
2500 MHz. In this way you‘d
be able to observe the entire
frequency spectrum from FM
all the way up to WiFi!
lephony. In a perfect world,
there wouldn‘t be any signal leakage from the cable
network, but, of course, the
real world looks quite different. Various leakage signals
can manifest themselves
and could be caused by the
smallest imperfection in a
coax cable or an improperly
attached connector.
In addition to standard
functions like the ability to
place markers (maximum
of three different markers)
to calculate frequency and
level/power offsets, RBW
and VBW filters can also
be individually customized.
Also, the sweep rate can
be selected from three different modes: normal, fast
and special accuracy. This
is especially practical for a
technician; this function automatically selects the ideal
RBW and VBW values for
each selected mode.
Even utilizing defective
passive or active components could cause signal
leakage; and especially with
these types of defects the
coax cable could end up behaving like a transmitting
antenna that, depending on
the type of defect, would
broadcast the signal in the
coax cable across various
frequency ranges.
That‘s why there are specific regulations and recommendations that dictate
what kind of leakage and
how much of it can be toler-
35. This is a detailed view of the selected
CATV transponder. Using a span of 10MHz
with a RBW filter width of 100kHz the
transponder is rendered with a very nice
detail. Individual carriers can be identified
and the refresh rate is in real time.
36. The same frequency but with a 20MHz
span and a RBW filter settings of 200kHz.
37. Now with 50MHz span. Everything is
still rendered in smooth real time.
38. At the 100MHz span the RBW filter
automatically adjusts to an 800 kHz
window, since you could not benefit from a
higher resolution anyway, because of the
fixed screen resolution
39. Smooth real time spectrum with a
200MHz span, which outperforms any other
spectrum analyzer I have tested so far in
the CATV bands.
40. To shorten it up: with an amazing 2GHz
span and the RBW filter set to 6.4 MHz
width the spectrum is still very detailed
and rendered in smooth real time.
41. And yet the R&S EFL210 managed to
surprise me with real time spectrum on
a full span of 2.5GHz. Congratulations to
Rohde & Schwarz!
42. Measurements of analogue signals are
represented by a signal level while digital
signals use the signal power. In order to
correctly represent the measurement at
In cable networks, the
higher frequency signals
are distributed into the 50
to 2150 MHz range. The result is that a large amount of
data in a variety of different
modulations is simultaneously transported, namely:
radio, analog TV channels,
digital
TV
transponders,
broadband Internet and te-
ated before it becomes too
much. Signal leakage has
become even more prevalent since the introduction
of LTE (4G) mobile networks
for broadband Internet. Cable network operators therefore need to painstakingly
test and protect their cable
networks against any signal
leakage.
And
it‘s
exactly
this
problem that the Rohde &
Schwartz EFL210 with the di-
the marker frequency you can select which
mode you are interested in.
43. Within the spectrum you can now
measure in the analogue mode: Level,
V/A (video to audio ratio), C/N (channel
to noise ratio), Field Strength and the
Bandwidth.
44. Another nice and useful feature:
the R&S EFL210 shows an automatic
quality assessment of the signal. If you
get a green checkmark, everything is
OK. Yellow means that you have weak
signal quality and red indicates no
reception. A technician can see this result
immediately, without having to think about
the measured values. This increases
So, how is this done? The
productivity and makes the job easier.
45. Here you can measure Power, C/N, BER
(Bit Error Rate) and bandwidth. Measuring
bandwidth of the transponder can be very
useful for unknown transponders.
46. Measuring the C/N, also known as
frequency noise, shows the difference
between signal power and noise power.
47. Here I am measuring the bandwidth
of a digital QAM64 transponder. The
transponder uses more than 7 MHz.
48. Moving the markers I could determine
that the bandwidth of this transponder was
indeed 8 MHz.
43
46
35
37
39
41
44
47
36
38
40
42
45
48
34 TELE-audiovision International — The World‘s Largest Digital TV Trade Magazine — 03-04/2014 — www.TELE-audiovision.com
rectional antenna EFL-Z100
were meant to be used for:
this compact measurement
instrument makes it possible
for the technician to quickly
and easily test a cable network for any signal leakage,
locate it and then eliminate
it. This instrument also simultaneously functions as a
cable TV analyzer that can
be used on both analog and
digital cable signals.
www.TELE-audiovision.com — 03-04/2014 — TELE-audiovision International — 全球发行量最大的数字电视杂志
35
■ Handling both the
R&S EFL210 and the
R&S EFL-Z100 is an
easy task. The antenna
is not too heavy and
the straps are very
comfortable around
the neck. Thanks to the
ergonomic shape of
the instrument and its
circular button grid, you
can access all functions
with your thumb.
36 TELE-audiovision International — The World‘s Largest Digital TV Trade Magazine — 03-04/2014 — www.TELE-audiovision.com
49
50
51
49. Our calibrated Test Source generates
test signals at user defined frequencies and
power levels. The test signal is of extreme
accuracy, making it the ideal way of testing
the R&S EFL210. And indeed, this picture
does not lie: using the HDMI-output of the
R&S EFL210 connected to my test computer
(which has a HDMI capture card), I put both
windows side by side. Look at the result:
I generated a -40 dBm signal at 130 MHz
and on the other side of the cable, the R&S
EFL210 measured -40.7 dBm at exactly
130.00 MHz. An excellent result.
50. I repeated the same test at 180 MHz. Now
I got only -0.1 dBm deviation.
51. At 950 MHz I got -0.2 dBm difference.
52. Again, only -0.5 dBm difference at 1450
MHz
53. Finally, at 2150 MHz, the deviation was
+0.1 dBm.
54. Wondering, why I got a higher deviation
at the first measurement, I decided to repeat
55
52
56
53
57
54
58
the measurement at 130 MHz and now I got 0 dBm deviation. The
truth is that any deviation under 1 dBm is an amazing precision
for any HF instrument and the R&S EFL210 beats hands down all
our meters, including the reference devices. And why did I get a
better result this time? Because you should allow any measuring
instrument to warm up properly if you want the most accurate
results.
55. The REF LEVEL option is normally called “MAX HOLD” in
other devices. It will continually show the highest value measured
within the spectrum.
56. First I activated the waterfall display. The picture illustrates
the frequency sweep of the signal source generator.
57. Using the REF LEVEL option turned on and allowing for
a full sweep the spectrum shows the continuous frequency
measurement. I normally try this on all spectrum analyzers and
I can assure that this is by far the best result I have seen so far.
The maximum value forms practically a horizontal line with very
little variation.
58. In this picture I did a frequency sweep over a whopping 1GHz
span. Again, the results are fantastic. Remember that on this
sweep the R&S EFL210 only gets 1 second to adjust itself to the
signal at a given frequency to measure it and to update the REF
LEVEL.
leakage measurement is
performed using a waterfall
diagram. It shows the spectrum over a specific time period where each spectrum
is represented as a colorcoded line: black and dark
colors signify a weak level
while light colors indicate a
high signal level.
We already reported on
this type of display in TELEaudiovision several times
(in the 12-01/2012 and 0203/2012 issues). The waterfall diagram provides for a
continuously running overview of the spectrum over
a time span of seconds or
minutes depending on how
fast the waterfall diagram of
the spectrum scrolls across
the screen. This is perfectly
suited to quickly finding the
source of any leakage signal by slowing moving a directional antenna back and
forth.
The R&S EFL-Z100 is the
perfect directional antenna
for the job. It consists of
four pieces: the antenna itself, a hand grip that can be
installed in two different positions, as well a two metal
rods that can be attached
to the antenna on the sides
turning the antenna into a
dipole (needed when working in the aircraft band).
When measurements are
38 TELE-audiovision International — The World‘s Largest Digital TV Trade Magazine — 03-04/2014 — www.TELE-audiovision.com
performed in the LTE frequency range, these dipoles
are not attached. The R&S
EFL-Z100 is an active antenna with an integrated amplifier.
This antenna was designed
to work best on the mostoften encountered and most
dangerous leakage frequencies: the aircraft communications band and the LTE
mobile frequency band. Rohde & Schwartz went a step
further and calculated the
antenna factor for those two
frequency bands and stored
them in the R&S EFL210. The
antenna factor (AF or K-factor) is calculated using the
formula AF=E/V and represents the ratio between the
electric field strength E of
the incoming radiation with
respect to the output voltage
V of the antenna. But when
you use the R&S EFL-Z100
antenna, you don‘t have
to worry about any of this:
simply select this antenna
from the antenna menu and
you‘re ready to go.
■ Since the R&S EFL210 does not allow to record screen shots
Naturally, you can also
connect any antenna you
like to the EFL210 but then
you would have to correctly
define the antenna factor
yourself. This antenna definition can only be entered
on a PC with the R&S EFL
Software Suite. Since the
antenna factor is depend-
ant on the actual frequency,
the antenna configuration in
the R&S EFL Suite involves
entering a table: for each
frequency a corresponding
K-factor can be entered. The
■ View of a
building with
CATV cables.
Let's see if this
doesn't produce
some leakage.
Guess what: yes
it does.
of the waterfall diagram in leakage mode I did my best to take
a pictures of the screen: notice that to the left of the DVB-T
transponder at 754 MHz there is a lot of leakage from the CATV
visible (in blue color). The reading in the waterfall diagram is
not constant, because I am swinging the R&S EFL-Z100 antenna
around, in order to determine the exact location of the leak.
user can store two self-defined antennas in the analyzer in addition to the already
predefined EFL-Z00 directional antenna and another
R&S antenna, the R&S HE-
www.TELE-audiovision.com — 03-04/2014 — TELE-audiovision International — 全球发行量最大的数字电视杂志
39
■ To measure in the aeronautics
band, you need to use the
two dipoles attached. The 13V
power feed can be turned off, as
amplification will increase the
gain only marginally.
40 TELE-audiovision International — The World‘s Largest Digital TV Trade Magazine — 03-04/2014 — www.TELE-audiovision.com
Aero
59. A span of 5MHz may be a small span
for CATV and satellite technicians but it
is a huge span for radio communication
specialists. Thanks to the very narrow
RBW filter of just 18 kHzW you can clearly
see all radio communications happening
within the selected span. In this case a
pilot is speaking to the tower.
60. Here you see the tower’s reply.
Because our test center is just 10 km away
from the airport we can clearly receive
such communications. The waterfall
display allows to register all communications within the span over a period of time.
Notice that the R&S EFL210 displays the
signal level accurately in µV/m, which is
the correct unit to measure EMI.
61. No transmission happening now on
121.10 MHz, the frequency used by the
OPO airport tower. Imagine the consequences of a leakage, generating interference on this frequency. This could
severely disrupt the communication
between pilot and tower on a landing
maneuver.
62. This picture shows the full span of
aeronautics frequencies. This span is
universally used throughout the world.
Gladly no leakage could be detected in the
test center, otherwise we would have to
immediately correct the problem.
63. Here we see a communication happening on a different frequency. With the R&S
EFL210 I can now visually detect any radio
communication in this band at a glance,
instead of having to scan through known
frequencies or doing a frequency search.
FM
64. A pre-programmed frequency range
is available to monitor the FM radio band.
This allows to analyze if interferences
occur between 88 Mhz and 108 MHz. Any
radio station can naturally be tuned in by
the R&S EFL210 and the audio is reproduced.
65. View of the FM band with a 20 MHz
span. Individual radio stations can clearly
be identified.
GSM
66. The full span of the GSM band. Two
frequencies are being used, but with a faint
signal. This is normal, since I am using a
smartphone with GPRS and EDGE frequencies and usually GSM mode is turned off.
There is no other cellphone using GSM in
vicinity, either. Also, no leakage. This was
to be expected, because cable operators
avoid putting transponders at frequencies
this high.
LTE
67. Leakage measurement with the R&S
EFL-Z100 antenna. You can clearly see the
DVB-T transponder at 754 MHz and the
neighboring LTE transponder at 800 MHz.
Some transmission is happening at 742
MHz.
68. The transmission at 742 MHz is highly
directional: pointing the R&S EFL-Z100
antenna to a different direction, nothing is
detected at this frequency.
69. The same happens to the mobile phone
transponder at 786 MHz. Further rotation
of the R&S EFL-Z100 and this transponder
disappears as well.
70. This is what leakage looks like. You
can clearly see the DVB-C transponders, despite the fact that I was using the
directional R&S EFL-Z100 antenna a few
64
70
59
65
71
UHF
60
66
72
WiFi
61
67
73
62
68
74
63
69
75
meters away from the coaxial CATV cable.
This should never happen in real life, as
it means that radiation is coming out of
the coaxial cable, interfering with radio
services.
71. The leakage is directional and with
the current orientation of the antenna, no
leakage is detected (spectrum in the upper
half of the screen). However, the waterfall
diagram clearly shows that leakage was
registered within the last seconds, when
the antenna was pointing to a different
direction. If you slowly move the antenna
from left to right, you will quickly find the
source of the leakage!
72. The antenna is pointing at the leakage
again, the CATV transponders are clearly
visible in the spectrum. Notice how the
waterfall diagram shows a faint signal
which is getting stronger as the antenna
points toward the leakage source. This is
an extremely useful functionality of the
EFL-210: you won’t just determine that
there is leakage occurring, you will indeed
find the source very quickly.
download happening on my laptop, which
is connected to the access point by Wi-Fi.
Interesting fact: we have a pretty good Wi-Fi
connection in our test center, because there
are no interfering signals caused by access
points from neighbors or other services
like analogue video transmitters or wireless
security cameras (both normally use the 2.4
GHz frequency range).
73. The waterfall diagram shows the UHF
section of the CATV cable in our test
center. You can clearly distinguish analogue transponders from digital transponders: the thin lines belong to the analogue
transponders. Notice that they come in
pairs – one line is the video carrier, the
other the audio carrier.
74. Using an antenna no CATV transponders are found, which means that there is no
leakage in this frequency range. The signal
you see comes from different radio applications – I am using a radio scanner antenna.
75. Because the R&S EFL210 can deal with
frequencies up to 2.5GHz it is possible to
analyze the 2.4GHz Wi-Fi frequency range
as well. In these pictures you can see a
42 TELE-audiovision International — The World‘s Largest Digital TV Trade Magazine — 03-04/2014 — www.TELE-audiovision.com
www.TELE-audiovision.com — 03-04/2014 — TELE-audiovision International — 全球发行量最大的数字电视杂志
43
■ Often though, the source
used a very simple trick:
the MAX Hold function was
utilized. This feature continuously shows the highest
measured values and is normally used, for example, to
perfectly align an antenna.
In this case with an active
MAX Hold function, the spectrum registers the „wandering“ power level. You merely
have to wait until it has gone
through the entire spectrum.
of the leaks were not the
splitters of the CATV
operators.
■ Leakage in the LTE band
is determined using the
R&S EFL-Z100 antenna
without the dipoles and
with the internal amplifier
turned on. For this you
simply activate the 13V
power on the RF connector.
It is reassuring to hear
a slight click inside the
antenna, signaling that the
amplifier is active.
Our conclusion regarding measurement precision?
The R&S EFL210 is not just
a simple signal analyzer, it‘s
a fully featured test instrument. If you use this Rohde
& Schwartz unit to make a
measurement, you can be
sure that the measured values will be absolutely correct.
■ Walking along the street
I was impressed on how
much leaked radiation I
could pick up.
300, that with it‘s swappable
modules can be used for the
9 kHz to 7.5 GHz range.
For our TELE-audiovision
tests, a simulated leakage
signal was created here in
the test center to get a feel
for how the analyzer works
and from what distance the
leakage can be detected. At
the same time it gives us
an opportunity to get used
to using the R&S EFL-Z100
directional antenna. Since
this particular antenna is designed primarily for the aircraft and mobile LTE bands,
the frequencies from 108 to
139 MHz and from 700 to
800 MHz can be analyzed in
a waterfall diagram.
The first task was to use
the EFL-Z100 directional antenna to check for both frequency bands here in the
test center. For the FM and
aircraft bands, the antenna
is used with the dipoles in-
44 TELE-audiovision International — The World‘s Largest Digital TV Trade Magazine — 03-04/2014 — www.TELE-audiovision.com
serted and the amplifier
turned off. No leakage signals could be detected.
For the LTE frequency
band, the dipoles are removed and the amplifier is
turned back on. This activates the 13V at the R&S
EFL210‘s HF connector output. Once again, no troublesome leakage signals could
be found. This isn‘t at all surprising considering that our
cabling adheres to certain
directives.
Now the actual test could
start. Leakage signals were
artificially
generated
so
that there was something
to measure. Our test setup
was actually quite simple:
we merely inserted a small
dipole antenna into the cable
TV port. Sure enough, from
several meters away and
even through a wall we were
able to identify some QAM
transponders very close to
an LTE transponder at 800
MHz (see photos).
With analyzers like the
R&S EFL210 it can be difficult to compare measurement results from the
spectrum display with other
analyzers. Why? Because
the R&S EFL210 displays the
spectrum in a higher resolution thus letting you identify
individual carriers within a
transponder. Of course, the
signal strength varies considerably depending on the
content of the transmitted
data.
If you want to be able to
compare different analyzers
side-by-side, you‘d have to
set up all of the parameters
equally, such as, range as
well as RBW and VBW filters.
But it would be difficult to do
this because of the differences in the settings of each
device. You would also have
to hope for uniform data
transmission.
A far better way to check
the precision of a signal analyzer like the R&S EFL210 is
to measure a synthetically
created signal with known
parameters. That‘s why we
used a calibrated signal generator to test the measurement precision of the R&S
EFL210. To that end we generated a signal at various
frequencies and at different
power levels and measured
it with the R&S EFL210.
It‘s quite impressive to see
how precise the measured
values turned out. Measurements that are off by less
than 1.0 dBm are incredibly
precise and even a sweep
over
various
frequency
ranges delivered consistent
results, something that really only can be achieved with
high-quality hardware.
To measure the sweep we
Naturally,
Rohde
&
Schwartz also includes the
necessary Windows software
with the EFL210, the R&S EFL
Suite. With this software,
measurement protocols using the stored Logger files in
the EFL210 can be created.
You can also edit channel
lists and it‘s even possible to
create frequency tables and
so-called Macros.
Specifically, these memory
frequency tables (MEM) together with these Macros
makes it possible to automatically create measurement protocols whereby the
R&S EFL210 automatically
sets up and measures the
preprogrammed
frequencies.
This is an excellent timesaving way to perform the
same measurement at different points in an installation. CATV installers would
especially benefit from this
since the frequency table from the cable provider
would only need to be programmed once via Macro.
From that point on, it would
www.TELE-audiovision.com — 03-04/2014 — TELE-audiovision International — 全球发行量最大的数字电视杂志
45
■ Notice how I am holding the
antenna. For me, this was the most
comfortable configuration. If you
prefer, you can screw the handle of
the antenna rotated 180 degrees and
hold it upside down.
46 TELE-audiovision International — The World‘s Largest Digital TV Trade Magazine — 03-04/2014 — www.TELE-audiovision.com
76
77
Amateur Radio
76. It happens occasionally that a customer complains about intermittent TV
reception. Often the cause is an amateur
radio enthusiast, who is using inadequate
equipment. The picture shows the waterfall diagram of a transmission done with a
cheap handheld radio, emitting at 145 MHz.
Interestingly, the radio disturbs a nearby
transmission at 148.5 MHz. Notice that the
waterfall diagram shows that transmission,
whenever the radio is not transmitting.
86
78
This happens, because the radio has not
so good band pass filters, which produce
second harmonics that are stronger than
expected. This second harmonics is visible
as the first smaller line to the right of the
main signal.
77. This is the spectrum view around the
center frequency of 145 MHz wcith a 20
MHz span. The hand held radio is not transmitting in this picture, thus the transmission at 148.5 MHz is not being disturbed.
78. See what happens in this picture, when
79
you use the cheap hand held radio: lots of
harmonics, obfuscating all transmissions
in vicinity. With the R&S EFL210 you can
uncover problems resulting from such
devices very easily and in an affordable
way. Thanks to the included directional
antenna you even get to know where the
transmission is coming from, if the interferences are within the supported bands of
the R&S EFL-Z100 antenna. Otherwise you
can use the R&S HE-300 antenna, which
covers the whole spectrum from 9 kHz to
7.5 GHz, thanks to its modular design.
80
81
84
48 TELE-audiovision International — The World‘s Largest Digital TV Trade Magazine — 03-04/2014 — www.TELE-audiovision.com
88 The
Rohde & Schwarz
EFL Suite
82
85
83
87
89
79. The main window of the R&S EFL
Suite.
80. The R&S EFL210 is connected to
the PC using a USB cable. However,
the interface will actually create a
virtual serial port (RS-232) for the
EFL Driver. It is a good idea to check
the Device Manager to confirm that
the driver has been properly setup
and to read the COM port number. If
your computer has other COM ports,
for instance because you have a
Bluetooth adapter, you will get some
odd COM port like I did: in my case it
is COM16. You may need to manually
configure the R&S EFL Suite to use
the specific COM port.
81. The About screen of the R&S EFL
Suite. I tested the latest v4.15.
82. No doubt a useful feature: you
can import your company logo and
input your company details. They will
then be included in the automatically
generated reports.
83. Next configuration: Which COM
port is attributed to the R&S EFL210?
Hopefully you did as I suggested and
looked it up in the device manager.
84. Once connected the R&S EFL
Suite will read out the memory of
the instrument. This takes only a few
seconds.
85. On the right side you can now
choose what you wish to download
from the instrument to the computer:
data logs, graph logs (actual screen
shots) or channel plans.
86. The data logs can be viewed on
the PC and you can check them, so
that they are included in the report
generated by the R&S EFL Suite.
87. A perfect looking report, generated automatically by the R&S EFL
Suite and using our custom logo and
company information.
88. Of course you can generate
reports with screen shots as well.
89. Just select which screen shots
you want to include, using the “Mark
to print” option. It is great that you
can export these screen shots as
regular pictures, too. This way you
can use your own report templates,
for instance using Microsoft Office
products.
www.TELE-audiovision.com — 03-04/2014 — TELE-audiovision International — 全球发行量最大的数字电视杂志
49
90. The R&S EFL Suite allows to edit the channel plans and of course you can create your
own customer channel plans. This is required
when you are working for a CATV provider,
who uses specific transponder frequencies.
Just program them once and off you go.
91. Another interesting feature of the R&S
EFL210 is the possibility to create macros,
which are basically frequency lists that you
select to be automatically measured. In the
first step you need to create a “Memory”,
which is basically a transponder. You need
to configure the transponder by inputting
its channel number or frequency value and
specifying if it is an analogue or digital transponder.
92. Once you have your “Memory” definitions setup, you can switch to the Macros tab
and create a macro. Select a name and put
the required memories inside.
After uploading the memories and macros
to the R&S EFL210, you can select the macro
and execute it. The R&S EFL210 will then
tune each memory and perform the measurements, storing the results automatically in
the instruments memory. This is particularly
useful, when you need to measure the same
transponders over and over.
90
91
always be available to the installer to
test the installation of a customer.
With the R&S EFL Suite two additional
user-defined antennas can be set up in
case other antennas would be used besides the R&S EFL-Z100 and the R&S
HE-300.
The operation of the R&S EFL Suite is
not at all complicated and doesn‘t first
require reading a user manual even
though a browser-based user manual
is available. We really appreciated the
import/export capabilities to Microsoft
Excel.
92
In this way you‘re not dependent on
the functionality of the R&S EFL Suite;
you can, for example, also use Microsoft Word to create protocols. This
would hardly be necessary since the
protocols generated by the R&S EFL
Suite actually look quite good and can
even be supplemented by a company
logo. Overall, we very much liked the
R&S EFL Suite; you‘ll enjoy using it.
There are still a few bugs in the current version but they will be corrected
by Rohde & Schwartz in an upcoming
update. For example, when the software is linked with the R&S EFL210, it
incorrectly states that a new firmware
update is available when in reality that
update is only for the R&S EFL240 and
R&S EFL340 models.
The R&S EFL210 signal analyzer is the
ideal solution for cable operators and
their subcontractors that are responsible for the installation and maintenance
50 TELE-audiovision International — The World‘s Largest Digital TV Trade Magazine — 03-04/2014 — www.TELE-audiovision.com
93. When the spectrum is shown in real time
it only needs to render 25 to 50 images per
second, which is the LCD screen’s refresh
rate. However, when looking at analogue or
digital transponders the signal varies much
quicker. This means that the spectrum
analyzer shows the average or maximum
signal level within the refresh rate period
of the spectrum. Toggling the VBW Filter,
you can actually determine the time period
that is used to average the signal level. The
left picture shows a VBW filter setting of 1
kHz, while the right one shows a VBW filter
setting of 15 kHz. Which is better? That
is up to the technician to decide: a lower
filter will show a more averaged spectrum,
which is easier to interpret, while a higher
filter setting will show a more “nervous”
spectrum, which shows more detail
about what is happening on each single
frequency. Notice how you can detect the
carriers of the transponder. The downside
is a more difficult-to-read spectrum, since
transponders get harder to distinguish
93
94
of cable networks. In just
a single device the signal,
regardless if it‘s analog or
digital, can be measured and
displayed while at the same
time a large assortment of
functions are also available
to measure leakage signals.
The fact that the R&S
EFL210 comes with a spectrum analyzer that can display an enormous range of
2.5 GHz is unheard of in an
analyzer of this class and definitely helps the technician
create a picture of multiple
frequency ranges.
As you would expect from
a Rohde & Schwartz product,
its measurement precision
is extremely high and yet
it‘s very easy to use. From
its unique shape to the arrangement of all of its buttons, everything is just right.
Given the ever increasing
responsibility of the cable
TV operators and installers
in terms of compliance with
maximum permissible interference, the R&S EFL210 is
the ideal reference solution.
Spectrum
Analyzer
Operation
and the
Function
of the RBW
and VBW Filters
The R&S EFL210 signal
analyzer comes with a professional and fully featured
spectrum analyzer. Unlike
most other standard satellite and cable analyzers, with
the R&S EFL210 you can set
up RBW and VBW filters to
your personal requirements.
But what are these filters exactly? In order to answer this
question you first have to
understand how a spectrum
analyzer works.
With the R&S EFL210 the
HF input signal is converted
to a small frequency range by
a bandpass filter that is then
digitized and inserted into
the spectrum through Fast
against the background noise.
94. The effect of different RBW Filter
configurations: all pictures show the same
transponder. On the left picture you see
the result of using a resolution bandwidth
of 200 kHz, the middle picture uses a
resolution bandwidth of 800 kHz and the
right picture has the resolution bandwidth
set to 1.6 MHz. The bigger the bandwidth,
the faster the refresh rate of the spectrum.
A faster spectrum reacts quicker to any
signal variation, allowing you to see
things faster and to detect short timed
signals. Don’t worry with the R&S EFL210:
all shown resolution bandwidths will be
rendered in real time. These pictures are
just to show the effect of the RBW filter.
What is really important is to be able to
adjust the RBW filter to the current span: if
you are using a wide span, you want to use
a higher resolution bandwidth to maintain
the refresh rate of the spectrum high. If you
are using a narrow span you want to have
maximum resolution, instead. The R&S
EFL210 excels in the spectrum analyzer
mode.
Fourier Analysis (FFT). This
frequency range is continuously swept across the selected range. This spectrum
analysis implementation is
called „Hybrid Super Heterodyne FFT“ and offers the
best compromise between
an analog spectrum (without
FFT analysis and thus lower
resolution and precision) and
a pure „Realtime FFT“ spectrum (FFT analysis across
the entire frequency range,
something that can only be
accomplished with extremely high computing power and
multiple parallel running FFT
analyzers). In fact, the R&S
EFL210 functions with a remarkable FFT bandwidth of
20 MHz. This makes it possible, for example, to simultaneously analyze the entire
LTE frequency band.
The RBW filter (Resolution
Bandwidth) specifies the frequency bandwidth that the
bandpass filter allows to pass
through. The smaller the
frequency bandwidth, the
higher the resolution of the
52 TELE-audiovision International — The World‘s Largest Digital TV Trade Magazine — 03-04/2014 — www.TELE-audiovision.com
resulting spectrum. But this
higher resolution requires
more time to calculate the
spectrum and in turn more
time to generate it. If, on the
other hand, a larger frequency bandwidth is selected for
the bandpass filter, the spectrum display is generated
much more quickly but with
a lower resolution.
With the R&S EFL210
the RBW parameter is automatically set so that the
resolution of the spectrum
is as close as possible to the
resolution of the display: it
doesn‘t make any sense to
generate a spectrum with a
resolution that is higher than
the display itself can handle.
Naturally, the bandwidth
of the R&S EFL210‘s RBW
filter can also be set manually. This would make sense
when, for example, two
neighboring signals can only
be differentiated with maximum resolution. The RBW
filter can be set from 300
kHz to 6.4 MHz.
The VBW filter is a Video
Bandwidth filter. Once the
HF signal has passed through
the VBW filter, it is digitized
by the detector. The signal is
digitized multiple times and,
depending on the setting
of the spectrum function, a
maximum value or an average value is calculated. The
video bandwidth sets the
sensitivity with which two
measured signal levels can
still be differentiated. And
just like before, the higher
the sensitivity, the slower the
generation of the spectrum
display. The R&S EFL210 supports video bandwidths from
100 Hz to 1 MHz.
expert
OPINION
Rohde & Schwarz EFL210
Professional DVB-C meter
Vitor Martins
Augusto
Test Center
Portugal
Measuring Satellite
and Terrestrial Antennas
with the R&S EFL210
Although the R&S EFL210 was not conceived for satellite antenna installations and doesn‘t come with a corresponding demodulator, it‘s still possible for the technician to set up satellite antennas with this analyzer.
For one thing the R&S EFL210 can display the required
spectrum from 950 MHz to 2150 MHz with every possible
function in real time. The R&S EFL210 is also capable
of supplying the necessary 14V and 18V for the LNBs
as well as switching between vertical and horizontal polarization. The only thing missing is the 22 kHz signal
to switch between the low and high bands. But it would
be good enough to install and align a small satellite antenna. It‘s important to note that an installer working
under contract to a provider who sets up both CATV and
satellite reception systems would save themselves the
cost of a second analyzer.
RECOMMENDED
PRODUCT BY
+ ● Allows a span over the whole 2.5 GHz frequency band
● Configurable RBW and VBW filters
● All common measurements available for spectrum: signal/
power level, bandwidth, up to three markers
● Integrated CATV analyser with analogue and digital measurements (signal/power level, C/N, MER, BER, constellation diagram,
etc.)
● Demodulator for analogue Radio and TV, MPEG-2 and MPEG-4
● Leakage measurement through waterfall diagram in selected
frequency bands (FM, Aeronautics, VHF, UHF, LTE, GSM and WIFI)
● Includes directional antenna for aeronautic and LTE frequency
band
● Allows to measure leakage to comply with EMI regulations
● Easy and intuitive operation
● Highest accuracy
– ● Does not allow to capture screenshots in Leakage mode
The same scenario exists with the sporadic use of the
R&S EFL210 in aligning antennas for terrestrial digital
TV. Here the excellent real-time spectrum would help
and even amplifiers and active antennas could be used
with the available 5V, 14V, 18V and 24V. If you need to
set up antennas for DVB-T/T2, you could also use the
R&S EFL210.
54 TELE-audiovision International — The World‘s Largest Digital TV Trade Magazine — 03-04/2014 — www.TELE-audiovision.com