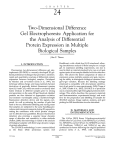
1
DIGE approved
application note
Automated spot handling
Proteomics in ADME/Tox studies: Automated spot handling of peptides prior to MALDI and electrospray MS
identification of proteins altered by drug treatment
S
key words:
Ettan Spot Handling Workstation • protein identification • Ettan
DIGE system • sample preparation • MALDI-ToF MS • LC-MS/MS
This application describes the use of the Ettan™ proteomics
platform to produce biologically significant proteomics data.
Samples from livers of mice either treated with a candidate
drug or untreated were quantified, labeled, and subjected to
2-D gel electrophoresis. Following 2-D gel scanning and
imaging, pick lists that included protein spots differentially
regulated following treatment with the candidate drug were
created for unattended, reproducible spot handling on Ettan
Spot Handling Workstation. Subsequent mass spectrometry
using MALDI-ToF, chemically assisted fragmentationMALDI, and LC-MS/MS resulted in confident identification
of 100% of the proteins showing at least 50% changed level
after treatment with the drug candidate.
Pooled standard
sample
Sample treated with
candidate drug
Label with CyDye DIGE
Fluor Cy5 minimal dye*
Label with CyDye DIGE
Fluor Cy2 minimal dye
Untreated sample
Label with CyDye DIGE
Fluor Cy3 minimal dye*
mix
2-D gel
electrophoresis
Imaging, matching
pick list
Ettan
Spot Handling
Workstation
Introduction
It is estimated that about 50% of drugs in development fail
during clinical trials because of deficiencies in their ADME/
Tox (absorption, distribution, metabolism, elimination, and
toxicity) properties (1). The cost of these failures so late in
the drug development process is naturally very high. In
addition, it has been suggested that over 5% of hospitalized
patients still suffer serious adverse reactions to drugs that
have successfully completed their development and come
onto the market (1). Improved means of gathering ADME/
Tox information earlier in drug development should thus
benefit pharmaceutical manufacturers and, of course,
patients.
We have investigated whether a proteomics approach would
identify differential levels of mouse liver proteins after
treatment of mice with a candidate drug. Such information
could help elucidate which proteins are involved in
metabolism and toxicity and thus increase the value of
ADME/Tox studies in drug discovery.
an
11-0004-19 AA, 2004-03 • p1
Spotting
Digestion
Spot picking
LC-MS/MS
mically assisted
mentation-MALDI
MALDI-ToF
PMF
Fig 1. The experimental workflow used for the successful
(100%) identification of proteins selected by the criterion of
displaying at least a 50% change in abundance after
treatment with the candidate drug. * In the experimental
workflow, a second gel was run where the labelling was
reversed i.e. treated sample was labeled with Cy3 and the
untreated sample labeled with Cy5 CyDye DIGE Fluor minimal
dye respectively.
Automated spot handling
The Ettan design platform offers a complete solution of
reagents, kits, and systems for proteomics-based research at
a stage before biological validation is feasible. Central to the
whole proteomics workflow is the Ettan Spot Handling
Workstation, a highly flexible and robust system that allows
fully-automated, unattended low- and/or high-throughput
handling of protein spots separated by 2-D gel
electrophoresis.
A key feature of the workstation is that it avoids the manual
errors that normally have a negative impact on obtaining
reproducible results. Avoiding such errors is of critical
importance since downstream biological validation of the
data obtained is very labor intensive. Every effort made to
gather reproducible and accurate data at the proteomics
experimental stage will pay dividends later. In other words, it
is essential that the “right” spots are chosen and picked for
downstream validation studies.
Figure 1 illustrates the full experimental workflow and key
techniques used in the investigation, which are described in
more detail in the Methods section.
Products used
Amersham Biosciences products used:
Ettan sample preparation kits and reagents
2-D Clean-Up Kit
2-D Quant Kit
DeStreak Reagent
80-6484-51
80-6483-56
17-6003-19
2-D electrophoresis systems and consumables
CyDye DIGE Fluor Cy2 minimal dye, 25 nmol
CyDye DIGE Fluor Cy3 minimal dye, 25 nmol
CyDye DIGE Fluor Cy5 minimal dye, 25 nmol
Immobiline DryStrip, pH 3–10 NL 24 cm
Ettan IPGphor II IEF System
Ettan DALTtwelve Large Vertical
Electrophoresis System
Typhoon 9410 Variable Mode Imager
DeCyder Differential Analysis Software
RPK0272
RPK0273
RPK0275
17-6003-77
80-6505-03
80-6466-27
60-0055-81
18-1163-05
Spot handling and mass spectrometry
Ettan Chemicals Trypsin, Sequencing Grade
Ettan Chemicals Trifluoroacetic Acid,
Ettan Spot Handling Workstation
Ettan MALDI-ToF Pro
Ettan CAF MALDI Sequencing Kit
an
11-0004-19 AA, 2004-03 • p2
17-6002-75
17-6002-76
18-1164-05
18-1156-53
17-6002-97
Other materials required
SYPRO Ruby stain (Molecular Probes)
Alpha-cyano-4-hydroxycinnamic acid (LaserBio Labs)
Biobasic C18 column (Thermo Hypersil)
Finnigan ProteomeX Workstation (Thermo Electron Corporation)
Finnigan LTQ Linear Ion Trap Mass Spectrometer (Thermo
Electron Corporation)
Finnigan LCQ Deca XP Plus Ion Trap Mass Spectrometer
(Thermo Electron Corporation)
Methods
Treatment of mice with candidate drug
The selected candidate drug was administered orally to
inbred C57BL/6 mice over five days. Livers from treated mice
and untreated littermates were removed, dissected, and snap
frozen in liquid nitrogen.
Sample preparation and quantitation
Sample (0.5 g) of each liver (three treated livers and one
pooled control each of three untreated livers) were rinsed in
PBS and homogenized in 10 volumes (5 ml) lysis buffer
(10 mM Tris-HCl pH 8.3, 7 M urea, 2 M thiourea, 5 mM
magnesium acetate, 4% CHAPS) according to reference 2.
To remove interfering nonprotein material, 2-D Clean-Up
Kit was used on a 10 × 100 µl homogenate according to the
kit instructions. 2-D Quant Kit was used to quantitate the
prepared samples, also according to the kit instructions.
Sample labeling
Samples were thawed and their pH determined by pipetting
1 µl of each onto pH paper. The pH was adjusted to between
pH 8.0 and pH 8.5 by adding 2 µl of 50 mM NaOH to each
100 µl aliquot of homogenate. One-hundred microgram of
each sample was labeled according to reference 3. Individual
samples (treated and untreated livers) to be analyzed were
labeled with CyDye™ DIGE Fluor Cy™5 minimal dye and
CyDye DIGE Fluor Cy3 minimal dye respectively. In
addition, a pooled standard containing all samples included
in the experiment was prepared and labeled with CyDye
DIGE Fluor Cy2 minimal dye.
The differently labeled individual samples and the pooled
standard were mixed prior to 2-D electrophoresis.
2-D gel electrophoresis
First dimension: Cup loading was selected for analytical
electrophoresis. One-hundred and fifty microgram of the
mixed sample (50 µg of each Cy2, Cy3, and Cy5-labeled
sample on each gel) was applied to each 24-cm Immobiline
DryStrip, pH 3–10 NL. For preparative electrophoresis,
1 mg samples were loaded onto 24-cm Immobiline™
Automated spot handling
DryStrip gels, pH 3–10 NL by in-gel rehydration in
DeStreak™ Rehydration solution + 2% IPG buffer,
pH 3–10. The rehydration step was performed according to
the user manual.
Second dimension: Electrophoresis (2 W/gel) was performed
overnight using lab-cast gels (4) on Ettan DALTtwelve
electrophoresis system according to the protocols in
reference 5. The preparative gels were poststained by
SYPRO™ Ruby according to the manufacturer’s
instructions.
Scanning
Each gel was scanned at 100 µm resolution on Typhoon™
9410 Variable Mode Imager using 520BP40 (Cy2),
580BP30 (Cy3), and 670BP30 (Cy5) emission filters.
Image analysis
Images were analyzed using DeCyder Differential Analysis
Software, v5.0 in both the DIA and the BVA modules. For
statistical analysis, two-way ANOVA was used with the
Student’s t-test value set to 0.01 ± 1.5 times intensity.
Individual images were created for the different Cy2, Cy3,
and Cy5 labeled gels and matched using DeCyder software.
Two preparative gels were added to the experimental study
and parallel pick lists that included all spots of interest (i.e.
those differentially regulated following treatment with the
candidate drug) were created for subsequent spot handling
prior to mass spectrometry.
Automated spot handling
Selected proteins were subjected to fully automated spot
handling in Ettan Spot Handling Workstation. A method
that included spot picking, digestion, and spotting on Ettan
MALDI target slides was selected in the software, and the
whole procedure was run automatically overnight without
any manual intervention either within or between steps.
In this automated procedure, gel plugs were cut by a 2-mm
picking head and washed twice in 50% methanol and
50 mM ammonium bicarbonate and once in 75%
acetonitrile before drying. For digestion, 10 µl trypsin
solution (0.2 µg Trypsin, Sequencing Grade, [Ettan
Chemicals]) was added before incubation at 37 °C for 2 h.
Extraction was performed in two steps by addition of 50%
acetonitrile and 0.1% Trifluoroacetic Acid (Ettan
Chemicals). The pooled extract was finally dried prior the
two-step spotting procedure, where the matrix solution of 5
mg/ml solution of recrystallized α-cyano-4-hydroxycinnamic acid (LaserBio Labs) in extraction liquid was
deposited on the target. In the final step before MALDI-ToF,
a tenth of the dissolved sample was mixed with the matrix
an
11-0004-19 AA, 2004-03 • p3
layer on the target, leaving the rest for other analyses, e.g.
chemically assisted fragmentation-MALDI and LC-MS/MS.
Protein identification using MALDI-ToF, chemically assisted
fragmentation-MALDI, and LC-MS/MS
Protein identification by peptide-mass fingerprinting (PMF)
was performed on Ettan MALDI-ToF Pro. Data acquisition,
spectrum processing, and database searches were performed
in automatic mode with internal calibration using trypsin.
To further improve the identification rate, chemicallyassisted fragmentation-MALDI was used on proteins not
successfully identified by PMF. This technique enables
peptide sequence data to be acquired simply, quickly, and
with good sensitivity by analyzing the CAF-labeled peptides
in post-source decay (PSD) mode on Ettan MALDI-ToF Pro.
Finally, the few spots that were still not identified using
MALDI MS were subjected to LC-MS/MS analysis. The
tandem mass spectrometric analysis was performed on
Finnigan™ LTQ™ linear ion trap mass spectrometer
(Thermo Electron Corporation) fitted with Biobasic C18
column (100 × 0.1 mm, Thermo Electron Corporation)
running at 1 µl/min flow rate. A fast gradient profile enabled
a total analysis time of 20 min during which approximately
5500 scans were acquired using the data-dependent “triple
play routine”. In this mode, peptides detected in a survey
scan are selected for high-resolution Zoom Scan followed by
fragmentation by MS/MS. The spectra were then processed
automatically by SEQUEST™ to get unambiguous
identification based on peptide sequence contained in the
product ion spectrum. The built-in features of data
dependent acquisition™ and dynamic exclusion™ allows
automated collection of useful data and enables efficient
handling of coeluting peptides, ensuring maximum
sensitivity and sequence coverage for identified proteins.
Results and discussion
As expected when preparing samples from an organ like the
liver, the protein concentration in the four lots was about
10 mg/ml (treated 1, 10.02 mg/ml; treated 2, 9.67 mg/ml;
treated 3, 10.23 mg/ml; pooled untreated control,
10.40 mg/ml), i.e. 1/100 of the prepared sample was protein.
This points to a very high recovery since about 1/10 of
organs should consist of protein and the 0.5 g samples were
diluted 10 times in 5 ml lysis buffer.
After 2-D gel electrophoresis and image analysis, DeCyder
software fully matched 1450 spots between the three
different images for each gel. Figure 2 shows the matched
spots.
Automated spot handling
Number of protein spots matched on the 2-D gel
1450
Protein spots processed through Ettan Spot Handling Workstation
552
Proteins identified i automatic mode
298/552
Proteins found to be at least 50% up- or down-regulated
30/552
Proteins identified by peptide mass fingerprinting
Fig 2. Protein spots (1450) matched on the 2-D gel by
DeCyder Differential Analysis Software. A picklist of 552 spots
was generated and automatically transferred to Ettan Spot
Handling Workstation.
24/30
Proteins identified by chemically assisted fragmentation
4/6
Proteins identif ed by LC-MS/MS
Of these 1450 protein spots, 30 spots were found to be
differentially regulated. A total of 552 spots, including the
30 diferentially regulated spots, were selected as a reasonable
test for automatic spot handling on the workstation (which
can handle a maximum of 1152 samples from up to twelve
gels per batch). The picklist was thus generated and
automatically transferred to Ettan Spot Handling
Workstation, which used it to pick, digest, and spot all 552
proteins, again with full automation and no manual
intervention. All 552 spotted proteins gave PMF spectra
following preparation in Ettan Spot Handling Workstation.
When expectation values <0.05 were collected, 298 of these
spots (54%) were automatically identified. Manual editing
should increase this number significantly. Figure 3 illustrates
the results workflow and shows the methods and outcome
of the protein identification.
2/2 (5/5)
Fig 3. Workflow from the initial matching of 1450 spots on the
2-D gels to the successful identification of all 30 mouse liver
proteins up- or down-regulated by more than 50% following
treatment with a candidate drug (LC-MS/MS was used to
confirm three identities made by the other two methods).
At this stage, we decided to focus on identifying the
regulated 30 proteins. MALDI-ToF analyses identified 24 of
the 30 regulated proteins (80%) directly by peptide-mass
fingerprinting. Figure 4 shows the spectrum of one of these
24 proteins, later identified as formyl transferase (position 8
in Table 1). Six spots were analyzed by chemically assisted
fragmentation-MALDI of which four (67%) were
successfully identified (spectra not shown). For the two
remaining proteins, an LC-MS/MS method using the
Finnigan ProteomeX™ Workstation and LCQ™ Deca XP
Plus Ion Trap Mass Spectrometer proved successful
(example shown in Fig 5). The LC-MS/MS approach was
also used to confirm three identifications made by MALDIToF and chemically assisted fragmentation-MALDI. Table 1
shows the identities of all 30 proteins up- or down-regulated
by more than 50% following treatment with the candidate
drug.
Picking accuracy was high. The backing of the gels stabilizes
their dimensions and a self-adhesive label attached prior to
scanning links the electronic image with the actual gel. In
addition, the design and movement of the picked head
ensured a clean and precise cut that also promotes high
an
11-0004-19 AA, 2004-03 • p4
Automated spot handling
picking efficiency. The clean cut, combined with hydrophobic
coatings on the picking head and needles, minimized crosscontamination. Carry-over was not detected.
Fig 4. Spectrum of a protein analyzed by MALDI-ToF following
automated handling and preparation on Ettan Spot Handling
Workstation. The protein was identified as formyl transferase
(see Table 1, row 8).
Fig 5. Product ion spectrum of peptide AFSVFLFNTENK
(isopentenyldiphosphate delta-isomerase from mouse liver,
abbreviated to IPP isomerase in Table 1 on rows 27 and 28)
with highlighted b- and y-ion series fragments detected in the
spectrum.
Table 1. Protein identification results listing ID method, protein name, ID number (NCBI database), and relevant biochemical
information. The protein whose spectrum is shown in Figure 4 is found at position 8 in this list. Average ratio shows extent of
regulation, negative values indicate down regulation, positive values indicate up regulation.
1
2
3
4
5
6
7
8
9
10
11
12
13
14
15
16
17
18
19
20
21
22
23
24
25
26
27
28
29
30
ID me thod
Average
Ratio
PMF
PMF
PMF
PMF
PMF
M S/MS
PMF
PMF
PMF
P MF/MSMS
CAF + PMF
PMF
PMF
PMF
PMF
PMF
PMF
PMF
PMF
CAF
CAF
PMF
PMF
M S/MS
PMF
PMF
PMF/M S/MS
CA F/M S/MS
PMF
PMF
-1.59
2.85
2.65
1.55
1.74
-1.54
-1.69
1.81
-1.61
2.75
-1.84
-1.68
1.90
1.56
-2.25
1.59
1.66
1.61
2.02
2.06
1.87
1.68
1.64
2.59
-2.22
-2.02
-1.75
2.21
-1.58
-1.54
Name
Protein ID
NCBI nr db
carba moyl -phosphate synthetase 1
carba moyl -phosphate synthetase 1
carba moyl -phosphate synthetase 1
pyruvate carboxyl ase
pyruvate carboxyl ase
ornithine transcarbamyl ase
sim il ar to elongation factor 2
Form yl transferase
Form yl transferase
ubiqui li n 1/serine protei nase i nhibitor
esterase 31 + carboxylesterase 2
Liver ca rboxylesterase pre cursor
T-complex protei n 1
3-hydroxy-3-m ethylgl utaryl-Coenzyme A synthase 1
sel enium binding protei n 2
3-hydroxy-3-m ethylgl utaryl-Coenzyme A synthase 2
3-hydroxy-3-m ethylgl utaryl-Coenzyme A synthase 2
methi onine adenosyl transferase I
methi onine adenosyl transferase I
3-hydroxy-3-methyl glutaryl-Coenzyme A synthase 2
gamm a-actin
cathepsin D
farnesyl diphospha te synthetase
hepatoma deri ved growth factor
nudix
thi oethe r S-methyltransferase
thioether S-m ethyl transferase/IPP isom erase 1
peroxiredoxi n 4/IPP isom erase 1
Maj or urina ry protei ns 11 and 8
Maj or urina ry protei ns 11 and 8
8393186
23621369
8393186
7438124
7438124
762985
26328763
25050159
25050159
20072434/ 15079234
20886287/ 19527178
2494382
22654291
20988709
9507079
12836439
20965433
19526790
19526790
12836371
20885782
26354406
19882207
31560691
12847124
6678281
6678281/ 13878548
7948999/ 13878548
127531
127531
* Value above p = 0.01. The identity was, however, confirmed by CAF labeling and MS/MS respectively.
an
11-0004-19 AA, 2004-03 • p5
Student's
t-test (p =)
3.70 × 10⁻⁷
9.00 × 10⁻⁸
1.30 × 10⁻⁸
1.10 × 10⁻⁸
1.40 × 10⁻⁶
9.50 × 10⁻⁸
1.20 × 10⁻⁵
9.40 × 10⁻⁶
2.50 × 10⁻¹⁰
0. 0073
6.90 × 10⁻¹⁰
3.10 × 10⁻⁸
3.40 × 10⁻⁶
4.70 × 10⁻⁵
3.40 × 10⁻¹⁰
0. 0025
5.30 × 10⁻⁶
1.70 × 10⁻⁶
8.10 × 10⁻¹⁰
2.80 × 10⁻⁶
0.064*
3.80 × 10-6
3.00 × 10⁻⁶
0.1*
9.80 × 10-9
1.60 × 10⁻¹⁰
2.40 × 10⁻⁸
7.00 × 10⁻⁹
5.40 × 10⁻⁷
0. 0022
pI theoreti cal
Mol.
weight
6.33
6.03
6.19
6.34
6.34
7.25
6.31
5.64
5.64
4.73
5.86
5.88
5.97
5.65
5.78
8.65
8.65
5.51
5.51
7.56
5.14
6.85
5.48
4.52
5.97
6
5.82
6.34
4.85
4.85
164580
116816
116273
129777
129777
108595
95257
99064
99064
74813
72638
60406
57477
57569
52628
56823
56823
43509
43509
56221
50041
48374
40582
40202
24603
29460
23239
22078
17560
17560
Automated spot handling
Conclusions
We have investigated the suitability of a highly automated
proteomics approach to identify differential expression levels
of proteins indicated in ADME/Tox processes. Such
information should lead to the discovery of useable
biomarkers signaling drug toxicity, which would exclude the
candidate drug from further development.
This study showed the value of combining products from
the Ettan range for sample preparation, differential gel
electrophoresis by 2-D DIGE, automatic spot handling, and
finally the identification of proteins by a combination of
MALDI-ToF PMF, MALDI-ToF PSD of CAF-labeled
peptides, and LC-MS/MS.
Ettan Spot Handling Workstation played a central role in the
overall investigation. The picklist generated by DeCyder
Differential Analysis Software allowed automatic processing
of all selected protein spots and made them ready for
analysis by MS techniques. All proteins regulated following
treatment with the candidate drug were thus successfully
detected, selected, prepared, and identified in a smooth,
accurate, and highly efficient manner.
xenobiotic metabolism of drugs, as well as proteins that
might be of importance in toxicity.
Further work using narrower and more basic IPG strips to
resolve more proteins on 2-D gels is under way. In addition,
a focused study on proteins obtained by subcellular
fractionation could prove to be very fruitful for further
identification of proteins involved in metabolism and
toxicity in the liver following administration of drugs.
Greater understanding of these processes might significantly
improve ADME/Tox investigations during drug discovery
campaigns.
References
1.
Hodgson, J. ADMET – turning chemicals into drugs. Nature Biotechnology 19, 722–726
(2001).
2.
Ettan DIGE User Manual, Amersham Biosciences 18-1164-40, edition AA, rat liver
protocol p. 299 (2001).
3.
Ettan DIGE User Manual, Amersham Biosciences 18-1164-40, edition AA, p. 39–40
(2001).
4.
Ettan DIGE User Manual, Amersham Biosciences 18-1164-40, edition AA, p. 94
(2001).
5.
Ettan DIGE User Manual, Amersham Biosciences 18-1164-40, edition AA, p. 59–64
(2001).
The identified proteins were grouped in different functional
categories and included proteins that may be involved in the
to order:
CAF, Cy, CyDye, DeCyder, DeStreak, Ettan, Immobiline, and Typhoon are trademarks of Amersham Biosciences Limited. Amersham and Amersham Biosciences are trademarks of Amersham plc. 2-D Fluorescence
Difference Gel Electrophoresis (2-D DIGE) technology is covered by US patent numbers US6,043,025 and US6,127,134 and foreign equivalents and exclusively licensed to Amersham Biosciences. CyDye: This product
or portions thereof is manufactured under licence from Carnegie Mellon University under patent number 5268486 and other patents pending. Some of these products may only be available to collaborators and customers
within certain of our technology access programmes. The purchase of CyDye Fluors includes a limited license to use the CyDye Fluors for internal research and development, but not for any commercial purposes. A
license to use CyDye Fluors for commercial purposes is subject to a separate license agreement with Amersham Biosciences. Finnigan, LCQ, LTQ, ProteomeX, SEQUEST, data dependent acquistion, and dynamic
exclusion are trademarks of the Thermo Electron Corporation. SYPRO is a trademark of Molecular Probes Inc. Patent information: Chemically Assisted Fragmentation (CAF) is protected by patent application WO 00/
43792 with foreign equivalents, as licensed from the Procter & Gamble Company to Amersham Biosciences AB, as well as WO 02/095412 and WO 02/095419, both co-owned by the Procter & Gamble Company and
Amersham Biosciences AB. The purchase of Ettan CAF MALDI Sequencing Kit includes a limited license to use the technology for research internal research and development, but not for any commercial purposes.
No right to perform or offer commercial services or products of any kind using the Sequencing Kit is hereby granted. A license to use the technology for commercial purposes is subject to a separate license agreement
with Amersham Biosciences AB. Amersham Biosciences AB Björkgatan 30, SE-751 84 Uppsala, Sweden. Amersham Biosciences UK limited Amersham Place, Little Chalfont, Buckinghamshire HP7 9NA, England.
Amersham Biosciences Corporation 800 Centennial Avenue, PO Box 1327, Piscataway, NJ 08855 USA. Amersham Biosciences Europe GmbH Munzinger Strasse 9, D-79111 Freiburg, Germany. Amersham Biosciences
KK Sanken Building, 3-25-1, Hyakunincho, Shinjuku-ku, Tokyo 169-0073, Japan. All goods and services are sold subject to the terms and conditions of sale of the company within the Amersham Biosciences group
that supplies them. A copy of these terms and conditions is available on request. © Amersham Biosciences AB 2004 – All rights reserved.
an
11-0004-19 AA, 2004-03 • p6
Produced by Wikströms, Sweden 1040029, 03.2004
Printed matter. Licence 341 051
Asia Pacific Tel: +852 2811 8693 Fax: +852 2811 5251 Australia Tel: +61 2 9899 0999 Fax: +61 2 9899 7511 Austria Tel: 01 57 606 16 19 Fax 01 57 606 16 27 Belgium Tel: 0800 73 888 Fax: 03 272 1637
Canada Tel: 1 800 463 5800 Fax: 1 800 567 1008 Central, East, South East Europe Tel: +43 1 982 3826 Fax: +43 1 985 8327 Denmark Tel: 45 16 2400 Fax: 45 16 2424 Finland & Baltics Tel: +358 (0)9 512 3940
Fax: +358-(0)9-512 39439 France Tel: 0169 35 67 00 Fax: 0169 41 9677 Germany Tel: 0761 4903 490 Fax: 0761 4903 405 Italy Tel: 02 27322 1 Fax: 02 27302 212 Japan Tel: 81 3 5331 9336 Fax: 81 3 5331 9370
Latin America Tel: +55 11 3933 7300 Fax: +55 11 3933 7304 Middle East Tel: +30 2 10 96 00 687 Fax: +30 2 10 96 00 693 Netherlands Tel: 0165 580 410 Fax: 0165 580 401 Norway Tel: 2318 5800
Fax: 2318 6800 Portugal Tel: 21 417 7035 Fax: 21 417 3184 Russia & other C.I.S. & N.I.S. Tel: +7 (095) 232 0250,956 1137 Fax: +7 (095) 230 6377 South East Asia Tel: 60 3 8024 2080 Fax: 60 3 8024 2090
Spain Tel: 93 594 49 50 Fax: 93 594 49 55 Sweden Tel: 018 612 19 00 Fax: 018 612 19 10 Switzerland Tel: 0848 8028 12 Fax 0848 8028 13 UK Tel: 0800 616 928 Fax: 0800 616 927 USA Tel: +1 800 526 3593
Fax: +1 877 295 8102